Increased mTOR activity and metabolic efficiency in mouse and human cells containing the African-centric tumor-predisposing p53 variant Pro47Ser
- Program in Molecular and Cellular Oncogenesis, The Wistar Institute, United States
- Graduate Group in Biochemistry and Molecular Biophysics, Perelman School of Medicine, University of Pennsylvania, United States
- Department of Genetics, Perelman School of Medicine, University of Pennsylvania, United States
- Department of Cancer Biology, Perelman School of Medicine, University of Pennsylvania, United States
- Department of Physiology and Institute for Diabetes, Obesity, and Metabolism, Perelman School of Medicine, University of Pennsylvania, United States
- Washington University in St. Louis, United States
- Division of Endocrinology, Diabetes & Metabolism, Johns Hopkins University School of Medicine, United States
Figures
Figure 1 with 1 supplement
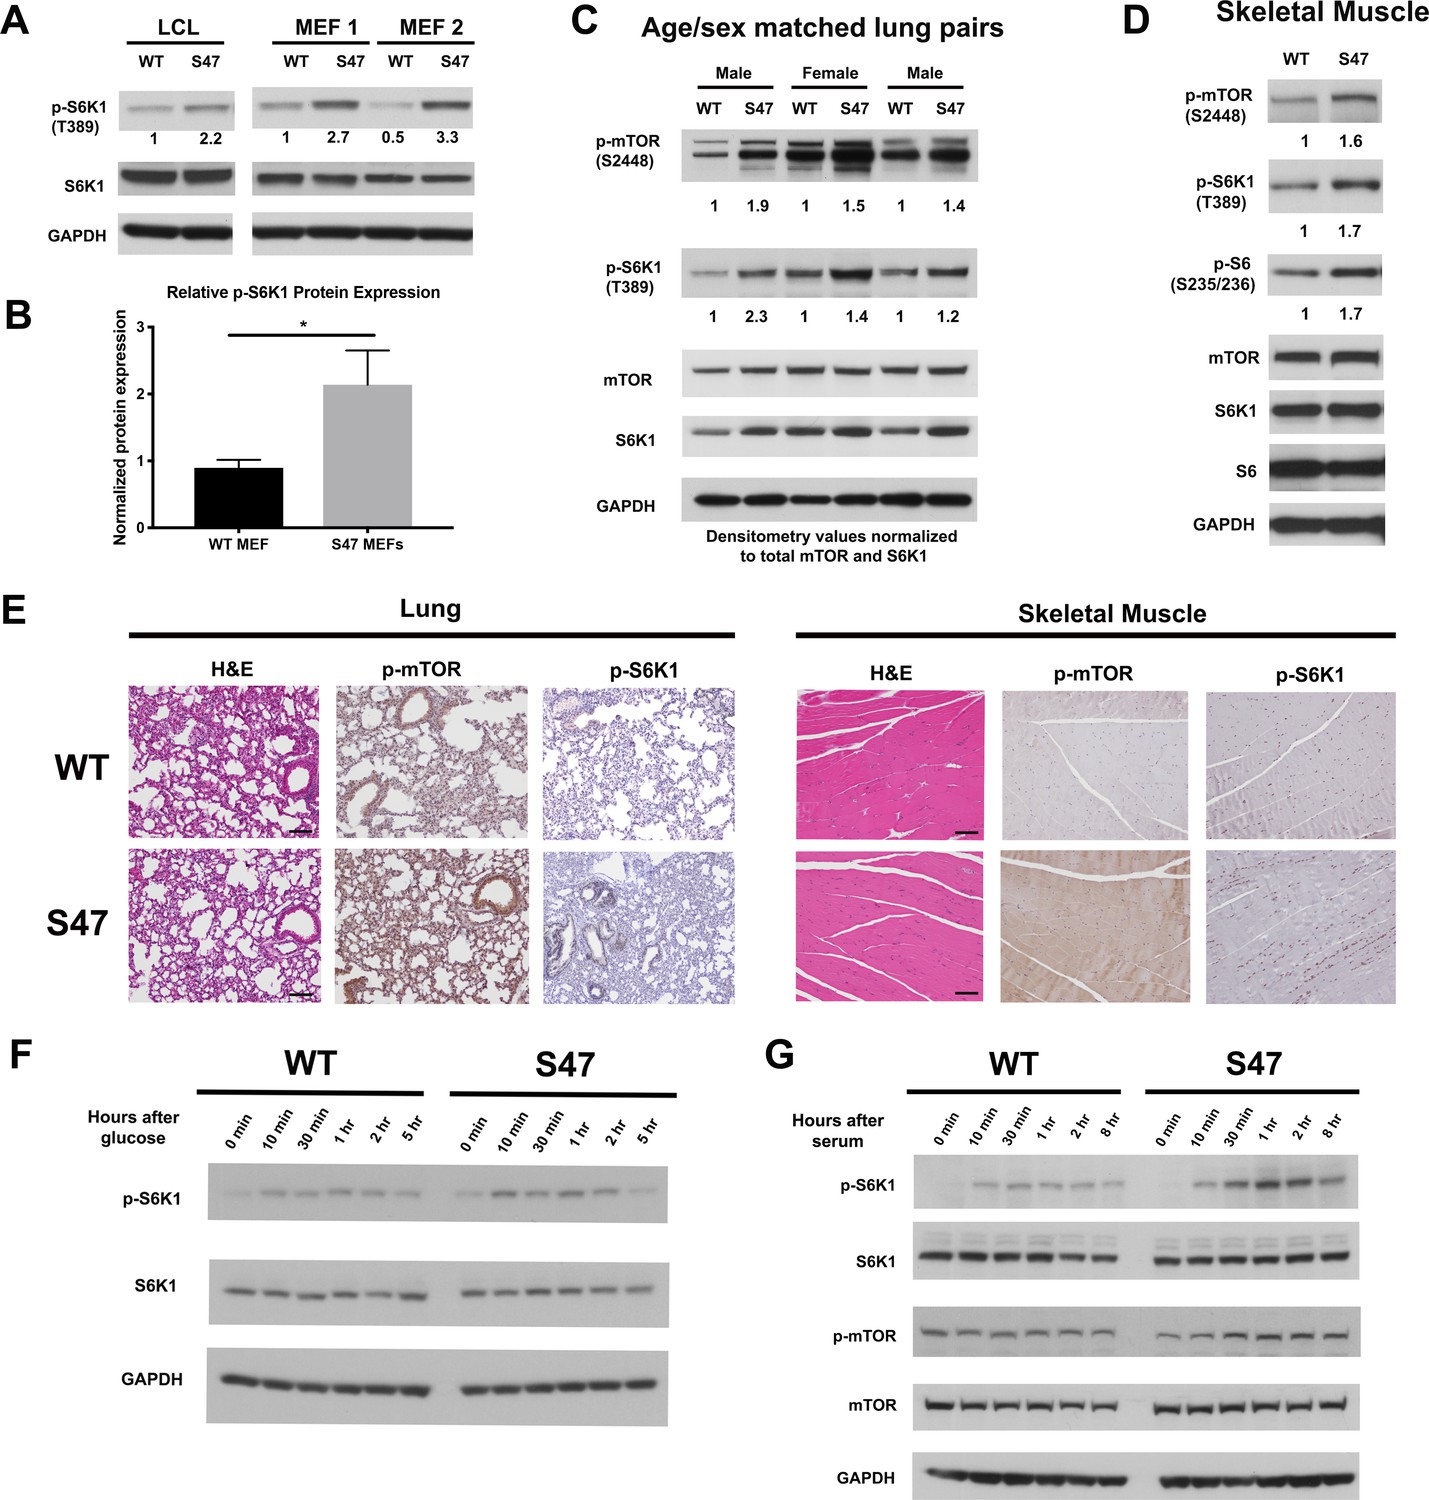
Increased markers of mTOR activity in S47 cells and tissues.
(A) Western blot analyses reveal higher phospho-S6K1 expression in S47 LCLs and S47 MEFs; the latter were obtained from two separate embryos per genotype. (B) Densitometry quantification of phospho-S6K1 protein expression in WT and S47 MEFs from four independent experiments; all values normalized to total S6K1. Error bars represent standard error, (*) p value < 0.05. (C) Whole cell lysates were extracted from three WT and three S47 mouse lungs and analyzed by western blot for the proteins indicated. Pairs 1 and 3 are lungs isolated from male mice, pair 2 is lungs isolated from female mice. Densitometry quantification of phospho-S6K1 and phospho-mTOR was performed and normalized to total S6K1 and total mTOR protein expression, respectively. (D) Whole cell lysates were extracted from WT and S47 mouse skeletal muscle and analyzed as described above. Densitometry quantification of phospho-S6, phospho-S6K1, phospho-mTOR was performed and normalized to total S6, total S6K1 and total mTOR protein expression, respectively. (E) Immunohistochemical analysis of hematoxylin and eosin (H and E), phospho-mTOR and phospho-S6K1 in WT and S47 mouse lung and skeletal tissue. Data are representative of n = 4 mice per genotype. Scale bar represents 100 μm. (F) WT and S47 MEFs were grown in glucose-free media for 16 hr, then in media containing 4.5 g/L glucose. Samples were collected at indicated time points and analyzed by western blot for p-S6K1, total S6K1, and GAPDH. (G) WT and S47 MEFs were cultured in media containing 0.1% FBS for 16 hr, followed by media containing 10% serum and samples were collected at indicated time points. Cell lysates were extracted from samples and subjected to western blot analysis for the proteins indicated.
Figure 1—figure supplement 1
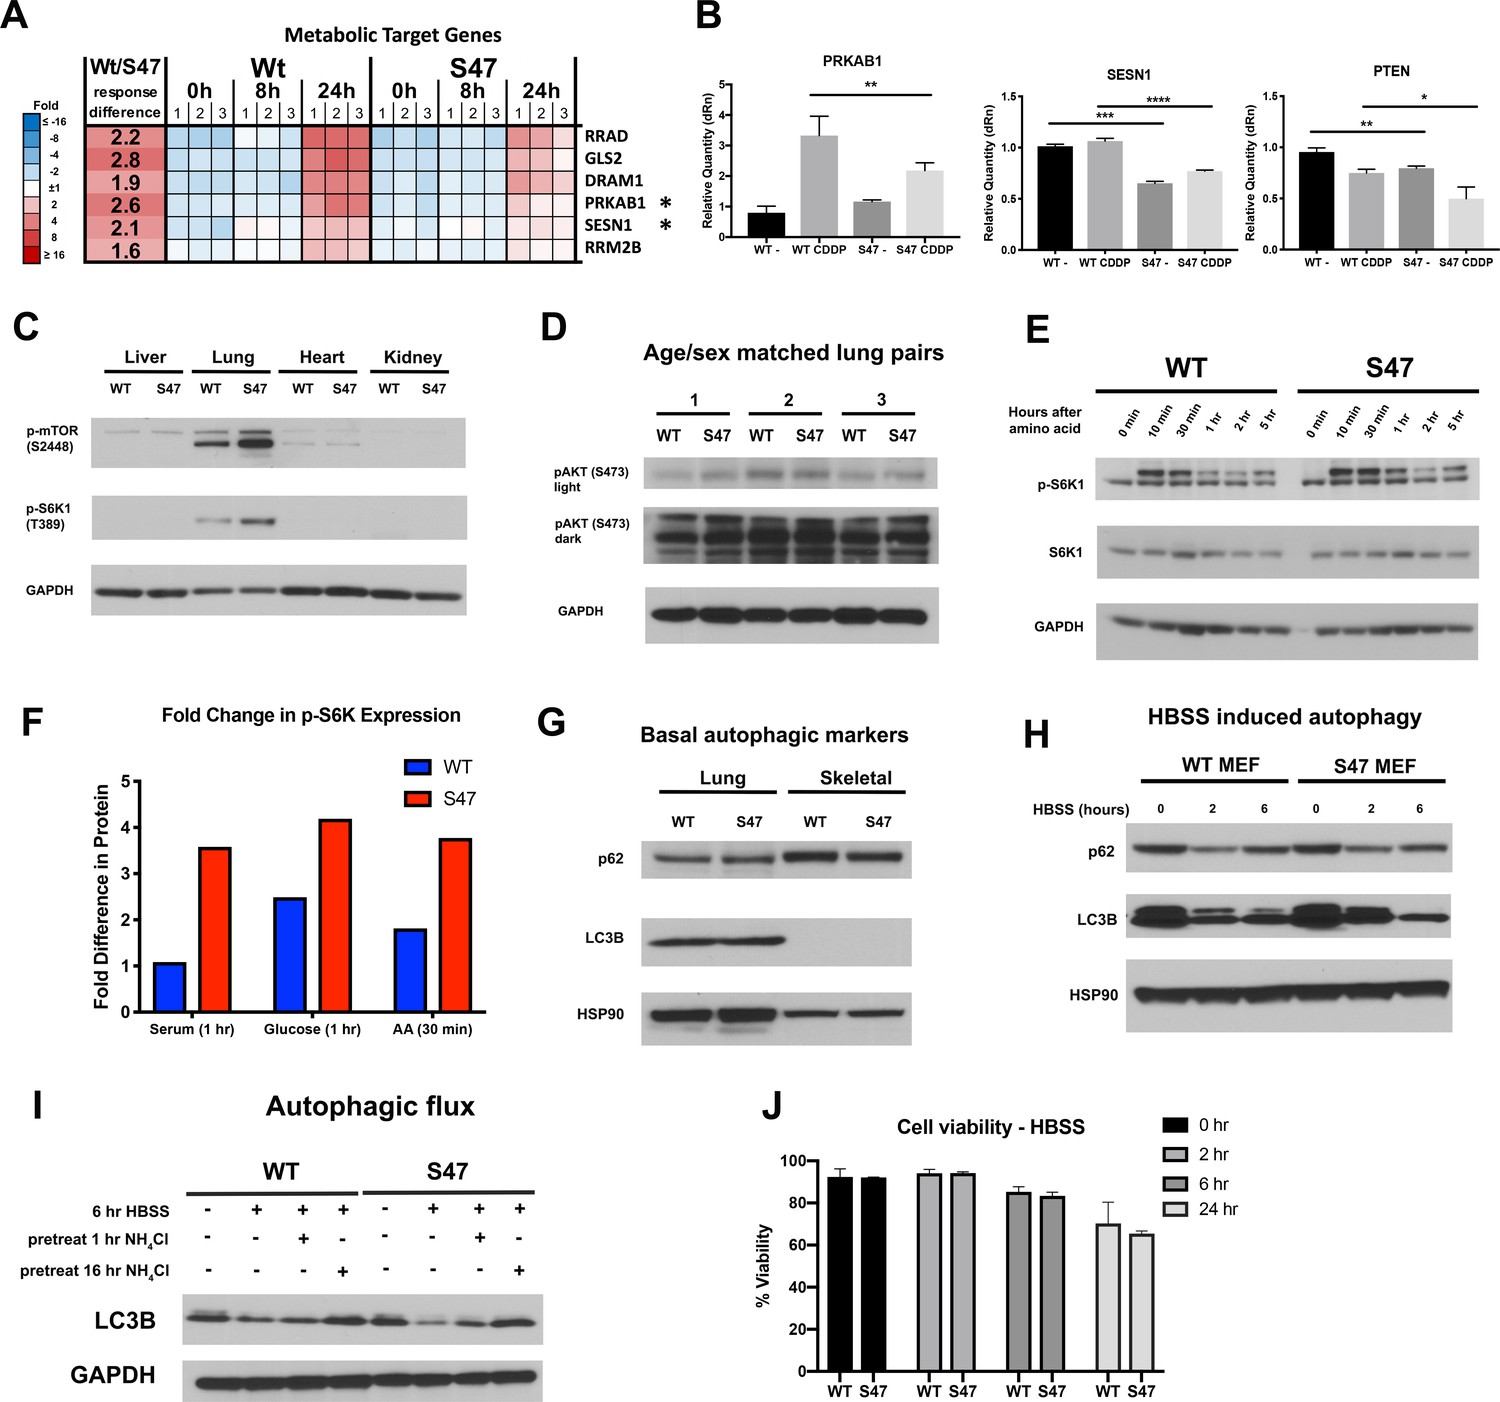
Altered metabolic markers in S47 cells and tissues.
(A) Heat amp of microarray analysis of WT and S47 LCLs treated with 10 μM cisplatin for 0, 8, and 24 hr reveal several metabolism genes as differentially expressed. * regulators of mTOR (B) qRT-PCR analysis of PRKAB1, SESN1 and PTEN in human LCLs treated with 10 µM cisplatin for 24 hr. All values were normalized to a control gene (18S); n = 4, error bars indicate standard deviation. (*) p-value<0.05, (**) p-value<0.01, (***) p-value<0.001, (****) p-value<0.0001, Student’s t-test. (C) Whole cell lysates were extracted from WT and S47 mouse liver, lung, heart, and kidney followed by western blot analysis for the proteins indicated. (D) Whole cell lysates were extracted from three WT and three S47 mouse lungs and analyzed by western blot for the phospho-Akt and GAPDH (loading control). Light and dark exposures are shown. (E) WT and S47 MEFs were starved in amino acid free media for 4 hr, then media containing amino acids was re-introduced and samples were collected at indicated time points. Cell lysates were extracted from samples and subjected to western blot analysis for the proteins indicated. (F) Densitometry quantification of phospho-S6K1 protein expression in WT and S47 MEFs at 1-hr time point for serum and glucose starvation, 30-min time point for amino acid starvation; all values normalized to total S6K1. Densitometry values are averaged from a minimum of two independent experiments. (G) Whole cell lysates were extracted from WT and S47 mouse lung and skeletal tissue and were subjected to western blot analysis, probing for p62, LC3B, and HSP90 (loading control). (H) WT and S47 MEFs were treated with HBSS for 0, 2, and 6 hr and were subjected to western blot analysis for the indicated proteins. (I) Autophagic flux was measured in WT and S47 MEFs pretreated with NH4Cl for indicated time points, followed by HBSS treatment for 6 hr. Cell lysates were subjected to western blot analysis and immunoblotted for LC3B and GAPDH (loading control). (J) WT and S47 MEFs were treated with HBSS for indicated time points and were subjected to viability analysis using Trypan Blue; n = 3, error bars indicate standard deviation.
Figure 2 with 1 supplement

Increased metabolism in S47 cells compared to WT cells.
(A) Oxygen consumption rates (OCR) in WT and S47 LCLs were assessed using the Seahorse XF Mito Stress Test. OCR was measured first in basal conditions, and following injection of oligomycin, FCCP and rotenone/antimycin. The bar graph depicts maximal OCR after FCCP injection at ~40 min timepoint; data are representative of three independent experiments performed with at least six technical replicates, presented as mean ± SD. (B–C) Basal and compensatory glycolysis in WT and S47 LCLs (B) and MEFs (C) were assessed using the Seahorse Glycolytic Rate Assay. Basal glycolysis is first measured, followed by treatment of cells with rotenone/antimycin and 2-deoxy-D-glucose (2-DG). The bar graph depicts basal glycolysis at ~1 min timepoint and compensatory glycolysis after antimycin/rotenone injection at ~22 min timepoint; data are representative of three independent experiments performed with at least 10 technical replicates. Bar graphs are presented as mean ± SD. (D–E) Consumption of glucose and glutamine from media and production of lactate and glutamate were analyzed from homozygous WT, heterozygous WT/S47 and homozygous S47 human LCLs (D) and primary MEFs (E) using a YSI-7100 Bioanalyzer. Means and SEM are shown (n = 5).
Figure 2—figure supplement 1
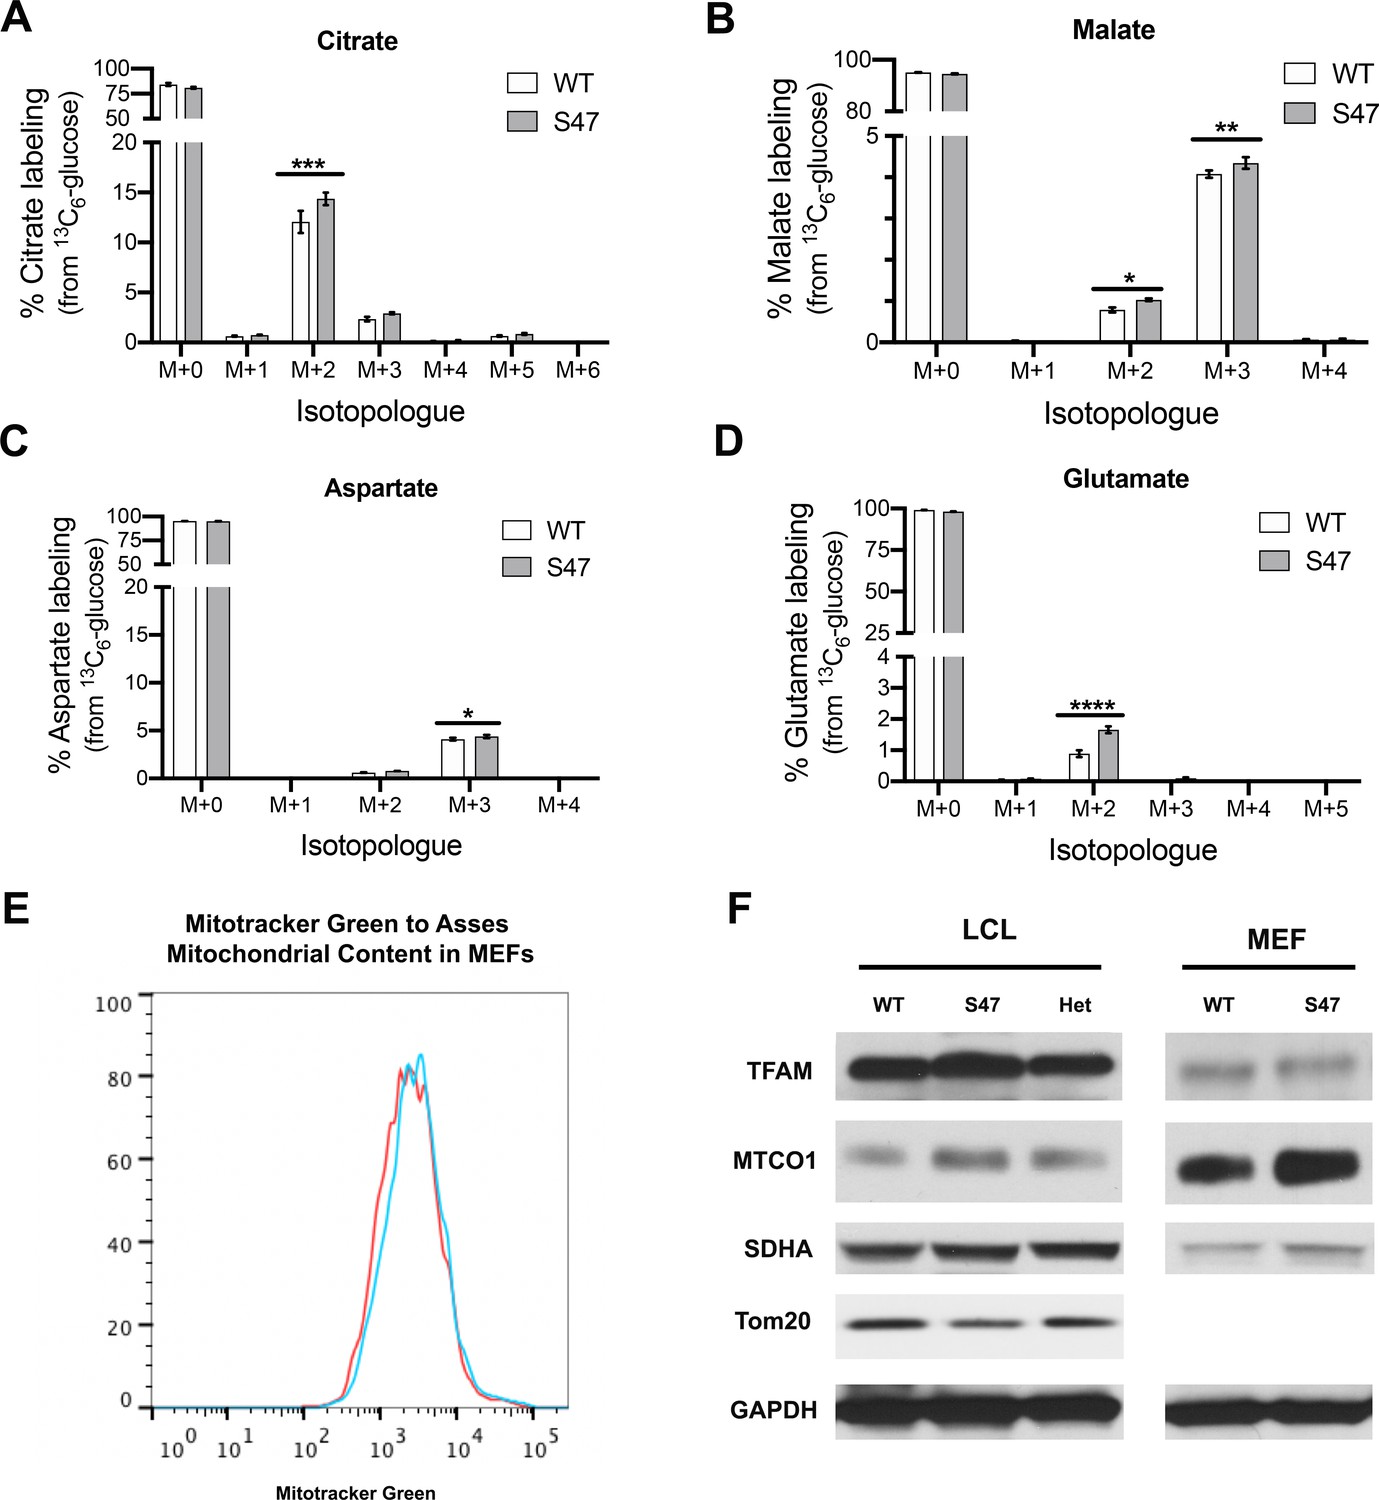
Increased metabolism in S47 MEFs but no differences in mitochondrial content in WT and S47 cells.
(A–D) WT and S47 MEFs were incubated with 25 mM 13C-glucose for 15 min and the abundance of citrate (A), malate (B), aspartate (C), and glutamate (D) isotopologues was quantified by LC-MS/MS. Data are presented as mean ± SD, n = 3; two-way ANOVA. (*) p-value<0.05, (**) p-value<0.01, (***) p-value<0.001, (****) p-value<0.0001. (E) Mitochondrial mass in WT and S47 MEFs measured by Mitotracker Green fluorescence. Data depicted are representative of three independent experiments performed in triplicate. (F) Cell lysates extracted from WT, WT/S47 (het) and S47 LCLs and WT and S47 homozygous MEFs were subjected to western blot analysis and immunoblotted for TFAM, MTCO1, SDHA, TOMM20, and GAPDH (loading control).
-
Figure 2—figure supplement 1—source data 1
Metabolomics source data.
- https://cdn.elifesciences.org/articles/55994/elife-55994-fig2-figsupp1-data1-v1.xlsx
Figure 3 with 1 supplement
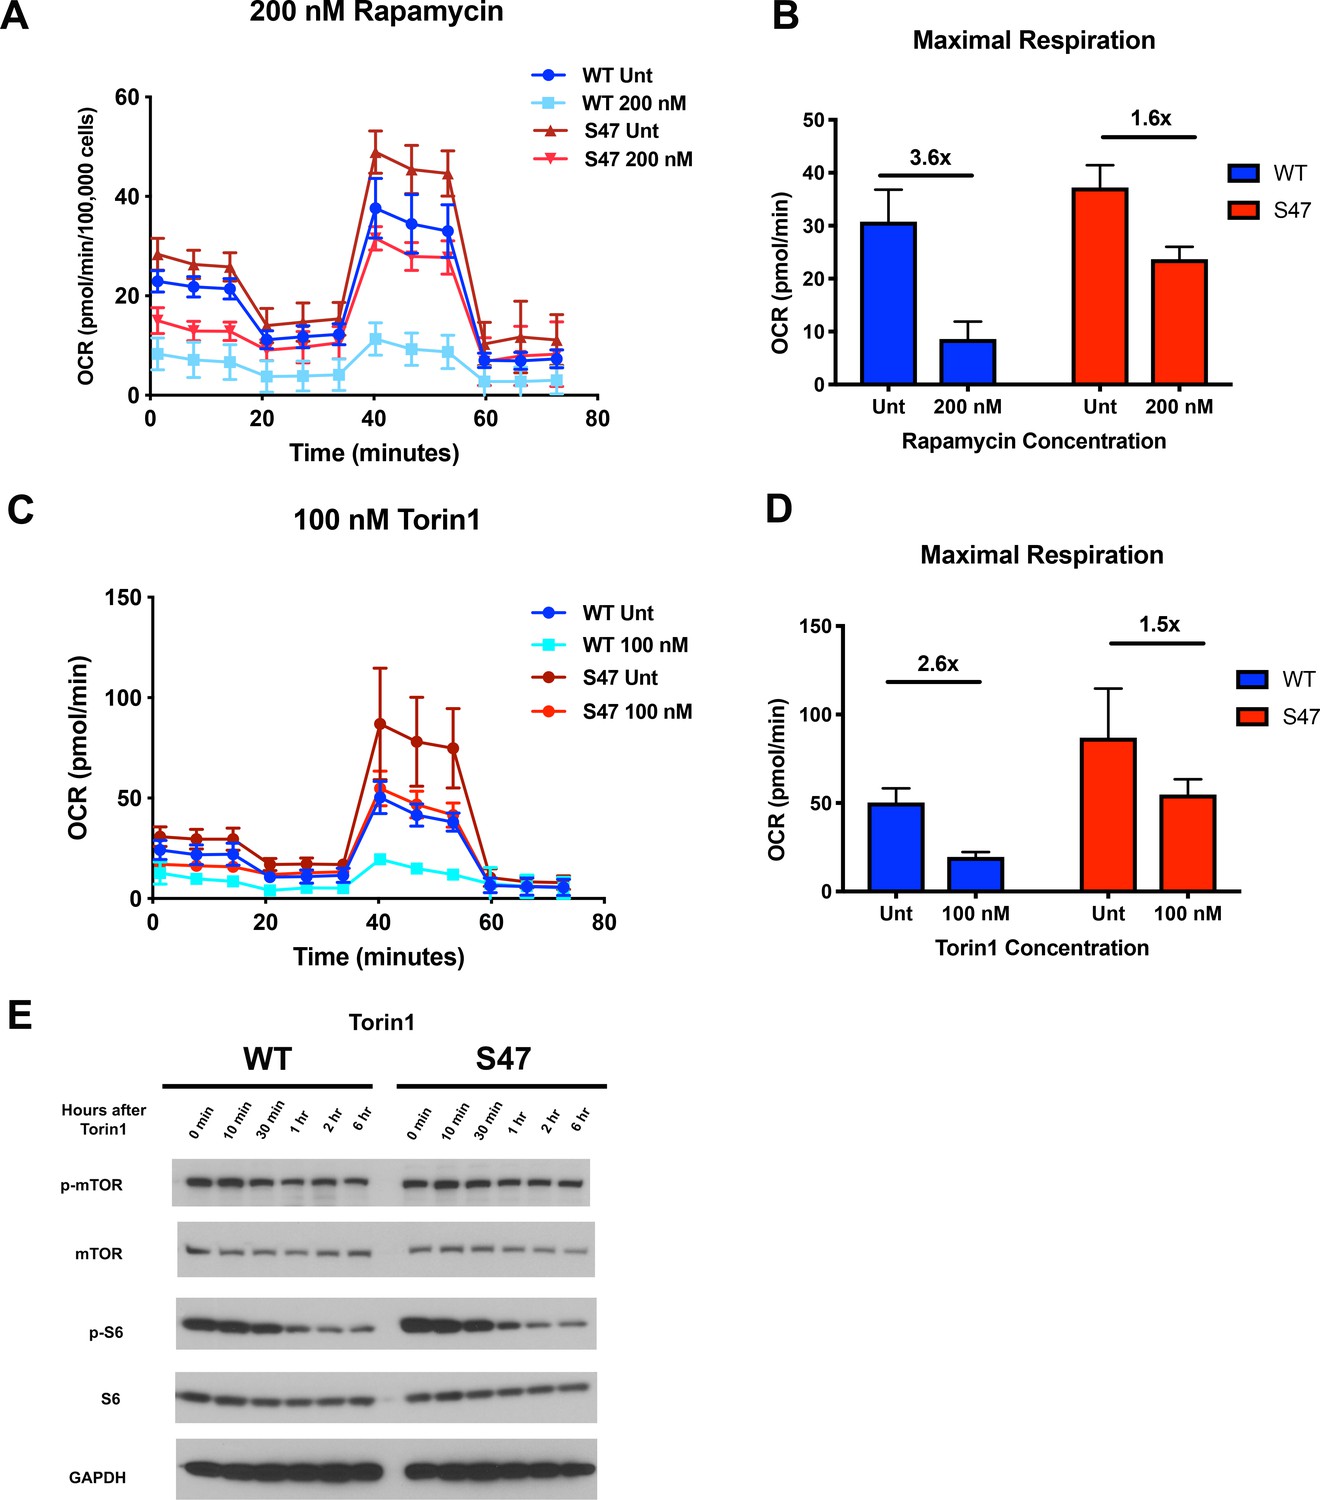
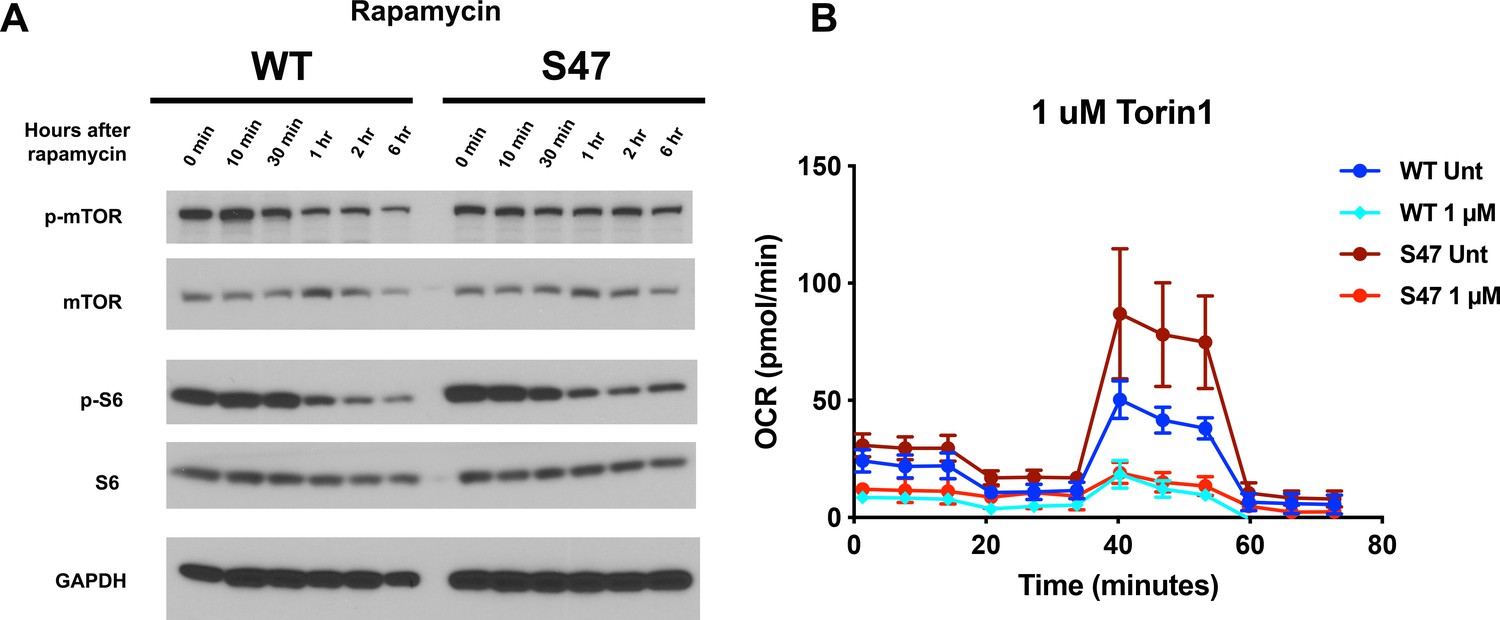
S47 mitochondria show decreased sensitivity to mTOR inhibition.
(A) Oxygen consumption rate (OCR) as measured by the Seahorse XF Mito Stress Test in WT and S47 LCLs treated with 200 nM of rapamycin for 24 hr. (B) Bar graph depicts maximal OCR after FCCP injection at ~40 min timepoint; fold changes between rapamycin treated and untreated samples are shown. Data are representative of two independent experiments performed with at least 10 technical replicates. (C) OCR as measured by the Seahorse XF Mito Stress Test in WT and S47 LCLs treated with 100 nM of Torin1 for 24 hr. (D) Bar graph depicts maximal OCR after FCCP injection at ~40 min timepoint; fold changes between Torin1 treated and untreated samples are shown. Data are representative of two independent experiments performed with at least eight technical replicates. (E) WT and S47 LCLs were treated with 100 nM of Torin1, harvested at indicated time points after treatment and analyzed for the shown mTOR markers via western blot.
Figure 3—figure supplement 1
Attenuated response to mTOR inhibition in S47 cells.
(A) WT and S47 LCLs were treated with 200 nM of rapamycin, harvested at indicated time points after treatment and analyzed for shown mTOR markers via western blot. (B) OCR as measured by the Seahorse XF Mito Stress Test in WT and S47 LCLs treated with 1 μM of Torin1 for 24 hr. Note that the untreated samples are identical to those depicted in Figure 3C, as these samples were run on the same plate.
Figure 4 with 1 supplement
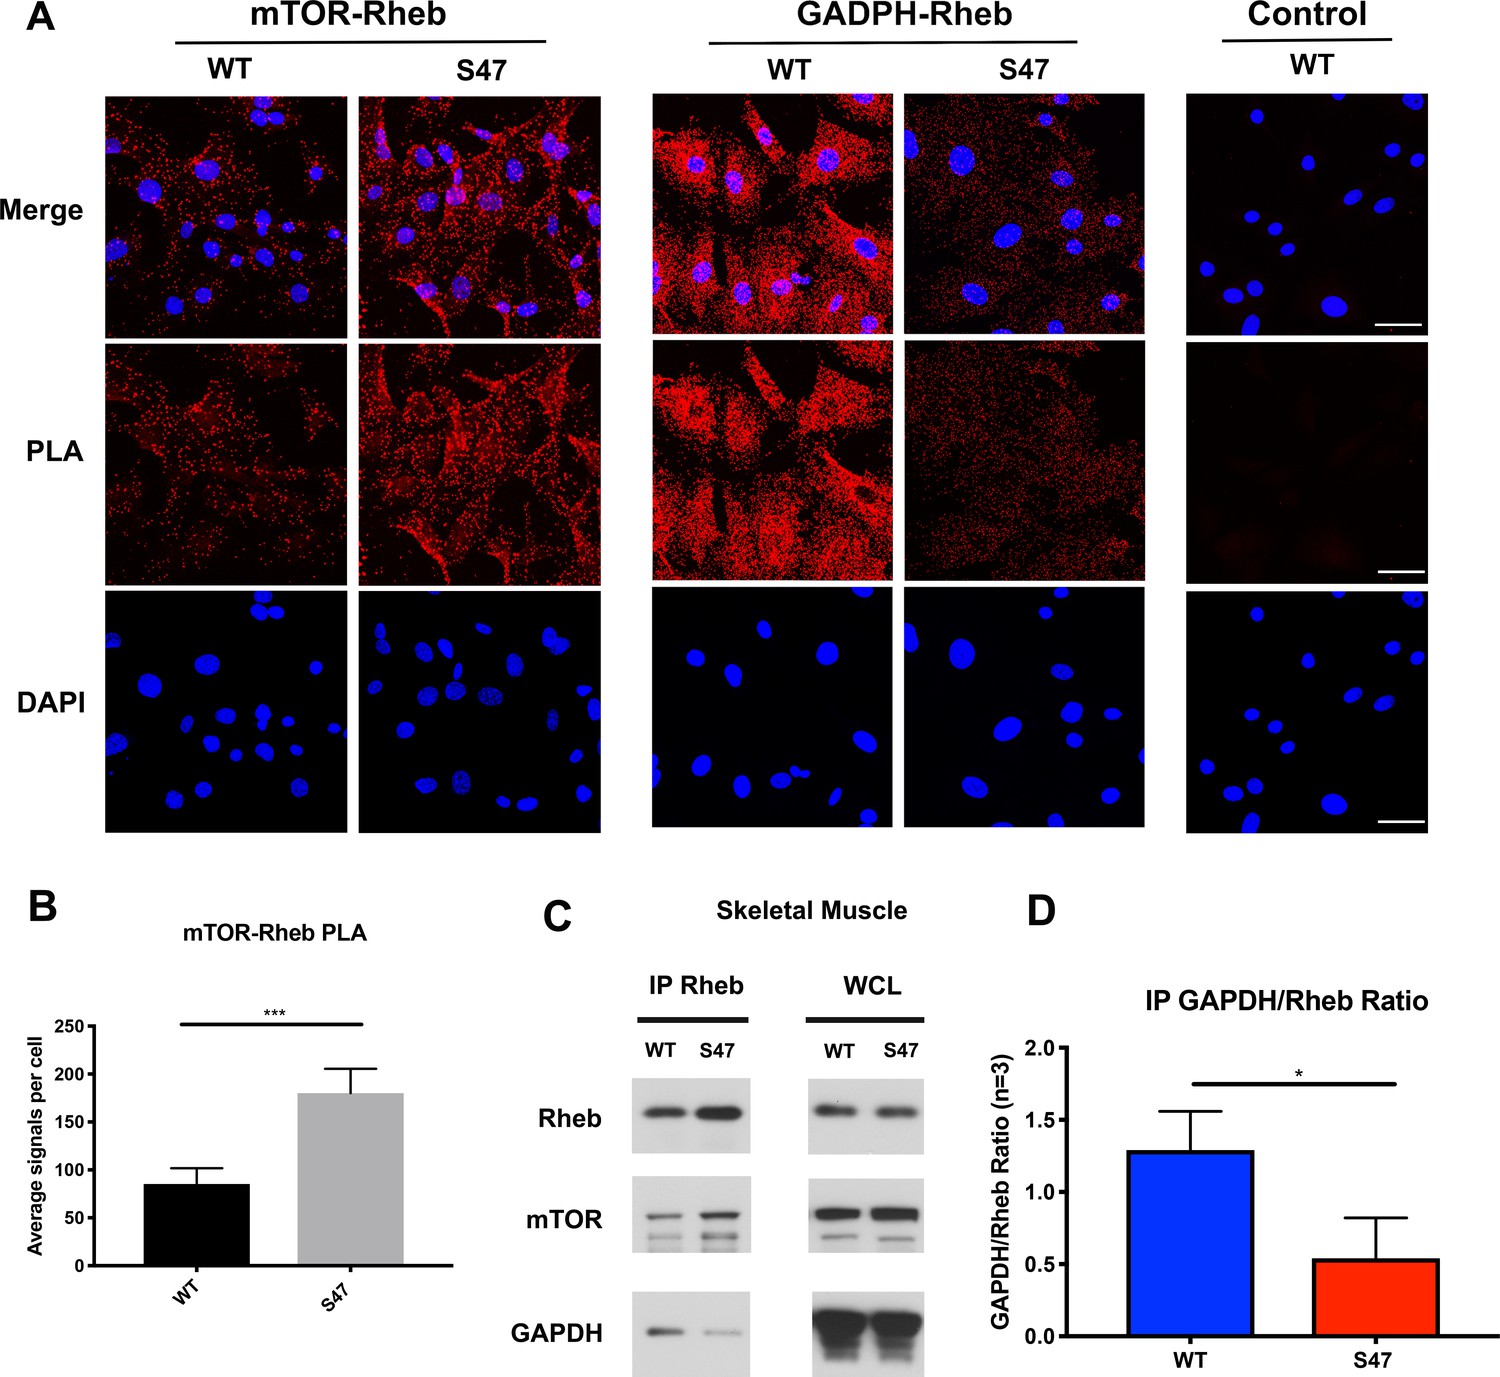
Increased mTOR-Rheb binding in S47 cells is due to decreased GAPDH-Rheb binding.
(A–B) An in situ proximity ligation assay (PLA) was performed in WT and S47 MEFs. Each red dot represents an interaction between mTOR-Rheb or GAPDH-Rheb as indicated; scale bar represents 50 μm. The samples were counterstained with DAPI to detect nuclei. Cells stained in the absence of one primary antibody were used as a negative control. (B) Quantification of the mTOR-Rheb interactions, measured as the average number of PLA signals per nuclei. Data were quantified by counting the number of cells in five random fields per experimental condition. (***) p-value<0.001, Student’s t-test. (C) Lysates extracted from WT and S47 skeletal tissue were immunoprecipitated with anti-Rheb. The amount of co-precipitating mTOR and GAPDH, as well as immunoprecipitated Rheb, were assessed by western blot. Whole cell lysate (WCL) is shown on the right. (D) Quantification of the amount of GAPDH bound to Rheb, divided by total Rheb pulled down, in WT and S47 skeletal tissue, n = 3 independent experiments, (*) p-value<0.05.
Figure 4—figure supplement 1
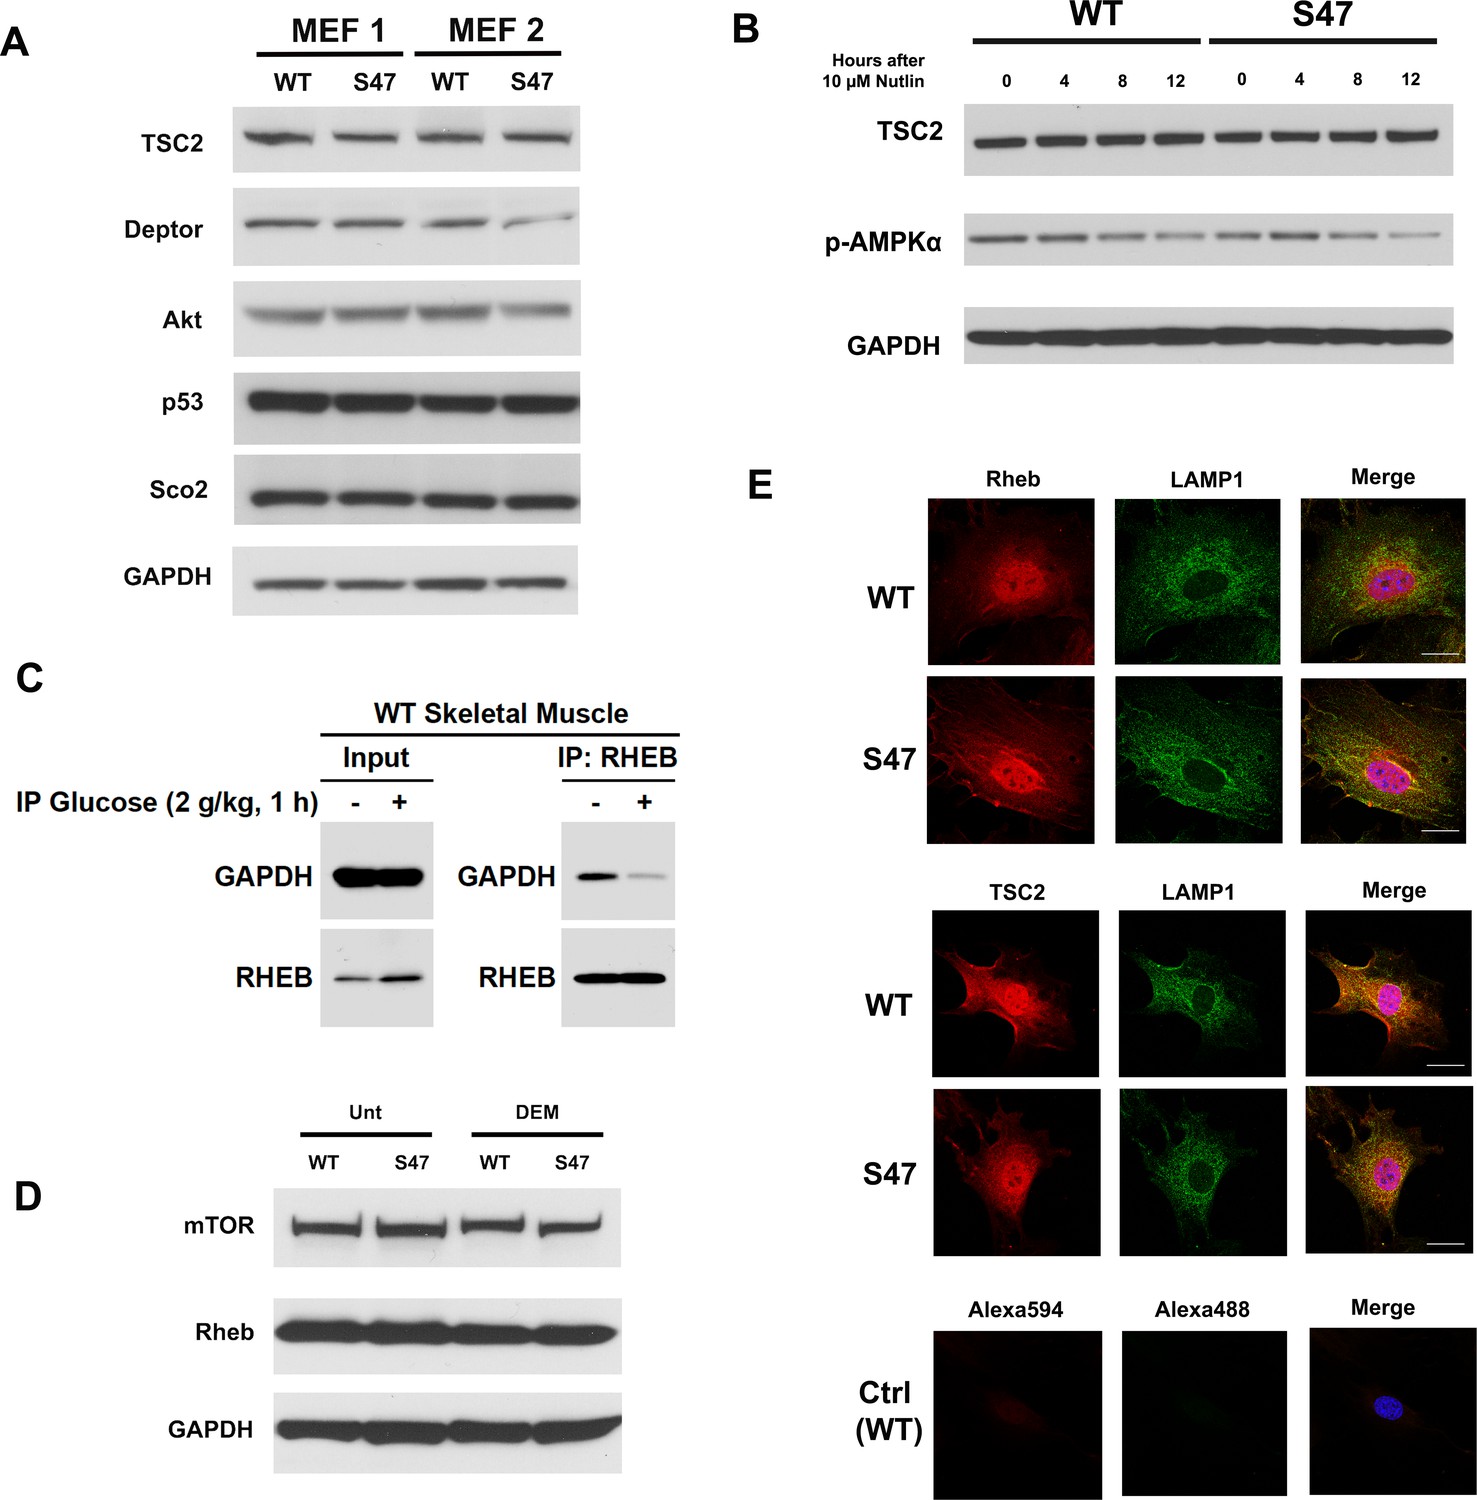
No differences in the level of mTOR regulators in WT and S47 cells.
(A) Cell lysates were extracted from two sets of WT and S47 MEFs and were analyzed by western blot for TSC2, DEPTOR, AKT, p53, Sco2 and GAPDH. (B) Cell lysates were extracted from WT and S47 MEFs treated with 10 μM Nutlin for indicated time points. TSC2, phospho-AMPKα and GAPDH were assessed by western blot. (C) Mice were fasted for 24 hr and intraperitoneally injected with saline or glucose (2 g/kg body weight). Whole cell lysates were extracted from skeletal muscles at 1 hr post-injection and subjected to western blot analysis for GAPDH and Rheb (left). The same lysates were immunoprecipitated (IP) with Rheb antibody followed by western analysis for the level of associated GAPDH and Rheb (right). (D) WT and S47 MEFs were untreated or treated with 50 μM of DEM for 5 hr. Cell lysates were subjected to western blot analysis and immunoblotted for total mTOR, Rheb, and GAPDH. (E) WT and S47 MEFs were immunostained with LAMP1 (Alexa488-green) and either TSC2 or Rheb (Alexa594-red) to determine co-localization. Nuclei are visualized with DAPI staining. Scale bars represent 30 µm.
Figure 5 with 1 supplement
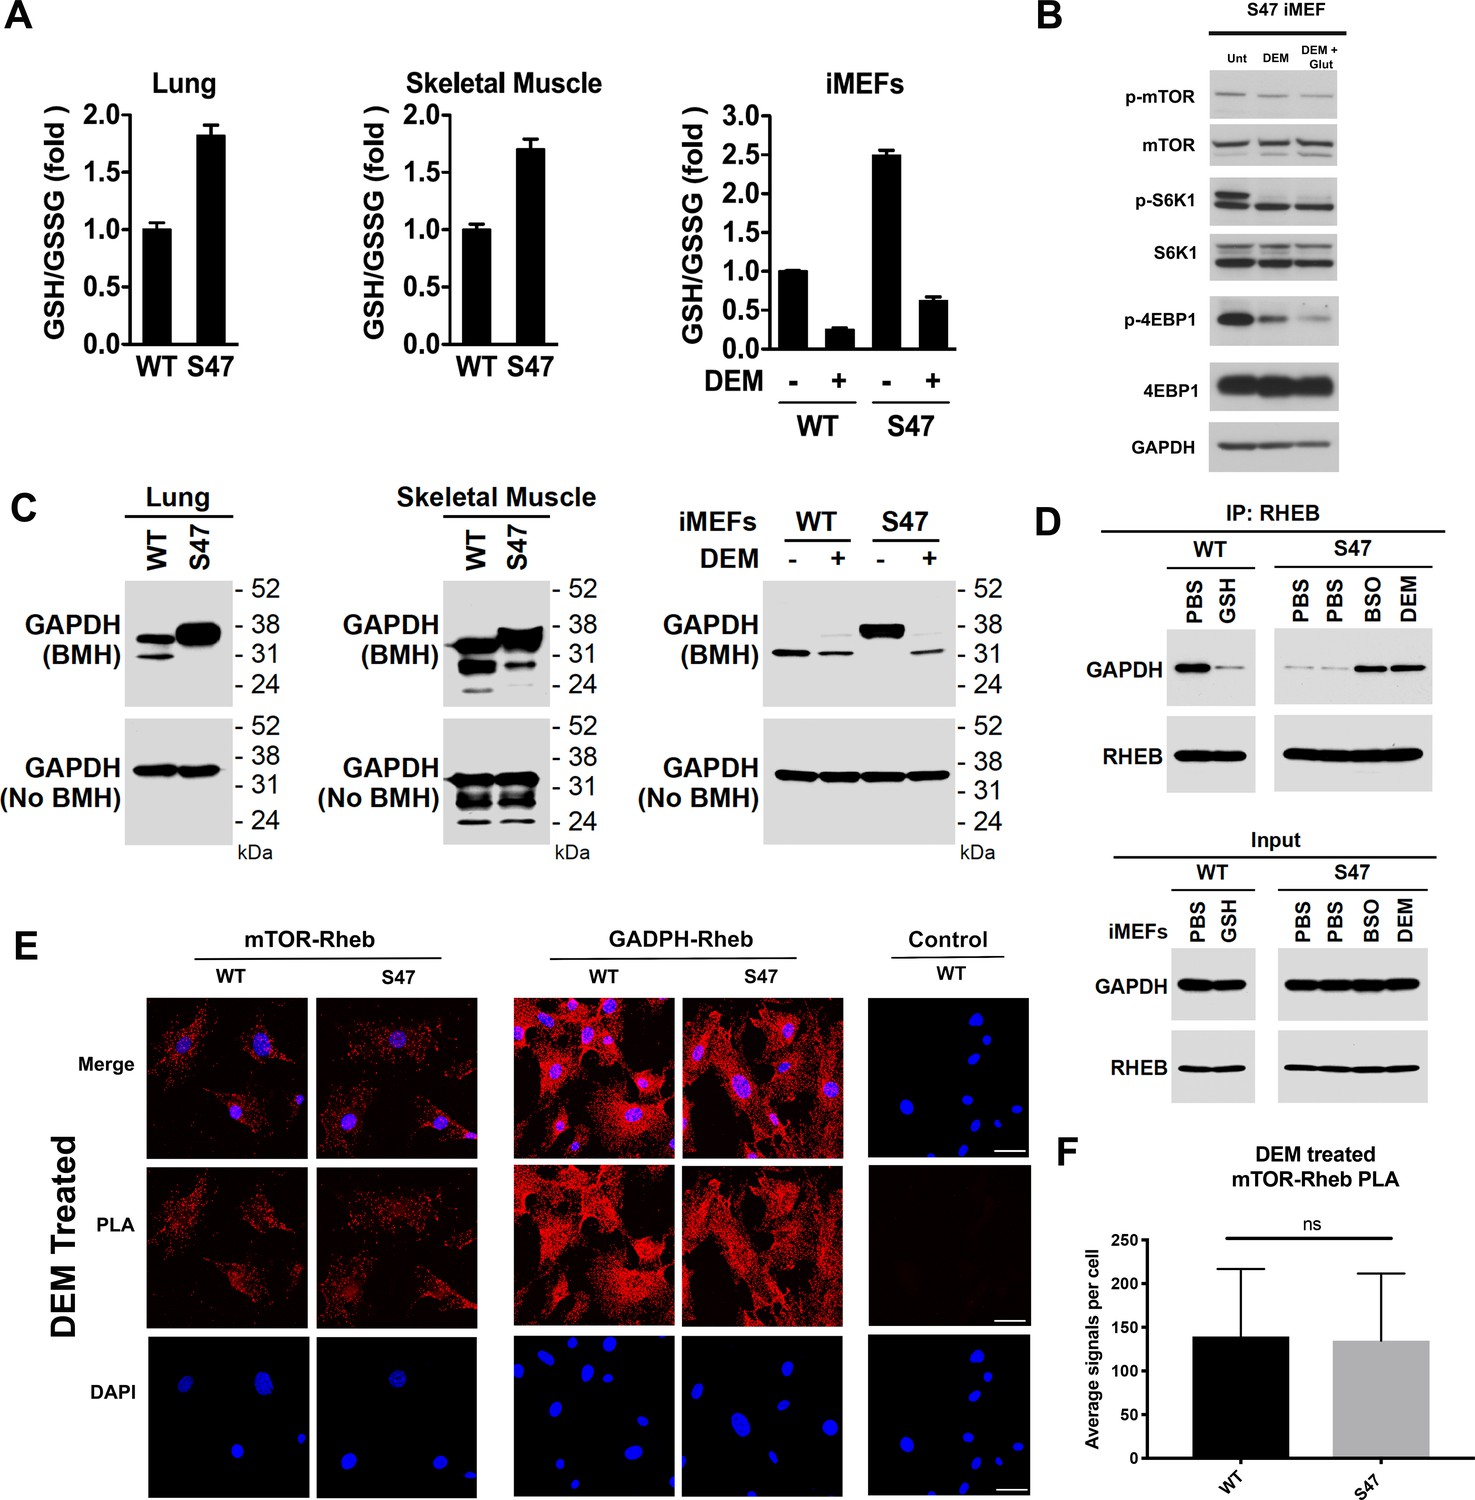
Increased glutathione drives decreased GAPDH-Rheb binding in S47 cells.
(A) WT and S47 lung (left) and skeletal muscle (center) were assessed for GSH/GSSG ratio (mean ± SD, n = 3). WT and S47 immortalized MEFs (iMEFs), either untreated or treated with 50 μM DEM for 5 hr, were analyzed for GSH/GSSG ratio (mean ± SD, n = 4). (B) WT and S47 iMEFs were untreated or treated with 50 μM of DEM or 50 μM of DEM + 0.5 mM glutamate for 5 hr and protein lysates were analyzed by western blot for indicated mTOR markers. (C) Whole cell lysates were extracted from WT and S47 mouse lung (left) and skeletal (center) tissue. Proteins were cross-linked with BMH, resolved by SDS/PAGE, and detected by western blotting with a GAPDH specific antibody (Top). Untreated protein lysates were analyzed by western blot analysis for total GAPDH (Bottom). WT and S47 iMEFs were treated with 50 μM of DEM for 5 hr and protein lysates were analyzed as described (right). (D) WT cells were treated with PBS or 3 mM GSH for 24 hr. S47 cells were treated with PBS for 24 hr, PBS for 5 hr, 100 μM BSO for 24 hr, or 50 μM DEM for 5 hr. IP of the lysates with anti-Rheb followed by western analysis for associated GAPDH and Rheb (top panel). The same lysates were analyzed by western blotting for GAPDH and Rheb (bottom panel). (E–F) Proximity ligation analysis (PLA) was performed in WT and S47 MEFs treated with 50 μM of DEM for 5 hr and analyzed as described in Figure 4A–B. Scale bar is 30 μm.
Figure 5—figure supplement 1
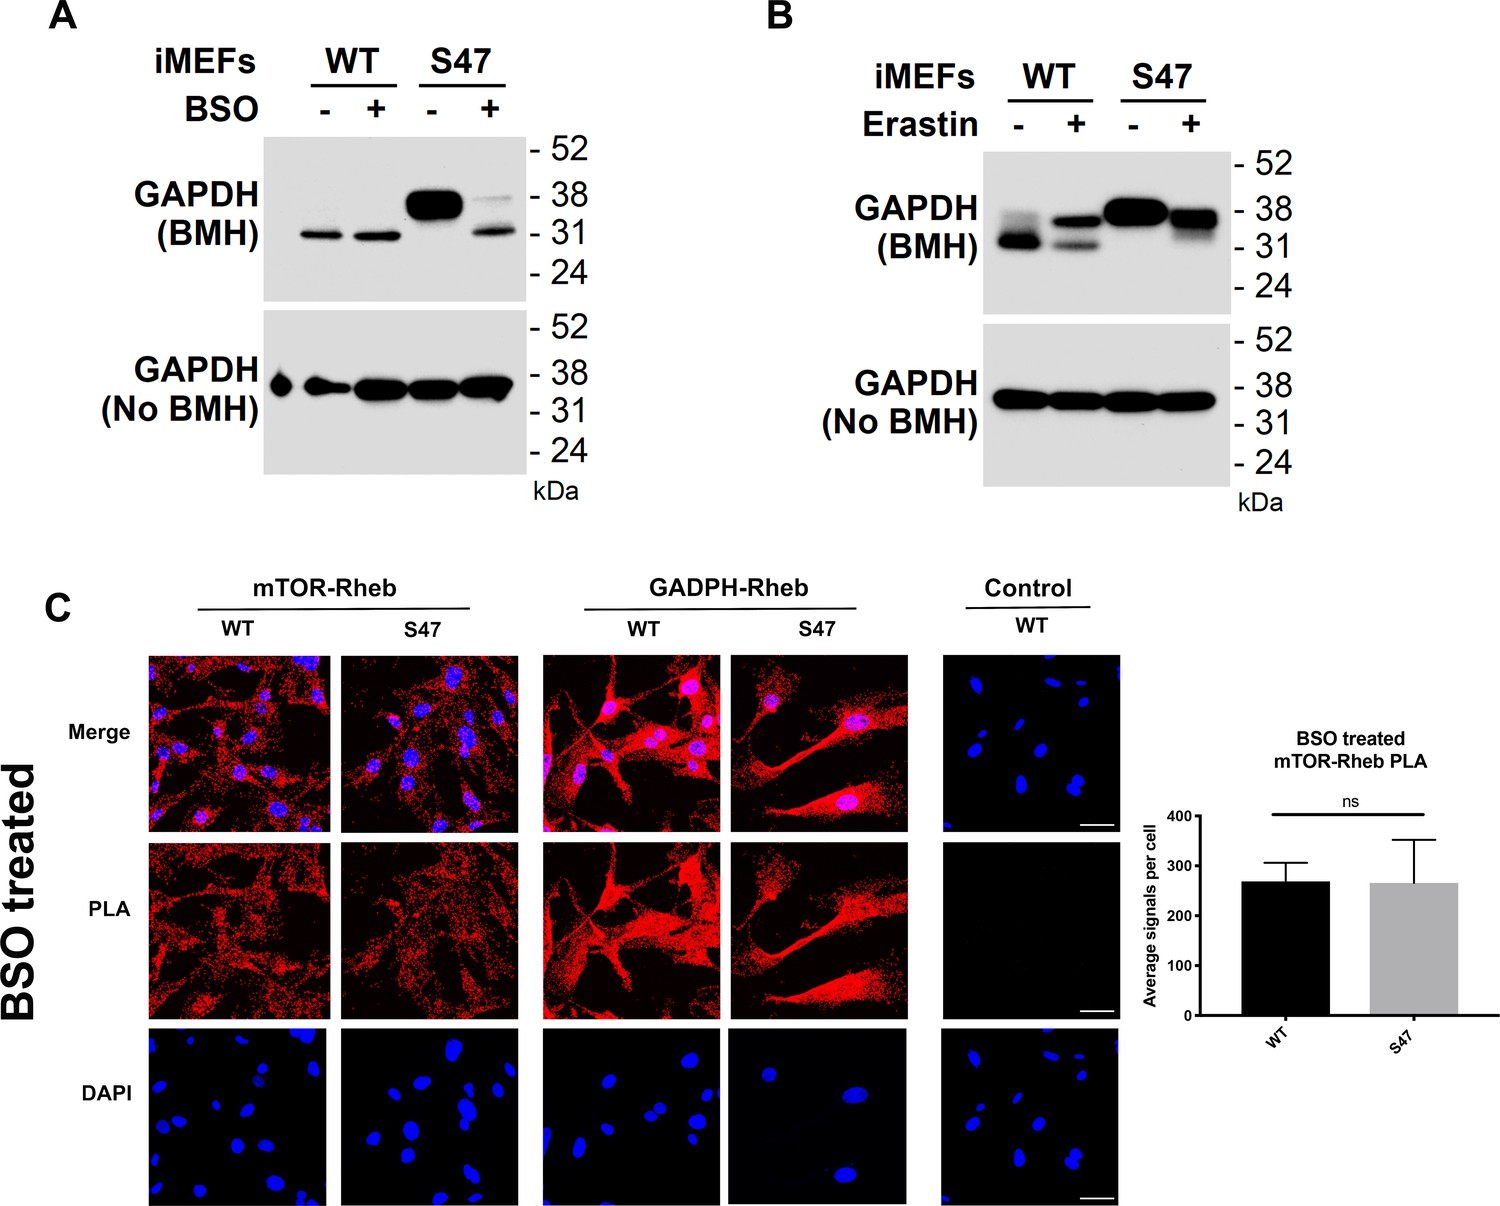
Glutathione depletion by BSO alters GAPDH cross-linking and the GAPDH-Rheb interaction.
(A) WT and S47 cells were treated with PBS or 100 μM BSO for 24 hr. Lysates were prepared, treated with or without BMH, run on SDS-PAGE and detected by western blotting with a GAPDH antibody. (B) WT and S47 cells were treated with DMSO or 2 μM Erastin for 24 hr. Lysates were prepared, treated with or without BMH, resolved by SDS-PAGE, and probed by western blotting for GAPDH. (C) An in situ proximity ligation assay was performed in WT and S47 MEFs that are treated with 10 μM of BSO for 24 hr. Shown on the right is the quantification of the mTOR-Rheb interactions, measured as the average number of PLA signals per nuclei. Scale bars represent 30 µm.
Figure 6 with 1 supplement
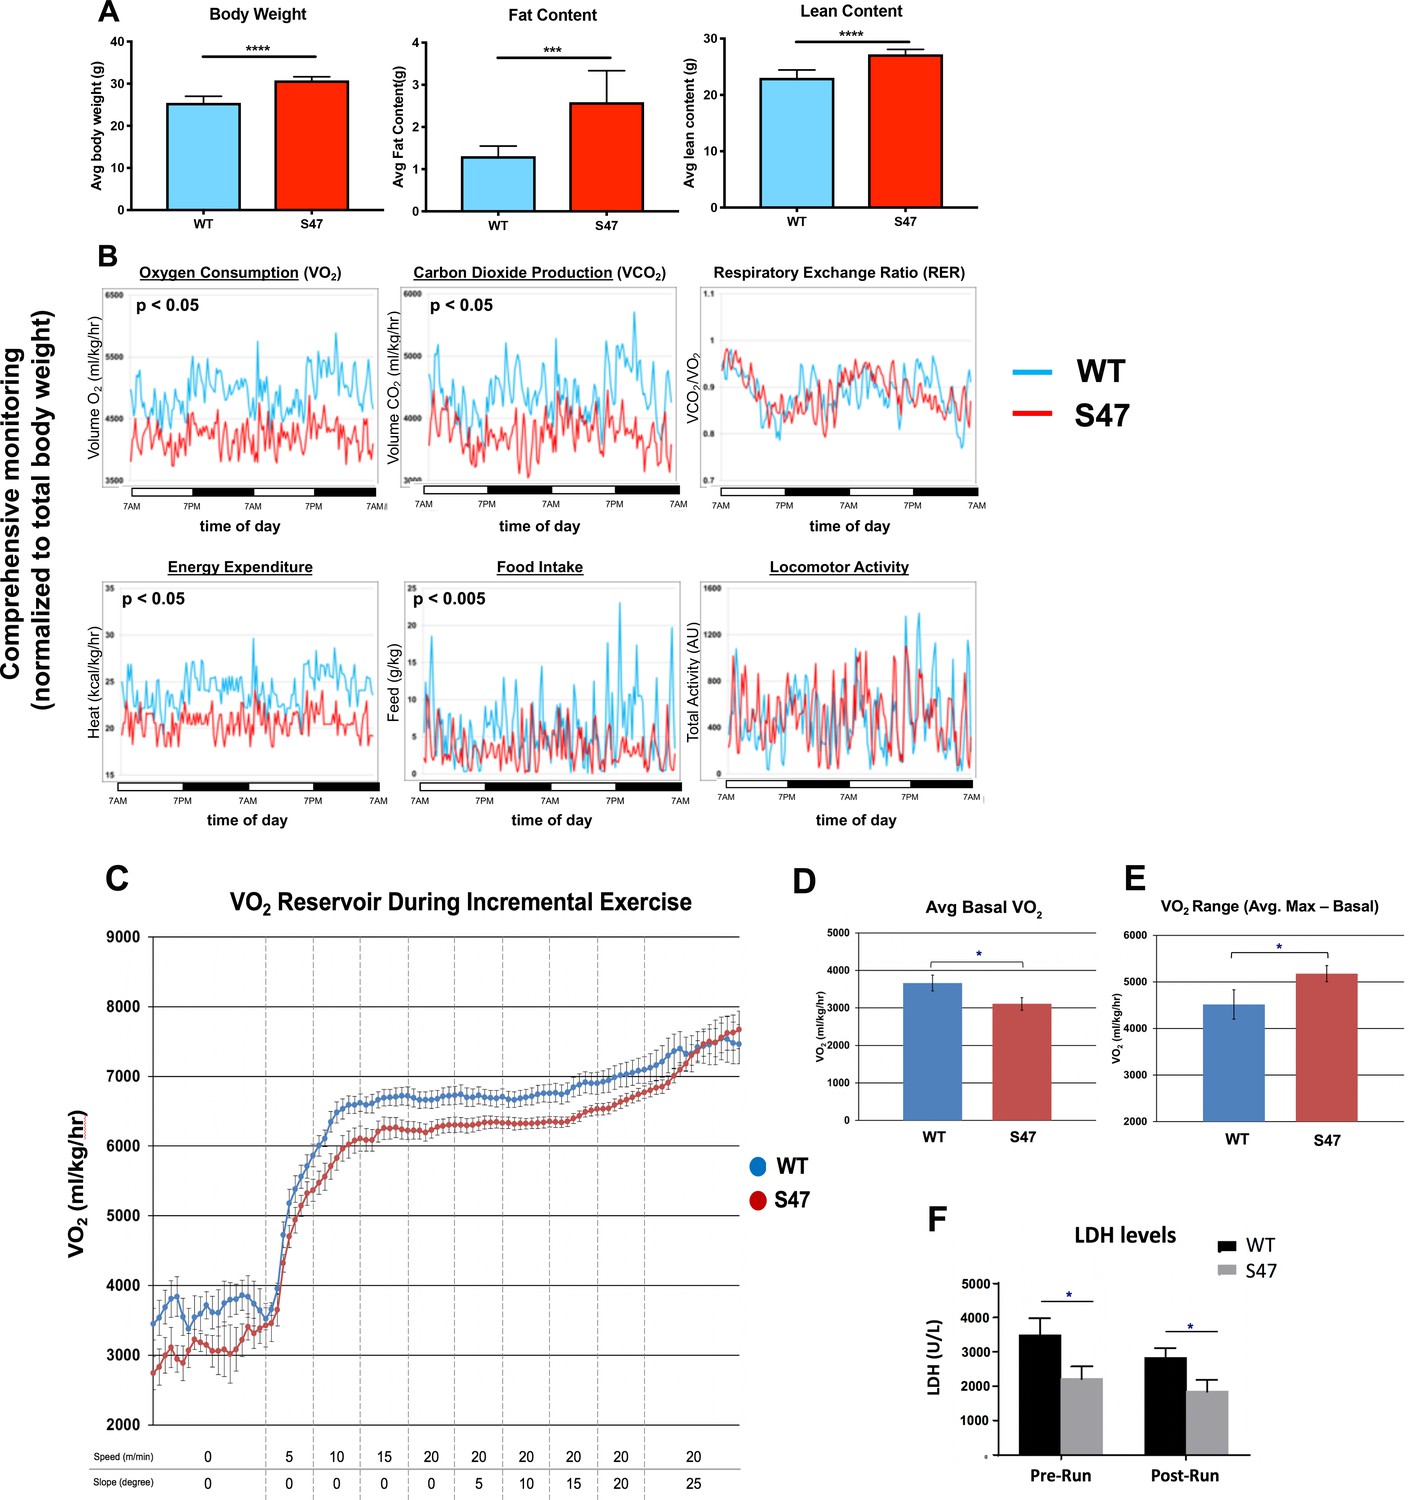
Increased size and improved metabolic efficiency in S47 mice.
(A) Nuclear magnetic resonance (NMR) studies revealed S47 mice have increased body weight, increased fat content and increased lean content, n = 7 WT mice, n = 8 S47 mice. (***) p-value<0.001, (****) p-value<0.0001. Bar graphs are presented as mean ± SD. (B) Changes in metabolic parameters for WT mice (blue) and S47 mice (red) were determined by using the Comprehensive Lab Animal Monitoring System for 48 hr. Parameters assessed includes oxygen consumption, carbon dioxide production, respiratory exchange rate, energy expenditure, total food intake, and locomotor activity. The data are representative of five 6-week old male mice per genotype and are normalized to total body weight. (C) WT and S47 mice (n = 6–7) were subjected to a treadmill study of increasing intensity over time. Oxygen consumption (VO2) is normalized to body mass. (D) Mean basal VO2 in WT and S47 mice. (E) VO2 range in WT and S47 mice determined by subtracting the mean basal VO2 from the VO2 max, obtained during the most strenuous point of exercise at the tail end of the treadmill study. (F) Lactate dehydrogenase (LDH) levels measured in the serum of WT and S47 mice obtained before and after the treadmill study. (*) p-value<0.05, Student’s t-test.
-
Figure 6—source data 1
Metabolic efficiency source data 1.
- https://cdn.elifesciences.org/articles/55994/elife-55994-fig6-data1-v1.xls
-
Figure 6—source data 2
Metabolic efficiency source data 2.
- https://cdn.elifesciences.org/articles/55994/elife-55994-fig6-data2-v1.xlsx
-
Figure 6—source data 3
Metabolic efficiency source data 3.
- https://cdn.elifesciences.org/articles/55994/elife-55994-fig6-data3-v1.xlsx
Figure 6—figure supplement 1
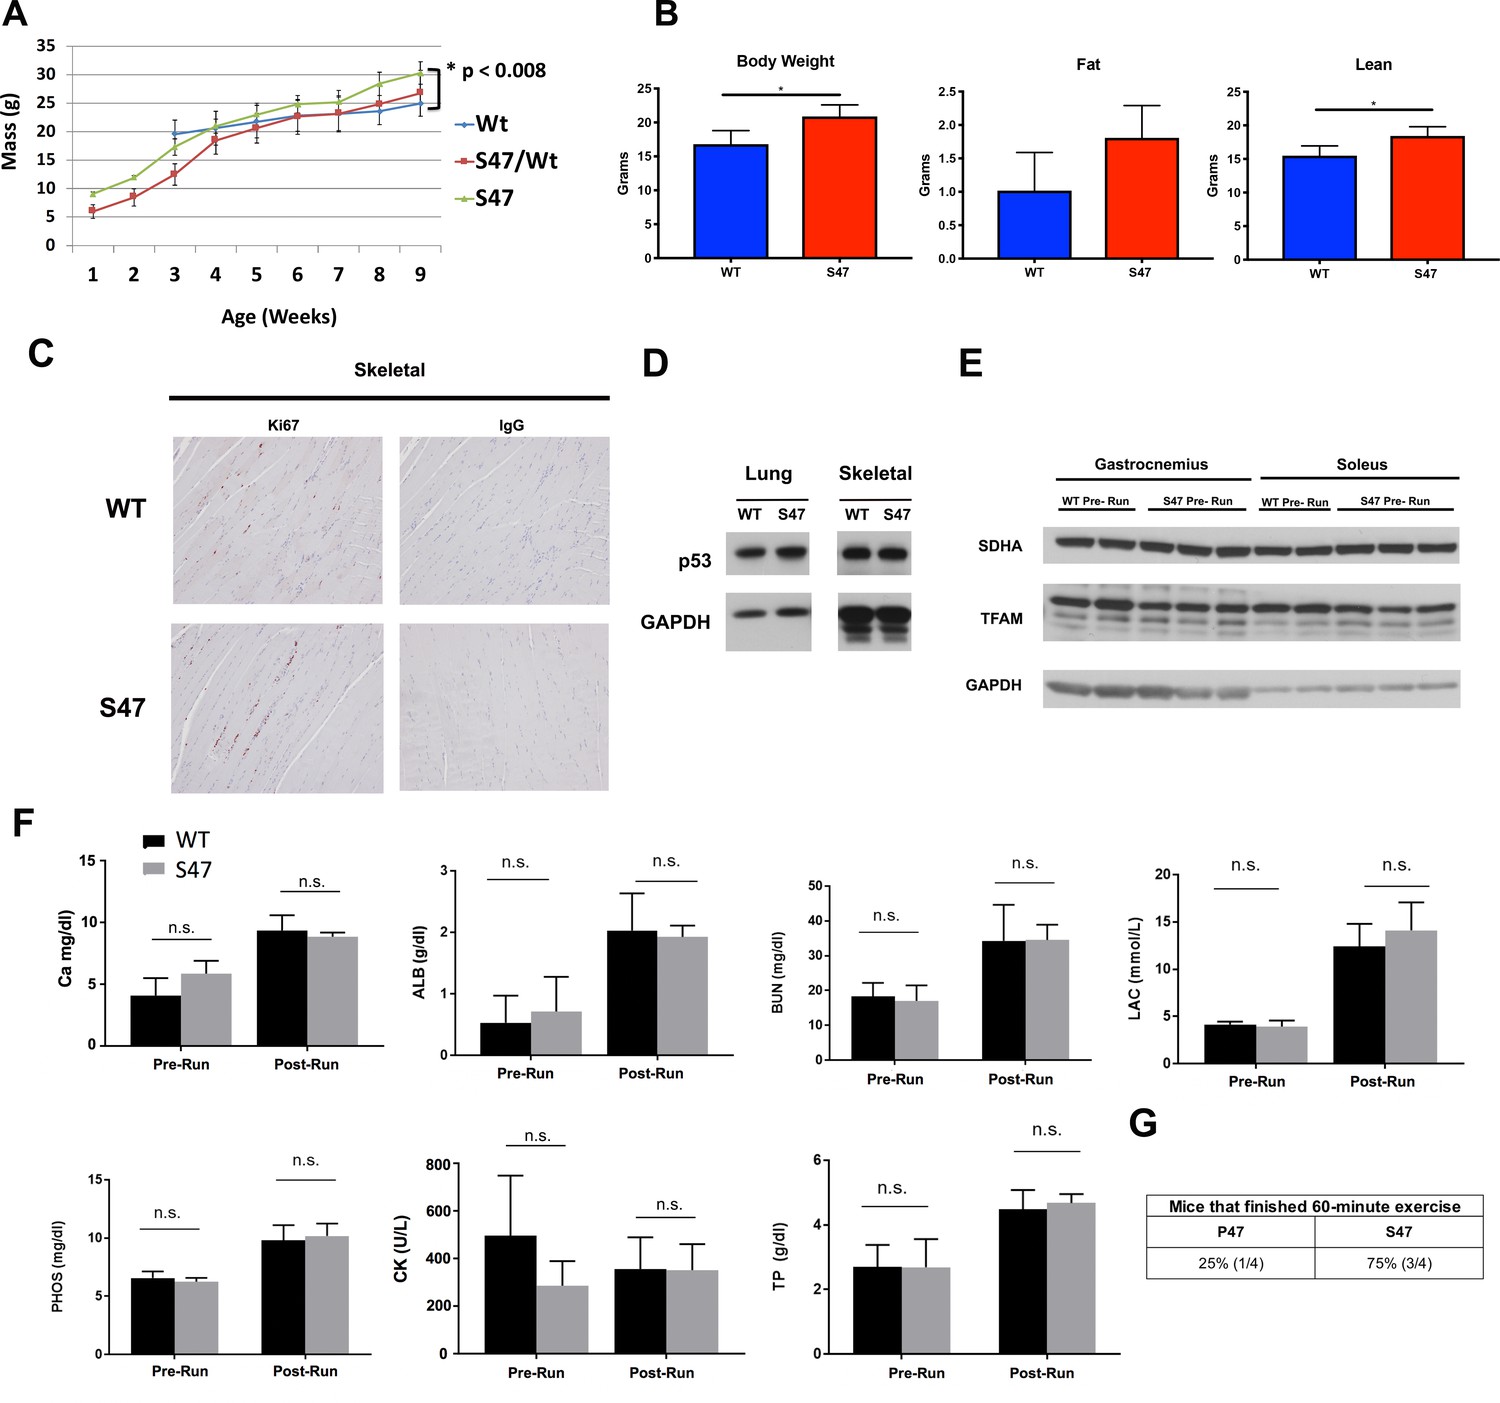
Serum metabolites and protein markers pre- and post- exercise.
(A) Record of mouse weights in WT, S47 and heterozygous WT/S47 mice over the course of 18 weeks; a minimum of 10 mice of each genotype were tracked, and error bars mark standard error. (B) Body weight, fat content, and lean content as measured by proton magnetic resonance spectroscopy (H-MRS); n = 5 mice per genotype, error bars mark standard error, (*) p-value<0.05. (C) Ki67 immunohistochemical staining of skeletal muscle from WT and S47 mice. IgG control shown on right. (D) Total p53 protein levels in WT and S47 lung and skeletal tissue. (E) Whole cell lysates were extracted from gastrocnemius or soleus muscle from untreated WT and S47 mice and subjected to western blot analysis for the proteins indicated. (F) Blood serum metabolite levels measured in WT and S47 mice before and after treadmill run: Ca (calcium), ALB (albumin), PHOS (phosphate), CK (creatine kinase), BUN (blood urea nitrogen), LAC (lupus anticoagulant), TP (total protein). n.s. not significant, Student’s t-test. (G) WT and S47 mice were subjected to a 60 min treadmill run. Table indicates proportion of mice that completed run; n = 4.
Figure 7
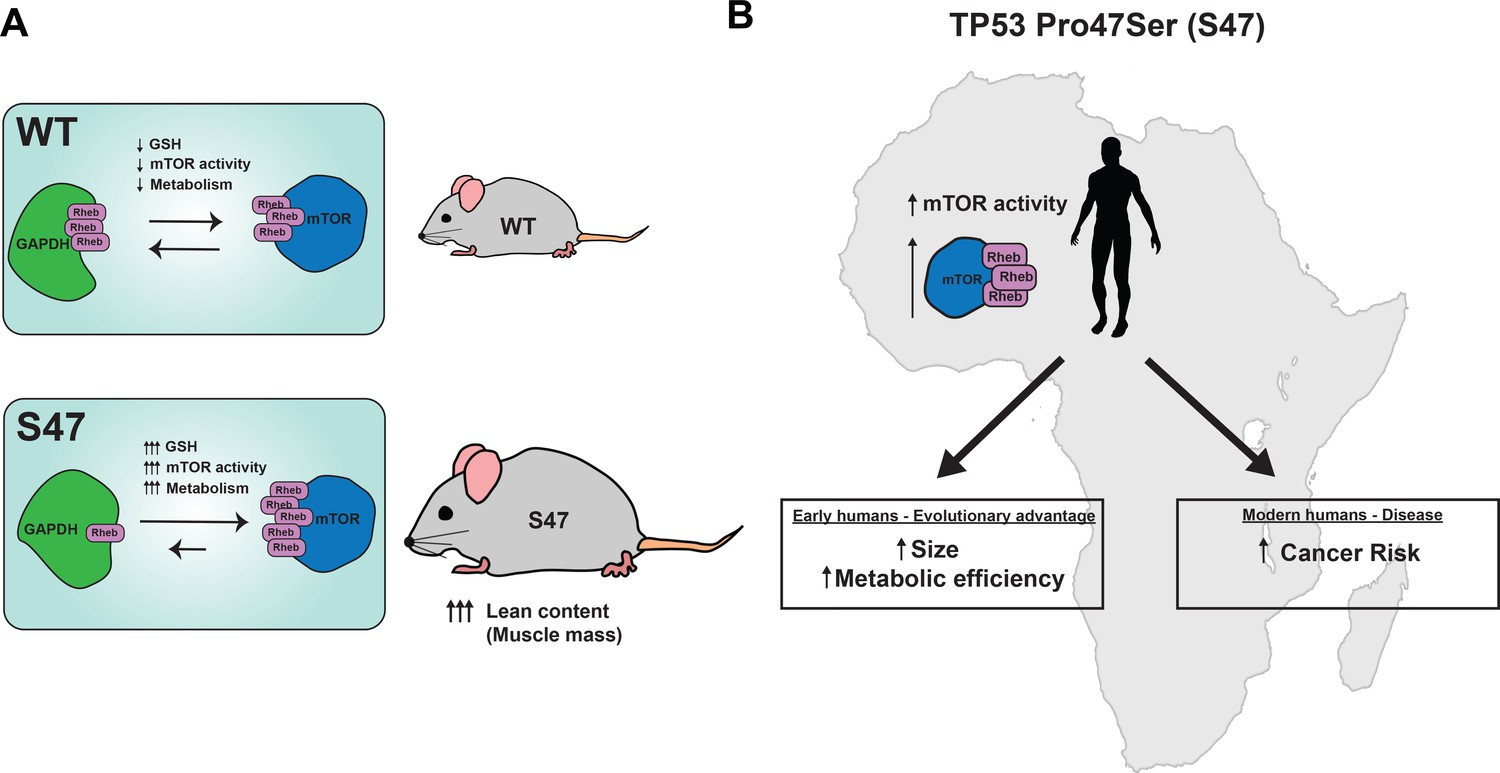
Proposed model.
(A) Proposed model of how S47 contributes to increased metabolism. The elevated levels of GSH alter the redox state of the S47 cell, in turn affecting GAPDH conformation and impairing GAPDH-Rheb binding. This results in increased mTOR-Rheb binding, leading to increased mTOR activity and resulting an overall increase in metabolism in S47 mice, as seen by increased fat and lean content. (B) Broad impact of S47 variant: although providing an adaptive advantage to individuals residing in sub-Saharan Africa at one point in time, it now predisposes modern humans with this SNP to cancer.
Tables
Key resources table
| Reagent type (species) or resource | Designation | Source or reference | Identifiers | Additional information |
|---|---|---|---|---|
| Strain, strain background (M. musculus) | C57Bl/6; P47/S47 Hupki | Jennis et al., 2016 | PMID:27034505 | |
| Cell lines (M. musculus) | WT/S47 Primary MEFs | Jennis et al., 2016 | PMID:27034505 | |
| Cell lines (Homo-sapiens) | WT/S47 LCLs | Coriell Institute | GM18870 GM18871 GM18872 | PMID:27034505 |
| Antibody | Anti-phospho-mTOR (Ser2448) (Rabbit polyclonal) | Cell Signaling Technologies | Cat# 2971 RRID:AB_330970 | WB (1:1000) IHC (1:100) |
| Antibody | Anti-mTOR (7C10) (Rabbit monoclonal) | Cell Signaling Technologies | Cat# 2983 RRID:AB_2105622 | WB (1:1000) PLA (1:500) |
| Antibody | Anti-phospho-S6K1 (Thr389) (Rabbit polyclonal) | Cell Signaling Technologies | Cat# 9205 RRID:AB_330944 | WB (1:1000) |
| Antibody | Anti-phospho-S6K1 (Thr421) (Rabbit polyclonal) | Thermo Fisher Scientific | Cat# PA5-37733 RRID:AB_2554341 | IHC (1:100) |
| Antibody | Anti-S6K1 (Rabbit polyclonal) | Cell Signaling Technologies | Cat# 9202 RRID:AB_331676 | WB (1:1000) |
| Antibody | Anti-GAPDH (14C10) (Rabbit monoclonal) | Cell Signaling Technologies | Cat# 2118 RRID:AB_561053 | WB (1:10,000) PLA (1:1000) |
| Antibody | Anti-TFAM (Rabbit polyclonal) | Abcam | Cat# ab131607 RRID:AB_11154693 | WB (1:2000) |
| Antibody | Anti-MTCO1 (Mouse monoclonal) | Abcam | Cat# ab14705 RRID:AB_2084810 | WB (1:2000) |
| Antibody | Anti-SDHA (Rabbit polyclonal) | Cell Signaling Technologies | Cat# 5839 RRID:AB_10707493 | WB (1:1000) |
| Antibody | Anti-Tom20 (F10) (Mouse monoclonal) | Santa Cruz Biotechnology | Cat# sc-17764 RRID:AB_628381 | WB (1:100) |
| Antibody | Anti-phospho-Akt (Ser473) (Rabbit monoclonal) | Cell Signaling Technologies | Cat# 4060 RRID:AB_2315049 | WB (1:1000) |
| Antibody | Anti-p62 (Rabbit polyclonal) | Cell Signaling Technologies | Cat# 5114 RRID:AB_10624872 | WB (1:1000) |
| Antibody | Anti-LC3B (D11) (Rabbit monoclonal) | Cell Signaling Technologies | Cat# 3868 RRID:AB_2137707 | WB (1:1000) |
| Antibody | Anti-HSP90 (C45G5) (Rabbit monoclonal) | Cell Signaling Technologies | Cat# 4877S RRID:AB_2233307 | WB (1:1000) |
| Antibody | Anti-Rheb (E1G1R) (Rabbit monoclonal) | Cell Signaling Technologies | Cat# 13879 RRID:AB_2721022 | WB (1:1000) IF (1:800) |
| Antibody | Anti-TSC2 (D93F12) (Rabbit monoclonal) | Cell Signaling Technologies | Cat# 4308 RRID:AB_10547134 | WB (1:1000) IF (1:100) |
| Antibody | Anti-Akt (Rabbit polyclonal) | Cell Signaling Technologies | Cat# 9272 RRID:AB_329827 | WB (1:1000) |
| Antibody | Anti-Deptor (Rabbit polyclonal) | Novus Biologicals | Cat# NBP1-49674 RRID:AB_10011798 | WB (1:1000) |
| Antibody | Anti-phospho-AMPKα (Thr172) (Rabbit monoclonal) | Cell Signaling Technologies | Cat# 2535 RRID:AB_331250 | WB (1:1000) |
| Antibody | Anti-Ki67 (D3B5) (Rabbit monoclonal) | Cell Signaling Technologies | Cat# 12202 RRID:AB_2620142 | IHC (1:400) |
| Antibody | Anti-phospho-S6 (Ser235/236) (Rabbit monoclonal) | Cell Signaling Technologies | Cat# 4856 RRID:AB_2181037 | WB (1:1000) |
| Antibody | Anti-S6 (54D2) (Mouse monoclonal) | Cell Signaling Technologies | Cat# 2317 RRID:AB_2238583 | WB (1:1000) |
| Antibody | Anti-Rheb (B-12) (Mouse monoclonal) | Santa Cruz Biotechnology | Cat# sc-271509 RRID:AB_10659102 | PLA (1:50) IP (1:20) |
| Antibody | Anti-phospho-4EBP1 (Ser65) (Rabbit polyclonal) | Cell Signaling Technologies | Cat# 9451 RRID:AB_330947 | WB (1:1000) |
| Antibody | Anti-4EBP1 (53H11) (Rabbit monoclonal) | Cell Signaling Technologies | Cat# 9644 RRID:AB_2097841 | WB (1:1000) |
| Antibody | Anti-p53 (1C12) (Mouse monoclonal) | Cell Signaling Technologies | Cat# 2524 RRID:AB_331743 | WB (1:1000) |
| Antibody | Anti-Sco2 (Rabbit polyclonal) | LS Bio | Cat# LS-C349015 | WB (1:500) |
| Antibody | Anti-LAMP1(H4A3) (Mouse monoclonal) | Santa Cruz Biotechnology | Cat# sc-20011 RRID:AB_626853 | IF (1:50) |
| Antibody | Alexa Fluor 594 AffiniPure Goat Anti-Rabbit IgG (H+L) | Jackson ImmunoResearch Laboratories | Cat #111-585-144 RRID:AB_2307325 | IF (1:100) |
| Antibody | Alexa Fluor 488 AffiniPure Goat Anti-Mouse IgG (H+L) | Jackson ImmunoResearch Laboratories | Cat #115-545-062 RRID:AB_2338845 | IF (1:100) |
| Antibody | Peroxidase AffiniPure F(ab’)2 Goat Anti-Mouse IgG (H+L) | Jackson ImmunoResearch Laboratories | Cat #115-036-062 RRID:AB_2307346 | WB (1:10,000) |
| Antibody | Peroxidase AffiniPure F(ab’)2 Goat Anti-Rabbit IgG (H+L) | Jackson ImmunoResearch Laboratories | Cat #111-036-003 RRID:AB_2337942 | WB (1:10,000) |
| Antibody | Peroxidase AffiniPure F(ab’)2 Donkey Anti-Rabbit IgG (H+L) | Jackson ImmunoResearch Laboratories | Cat #711-036-152 RRID:AB_2340590 | WB (1:10,000) |
| Commercial assay or kit | Seahorse XF Cell Mito Stress Kit | Agilent | Part Number: 1037015–100 | |
| Commercial assay or kit | Seahorse XF Glycolytic Rate Assay | Agilent | Part Number: 103344–100 | |
| Commercial assay or kit | GSH/GSSG Glo Assay | Promega | Cat# V6611 | |
| Commercial assay or kit | PLA Duolink In Situ Starter Kit | Sigma Aldrich | DUO92101 | |
| Chemical compound, drug | Rapamycin | Sigma Aldrich | R0395; CAS 53123-88-9 | |
| Chemical compound, drug | Torin1 | Cayman Chemical | Item No. 10997; CAS 1222998-36-8 | |
| Chemical compound, drug | BMH (bismaleimidohexane) | Thermo Fisher Scientific | Cat# 22330; CAS 4856-87-5 | |
| Chemical compound, drug | DEM (diethylmaleate) | Sigma Aldrich | D97703; CAS 141-05-9 | |
| Chemical compound, drug | BSO (buthionine sulfoximine) | Cayman Chemical | Item no. 14484; CAS 83730-53-4 | |
| Chemical compound, drug | Erastin | Cayman Chemical | Item no. 17754; CAS 571203-78-6 | |
| Chemical compound, drug | GSH (L-Glutathione) | Sigma Aldrich | Cat# G6013, CAS 70-18-8 | |
| Chemical compound, drug | L-Methionine | Sigma Aldrich | Cat# M9625, CAS 63-68-3 | |
| Chemical compound, drug | L-Glutamine | Thermo Fisher Scientific | Cat# 25030081 | |
| Chemical compound, drug | L-Cystine | Sigma Aldrich | Cat# C6727 | |
| Software, algorithm | ImageJ | NIH | RRID:SCR_003070 | |
| Software, algorithm | GraphPad Prism | GraphPad | RRID:SCR_002798 | |
| Other | Pyruvate-free DMEM | Thermo Fisher Scientific | Cat# 21013024 | |
| Other | Glucose-free DMEM | Thermo Fisher Scientific | Cat# 11966025 | |
| Other | EBSS | Thermo Fisher Scientific | Cat# 24010043 | |
| Other | MEM Vitamin | Thermo Fisher Scientific | Cat# 11120052 | |
| Other | MEM Amino Acids | Thermo Fisher Scientific | Cat# 1130051 | |
| Other | HBSS | Thermo Fisher Scientific | Cat# 14025092 | |
| Other | Trypan Blue | Thermo Fisher Scientific | Cat# 15250061 | |
| Other | Protein G Agarose | Thermo Fisher Scientific | Cat# 15920010 | |
| Other | MitoTracker Green | Thermo Fisher Scientific | Cat# M7514 |
Additional files
Download links
A two-part list of links to download the article, or parts of the article, in various formats.
Downloads (link to download the article as PDF)
Open citations (links to open the citations from this article in various online reference manager services)
Cite this article (links to download the citations from this article in formats compatible with various reference manager tools)
Increased mTOR activity and metabolic efficiency in mouse and human cells containing the African-centric tumor-predisposing p53 variant Pro47Ser
eLife 9:e55994.
https://doi.org/10.7554/eLife.55994


