A conserved LDL-receptor motif regulates corin and CD320 membrane targeting in polarized renal epithelial cells
- Cyrus Tang Hematology Center, Collaborative Innovation Center of Hematology, State Key Laboratory of Radiation Medicine and Prevention, Soochow University, China
- MOH Key Laboratory of Thrombosis and Hemostasis, Jiangsu Institute of Hematology, the First Affiliated Hospital of Soochow University, China
- Institute of Molecular Enzymology, Soochow University, China
- Cardiovascular & Metabolic Sciences, Lerner Research Institute, Cleveland Clinic, United States
Figures
Figure 1 with 1 supplement

Expression of corin and other selected proteases in MDCK, HL-1, and HEK293 cells.
(A) MDCK (left), HL-1 (middle), and HEK293 (right) cells were transfected with a plasmid expressing corin. After 72 hr, immunostaining was done to examine corin (green) and ZO-1 (red) (an indicator of the apicolateral tight junction) expression with confocal microscopy. X-Y and X-Z views are shown in top and lower panels, respectively. (B) Neprilysin, hepsin, matriptase, and TMPRSS3-5 (green) were expressed in transfected MDCK cells. Immunostaining and confocal microscopy were used to examine protein expression on apical and basolateral membranes. X-Y and X-Z views are shown in top and lower panels, respectively. Each image represents the data from five experiments. Scale bars: 5 μm.
Figure 1—figure supplement 1
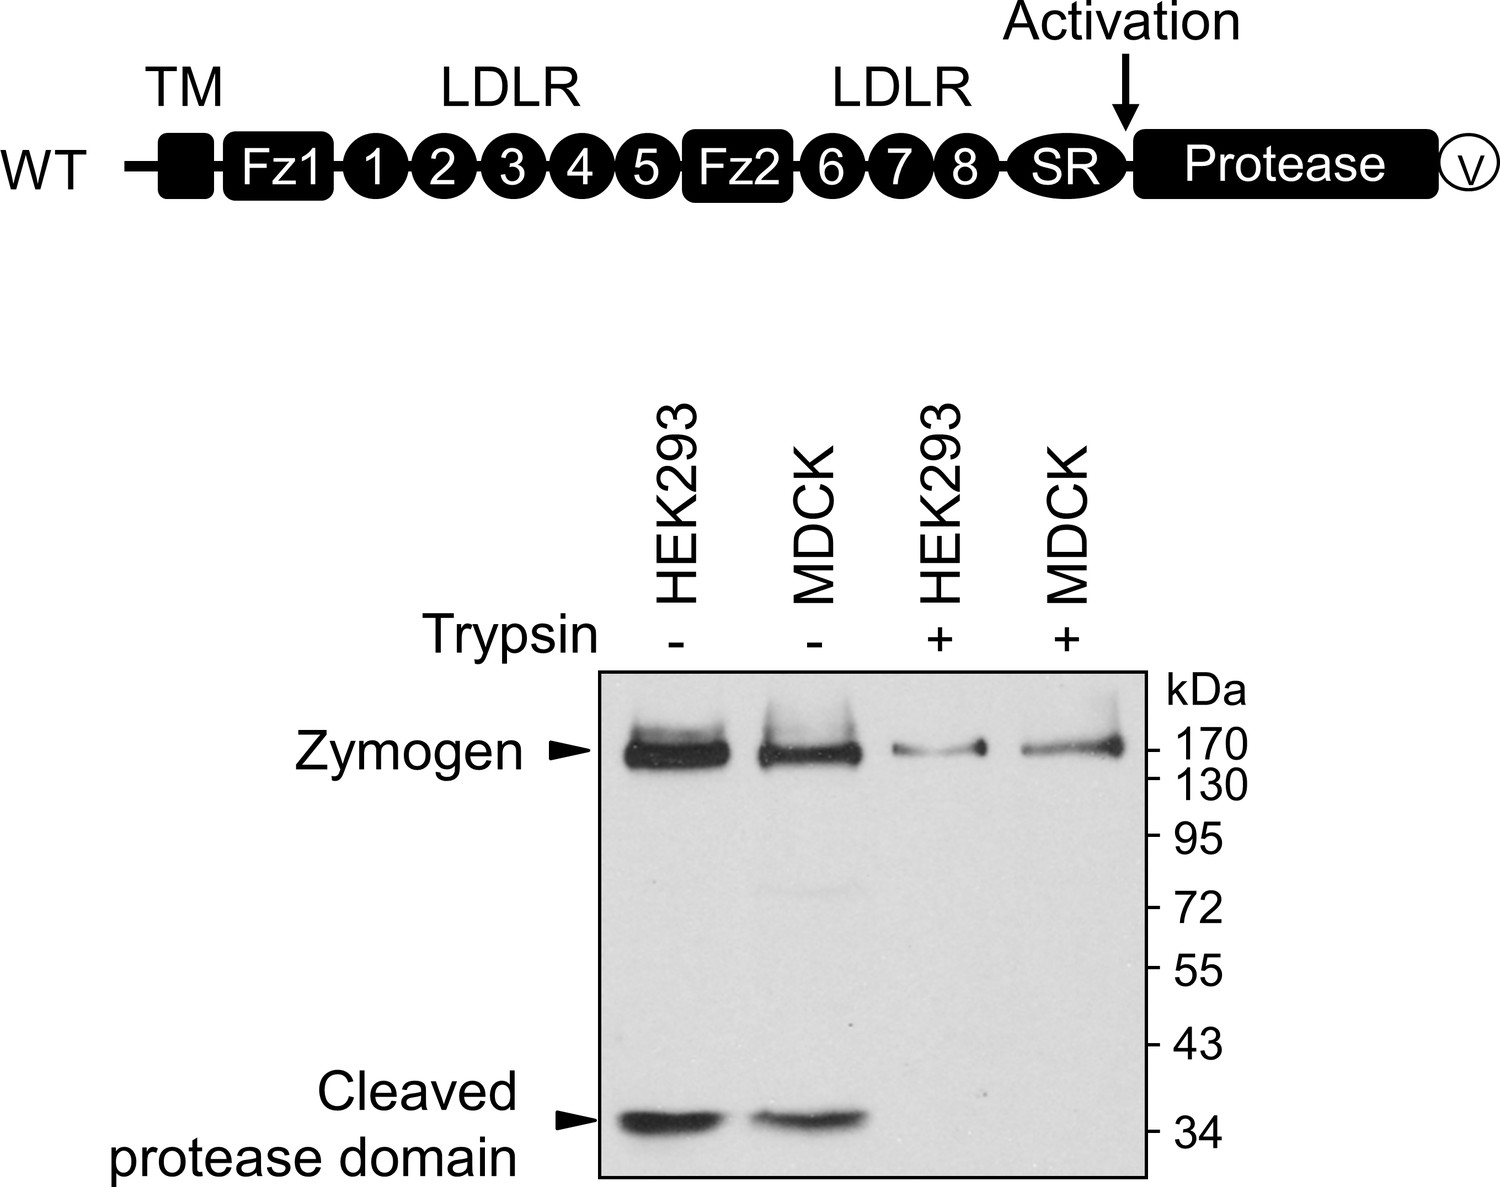
Western blotting analysis of corin expression in HEK293 and MDCK cells.
Corin modules, including the cytoplasmic tail, the transmembrane domain (TM), frizzled (Fz), LDLR, scavenger receptor (SR), and protease domain modules, are shown. The activation cleavage site is indicated by an arrow. Recombinant corin had a C-terminal V5 (V) tag for protein detection. Western blotting (under reducing conditions) was done with an anti-V5 antibody to analyze corin protein fragments in transfected MDCK cells without (-) or with (+) trypsin treatment before the cells being lysed. Corin zymogen and cleaved protease domain fragments are indicated. The data are representative of four experiments.
Figure 2 with 2 supplements

Analysis of corin deletion mutants in MDCK cells.
(A) Human corin consists of an N-terminal cytoplasmic tail (CT), a transmembrane domain (TM) and an extracellular region with two frizzled (Fz) modules, eight LDLR modules, a scavenger receptor (SR) module, and a protease domain module. Corin wild-type (WT) and mutants lacking the CT (ΔCT) or Fz1-SR modules (ΔFz1-SR) were expressed in MDCK cells. Corin expression (green) on apical and basolateral membranes was examined by immunostaining and confocal microscopy with X-Y (top panels) and X-Z (lower panels) views. (B) Corin mutants lacking Fz and LDLR modules, individually or in combination, were expressed in MDCK cells and examined by immunostaining and confocal microscopy with X-Y (top panels) and X-Z (lower panels) views. Each image represents the data from five experiments. Scale bars: 5 μm.
Figure 2—figure supplement 1
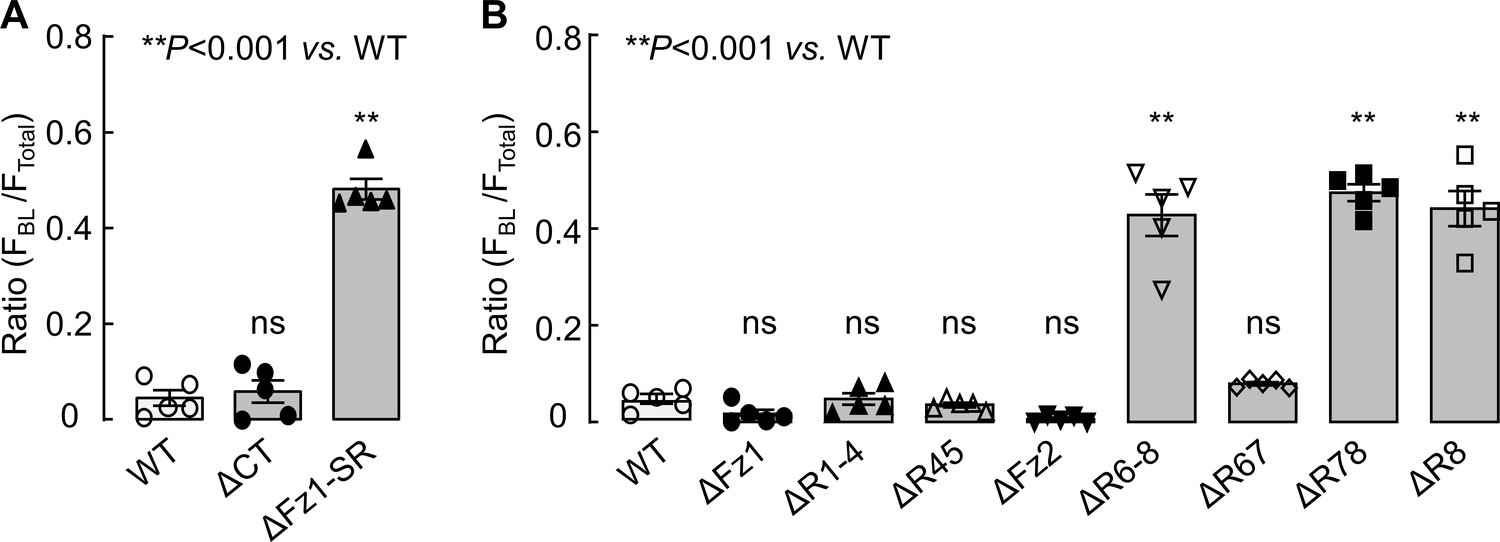
Quantitative analysis of corin expression on apical and basolateral membranes in MDCK cells.
Corin WT and mutants lacking the cytoplasmic tail (ΔCT) and the extracellular fragment between frizzled 1 (Fz1) and scavenger receptor (SR) modules (ΔFz1-SR) in (A) and mutants lacking frizzled and LDLR (R) modules, individually or in combination in (B) were expressed in MDCK cells. Corin expression was examined with a confocal laser scanning microscope. Fluorescent signals along the X-Z axis were analyzed with Image J software to calculate the ratio of FBL/FTotal, where FBL is the fluorescent intensity on basolateral membranes and FTotal is the total fluorescent intensity on apical and basolateral membranes. The data (mean ± SEM) were from five experiments. Statistical analysis was done with ANOVA. n.s., not significant vs. corin WT in respective groups.
-
Figure 2—figure supplement 1—source data 1
Source data for Figure 2—figure supplement 1A.
- https://cdn.elifesciences.org/articles/56059/elife-56059-fig2-figsupp1-data1-v1.xlsx
-
Figure 2—figure supplement 1—source data 2
Source data for Figure 2—figure supplement 1B.
- https://cdn.elifesciences.org/articles/56059/elife-56059-fig2-figsupp1-data2-v1.xlsx
Figure 2—figure supplement 2
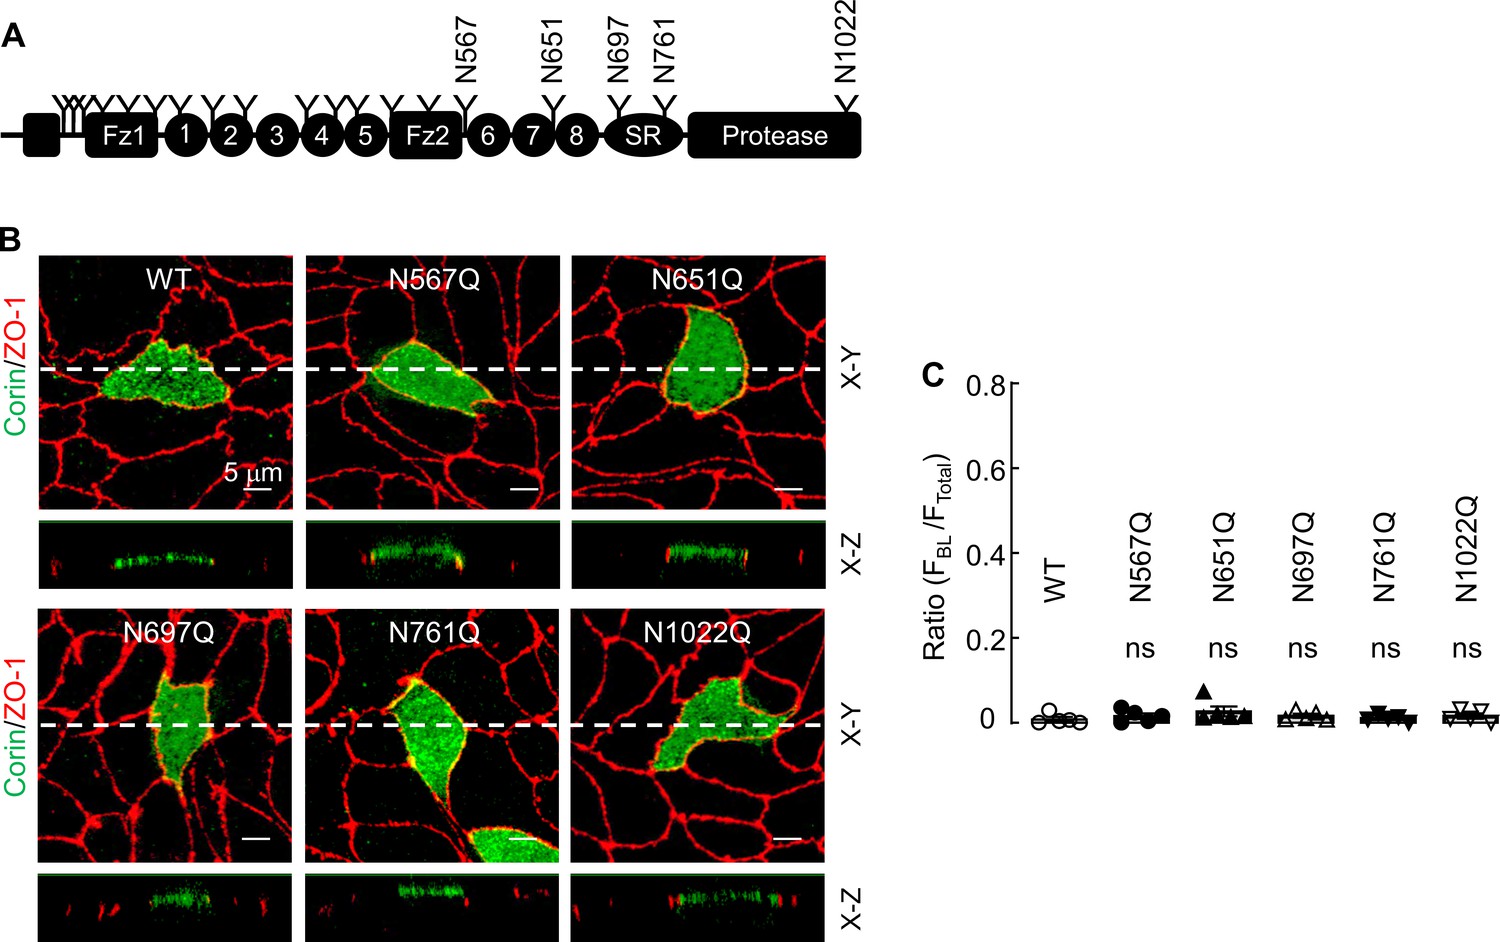
Analysis of corin mutants lacking individual N-glycosylation sites.
(A) Human corin contains 19 N-glycosylation sites, as indicated by Y shaped symbols. (B) Corin WT and mutants N567Q, N651Q, N697Q, N761Q, and N1022Q were expressed in MDCK cells. Immunostaining and confocal microscopy were used to examine corin (green) and ZO-1 (red) expression in the transfected cells in X-Y and X-Z views. The data are representative of five experiments. (C) Quantitative data of relative corin expression on apical and basolateral membranes, indicated by the ratio of FBL/FTotal, were analyzed by Image J software. The data (mean ± SEM) were from five experiments. Statistical analysis was done with ANOVA. n.s., not significant vs. corin WT.
-
Figure 2—figure supplement 2—source data 1
Source data for Figure 2—figure supplement 2C.
- https://cdn.elifesciences.org/articles/56059/elife-56059-fig2-figsupp2-data1-v1.xlsx
Figure 3 with 1 supplement
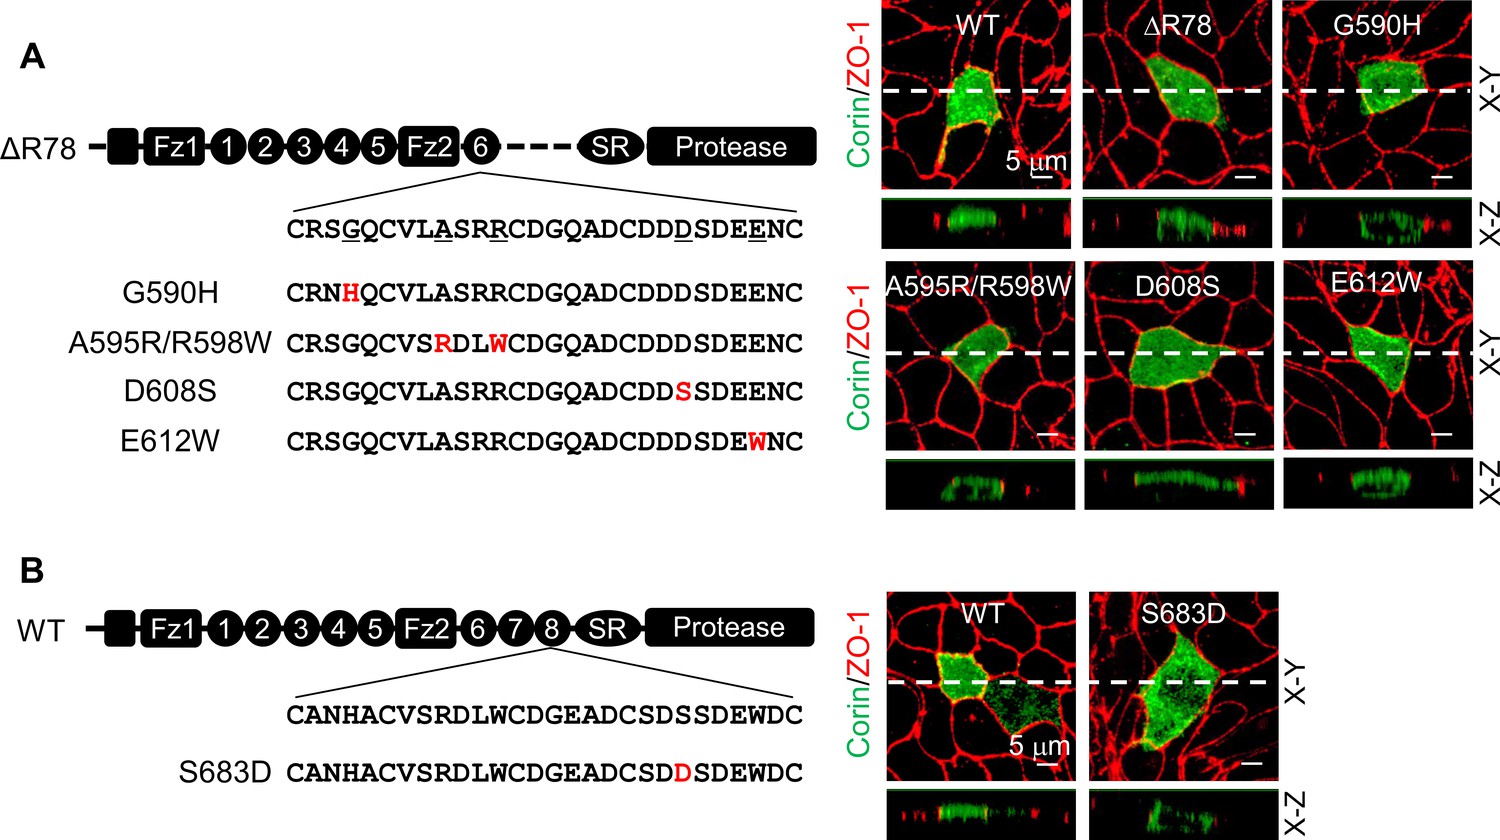
Expression of corin mutants with point mutations in LDLR6 module and without LDLR7-8 modules.
(A) Corin wild-type (WT) and mutants lacking LDLR7-8 module without (ΔR78) or with point mutations at indicated positions (G590H, A595R/R598W, D608S, and E612W), indicated in red, were expressed in MDCK cells. Corin expression (green) on apical and basolateral membranes was examined by immunostaining and confocal microscopy with X-Y (top panels) and X-Z (lower panels) views. ZO-1 protein (red) was used as an indicator. (B) Corin WT and the mutant S683D expressed in MDCK cells were examined by immunostaining and confocal microscopy with X-Y (top panels) and X-Z (lower panels) views. Each image represents the data from five experiments. Scale bars: 5 μm.
Figure 3—figure supplement 1
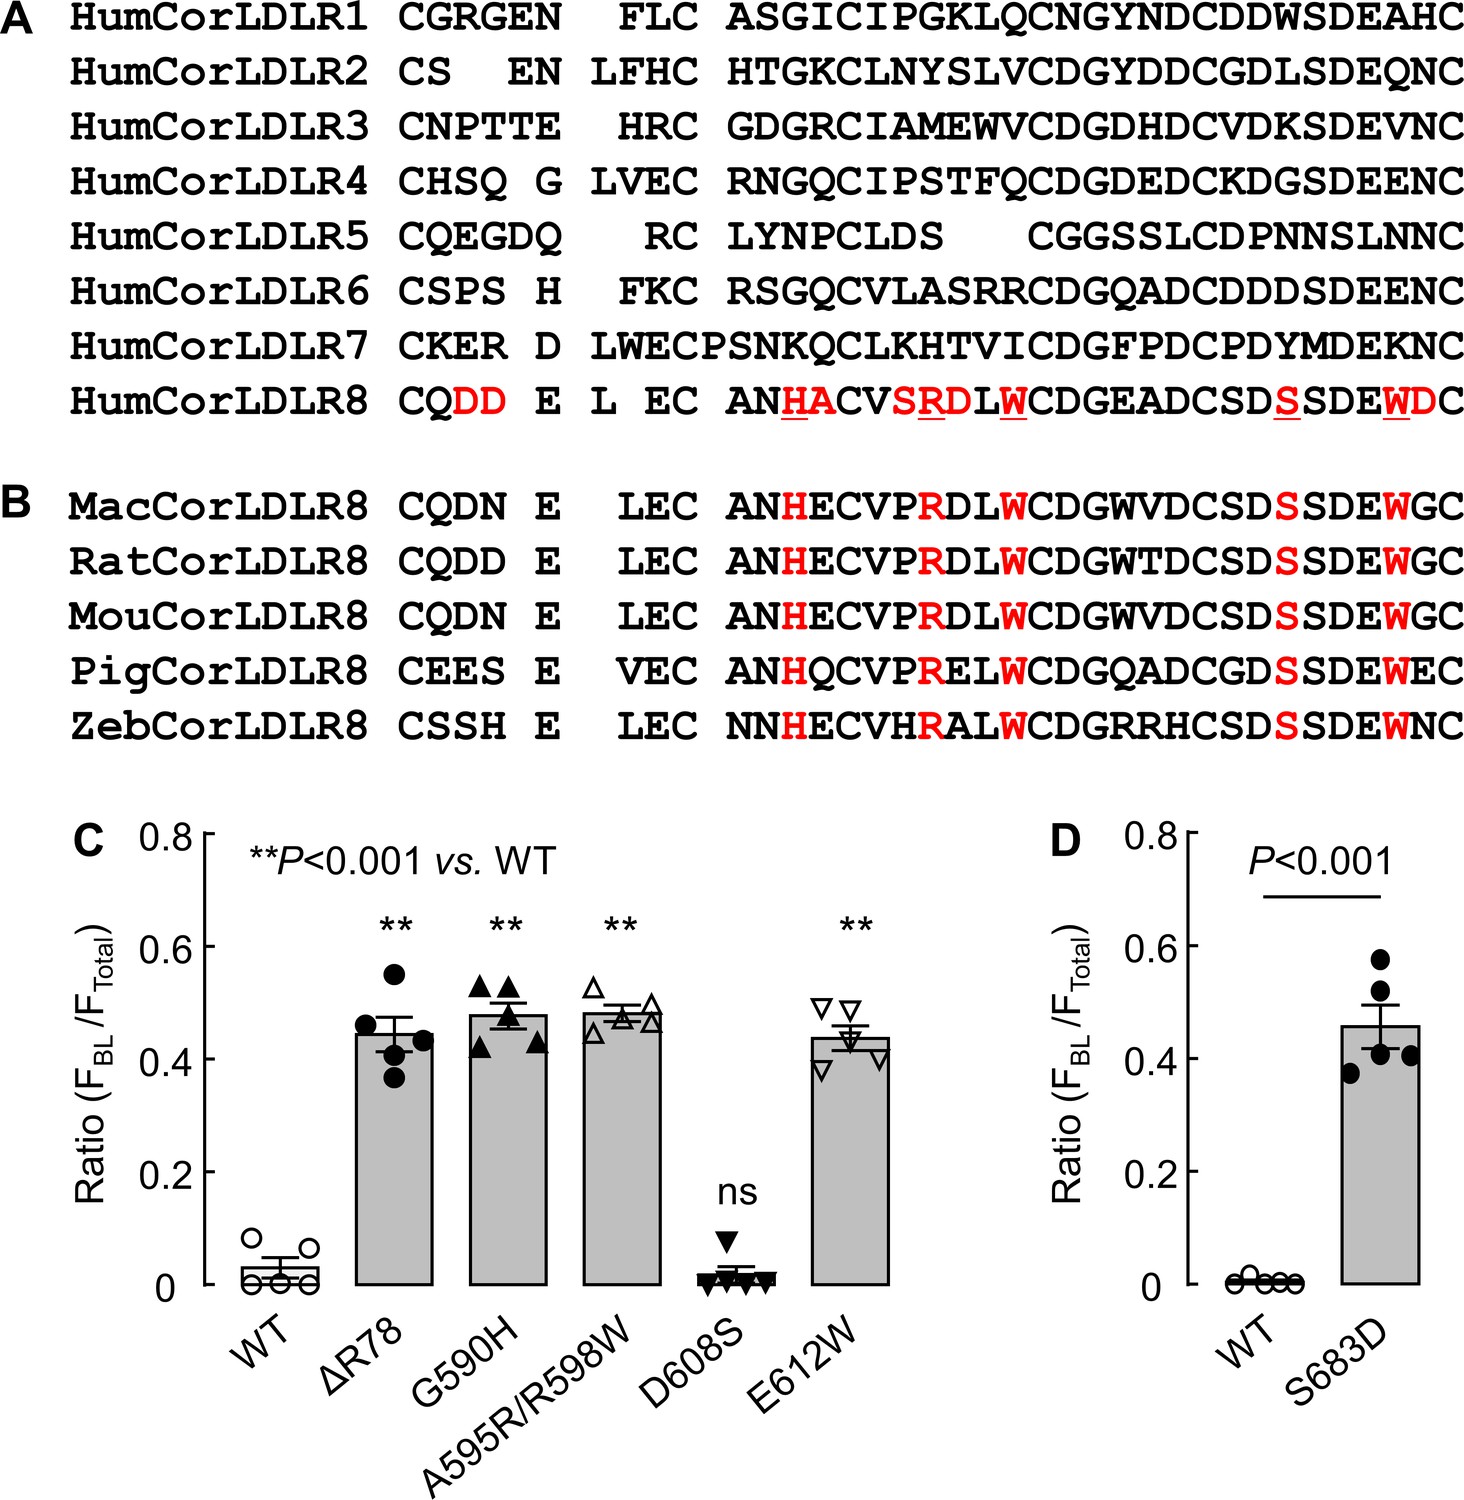
Alignments of corin LDLR module sequences.
(A) Alignment of partial sequences from human corin LDLR1-8 modules. Residues unique at corresponding positions in LDLR8 module are highlighted in red. Among them, five residues conserved in vertebrate species are underlined. (B) Alignment of partial sequences in LDLR8 modules from monkey (Mac), rat (Rat), mouse (Mou), pigeon (Pig), and zebrafish (Zeb) species. Five conserved residues, corresponding to those in red and underlined (A), are shown in red. (C and D) Corin WT and mutants were expressed in MDCK cells and analyzed by immunostaining and confocal microscopy. Quantitative data of relative corin expression on apical and basolateral membranes, indicated by the ratio of FBL/FTotal, were analyzed by Image J software. The data (mean ± SEM) were from five experiments. Statistical analysis was done with ANOVA (C) or Student’s t test (D). n.s., not significant vs. corin WT.
-
Figure 3—figure supplement 1—source data 1
Source data for Figure 3—figure supplement 1C.
- https://cdn.elifesciences.org/articles/56059/elife-56059-fig3-figsupp1-data1-v1.xlsx
-
Figure 3—figure supplement 1—source data 2
Source data for Figure 3—figure supplement 1D.
- https://cdn.elifesciences.org/articles/56059/elife-56059-fig3-figsupp1-data2-v1.xlsx
Figure 4 with 2 supplements

Expression of corin mutants with point mutations in the DSSDE motif in LDLR8 module.
(A) Corin wild-type (WT) and mutants with point mutations at indicated positions (D682A, S683A, S684A, D685A, and E686A), indicated in red, were expressed in MDCK cells. Corin expression (green) on apical and basolateral membranes was examined by immunostaining and confocal microscopy with X-Y (top panels) and X-Z (lower panels) views. (B) Corin WT and S684A mutants without (S684A) or with the DSSDE motif created in LDLR6 (ML6/S684A) or LDLR7 (ML7/S684A) module expressed in MDCK cells were examined by immunostaining and confocal microscopy. X-Y (top panels) and X-Z (lower panels) views are indicated. Each image represents the data from five experiments. Scale bars: 5 μm.
Figure 4—figure supplement 1
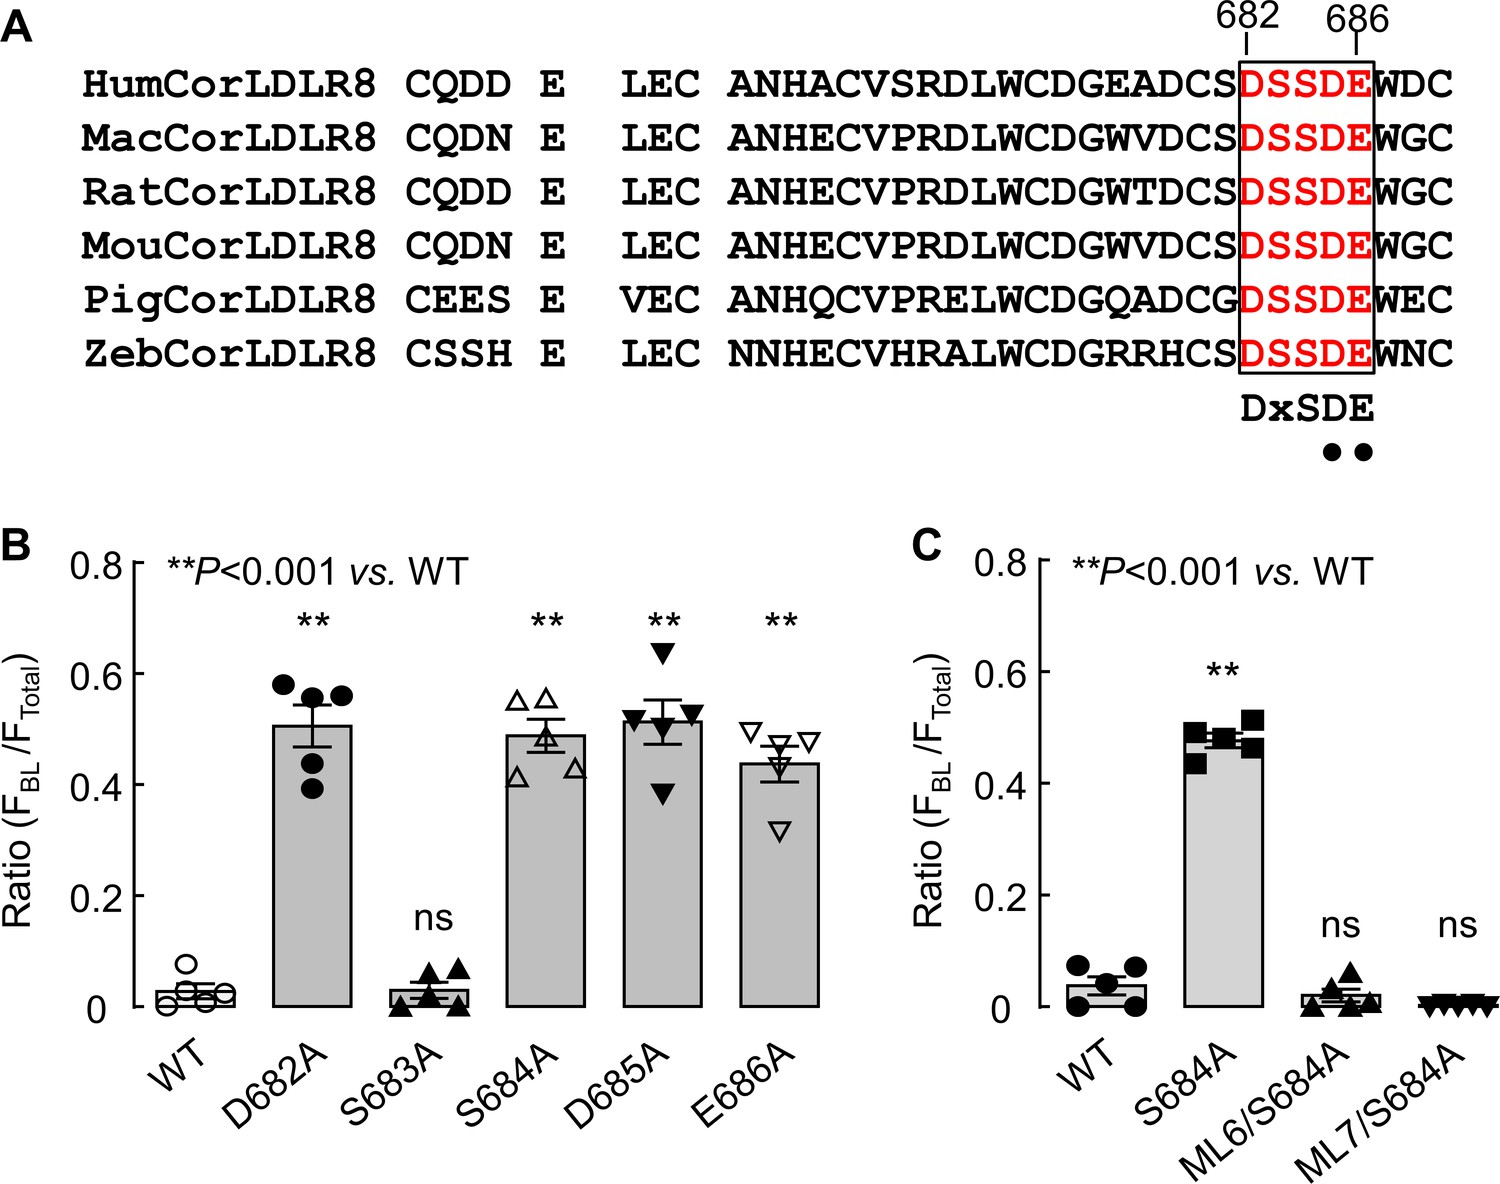
Analysis of the DSSDE motif in corin LDLR8 module.
(A) Alignment of the DSSDE motif in corin LDLR8 modules from selected vertebrate species. The DSSDE motif (red) in corin LDLR8 modules from selected vertebrate species (human, Hum; monkey, Mac; rat, Rat; mouse, Mou; pigeon, Pig; zebrafish, Zeb) is aligned. This motif corresponds to the DxSDE motif found in LDLR modules in many proteins. The Asp-Glu residues (indicated by black dots), corresponding to Asp685 and Glu686 in human corin, have been shown to be part of a Ca2+-binding cage in LDLR module structures of other proteins. (B and C) Corin WT and mutants were expressed in MDCK cells and analyzed by immunostaining and confocal microscopy. Quantitative data of relative corin expression on apical and basolateral membranes, indicated by the ratio of FBL/FTotal, were analyzed by Image J software. The data (mean ± SEM) were from five experiments. Statistical analysis was done with ANOVA. n.s., not significant vs. corin WT in respective groups.
-
Figure 4—figure supplement 1—source data 1
Source data for Figure 4—figure supplement 1B.
- https://cdn.elifesciences.org/articles/56059/elife-56059-fig4-figsupp1-data1-v1.xlsx
-
Figure 4—figure supplement 1—source data 2
Source data for Figure 4—figure supplement 1C.
- https://cdn.elifesciences.org/articles/56059/elife-56059-fig4-figsupp1-data2-v1.xlsx
Figure 4—figure supplement 2
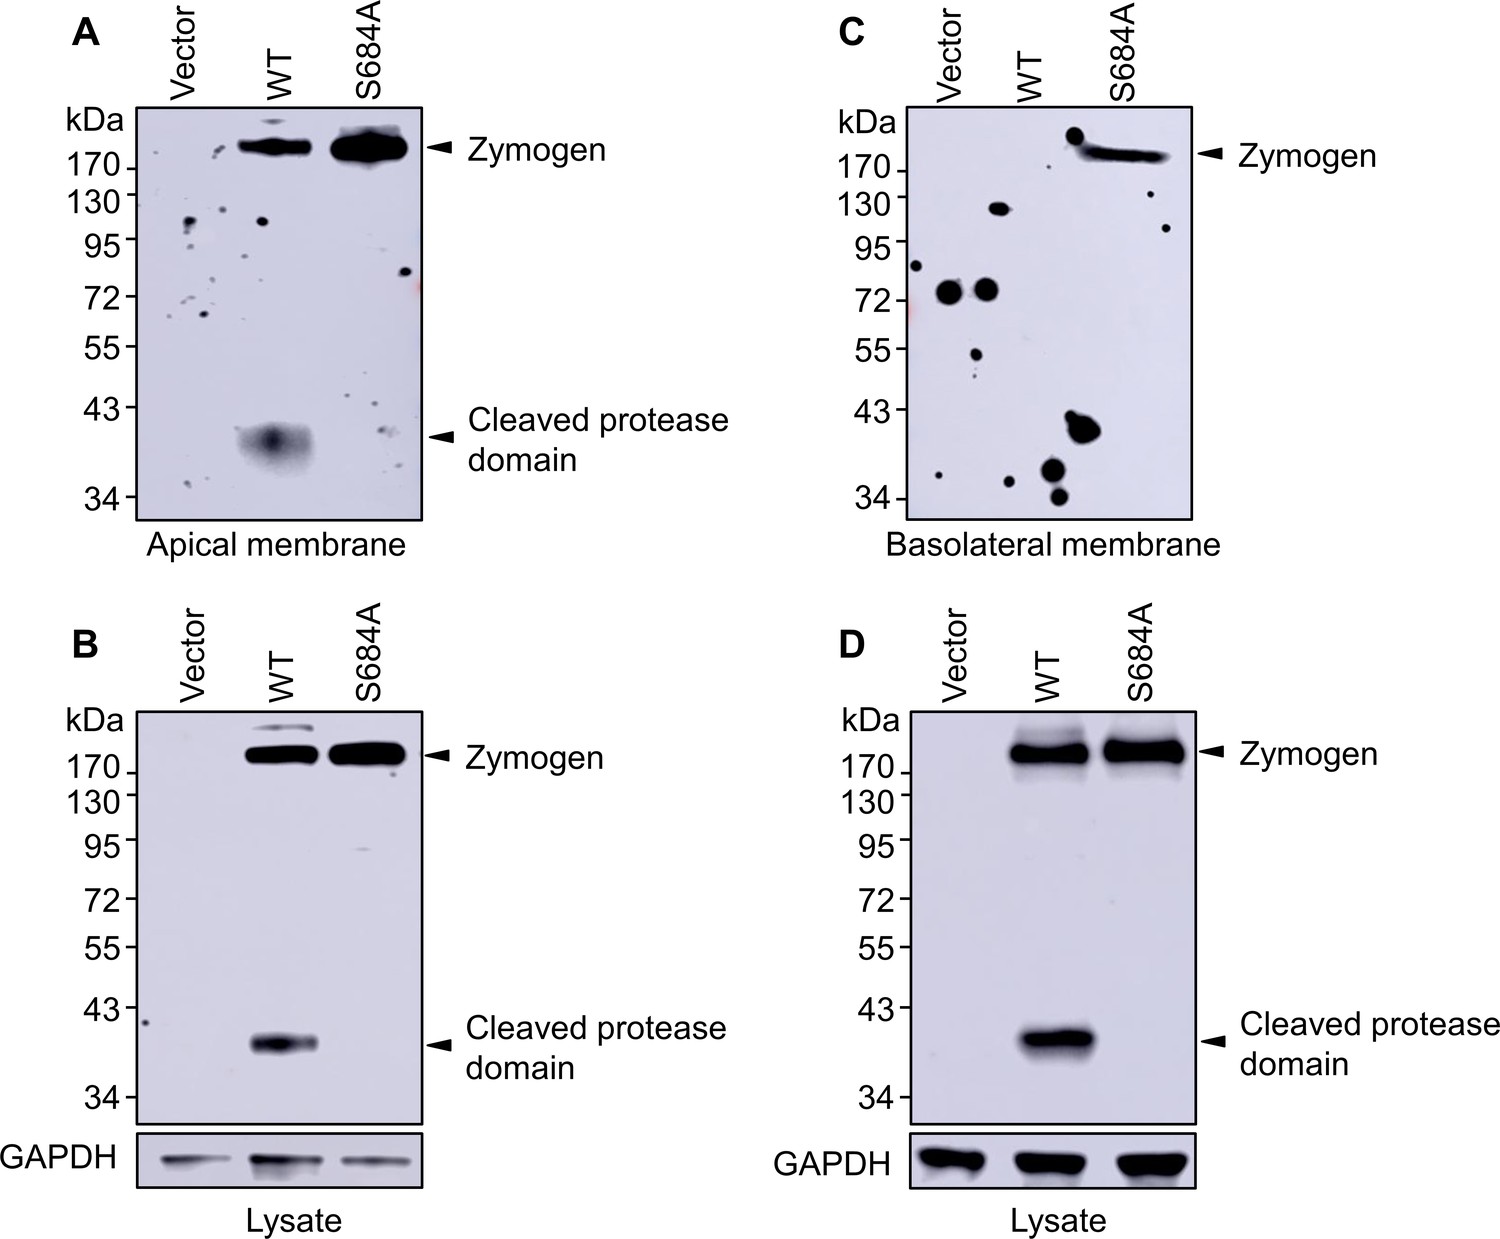
Western blotting of corin proteins in biotin-labeled cell membranes.
MDCK cells stably transfected with a vector or plasmids expressing corin WT and the S684A mutant in Transwell plates were treated with sulfo-NHS-biotin in upper (A and B) or lower (C and D) chambers to label apical and basolateral membrane proteins, respectively. The cells were lysed. Biotin-labeled corin proteins (A and C) were immunoprecipitated and analyzed by western blotting. In parallel, corin proteins in cell lysates were analyzed by western blotting with GAPDH control (B and D). The data are representative of three experiments.
Figure 5 with 1 supplement
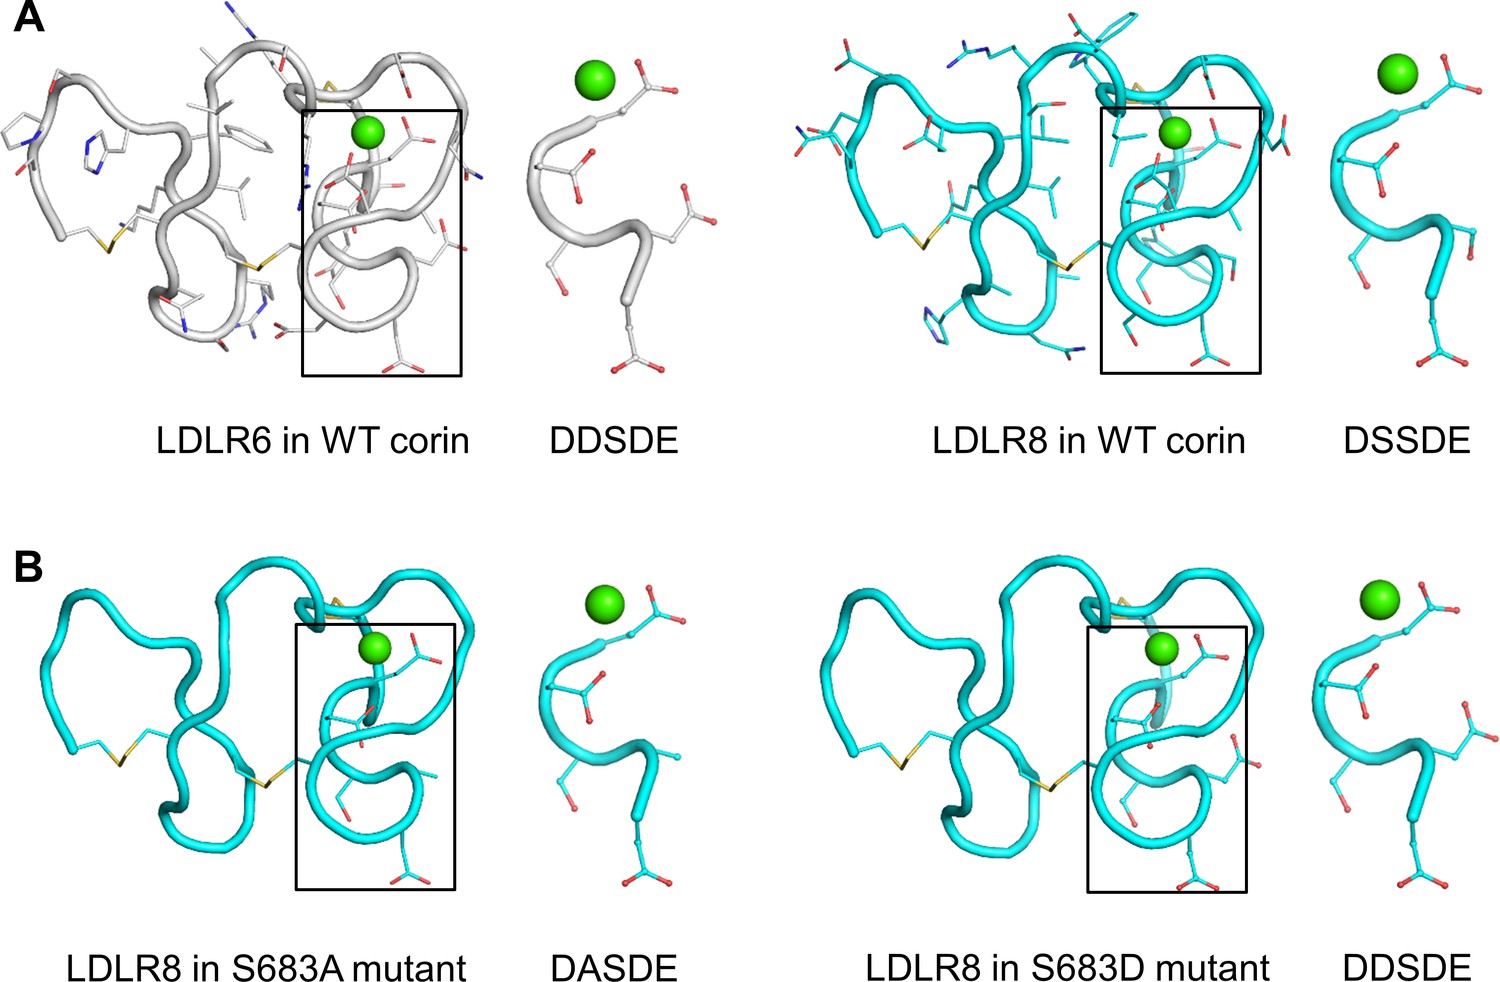
Structure models of corin LDLR6 and LDLR8 modules.
(A) Structure models of human corin LDLR6 (left panel) and LDLR8 (right panel) modules, which were built based on the human VLDLR module four structure. (B) Structure models of corin S683A (left panel) and S683D (right panel) mutants. The conserved DxSDE motifs are indicated in boxes with enlarged images shown on the right side. The overall structures are shown in ribbon models. The side chains and disulfide bonds (yellow) are presented as sticks. The calcium ion is shown as a green sphere.
Figure 5—figure supplement 1
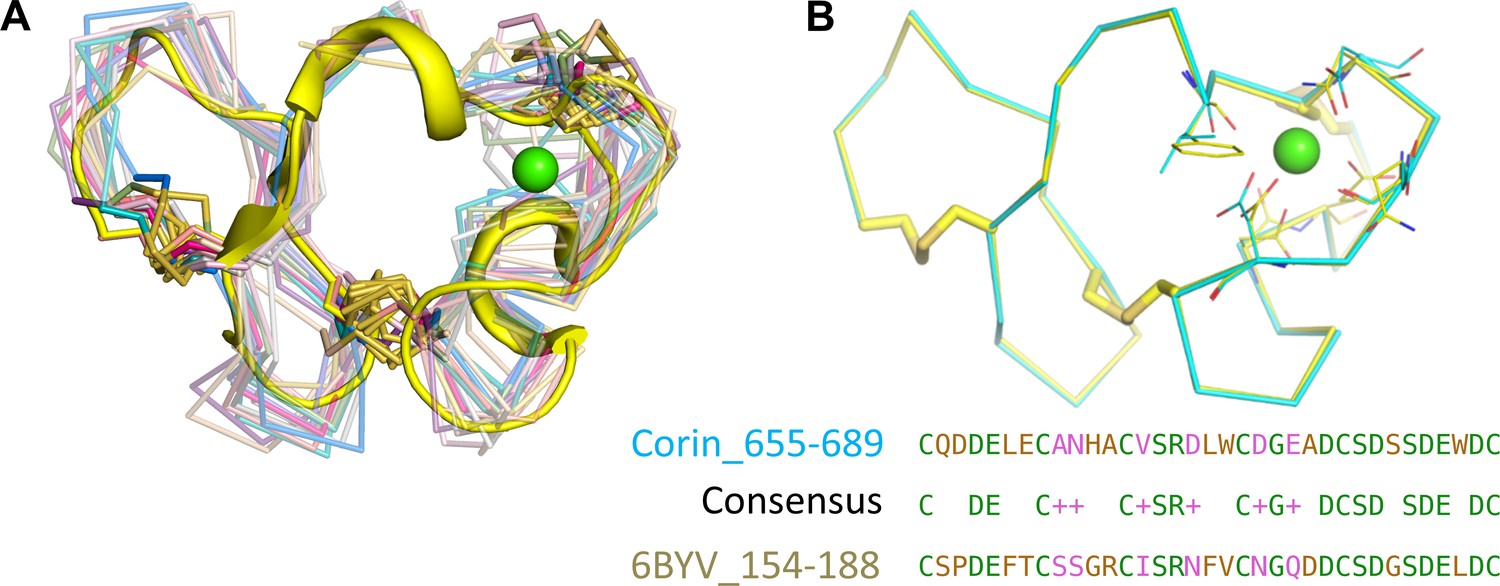
Structure alignments of LDLR modules.
(A) Human corin LDLR8 sequence was used to search the Protein Bata Bank. Among 15 LDLR module homologs identified, the human VLDLR module four structure (6BYV_154–188) (yellow cartoon) had the highest similarity. The other homologous structures are shown in ribbons connected by Cα atoms. The calcium ion in the conserved cage is shown in a green sphere. (B) The superposition of human VLDLR residues 154–188 (yellow) and corin LDLR8 module residues 655–689 (cyan) with the Ca2+-binding cage. The side chains and disulfide bonds are shown as sticks and the calcium ion as a green sphere. The conserved resides between human VLDLR module four and corin LDLR8 module are shown in the alignment.
Figure 6 with 1 supplement

Expression of human CD320 in kidney sections and MDCK cells.
(A) Human CD320 protein contains an N-terminal extracellular region with two LDLR modules and one EGF module, a transmembrane (TM) domain, and a C-terminal cytoplasmic tail. LDLR1 module has a DGSDE motif, whereas LDLR2 module has a DSSDE motif (underlined). (B) Co-staining of neprilysin (brush border marker) (green), corin (red or green) and CD320 (red) in proximal tubules in human kidney sections. Cell nuclei were stained in blue. Boxed areas in top panels are enlarged in lower panels. Scale bars: 10 μm. (C) Corin (green), CD320 (green), and ZO-1 (red) expression in transfected MDCK cells. X-Y and X-Z views are shown in top and lower panels, respectively. Scale bars: 5 μm. Each image represents data from five experiments.
Figure 6—figure supplement 1
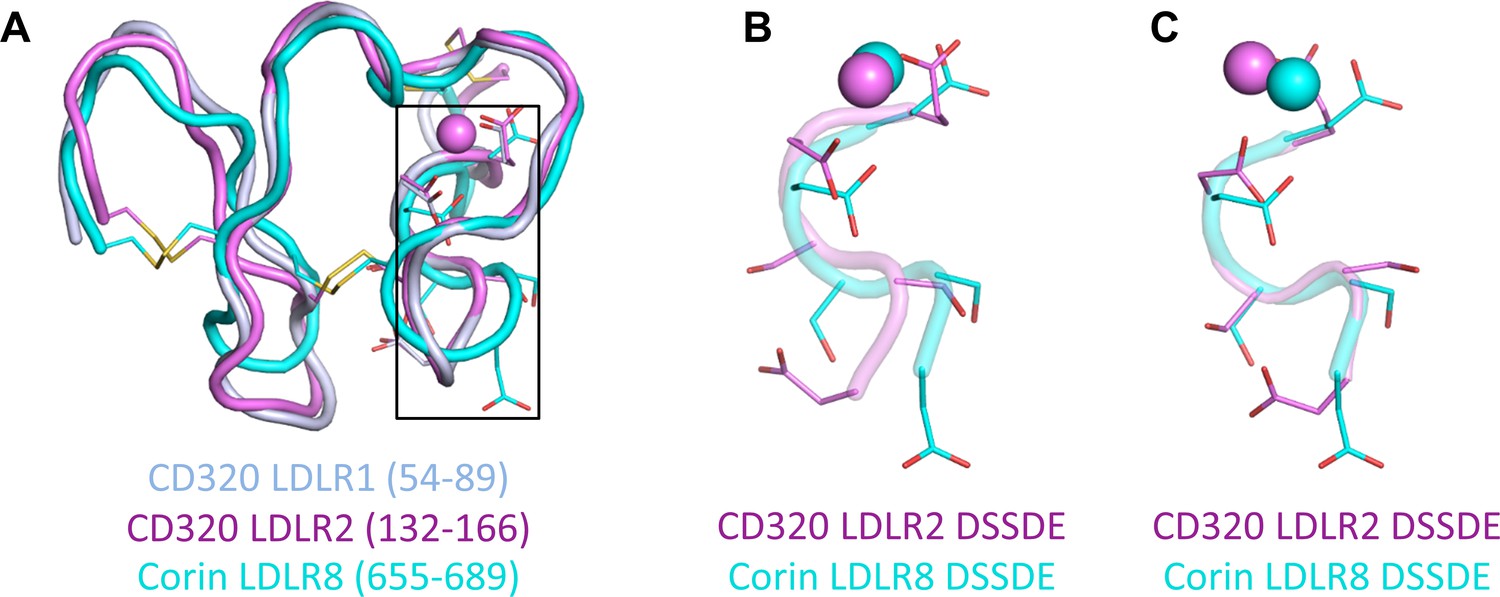
Structural alignments of the LDLR domains of human CD320.
(A) The structure alignments of human CD320 LDLR1 (residues 54–89) (light blue) and LDLR2 (residues 132–166) (violet), and corin LDLR8 module (residues 655–689) (cyan) with the calcium ions (spheres) and side chains and disulfide bonds (sticks). (B) The DSSDE motifs in CD320 LDLR2 and corin LDLR8 modules are enlarged from (A). (C) The local alignment of the DSSDE motifs in CD320 LDLR2 and corin LDLR8 modules.
Figure 7 with 1 supplement
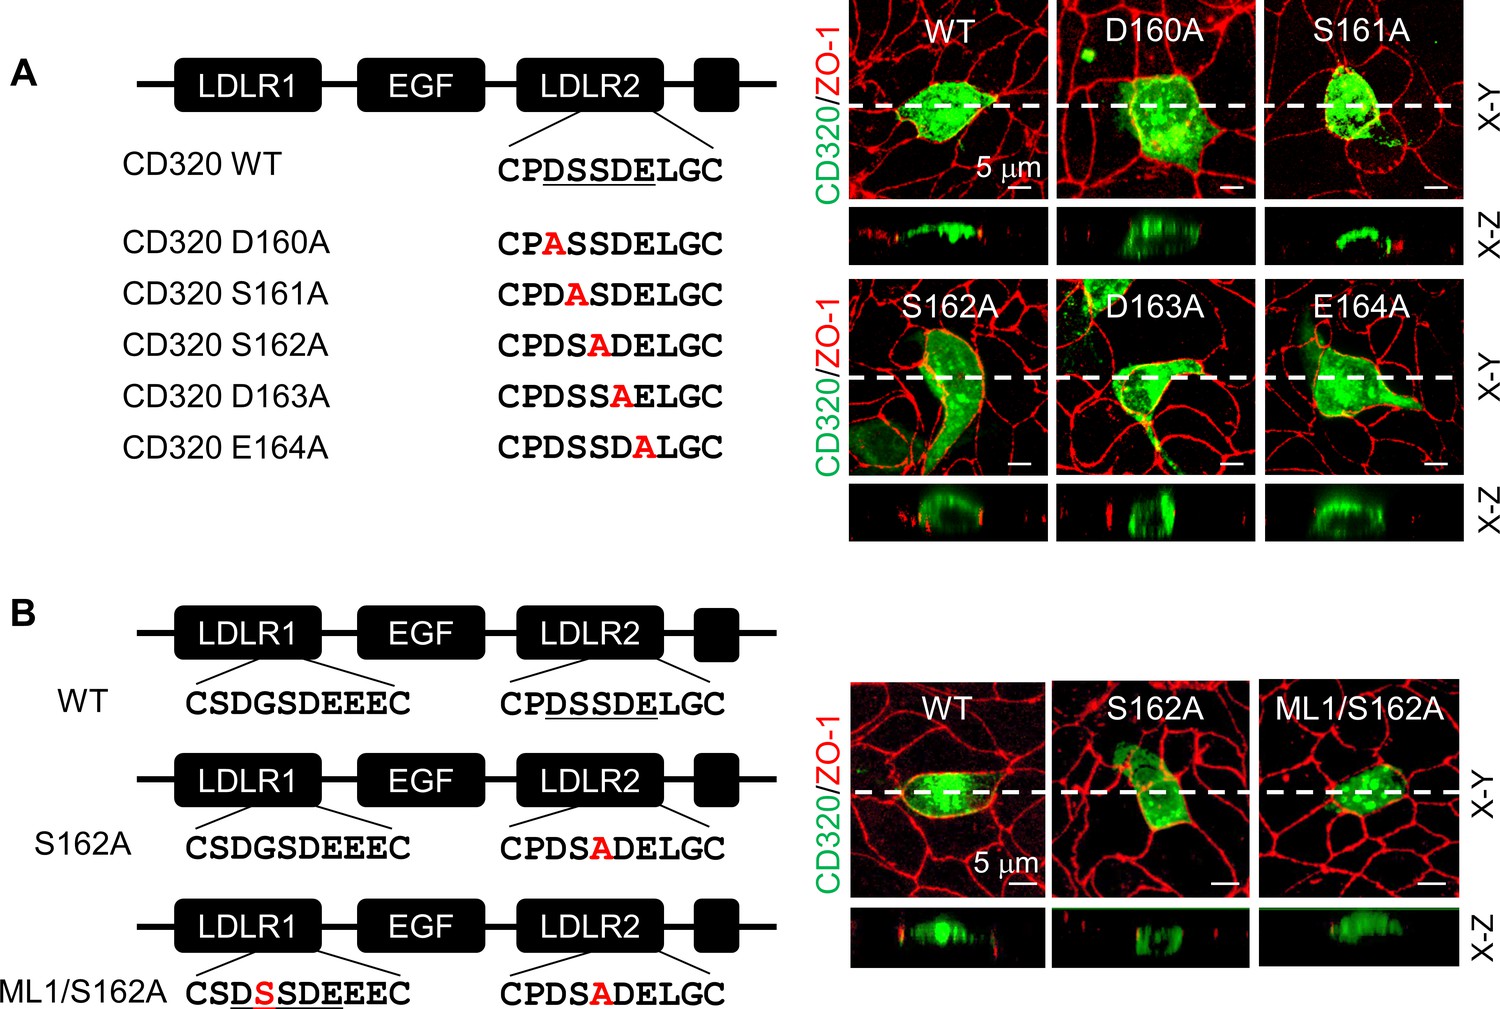
Expression of CD320 mutants with point mutations in the DSSDE motif in LDLR2 module.
(A) Human CD320 WT and mutants with point mutations in LDLR2 module at indicated positions shown in red (D160A, S161A, S162A, D163A, and E164A) were expressed in MDCK cells. CD320 expression (green) on apical and basolateral membranes was examined by immunostaining and confocal microscopy with X-Y (top panels) and X-Z (lower panels) views. ZO-1 protein (red) was used as an indicator. (B) CD320 WT and S162A mutants without (S162A) or with the DSSDE motif created in LDLR1 module (ML1/S162A) expressed in MDCK cells were examined by immunostaining and confocal microscopy. X-Y (top panels) and X-Z (lower panels) views are indicated. Each image represents the data from five experiments. Scale bars: 5 μm.
Figure 7—figure supplement 1
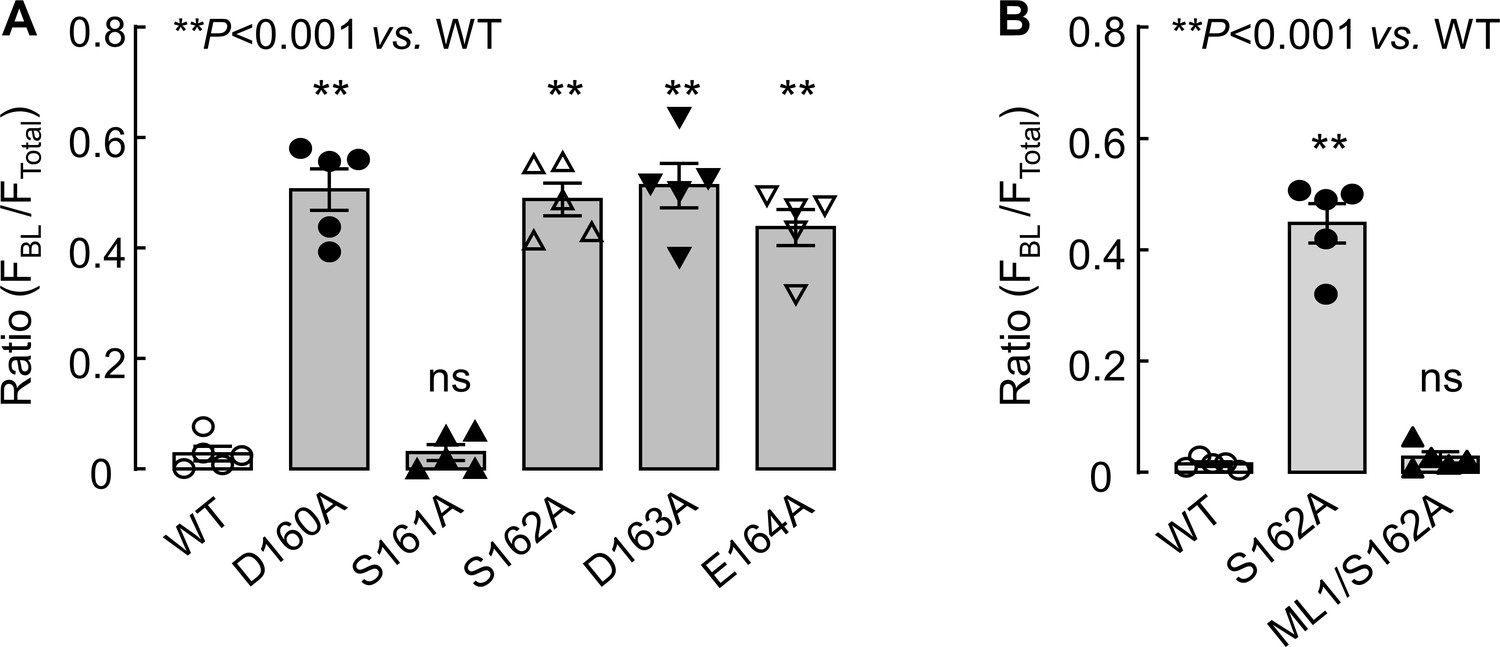
Quantitative analysis of CD320 and corin expression in MDCK cells.
(A and B) CD320 WT and mutant expression in MDCK cells was examined by immunostaining and confocal microscopy. Fluorescent signals along the X-Z axis were analyzed with Image J software to calculate the ratio of FBL/FTotal. The data are mean ± SEM (n = 5).
-
Figure 7—figure supplement 1—source data 1
Source data for Figure 7—figure supplement 1A.
- https://cdn.elifesciences.org/articles/56059/elife-56059-fig7-figsupp1-data1-v1.xlsx
-
Figure 7—figure supplement 1—source data 2
Source data for Figure 7—figure supplement 1B.
- https://cdn.elifesciences.org/articles/56059/elife-56059-fig7-figsupp1-data2-v1.xlsx
Figure 8 with 2 supplements
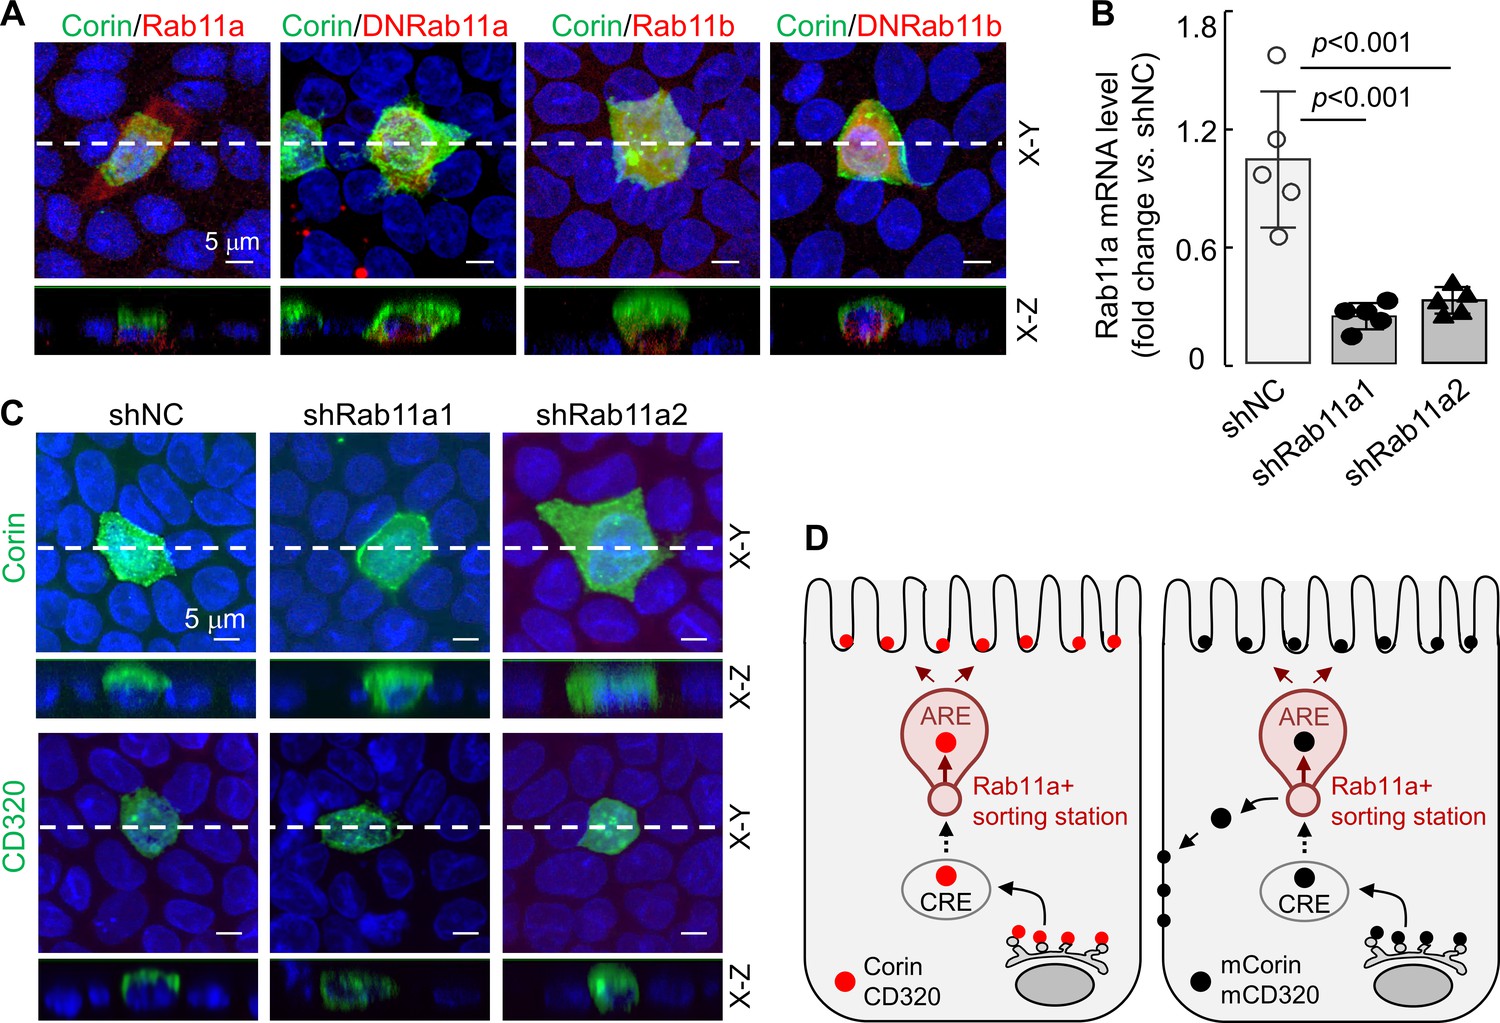
Effects of Rab11a inhibition or knockdown on corin and CD320 expression in MDCK cells.
(A) Corin (green) and Rab11 proteins (red), including Rab11a, Rab11b, and dominant-negative (DN) mutants that were inhibitory to Rab11a and Rab11b, respectively, were co-expressed in MDCK cells. Immunostaining and confocal microscopy were used to analyze corin expression on apical and basolateral membranes, as indicated in X-Y and X-Z views. Each image represents the data from four experiments. Scale bars: 5 μm. (B) qRT-PCR analysis of Rab11a mRNA levels in MDCK cells transfected with two sets of shRNAs targeting the RAB11A gene (shRab11a1 and shRab11a2) or non-targeting control shRNAs (shNC). The data are mean ± SD from five experiments, analyzed by ANOVA. (C) Immunostaining of corin and CD320 in MDCK cells transfected with RAB11A-targeting shRNAs (shRab11a1 and shRab11b) or non-targeting shRNAs (shNC). X-Y and X-Z views are indicated. (D) A proposed model. Corin and CD320 (red dots) are transported from Golgi, likely via central recycling endosomes (CRE), to a Rab11a-positive sorting station, where the DSSDE motif is recognized for apical sorting via apical recycling endosomes (ARE) (left panel). Any pool of corin and CD320 that is endocytosed may also be re-sorted apically via Rab11a-positive endosomes. Mutations altering the DSSDE motif abolish such a mechanism, resulting in apical and basolateral expression of corin and CD320 mutants (right panel).
-
Figure 8—source data 1
Source data for Figure 8B.
- https://cdn.elifesciences.org/articles/56059/elife-56059-fig8-data1-v1.xlsx
Figure 8—figure supplement 1

Effects of Rab11a inhibition on apical corin and CD320 expression.
(A) Corin WT co-expressed with Rab11a, Rab11b, or dominant-negative (DN) Rab11a or Rab11b mutants in MDCK cells was analyzed by immunostaining and confocal microscopy. Quantitative data of the ratio of FBL/FTotal from four experiments are shown. (B) Western blotting of Rab11a protein in MDCK cells transfected with non-targeting (shNC) and two sets of RAB11A-targeting (shRab11a1 and shRab11a2) shRNAs. GAPDH was used as a control. (C) Quantitative data of the ratio of FBL/FTotal for corin and CD320 expression on apical and basolateral membranes in shRNA-transfected MDCK cells from four experiments. Statistical analysis was done with ANOVA. n.s., not significant vs. respective controls in each experiment.
-
Figure 8—figure supplement 1—source data 1
Source data for Figure 8—figure supplement 1A.
- https://cdn.elifesciences.org/articles/56059/elife-56059-fig8-figsupp1-data1-v1.xlsx
-
Figure 8—figure supplement 1—source data 2
Source data for Figure 8—figure supplement 1C.
- https://cdn.elifesciences.org/articles/56059/elife-56059-fig8-figsupp1-data2-v1.xlsx
Figure 8—figure supplement 2
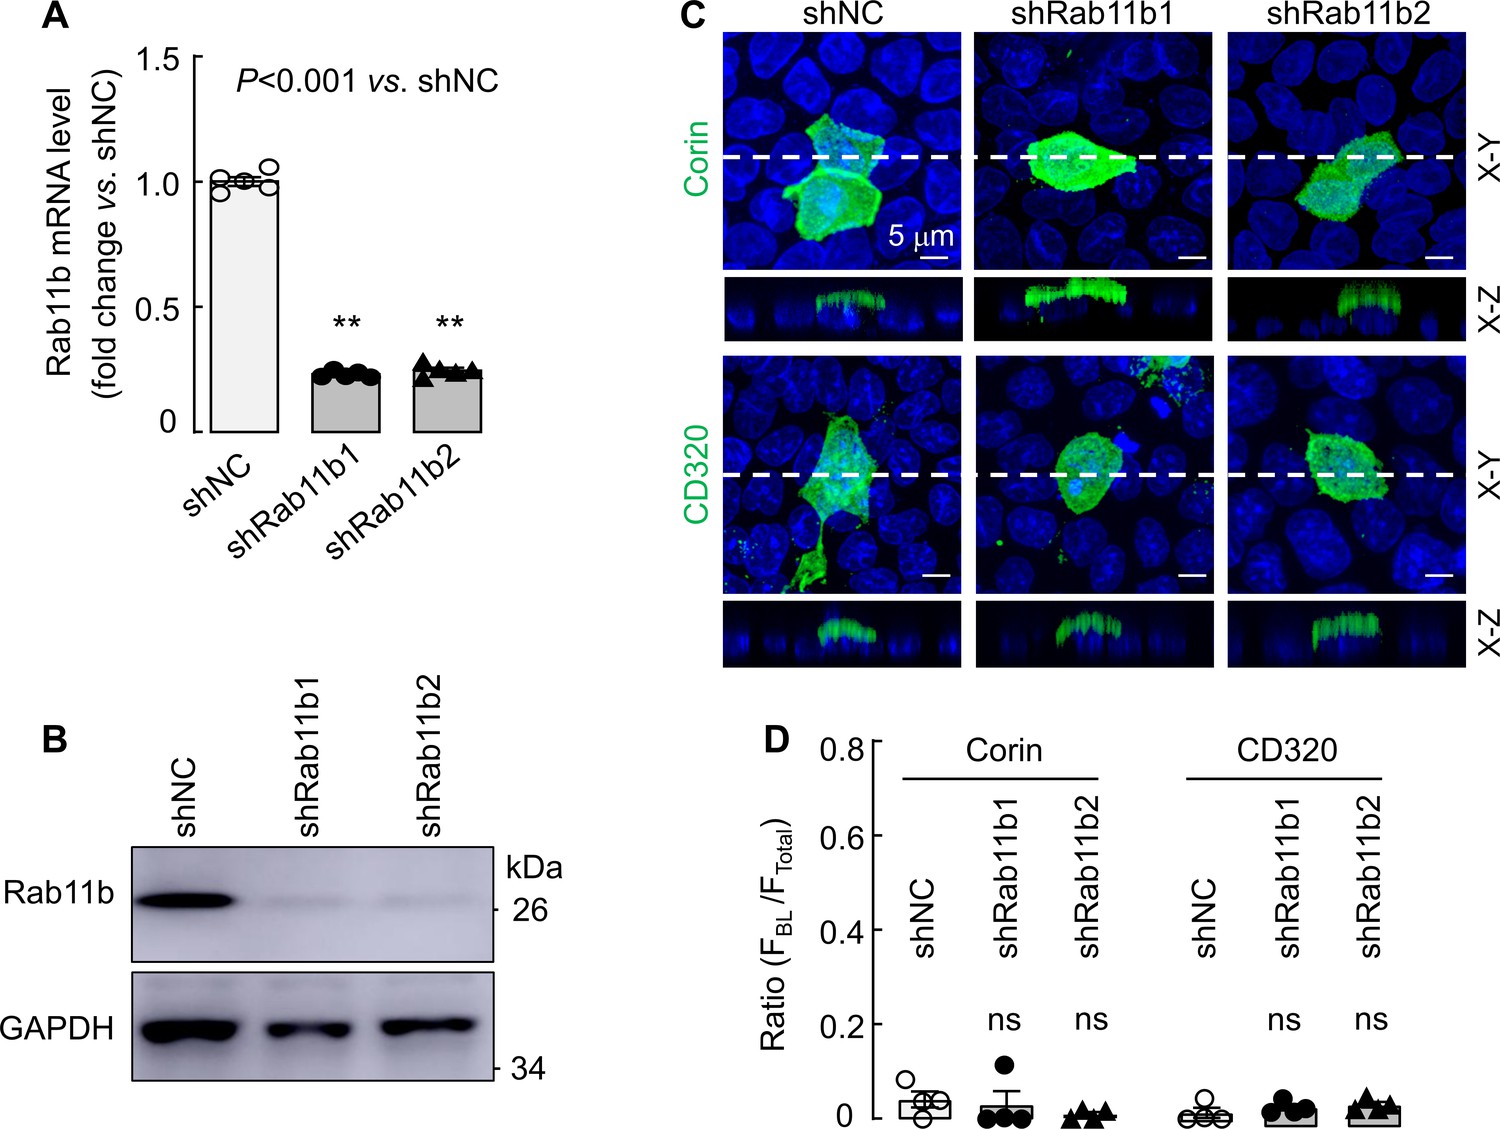
Effects of Rab11b knockdown on corin and CD320 expression in MDCK cells.
MDCK cells were transfected with non-targeting (shNC) or two sets of RAB11B-targeting (shRab11b1 and shRab11b2) shRNAs. Quantitative RT-PCR (A) and western blotting (B) were used to examine Rab11b mRNA and protein expression, respectively, in the shRNA-transfected MDCK cells. (C) Apical corin (top panels) and CD320 (lower panels) expression in the shRNA-transfected MDCK cells was examined by immunostaining and confocal microscopy with X-Y and X-Z views indicated. (D) Quantitative data of the ratio of FBL/FTotal for corin and CD320 expression on apical and basolateral membranes in shRNA-transfected MDCK cells from four experiments. Statistical analysis was done with ANOVA. n.s., not significant vs. respective controls in each experiment. Key Resources Table. Information on genes, cell lines, plasmids and antibodies.
-
Figure 8—figure supplement 2—source data 1
Source data for Figure 8—figure supplement 2A.
- https://cdn.elifesciences.org/articles/56059/elife-56059-fig8-figsupp2-data1-v1.xlsx
-
Figure 8—figure supplement 2—source data 2
Source data for Figure 8—figure supplement 2D.
- https://cdn.elifesciences.org/articles/56059/elife-56059-fig8-figsupp2-data2-v1.xlsx
Tables
Key resources table
| Reagent type (species) or resource | Designation | Source or reference | Identifiers | Additional information |
|---|---|---|---|---|
| Gene (H. sapiens) | CORIN | NCBI | NM_006587.4 | |
| Gene (H. sapiens) | ST14 (matriptase) | NCBI | NM_021978.4 | |
| Gene (H. sapiens) | TMPRSS3 | NCBI | NM_032404.3 | |
| Gene (H. sapiens) | TMPRSS4 | NCBI | NM_019894.4 | |
| Gene (H. sapiens) | TMPRSS5 | NCBI | NM_030770.4 | |
| Gene (H. sapiens) | MME (neprilysin) | NCBI | NM_007287.4 | |
| Gene (H. sapiens) | CD320 | NCBI | NM_016579.4 | |
| Cell line (H. sapiens) | HEK293 | ATCC | CRL-1573 | STR profiling, no mycoplasma contamination |
| Cell line (Canis familiaris) | MDCK | CCTCC* | 3142C0001000000147 | STR profiling, no mycoplasma contamination |
| Cell line (Mus musculus) | HL-1 | Sigma-Aldrich | SCC065 (Originally from William Claycomb) | No mycoplasma contamination |
| Transfected construct (H. sapiens) | Corin plasmid | PMID:14559895 | pcDNA 3.1/V5-His | |
| Transfected construct (H. sapiens) | Neprilysin plasmid | PMID:27343265 | pCMV3-C-Flag | |
| Transfected construct (H. sapiens) | Hepsin plasmid | PMID:31395734 | pcDNA 3.1/V5-His | |
| Transfected construct (H. sapiens) | Matriptase plasmid | This paper | pcDNA 3.1/V5-His | |
| Transfected construct (H. sapiens) | TMPRSS3 | This paper | pcDNA 3.1/V5-His | |
| Transfected construct (H. sapiens) | TMPRSS4 | This paper | pcDNA 3.1/V5-His | |
| Transfected construct (H. sapiens) | TMPRSS5 | This paper | pcDNA 3.1/V5-His | |
| Transfected construct (H. sapiens) | CD320 | This paper | pcDNA 3.1/N-Flag | |
| Transfected construct (Canis familiaris) | Rab11a | This paper | pCMV3-C-OFPSpark | |
| Transfected construct (Canis familiaris) | Rab11b | This paper | pCMV3-C-OFPSpark | |
| Transfected construct (H. sapiens) | Corin mutants | This paper | pcDNA 3.1/V5-His | |
| Transfected construct (H. sapiens) | CD320 mutants | This paper | pcDNA 3.1/N-Flag | |
| Antibody | Anti-corin (rabbit polyclonal) | PMID:27343265 | 1:1000 | |
| Antibody | Anti-corin (mouse monoclonal) | PMID:22437503 | 1:1000 | |
| Antibody | Anti-CD320 (rabbit polyclonal) | Atlas Antibodies | HPA073489 | 1:10 |
| Antibody | Anti-neprilysin (mouse monoclonal) | Boster | BM3411 | 1:100 |
| Antibody | Anti-Flag (mouse monoclonal) | Sigma | F1804 | 1:500 |
| Antibody | Anti-V5 (mouse monoclonal) | Thermo Fisher | R96025 | 1:500 |
| Antibody | Anti-V5-HRP (mouse monoclonal) | Thermo Fisher | R96125 | 1:5000 |
| Antibody | Anti-ZO-1 (rabbit polyclonal) | Cell Signaling | 8193 s | 1:300 |
| Antibody | Anti-IgG-Alexa-488 (donkey polyclonal) | Thermo Fisher | A32766 | 1:500 |
| Antibody | Anti-IgG-Alexa-594 (goat polyclonal) | Thermo Fisher | A32740 | 1:500 |
-
*CCTCC: China Center for Type Culture Collection.
Additional files
Download links
A two-part list of links to download the article, or parts of the article, in various formats.
Downloads (link to download the article as PDF)
Open citations (links to open the citations from this article in various online reference manager services)
Cite this article (links to download the citations from this article in formats compatible with various reference manager tools)
A conserved LDL-receptor motif regulates corin and CD320 membrane targeting in polarized renal epithelial cells
eLife 9:e56059.
https://doi.org/10.7554/eLife.56059


