The identification of dual protective agents against cisplatin-induced oto- and nephrotoxicity using the zebrafish model
- Dalhousie University, Department of Microbiology and Immunology, Canada
- IWK Health Centre, Department of Pediatrics, Canada
- CHEO Research Institute, Canada
- Dalhousie University, Department of Physiology & Biophysics, Canada
- McMaster University, Department of Global Health, Canada
- University of Toronto, Department of Molecular Genetics, Canada
- Appili Therapeutics Inc, Canada
- Dalhousie University, Faculty of Dentistry, Canada
Figures
Figure 1 with 1 supplement
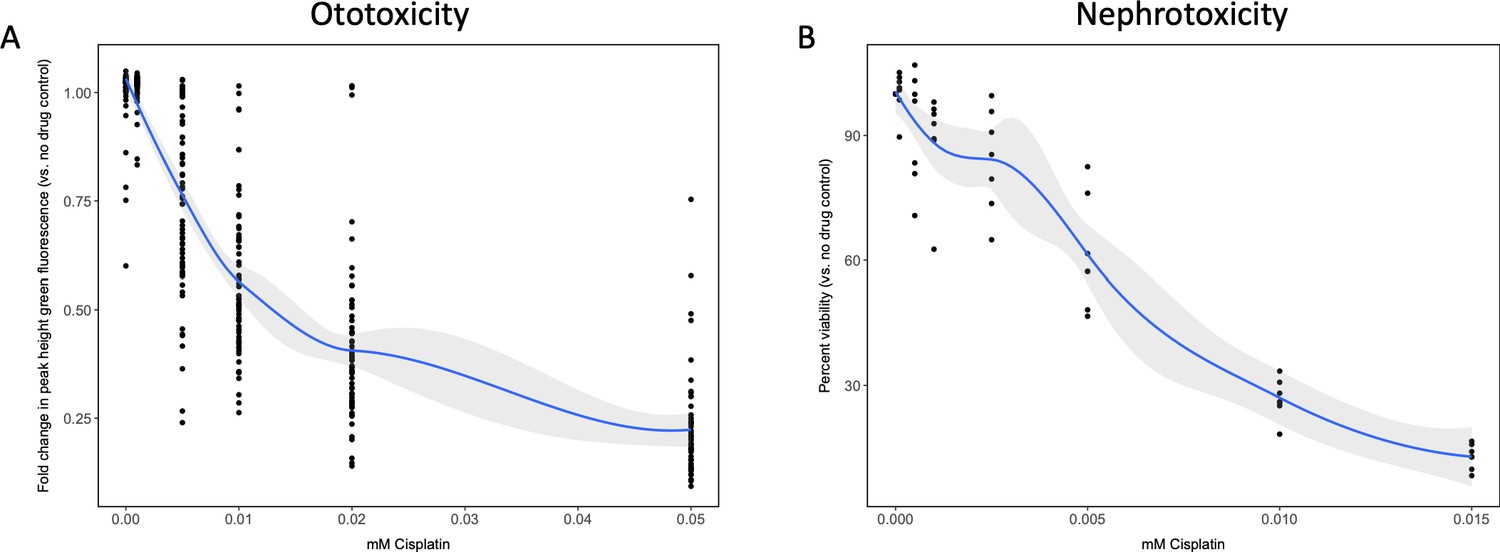
Dose–response curves demonstrate decreasing neuromast integrity and human proximal tubule cell viability with increasing doses of cisplatin.
(A) Groups of approximately 50 casper zebrafish larvae were treated with increasing doses of cisplatin, by addition to the E3 media surrounding the larvae, at 72 hr post-fertilization (hpf). The following day, larval neuromasts were stained with 2 µM YO-PRO1, then were subjected to Biosorter-mediated fluorescence profiling. Peak Height (PH) of green fluorescence is displayed, relative to untreated controls. Each data point represents an individual larva. Dose–response relationship is represented by the blue line, which was calculated with a four-parameter log-logistic model, as described in a relevant study (Ritz et al., 2015). Modeling was done in R with a drc extension package. Grey-shaded area represents the 95% confidence interval (CI) of this line. (B) HK-2 human proximal tubule cells were treated with increasing concentrations of cisplatin for 48 hr. Cells were rinsed, then an alamarBlue assay was performed as per the manufacturer’s instructions. Data are represented as % viability, in comparison with untreated cells. N = 4, an average of at least two wells was measured per replicate. Dose–response analysis performed as in A).
Figure 1—figure supplement 1
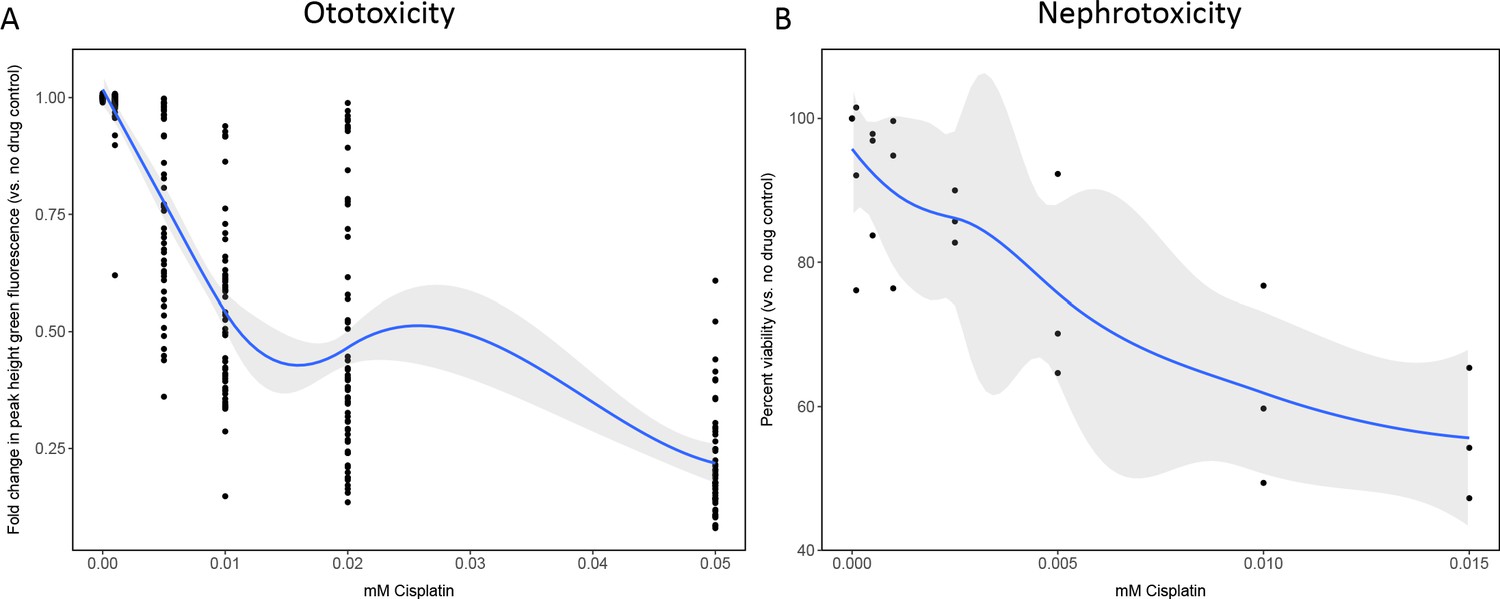
Dose–response curves demonstrate decreasing neuromast integrity and human proximal tubule cell viability with increasing doses of cisplatin.
(A) Groups of 50 casper zebrafish larvae were treated with increasing doses of cisplatin, by addition to the E3 media, at 72 hr post-fertilization (hpf). Two days later, larvae were stained with 2 µM YO-PRO1, then were subjected to Biosorter-mediated fluorescence profiling. Peak Height (PH) of green fluorescence is displayed, relative to untreated controls. Each data point represents an individual larva. Dose–response relationship is represented by the blue line, calculated with a four-parameter log-logistic model, as described in a relevant study (Ritz et al., 2015). Modeling was done in R with a drc extension package. Grey-shaded area represents the 95% confidence interval (CI) of this line. (B) HK-2 human proximal tubule cells were treated with increasing concentrations of cisplatin for 24 hrs. Cells were rinsed, then an alamarBlue assay was performed as per the manufacturer’s instructions. Data are represented as % viability, in comparison with untreated cells. N=3, an average of at least two wells was measured per replicate. Dose response analysis performed as in A).
Figure 2
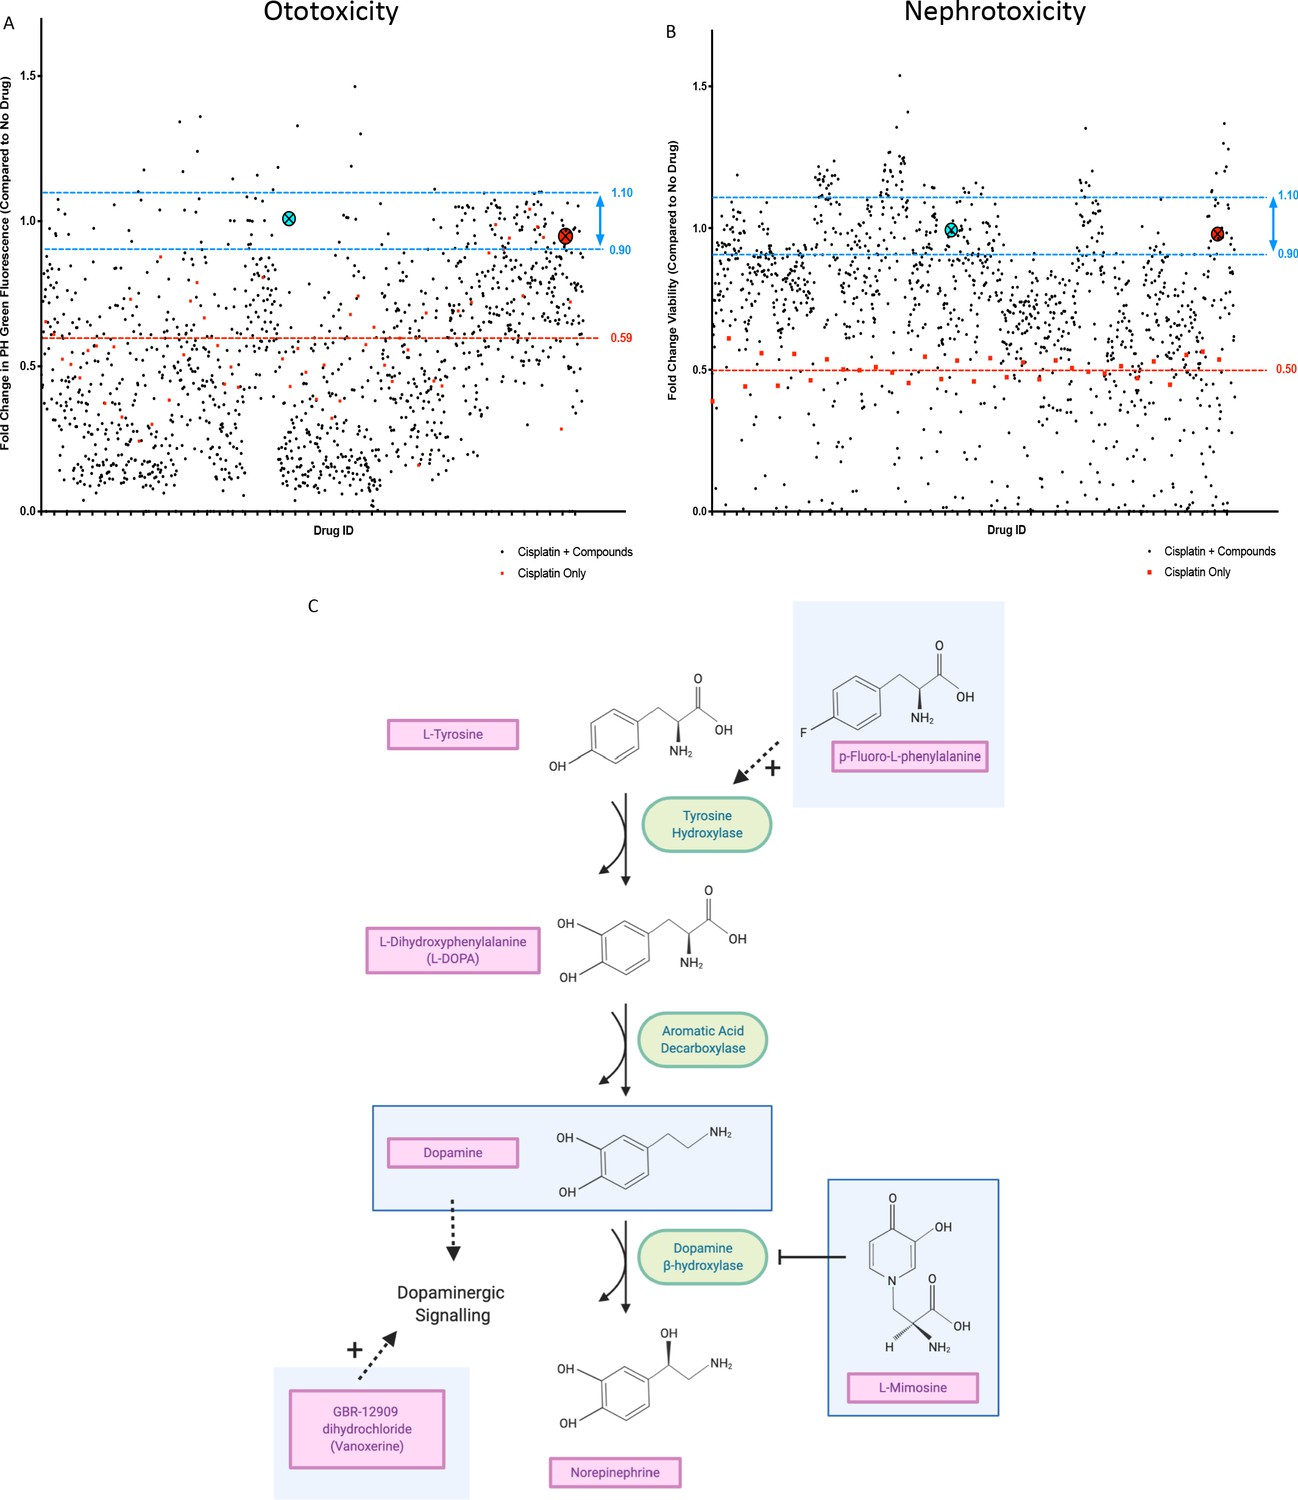
In vivo ototoxicity and in vitro nephrotoxicity drug screens reveal 22 compounds that are potentially oto- and nephroprotective, including dopamine and L-mimosine.
(A) Zebrafish larvae were pretreated with either vehicle control, or each of the compounds from the Sigma LOPAC1280 library of pharmacologically active compounds at a final concentration of 0.01 mM. Three hours later, at 72 hr post-fertilization (hpf), larvae were treated with either vehicle control or cisplatin, at a concentration of 0.02 mM. 48 hr later, larval neuromasts were stained with YO-PRO1 and subjected to fluorescence profiling using a Biosorter. Peak Height (PH) green fluorescence is displayed, in comparison with untreated larvae. Each compound was tested on four larvae and the average is displayed. The aqua point in the X represents dopamine hydrochloride and the red point with the X represents L-mimosine. The blue lines correspond to 0.9–1.1 fold of the control value and the red line corresponds to the average of fish treated with cisplatin alone. (B) HK-2 kidney proximal tubule cells were either treated with vehicle control, 0.005 mM cisplatin alone, or 0.005 mM cisplatin + each of the compounds from the Sigma LOPAC1280 drug library at a final concentration of 0.01 mM. Two days later, an alamar Blue assay was performed according to the manufacturer’s instructions to determine cell viability. Fold change in viability (in comparison with vehicle control treated cells) is displayed. The average of two wells was used per drug. Highlighted points and lines correspond to those in A). (C) The dopamine biosynthesis pathway consists of intermediate molecules and enzymes (indicated with green ovals). The compounds that were hits in both assays are shown in light blue boxes. L-mimosine is able to inhibit dopamine beta-hydroxylase. P-fluoro-L-phenylalanine can act as a substrate for tyrosine hydroxylase. GBR-12909 dihydrochloride (aka. Vanoxerine) is a selective dopamine reuptake inhibitor. All these compounds could have the net pharmacological effect of increasing available dopamine levels.
Figure 3
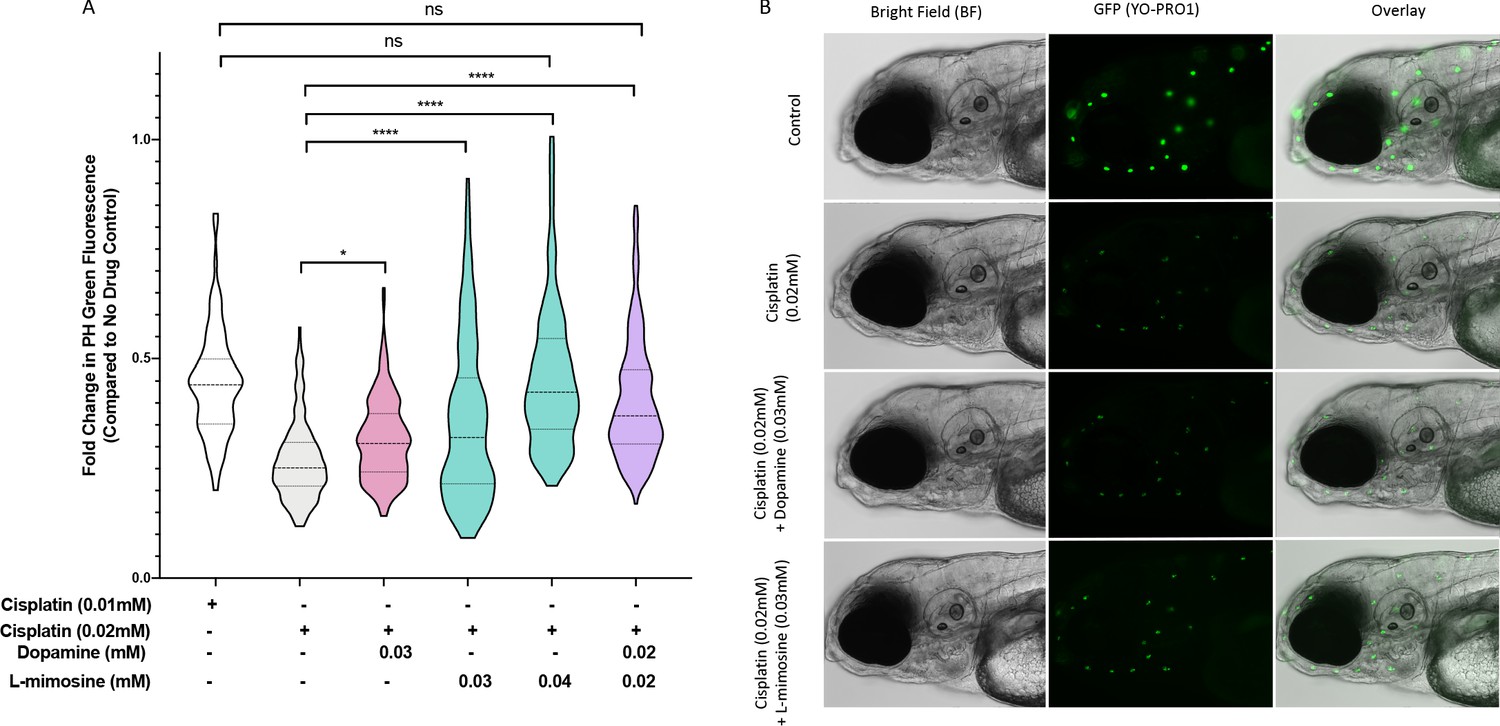
Dopamine and L-mimosine pretreatment partially protects zebrafish larval neuromasts from cisplatin-induced damage.
(A) Following dose and scheduling optimization, groups of larvae at 60 hr post-fertilization (hpf) were treated with either vehicle control or the indicated concentrations of protective agents. Larvae were rinsed then treated with either vehicle control or cisplatin at the indicated concentration at 72 hpf. The following day, the larval neuromasts were stained with 2 µM YO-PRO1 then subjected to fluorescence profiling using a Biosorter. Fold change in Peak Height (PH) fluorescence is displayed, compared to untreated controls.*=p<0.05, ****=p<0.001, as per Kruskal-Wallis with a Dunn’s multiple comparison test between indicated groups. Violin plot displays the median in a solid line and the interquartile range with hashed lines, with surrounding data points outlined by the shape. N=3, average of 75 larvae/treatment/replicate. (B) Representative images of larvae measured in A), with the treatment types as shown, viewed with brightfield (BF) or fluorescence (green neuromasts, YO-PRO1), or overlay of BF and fluorescence. Images acquired with an Axio Observer Z1 microscope at 20X.
Figure 4
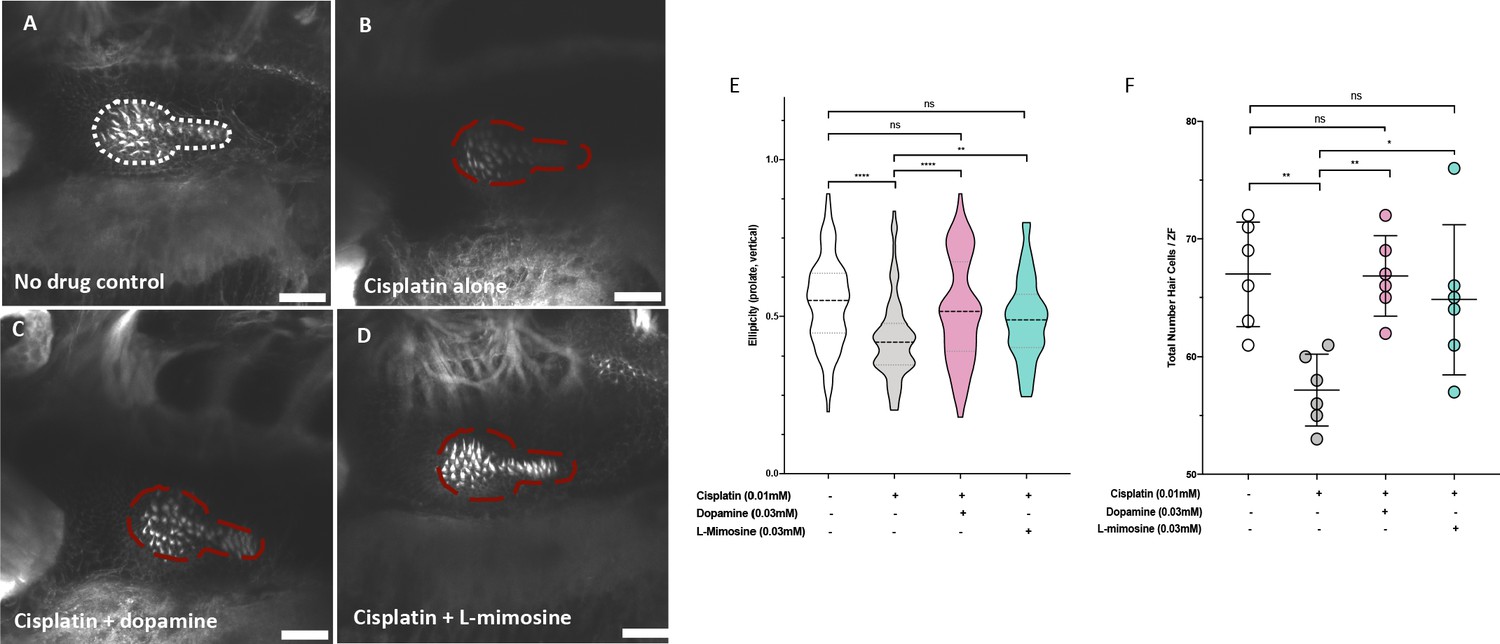
Dopamine and L-mimosine pretreatment protects zebrafish inner ear hair cells from cisplatin-induced damage.
Casper zebrafish larvae were first pretreated at 60 hr post-fertilization (hpf) with either vehicle control (A and B), 0.03 mM dopamine (C), or 0.03 mM L-mimosine (D). Larvae were then rinsed at 72 hpf and treated with either vehicle control (A) or 0.01 mM cisplatin B-D). Two days later (48 hr cisplatin treatment), larvae were fixed, permeabilized, then stained with AlexaFluor488-Phalloidin, then imaged with a Zeiss LSM510 confocal microscope. Larvae mounted laterally with ventral side at the top. Scale bar = 20 µM. N=6/treatment. White line dashed represents the average posterior macula placode of three control larvae, red dashed line represents this average area superimposed onto other treatments. Note that these images were taken with the exact same settings to ensure accurate representation. (E) To perform topological analysis of the hair cells, the original Zeiss LSM files of 2D images ranging from 27 to 42 μm in depth were imported to Imaris v.X64 9.1.2 software for surface reconstruction. Ellipticity (prolate, or elongation around the long axis) was used as a measure of the status of the hair cells with healthier hair cells exhibiting a higher prolate ellipticity. **=p<0.01, ****=p<0.001, as per Kruskal-Wallis testing with a Dunn’s multiple comparison test. (F) Hair cell numbers were counted using the Cell Counter plugin in ImageJ using the same maximum projection images used in E). Individual points represent the number of hair cells/larvae. *=p<0.05, **=p<0.01, and ****=p<0.001, as per one-way ANOVA with a Tukey post-test. N = 6 larvae/treatment with 16 hair cells measured/larvae.
Figure 5 with 2 supplements
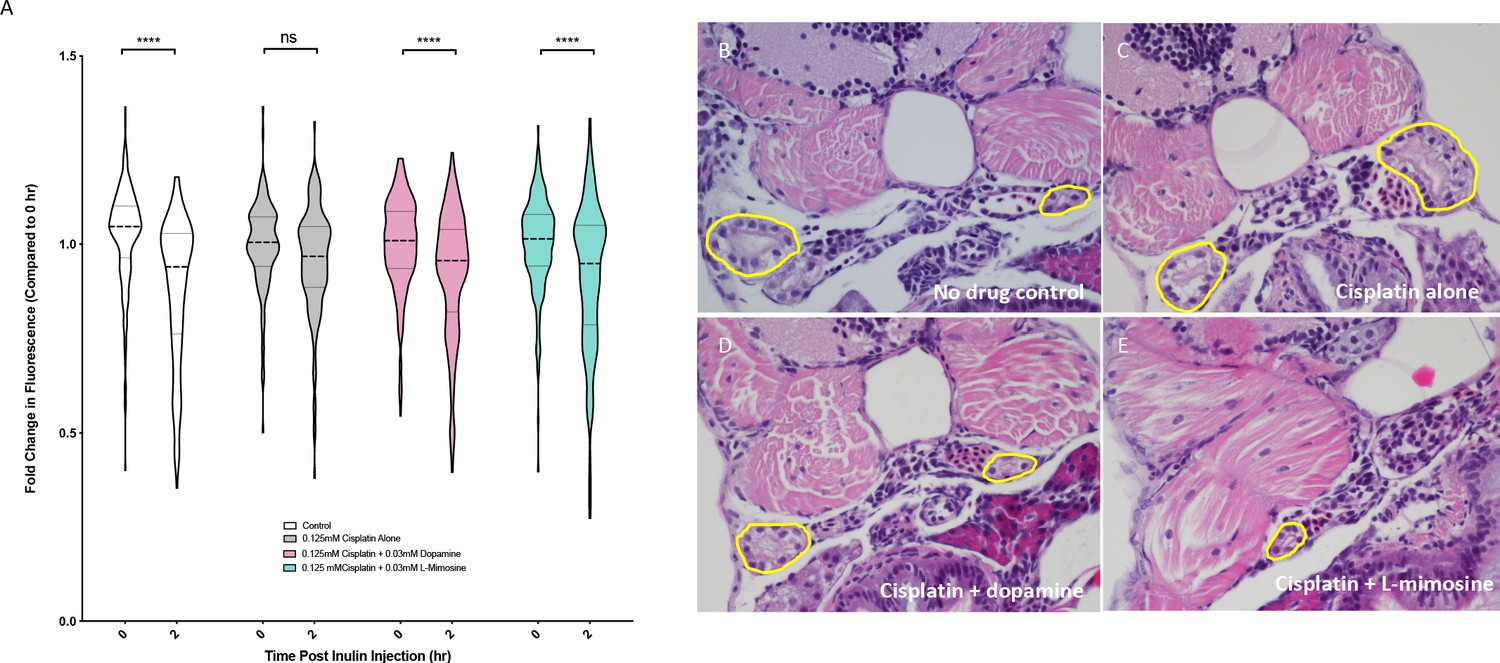
Dopamine and L-mimosine pretreatment preserves the glomerular filtration rate (GFR) from cisplatin-induced damage, but cisplatin treatment has no detectable change on pronephros histology.
(A) Casper zebrafish larvae were treated at 60 hr post-fertilization (hpf) with either vehicle control or the indicated protective agents. At 72 hpf, larvae were rinsed then treated with either vehicle control or 0.125 mM cisplatin for 24 hr. Larvae were then injected via the common cardinal vein with FITC-inulin, then measured for fluorescence swiftly with the Biosorter. Larvae were rinsed then measured 2 hr later. Fold change in overall larval fluorescence is represented in relation to 0 hr. ****=p<0.001, as per two-way ANOVA with a Tukey post-test. Three replicates, with 50 larvae/treatment group/time point minimum. Representative images of larvae can be found in Figure 5—figure supplement 1d. Larvae were treated as in (A) and were fixed at either 24 hr post-treatment (B–E) or at 72hpt (Figure 5—figure supplement 2a-d). Larvae were pre-embedded in low melting point agarose, then in paraffin, then sectioned and stained with H and E. (B) Control, (C) Cisplatin only, (D) Cisplatin + 0.03 mM dopamine, (E) Cisplatin + 0.03 mM L-mimosine. No significant differences were observed in the proximal tubular histology.
Figure 5—figure supplement 1
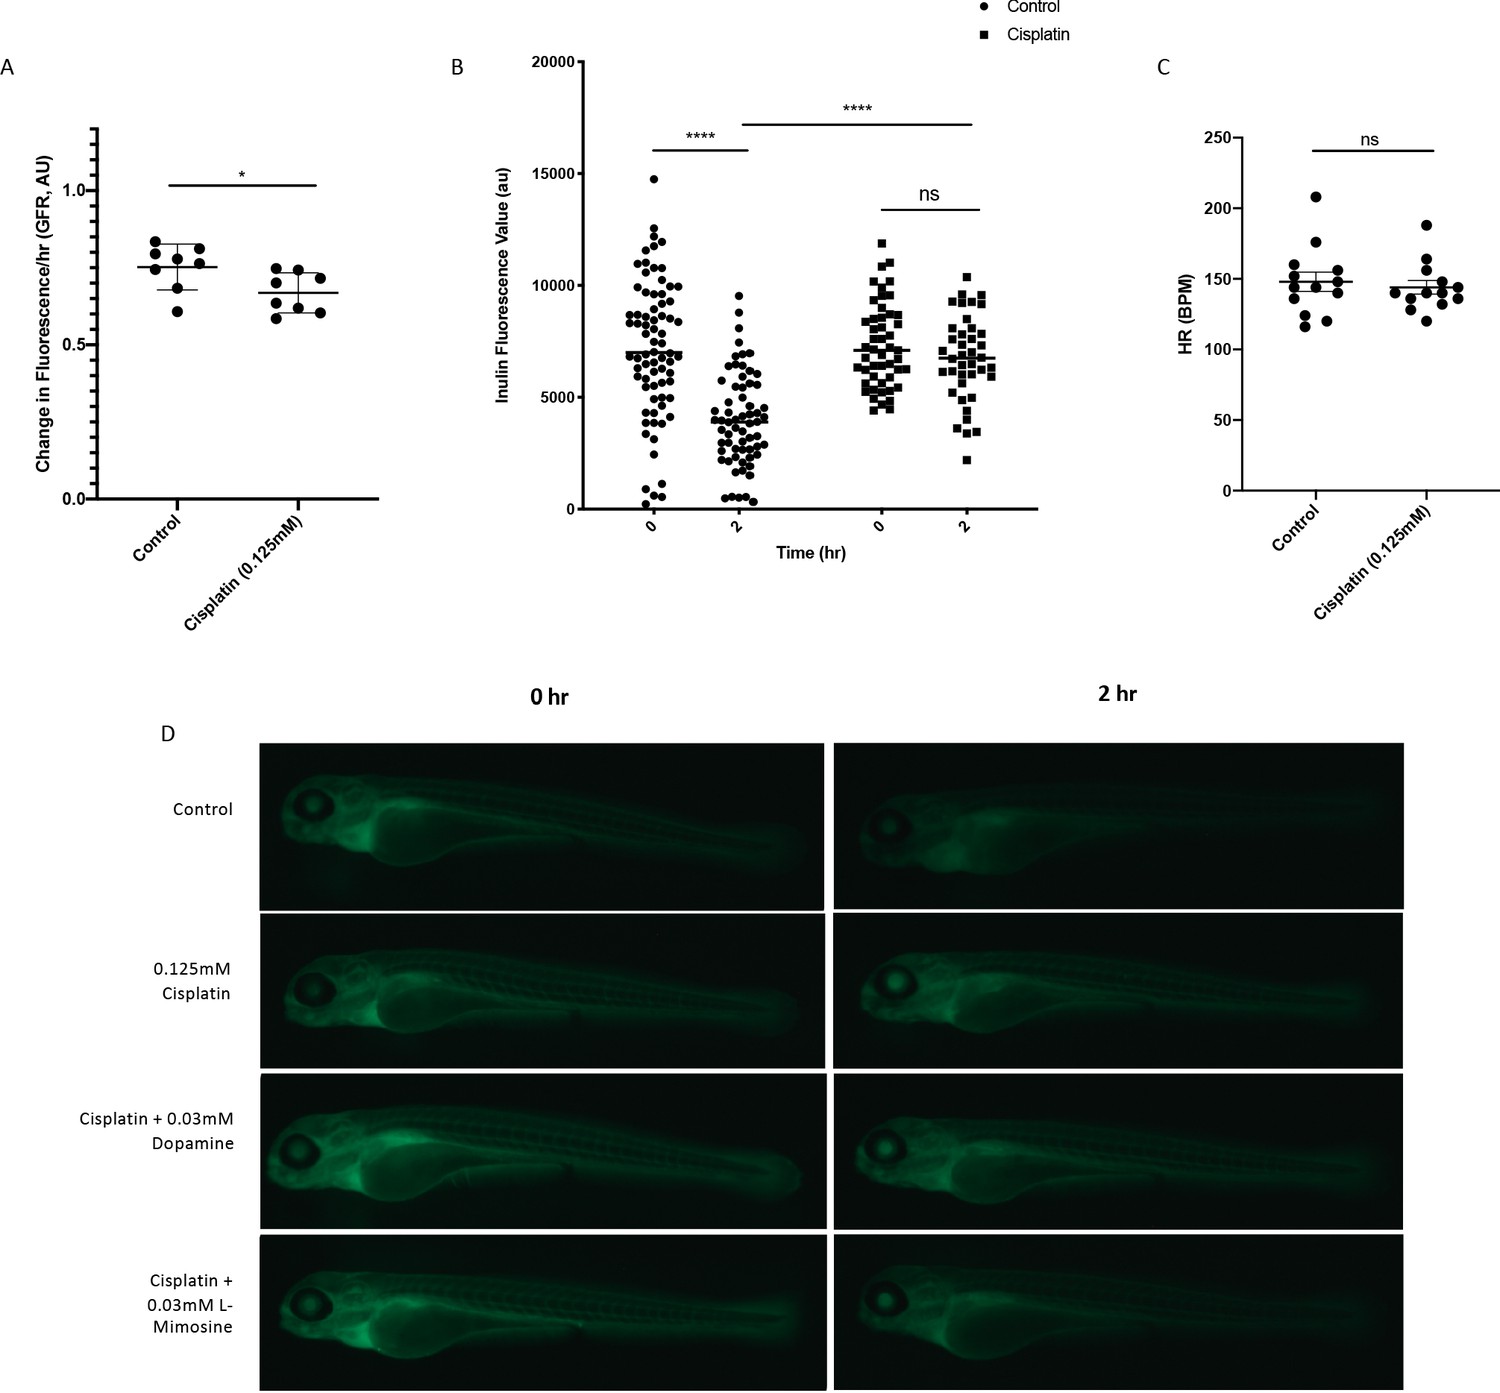
Optimization of the experimental detection of cisplatin-induced decreases in glomerular filtration rate (GFR) in zebrafish larvae.
Casper zebrafish larvae were treated at 72 hr post-fertilization (hpf) with either vehicle control or 0.125 mM cisplatin for 24 hr. Larvae were rinsed, then injected via the common cardinal vein with FITC-inulin. (A) Inulin-injected larvae were imaged immediately after injection and 2 hr after injection. Larval fluorescence was measured using ImageJ software using a region of interest (ROI) superimposed on the tail of each larvae. The change in fluorescence between the two time points (a relative measure of GFR) was calculated, and is displayed in arbitrary units (AU). Each data point represents the change in fluorescence of an individual larvae. Error bars represent SEM. *=p<0.05, as per two-tailed student’s t-test. N=2, at least four larvae/treatment group/experiment. (B) Larvae were treated as in A), but were measured for overall larval fluorescence immediately after injection and 2 hr after injection using a Biosorter. Results display raw larval fluorescence values. Each data point represents an individual larvae at each time point. ****=p<0.001, as per two-way ANOVA with a tukey post-test. N=1, with at least 50 larvae/treatment group. (C) Heart rate (HR) was measured in larvae treated as in A), to determine if changes in HR had an effect on the measured GFR. There was no significant difference between HR regardless of treatment, as per two-tailed student’s t-test. Each data point represents an individual larvae. N=2, with at least six larvae/treatment group. (D) Representative larvae from the experiment described in the main text, and found in Figure 5a. Briefly, casper zebrafish larvae were treated at 60 hpf with either vehicle control or the indicated protective agents. At 72 hpf, larvae were rinsed then treated with either vehicle control or 0.125 mM cisplatin for 24 hr. Larvae were then injected via the common cardinal vein with FITC-inulin, then were imaged using a Zeiss SteREO Discovery.V20 dissecting microscope.
Figure 5—figure supplement 2
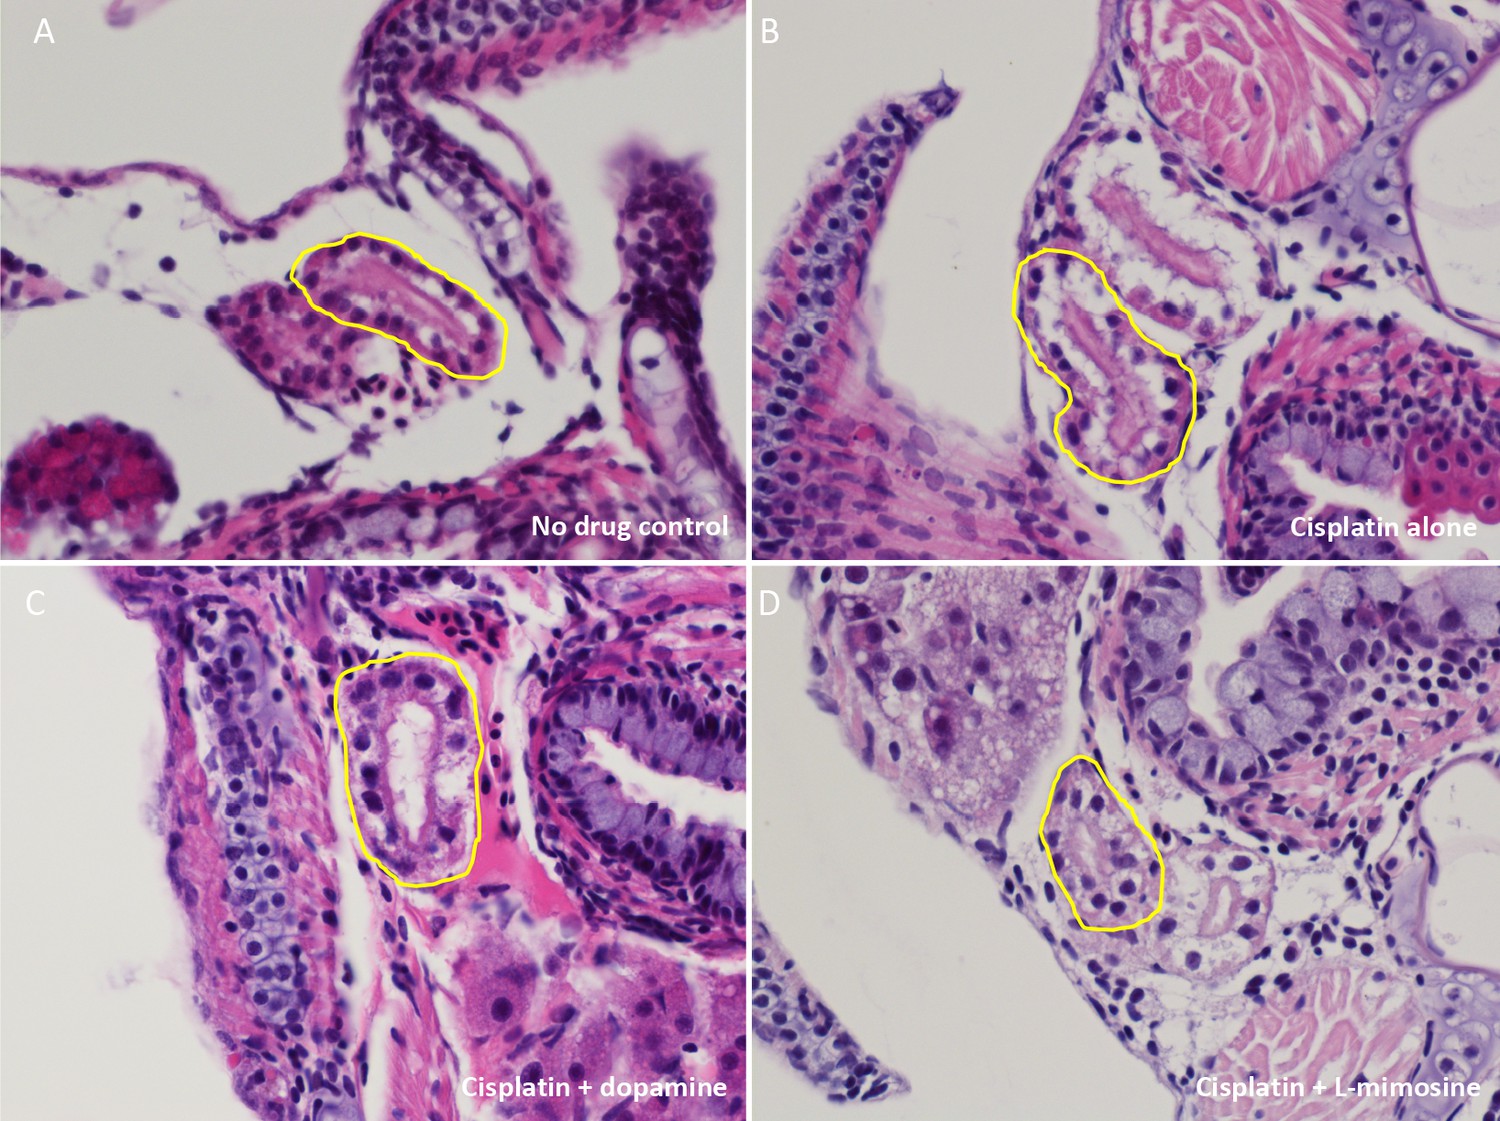
Zebrafish pronephros histology does not look significantly different following treatment with cisplatin or either protective agent at 3 days post-treatment (dpt).
Casper zebrafish larvae were treated at 60 hours post-fertilization (hpf) with vehicle control or either 0.03 mM dopamine or 0.03 mM L-mimosine. Larvae were rinsed 12 hr later, then treated with either vehicle control or 0.125 mM cisplatin. Three days later, larvae were rinsed, sacrificed, then fixed overnight in 4% paraformaldehyde (PFA). The fixed larvae were then pre-mounted in 1.5% low-melting point agarose, then paraffin embedded, sectioned, and stained with H and E. Representative images are shown. (A) Untreated control, (B) Cisplatin alone, (C) 0.03 mM dopamine + cisplatin, (D) 0.03 mM L-mimosine + cisplatin. Yellow outlines highlight proximal tubular structures. Examination by a pathologist suggested that there were no obvious differences between treatment groups.
Figure 6 with 2 supplements
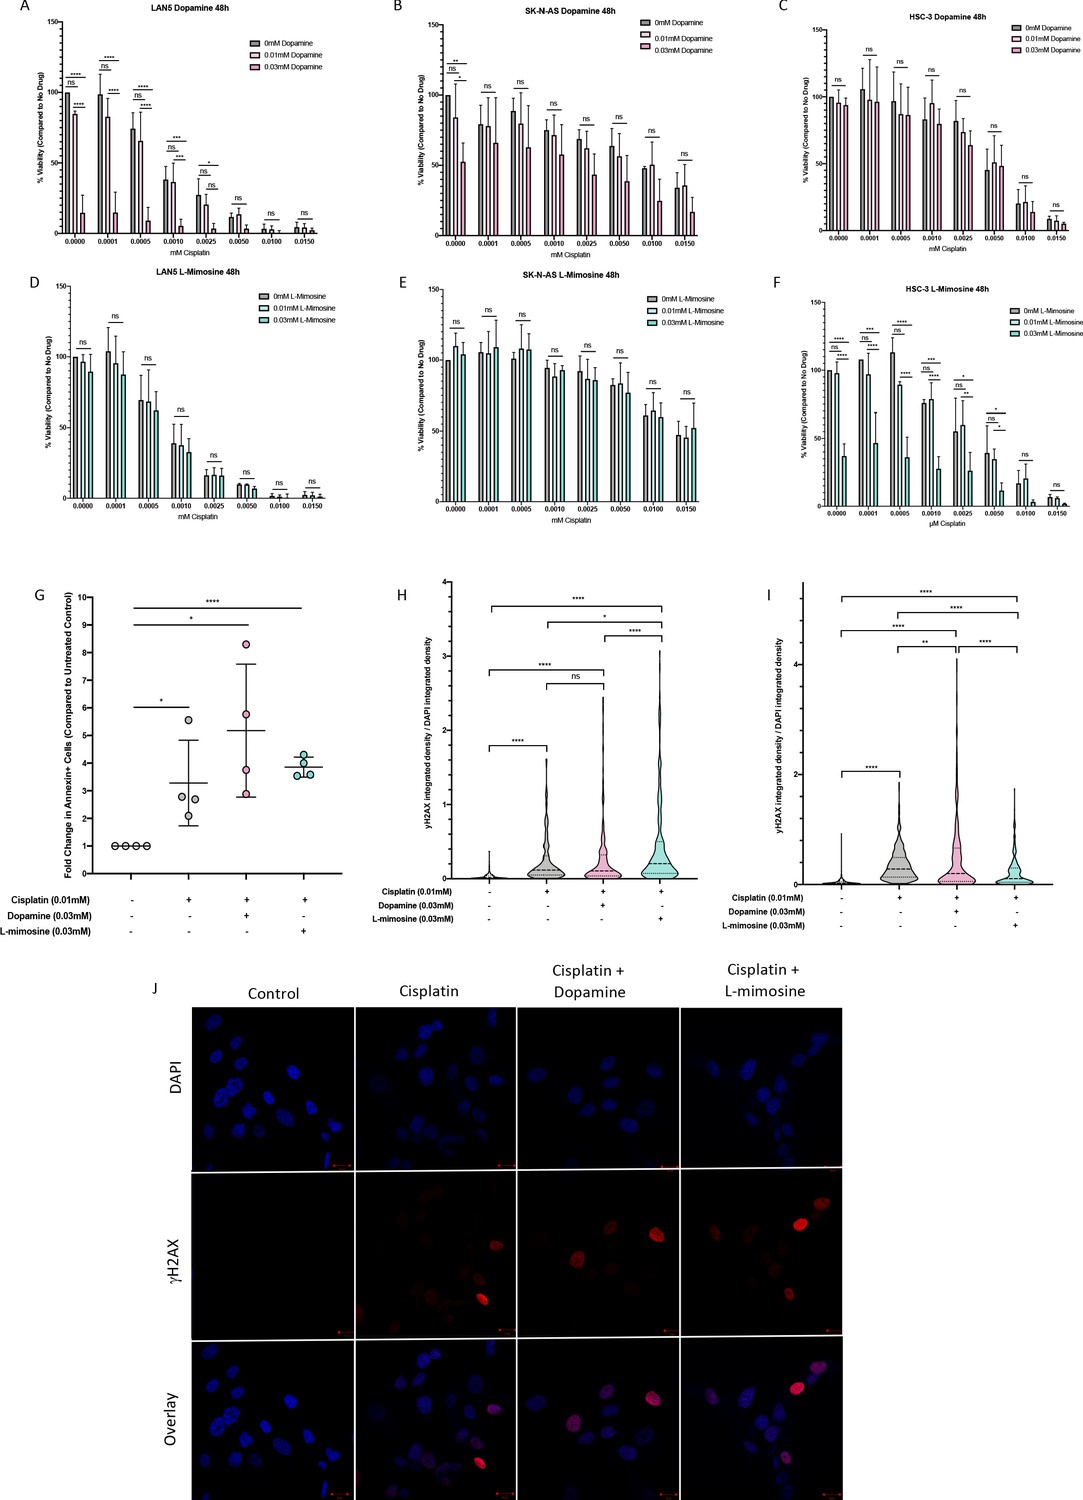
Dopamine and L-mimosine do not protect neuroblastoma (NBL) and oral squamous cell carcinoma cell lines from cisplatin-induced cytotoxicity.
NBL and oral squamous cell carcinoma cell lines were pretreated for 12 hr with vehicle control, or either dopamine or L-mimosine at either 0.01 mM or 0.03 mM. Cells were then treated with increasing concentrations of cisplatin and incubated for either 24 hr (Figure 6—figure supplement 1a-f) or 48 hr (data shown here). (A–F) An alamarBlue assay was used to determine cell viability. Results are displayed as % compared to untreated control. (A and D) LAN5, (B and E) SK-N-AS, (C and F) HSC-3. *=p<0.05, **=p<0.01, ***=p<0.005, and ****=p<0.001, as per two-way ANOVA with a Tukey post-test. N=3. (G) SK-N-AS cells were treated the same as in A-F, with the concentrations of protective agent specified. 48 hr following cisplatin treatment, cells were prepared for PE-conjugated Annexin V/SYTOXBlue-based flow cytometry. Graph of fold change in Annexin+ cells (gated to biological control) is displayed, relative to vehicle control. *=p<0.05, ****=p<0.001, as per two-tailed student’s t-tests comparing treatment groups to control. N=4. Representative flow plots and gating strategies can be found in Figure 6—figure supplement 2a-i H–J) Cancer cells were treated as in A-G, with the concentrations of protective agents specified. Twenty four hours following cisplatin treatment, cells were fixed, permeabilized and labeled with anti-phospho-histone H2A.X (Ser139) and DAPI to label γH2AX positive foci and nuclear material, respectively. (H and I) Quantification of γH2AX staining, reported as γH2AX integrated density/DAPI integrated density, with each data point corresponding to an individual nucleus. *=p<0.05, **=p<0.01, ****=p<0.001, as per Kruskal-Wallis testing with a Dunn’s multiple comparison test. N=3. (H) SK-N-AS cells, (I) LAN5 cells. (J) Representative confocal microscopy of SK-N-AS cells with indicated treatments, displaying DAPI, gamma H2AX, and an overlay.
Figure 6—figure supplement 1

Dopamine and L-mimosine do not protect cancer cell lines from cisplatin-induced death 24 hr following cisplatin treatment.
Neuroblastoma (NBL) and oral squamous cell carcinoma cell lines were pretreated for 12 hr vehicle control, or either dopamine or L-mimosine at either 0.01 mM or 0.03 mM. Cells were then treated with increasing concentrations of cisplatin and incubated for 24 hr (48 hr data shown in Figure 6a-f). An alamarBlue assay was used to determine cell viability. Results are displayed as % compared to untreated control. (A and D) LAN5, (B and E) SK-N-AS, (C and F) HSC-3. *=p<0.05, **=p<0.01, ***=p<0.005, and ****=p<0.001, as per two-way ANOVA with a Tukey post-test. N=3.
Figure 6—figure supplement 2
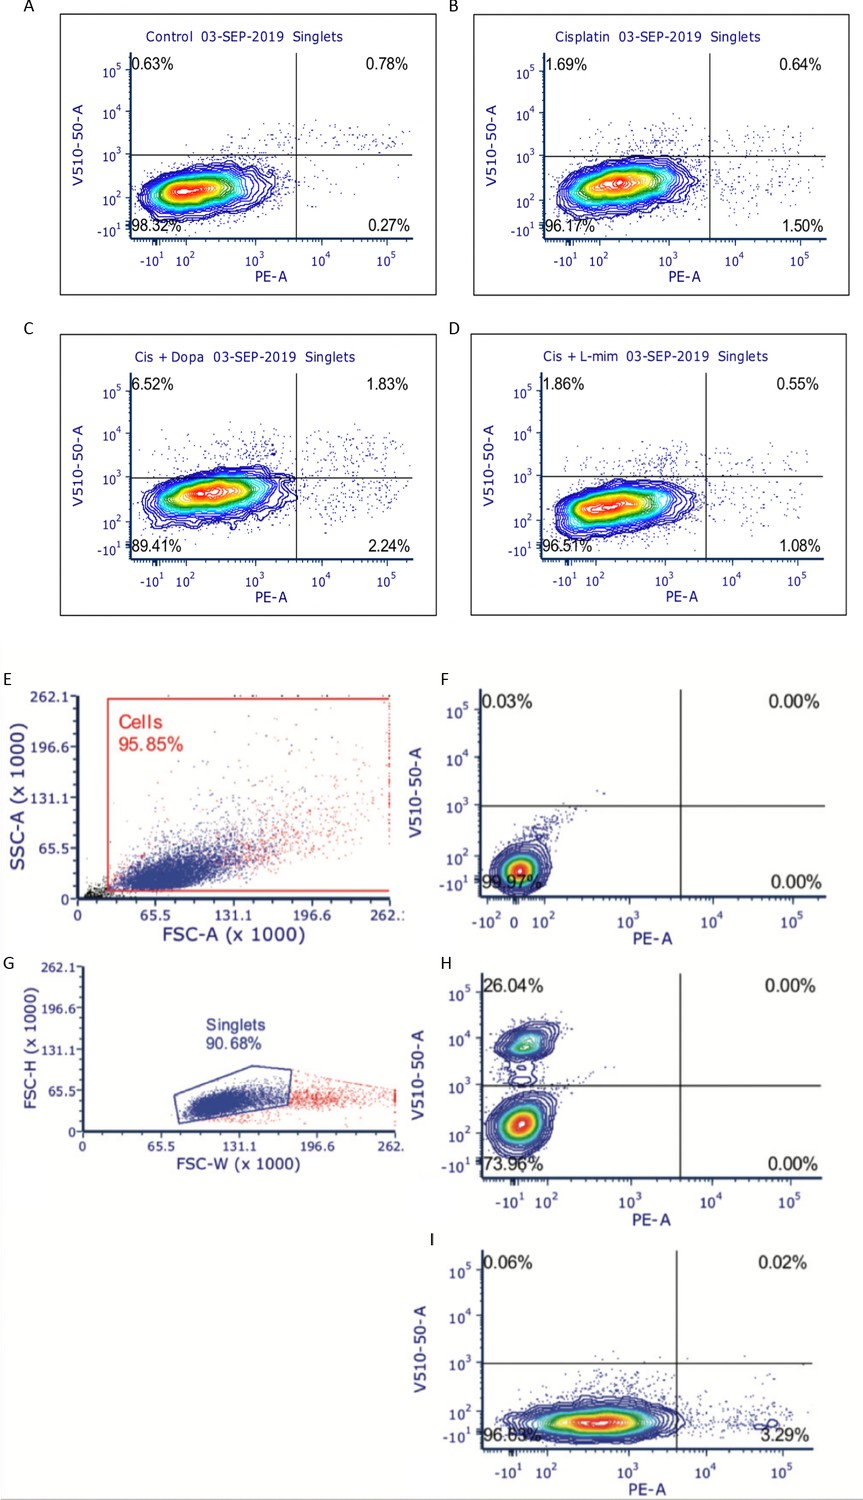
Representative flow plots and gating strategies for the detection of late-stage apoptosis and cell death in SK-N-AS neuroblastoma (NBL) cells.
SK-N-AS neuroblastoma (NBL) cells were treated with either vehicle control or either 0.03 mM dopamine or 0.03 mM L-mimosine for 12 hr, were rinsed, then treated with 0.01 mM cisplatin for 48 hrs. Cells were collected, rinsed, and prepared for PE-conjugated Annexin-V/SYTOXBlue flow cytometry. Data were analyzed using BD FACSDiva Software. (A–D) Representative flow plots demonstrating the four quadrants. LL=Annexin-/SYTOX-, LR=Annexin+/SYTOX-, UL=Annexin-/SYTOX+, UR=Annexin+/SYTOX+. (A) Control untreated cells, (B) Cisplatin only, (C) dopamine + cisplatin, (D) L-mimosine + cisplatin. N=4. (E) General gating strategy to identify living and dead cells in sample and to eliminate cell debris. (F) Unstained control cells. (G) Doublet discrimination strategy. (H) Unstained control cells. (I) Gating strategy to identify SYTOX+ dead cells. Representative plots from heat-killed SYTOX+ control cells. (J) Gating strategy to identify Annexin+ cells. Representative flow plot from cells treated with Camptothecin to induce apoptosis.
Author response image 1
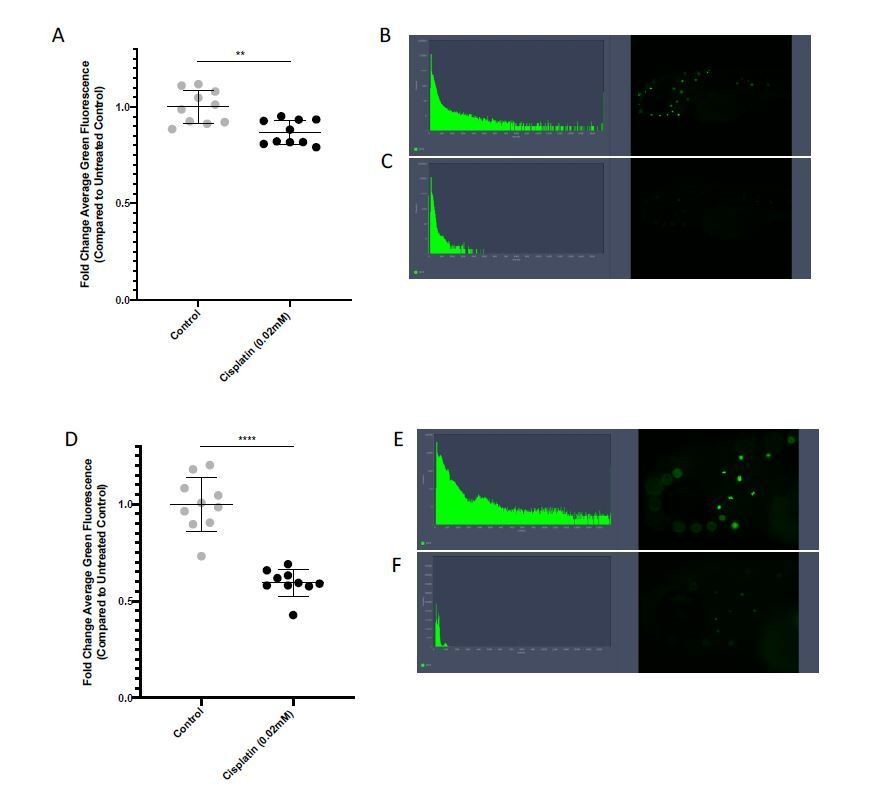
EFCisplatin treatment results in damage to zebrafish neuromast structures that is detectable with ZEN software.
Groups of 5 x 72 hour post-fertilization (hpf) casperzebrafish larvae were treated with either vehicle control, or 0.02mM freshly-prepared cisplatin for 24hr. At the endpoint, larvae were stained with 2μM YO-PRO1 for 1hr, rinsed, then imaged with fluorescent microscopy. ZEN software was used to analyze the average level of green fluorescence in each image. Data is represented as fold change in comparison to the untreated control. A) Analysis of fluorescence values at 5X magnification. Each data point represents an individual larvae. **=p=0.011, as per two-tailed student’s T-test. B-C) Representative larvae and fluorescent histogram for B) untreated control, and C) cisplatin treated larvae. D) Analysis of fluorescence values at 10X magnification. Each data point represents an individual larvae. ****=p<0.0001, as per two-tailed student’s T-test. E-F) Representative larvae and fluorescent histogram for E) untreated control, and F) cisplatin treated larvae. N=2 replicates with 5 larvae each. Error bars represent standard deviation (SD).
Author response image 2

Cisplatin treatment results in damage to zebrafish neuromast structures that is detectable using a plate reader.
Groups of 72 hour post-fertilization (hpf) casperzebrafish larvae were treated with either vehicle control, 0.05 or 0.25mM cisplatin for 24hr. At the endpoint, larvae were stained with 2μM YO-PRO1 for 1hr, rinsed, then allotted 5X well in a 96-well plate. Fluorescence values were then acquired using a plate reader. Data is presented as fold change in comparison with untreated controls. Each data point represents the average of 3 reads of an individual well that contained 5 larvae. ****=p<0.0001, as per one-way ANOVA with a Tukey post-test. N=2 replicates with at least 4 wells in each treatment.
Tables
Table 1
Compounds from the Sigma LOPAC1280 compound library that were hits in both the oto- and nephroprotection assays.
Clinical usage information obtained from the ChEMBL database (Gaulton et al., 2017).
| Drug ID | Drug name | Biological action | Clinical usage | Notes |
|---|---|---|---|---|
| 1, D06 | 5-Azacytidine | DNA methyltransferase inhibitor | Approved for use in myelodysplatic syndrome (MDS), chronic myelomonocytic leukemia (CML), some advanced solid tumours | |
| 1, E02 | (±)-Nipecotic acid | GABA uptake inhibitor | N/A | |
| 1, F07 | 1-Aminobenzotriazole | Cytochrome P450 and chloroperoxidase inhibitor | N/A | Potent cytochrome P450 inhibitor, used in research (Ortiz de Montellano, 2018) |
| 1, G06 | Apigenin | Arrests cell cycle at G2/M phase | N/A | Protects against cisplatin-induced nephrotoxicity in preclinical models (Hassan et al., 2017; Ju et al., 2015) and may have anticancer activities summarized by Yan et al., 2017 |
| 3, F04 | Betamethasone | SAID (steroidal anti-inflammatory drug); glucocorticoid | Approved for use in obstructive lung disease, nasal obstruction, eye diseases, eczema and psoriasis | Historically showed some efficacy as an anti-emetic agent in chemotherapy regimens (Sorbe, 1988) |
| 5, F10 | Ganaxolone | Positive allosteric modulator of GABA-A receptors | N/A | Reached Phase III clinical trials for use in drug resistant partial onset seizures (NCT01963208) |
| 6, E07 | GBR-12909 dihydrochloride (Vanoxerine) | Selective dopamine reuptake inhibitor | N/A | Investigated as a potential treatment for cocaine-abuse disorder (NCT00218049) |
| 7, B03 | N-Ethylmaleimide | Sulfhydryl alkylating agent that inactivates NADP-dependent isocitrate dehydrogenase and many endonucleases | N/A | |
| 7, E04 | Phenserine | Selective, non-competitive acetylcholinesterase (AChE) inhibitor | N/A | |
| 7, G06 | p-Fluoro-L-phenylalanine | Substrate for tyrosine hydroxylase; arrests cells at G2 | N/A | |
| 8, C07 | Dopamine hydrochloride | Endogenous neurotransmitter | Approved for use in shock caused by heart attack, trauma, surgery, heart failure, and kidney failure | Historically investigated as a potential nephroprotective agent for use with cisplatin (Baldwin et al., 1994; Somlo et al., 1995), may influence neurotransmission at sensory hair cells (Toro et al., 2015) and is known to be involved in auditory processes (Gittelman et al., 2013) |
| 9, H05 | SB-525334 | A potent activin receptor-like kinase (ALK5)/type I TGFß-receptor kinase inhibitor | N/A | |
| 12, G04 | Ouabain | Blocks movement of the H5 and H6 transmembrane domains of Na+-K+ ATPases | N/A | Historical use for myocardial infarction and angina treatment, used in the treatment of digitalis intoxication (Fürstenwerth, 2010), used in poison darts in eastern Africa, defined as an‘extremely hazardous substance’ in the USA |
| 14, E04 | Ritanserin | Potent 5-HT2 serotonin receptor antagonist which passes the blood-brain barrier | N/A | Investigated for use in cocaine dependence (NCT00000187) |
| 14, E08 | CP-335963 | Aurora two kinase inhibitor, PDGF inhibitor, and anti-proliferative | N/A | |
| 15, C11 | Tyrphostin 1 | EGFR tyrosine kinase inhibitor | N/A | Tyrphostins have been shown to reduce small intestinal damage by cisplatin and 5-Fluorouracil (5-FU) (Zlotnik et al., 2005) |
| 15, G02 | '1-(1-Naphthyl)piperazine hydrochloride | 5-HT2 serotonin receptor antagonist | N/A | |
| 16, D03 | Trifluoperazine dihydrochloride | Xanthogenate derivative with in vivo anti-tumor and anti-HIV activity; inhibits phospholipase D and phosphatidylcholine phospholipase C (PIPLC) | Approved for use as an antipsychotic for individuals with schizophrenia, some use as an anxiolytic, D2 receptor antagonist | Has anti-adrenergic, anti-dopaminergic and anti-cholinergic effects. Thought to minimize hallucinations and delusions through inhibition of the D2 receptors in the mesocortical and mesolimbic pathways |
| 16, D07 | S(-)-UH-301 hydrochloride | Potent and selective 5-HT1A serotonin receptor antagonist | N/A | |
| 16, D09 | L-Mimosine from Koa hoale seeds | Potential inhibitor of the cell cycle giving rise to growth arrest in G1-phase. An iron chelator that inhibits DNA replication in mammalian cells. Has been shown to have apoptotic activity in xenotransplanted human pancreatic cancer | N/A | Inhibits copper containing enzymes tyrosinase and dopamine β-hydroxylase (Hashiguch and Takahashi, 1976), shown to re-activate hypoxia-inducible factor 1α (HIF-1α) and reduce renal fibrosis in a rat model of renal ablation (Yu et al., 2012), blocks proliferation in prostate carcinoma cells (Chung et al., 2012) and breast cancer cells (Kulp and Vulliet, 1996) |
| 16, D10 | AC-55649 | Subtype selective retinoic acid receptor beta2 (RARbeta2) agonist | N/A | RARβ may have tumour suppressor activities (Alvarez et al., 2007) |
| 16, F11 | Caroverine hydrochloride | Nonselective NMDA and AMPA glutamate receptor antagonist | Used to treat muscle spasms and tinnitus in some countries, not FDA approved | Has antioxidant properties (Udilova et al., 2003), attenuates noise-induced hearing loss in rats (Duan et al., 2006), treats tinnitus in humans (Denk et al., 1997) |
Key resources table
| Reagent type (species) or resource | Designation | Source or reference | Identifiers | Additional information |
|---|---|---|---|---|
| Cell line (Homo sapiens) | HK-2, proximal tubule cells, HPV-16 transformed | ATCC | CRL-2190, RRID:CVCL_0302 | |
| Cell line (Homo sapiens) | HSC-3, oral squamous cell carcinoma | JCRB Cell Bank | RRID:CVCL_1288 | |
| Cell line (Homo sapiens) | SK-N-AS, metastatic neuroblastoma cells | Gift from Dr. Meredith Irwin (SickKids) | CRL-2137, RRID:CVCL_1700 | |
| Cell line (Homo sapiens) | LAN5, metastatic neuroblastoma cells | Gift from Dr. Meredith Irwin (SickKids) | RRID:CVCL_0389 | |
| Fish strain (Danio rerio) | Casper double pigment mutant fish strain | Gift from Dr. Len Zon (Harvard), PMID:18371439 | mitfaw2/w2;mpv17a9/a9 | Used throughout the fish work |
| Antibody | phospho-histone H2A.X (Ser139) (20E3) rabbit monoclonal antibody | Cell Signalling Technology | Cat # 9718S | IF: 1:400 |
| Chemical compound, drug | Cisplatin | Cayman Chemicals | Cat # 15663-27-1 | Prepared fresh in 0.9% NaCl before each experiment |
| Chemical compound, drug | Dopamine hydrochloride | Sigma-Aldrich | Cat # H60255 | Prepared fresh in 0.9% NaCl before each experiment |
| Chemical compound, drug | L-mimosine | Sigma-Aldrich | Cat # M0253 | Prepared in 0.9% NaCl, aliquoted and stored at −20°C |
Additional files
-
Supplementary file 1
Compounds from the Sigma LOPAC1280 compound library that were toxic to ¾ zebrafish larvae at 0.01mM, in combination with 0.02mM cisplatin.
Clinical usage information obtained from the ChEMBL database (Gaulton et al., 2017)
- https://cdn.elifesciences.org/articles/56235/elife-56235-supp1-v2.docx
-
Supplementary file 2
Statistical test details for manuscript.
- https://cdn.elifesciences.org/articles/56235/elife-56235-supp2-v2.docx
-
Transparent reporting form
- https://cdn.elifesciences.org/articles/56235/elife-56235-transrepform-v2.docx
Download links
A two-part list of links to download the article, or parts of the article, in various formats.
Downloads (link to download the article as PDF)
Open citations (links to open the citations from this article in various online reference manager services)
Cite this article (links to download the citations from this article in formats compatible with various reference manager tools)
The identification of dual protective agents against cisplatin-induced oto- and nephrotoxicity using the zebrafish model
eLife 9:e56235.
https://doi.org/10.7554/eLife.56235


