Functional connectivity subtypes associate robustly with ASD diagnosis
- Montreal Neurological Institute and Hospital, McGill University, Canada
- Centre de Recherche de l'Institut Universitaire de Gériatrie de Montréal, University of Montreal, Canada
- Centre de Recherche de l’Institut Universitaire en Santé Mentale de Montréal, Canada
- Département de Psychiatrie et d’Addictologie, Université de Montréal, Canada
- Sainte Justine Research Center, University of Montreal, Canada
- Human Genetics and Cognitive Functions, Institut Pasteur, UMR3571 CNRS, Université Paris Cité, France
- School of Mathematics and Physics, University of Queensland, Australia
Figures
Figure 1
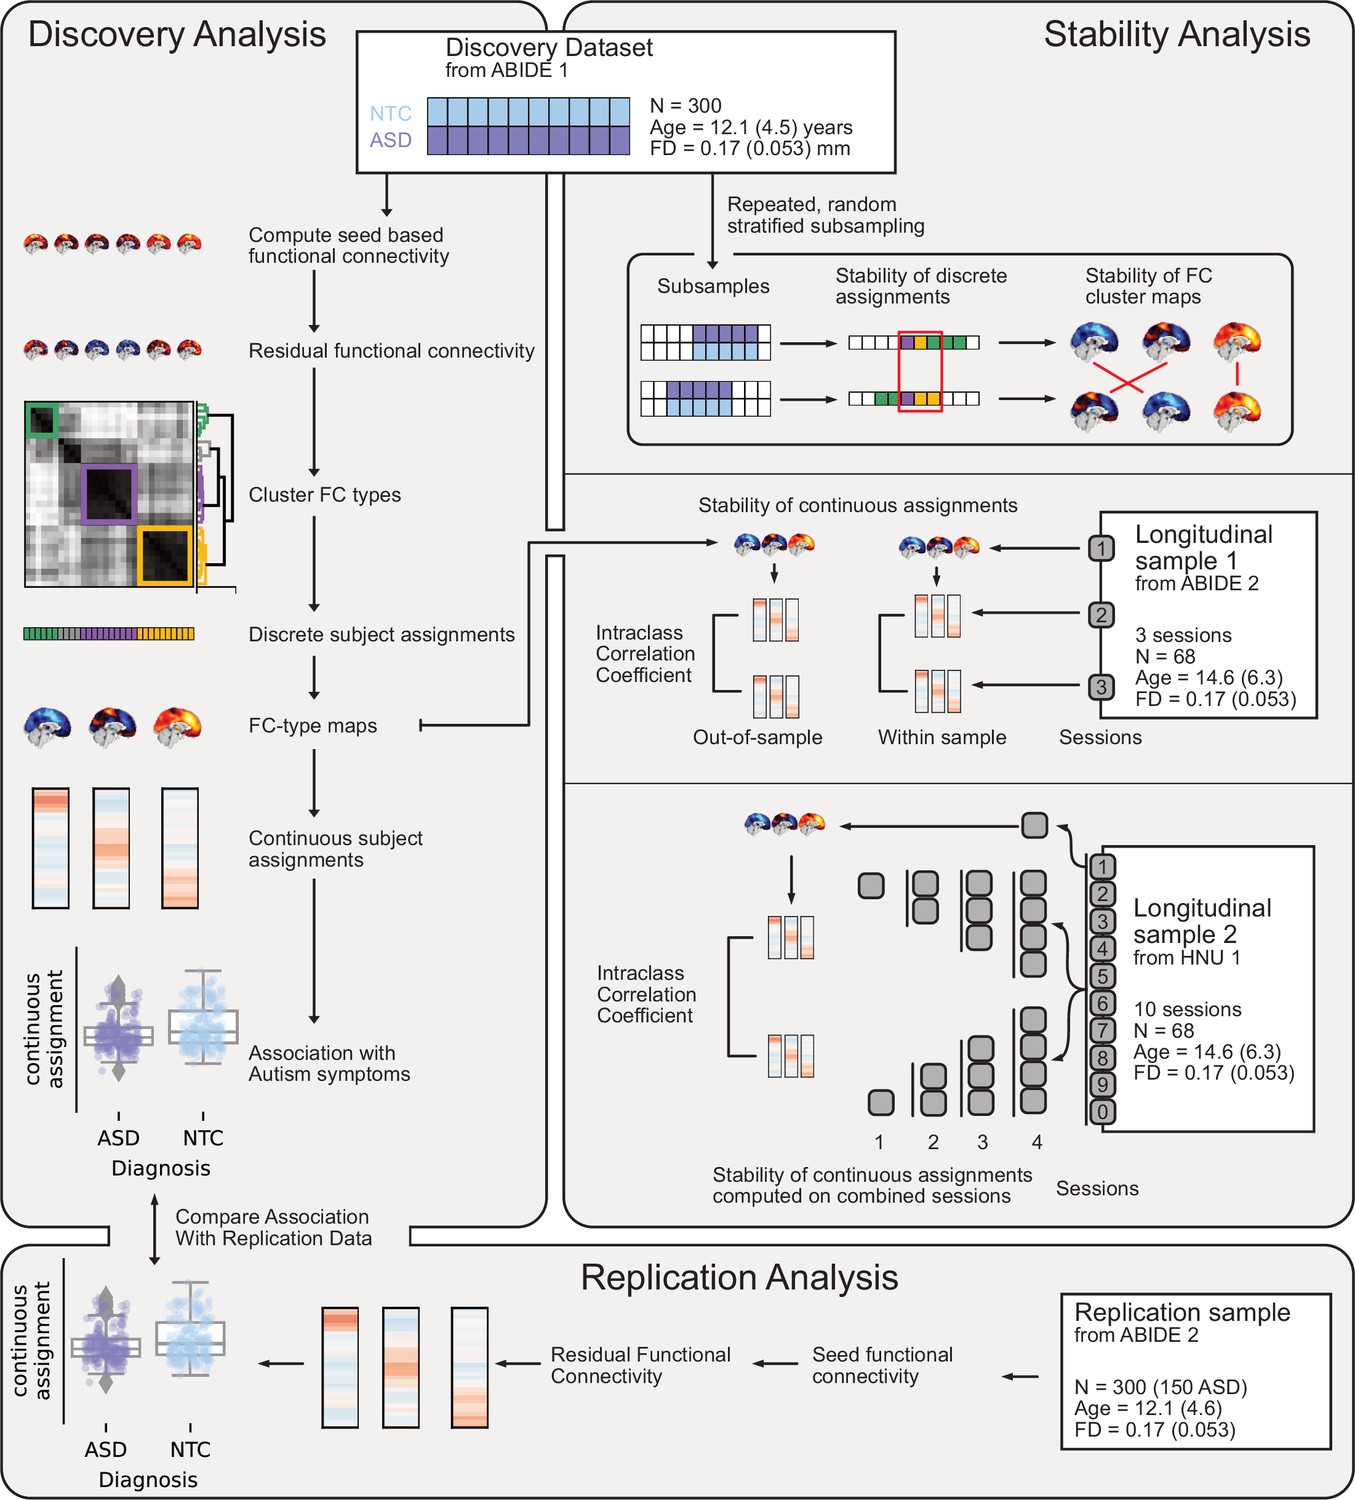
Overview of datasets and analyses presented in this work.
Discovery Analysis: the discovery sample was drawn from ABIDE 1. Subtypes maps and continuous subtype assignments were extracted (left, middle) from the same data and associated with ASD diagnosis (left, bottom). Replication analysis: the replication sample was drawn from ABIDE 2. Continuous subtype assignments were extracted for subjects from the replication sample, using subtypes from the discovery sample. These continuous subtype assignments were again associated with ASD diagnosis (left, bottom) to replicate the discovery findings. Stability analyses: three stability analyses were conducted, using three different datasets. Stability of discrete subtype assignments and of subtype maps (right, top) was estimated using random subsamples of the discovery dataset to regenerate the subtyping process. Stability of continuous subtype assignments in an ASD sample was estimated across scan sessions from a longitudinal subsample of ABIDE 2 (right, middle). Continuous subtype assignments were either computed for subtypes extracted from a session of the same sample (within-sample) or from the discovery sample (out-of-sample). Finally, the impact of data availability on continuous subtype assignment stability was estimated across ten scan sessions of the longitudinal HNU1 dataset (right, bottom). Subtypes were extracted from one session of the dataset, and continuous subtype assignments were computed on individual or averaged sessions (2, 3, or 4).
Figure 2
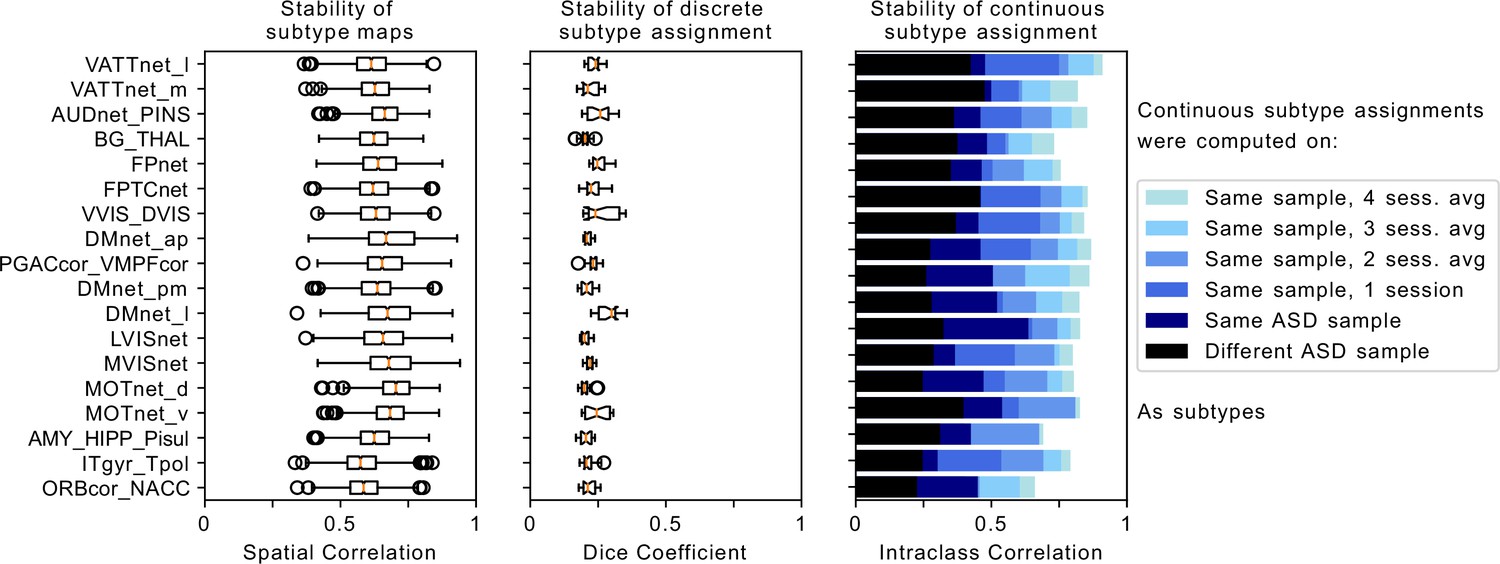
Robustness of FC-subtype outcomes across brain networks.
Left column: Stability of the spatial FC-subtype maps. Boxplots represent the range of the average similarity between FC-subtype maps of the same brain network that were extracted from 1000 separate subsamples of the discovery dataset (each subsample included half of the sample n=194). MIST_20 seed network names are abbreviated, see Table 1 for full seed network names. Middle column: Stability of discrete assignments to FC-subtypes. Boxplots represent the average overlap between the clusters an individual was assigned to in two different random subsamples. Right column: Stability of continuous assignments of individuals to a FC-subtype across repeated imaging sessions. Bar plots represent the average Intraclass Correlation between continuous assignments to FC-subtypes computed on separate longitudinal imaging sessions. The color hue reflects the data that continuous assignments were computed on: (black, out-of-sample) completely separate ASD datasets from the one used to compute subtypes, (dark blue, within-sample) same dataset but different scan session from the one used to compute subtypes, (blue to light blue) within-sample FC-subtypes in a general population data set where multiple scan sessions were combined to compute continuous FC-subtype assignments.
Figure 3
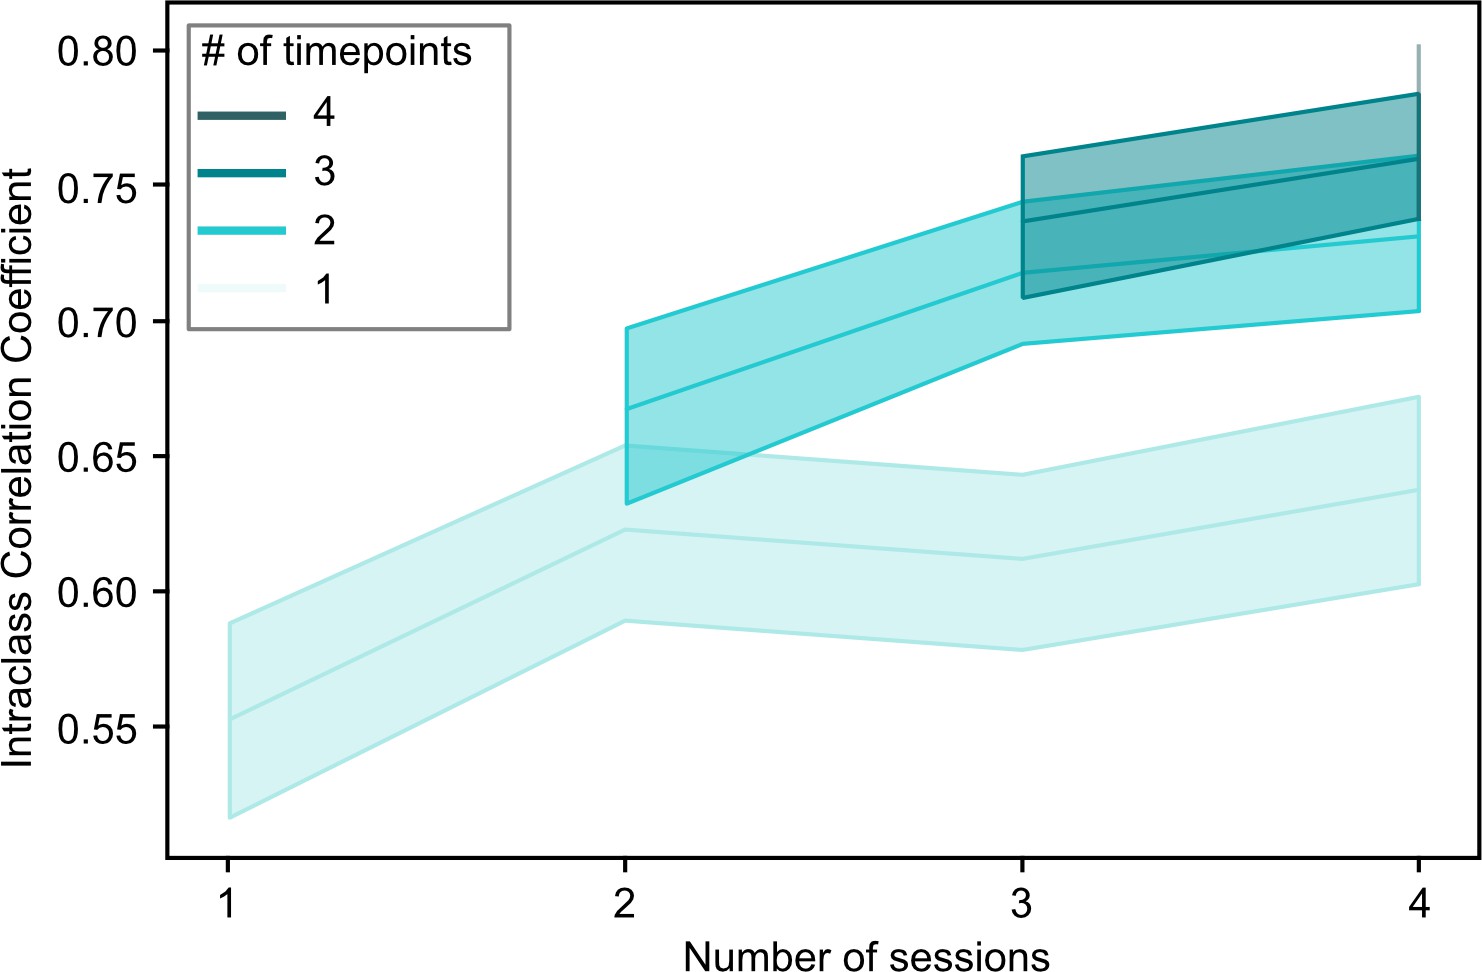
Overview of the relationship between the stability of continuous subtype assignments (Intraclass Correlation Coefficients) and the amount of data used to compute these assignments.
Continuous subtype assignments were computed on samples in longitudinal sample 2 (n=26, 10 sessions per participant) and for pairs of single scan sessions, or for pairs of averages of multiple scan sessions (2–4, horizontal axis). We also controlled the total number of time points included in the averages to be the length of a single (light green) or multiple sessions (darker green hues). Opaque lines represent the average ICC across repeated samples of session pairs, and shaded areas reflect the 95% confidence interval. This analysis allowed us to investigate whether changes in stability were driven more by the inclusion of multiple sessions, or by the total amount of timepoints included in the average.
Figure 4
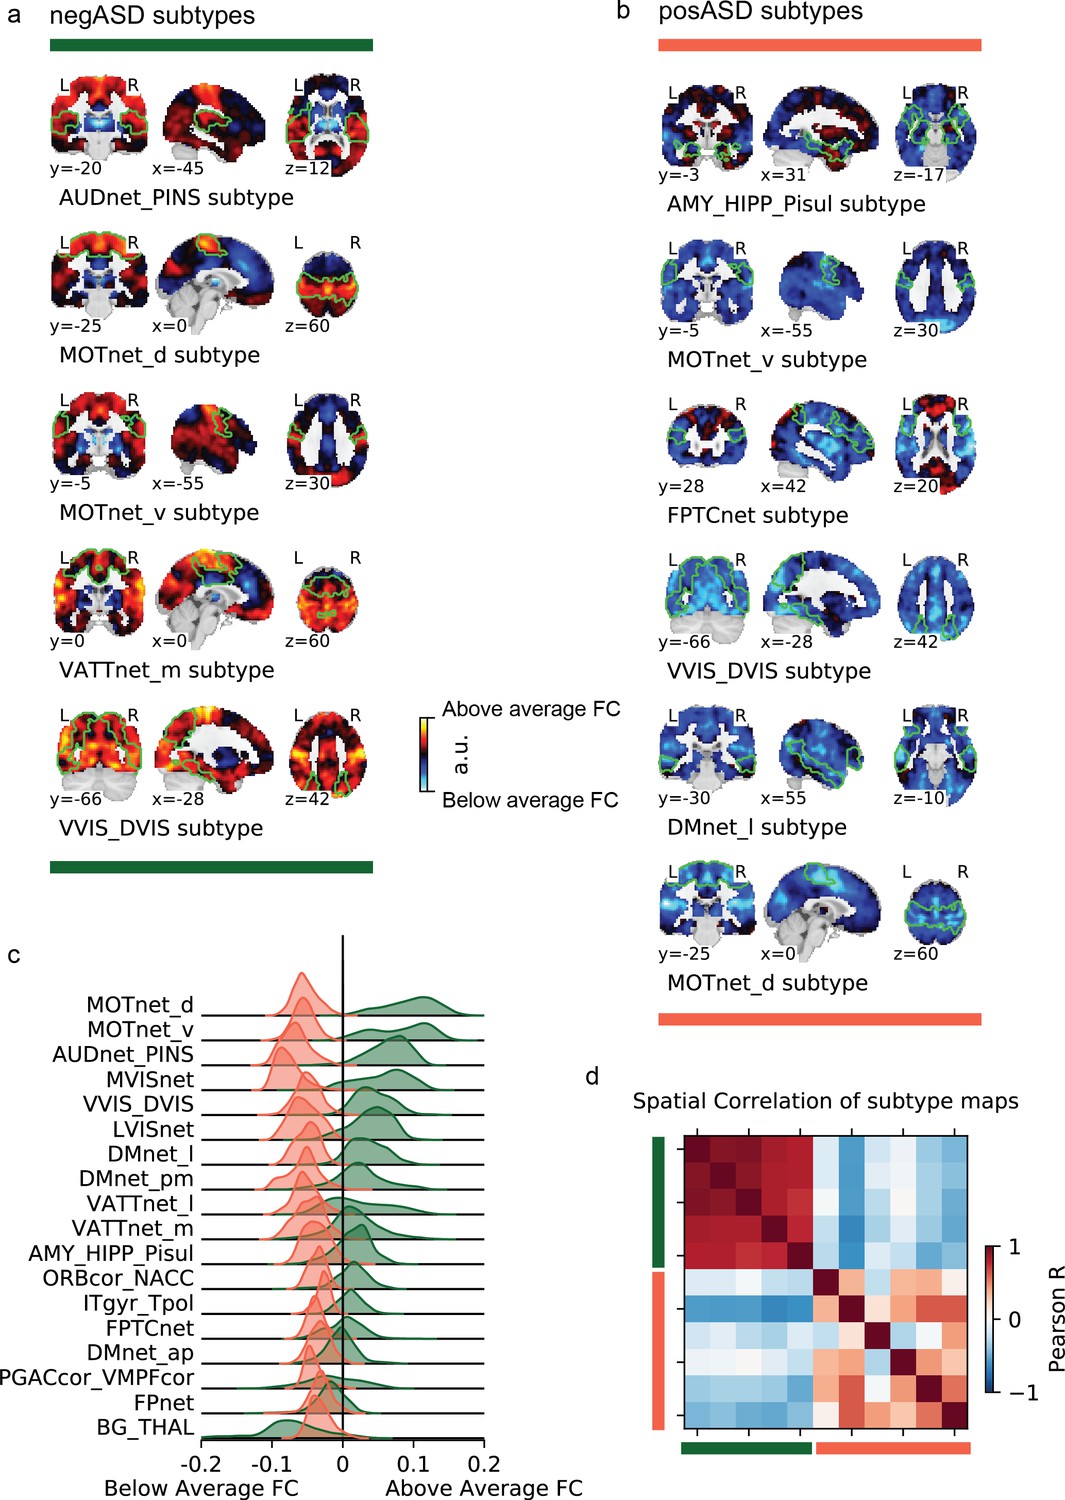
Overview of negASD and posASD FC-subtype maps.
Maps of negASD (a) and posASD (b) FC-subtype (corresponding seed networks are outlined with a thin green boundary on the map). MIST_20 seed network names are abbreviated, see Table 1 for full seed network names. (c) Decomposition of the average negASD (green) and posASD (red) FC-subtype map into 18 brain networks. (d) Spatial correlation between FC-subtype maps. negASD (green) and posASD (red) FC-subtypes are denoted by colored bars along the correlation matrix.
Figure 5
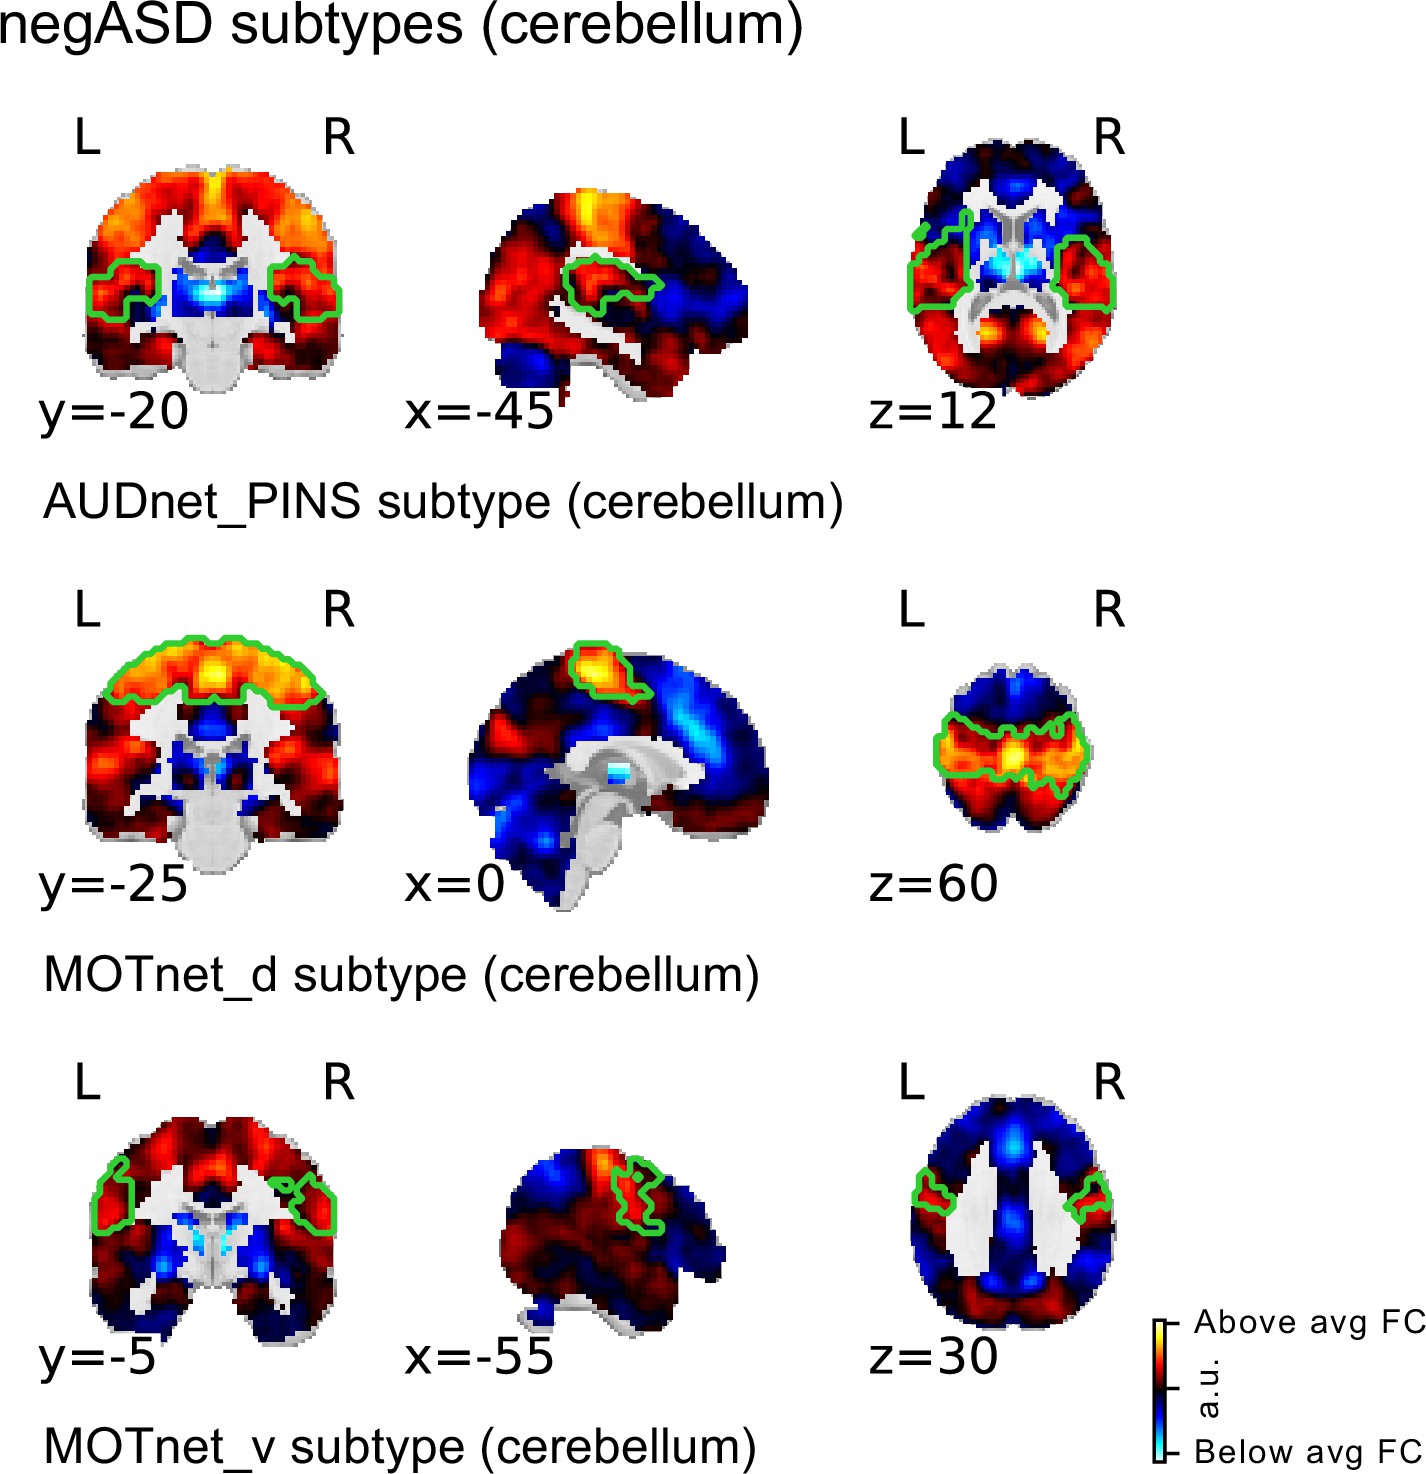
Spatial maps of subtypes with significant association to ASD diagnosis for supplementary analysis with cerebellar coverage.
The main subtype and ASD association analysis was repeated in a subsample of the discovery sample with sufficient cerebellar coverage to include all 20 MIST_20 seed networks (including 2 cerebellar seed regions). All significant ASD diagnosis associations were negative (i.e. negASD subtypes). MIST_20 seed network names are abbreviated, see Table 1 for full seed network names.
Figure 6
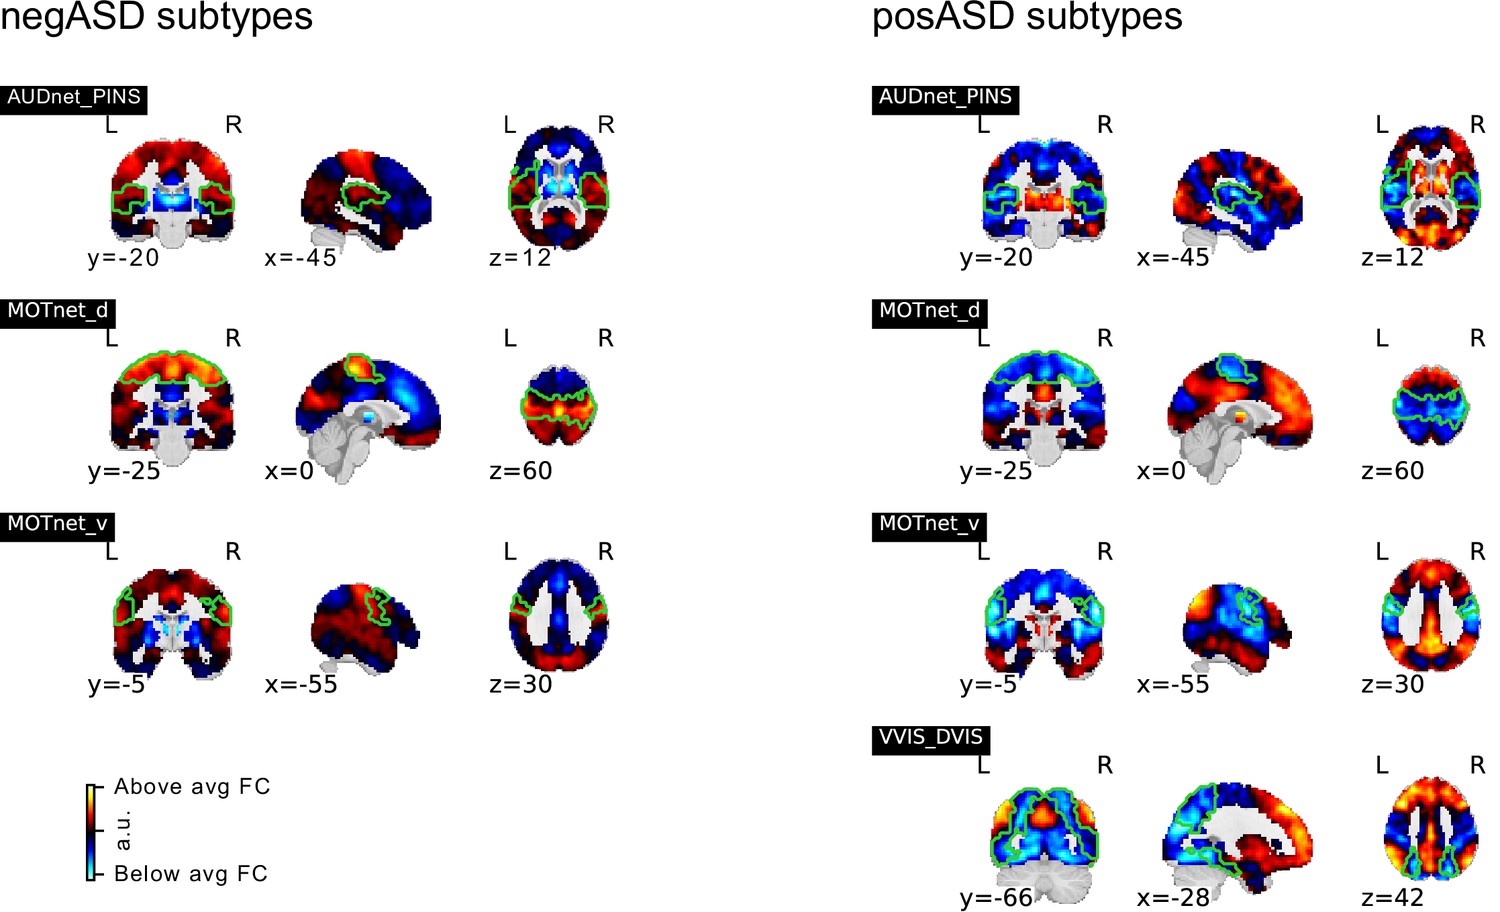
Spatial maps of subtypes with significant association to ASD diagnosis for supplementary analysis that regressed global connectivity from all seed FC maps.
Subtypes with significant negative association of continuous assignments and ASD diagnosis are shown on the left, those with positive associations on the right. MIST_20 seed network names are abbreviated, see Table 1 for full seed network names.
Figure 7
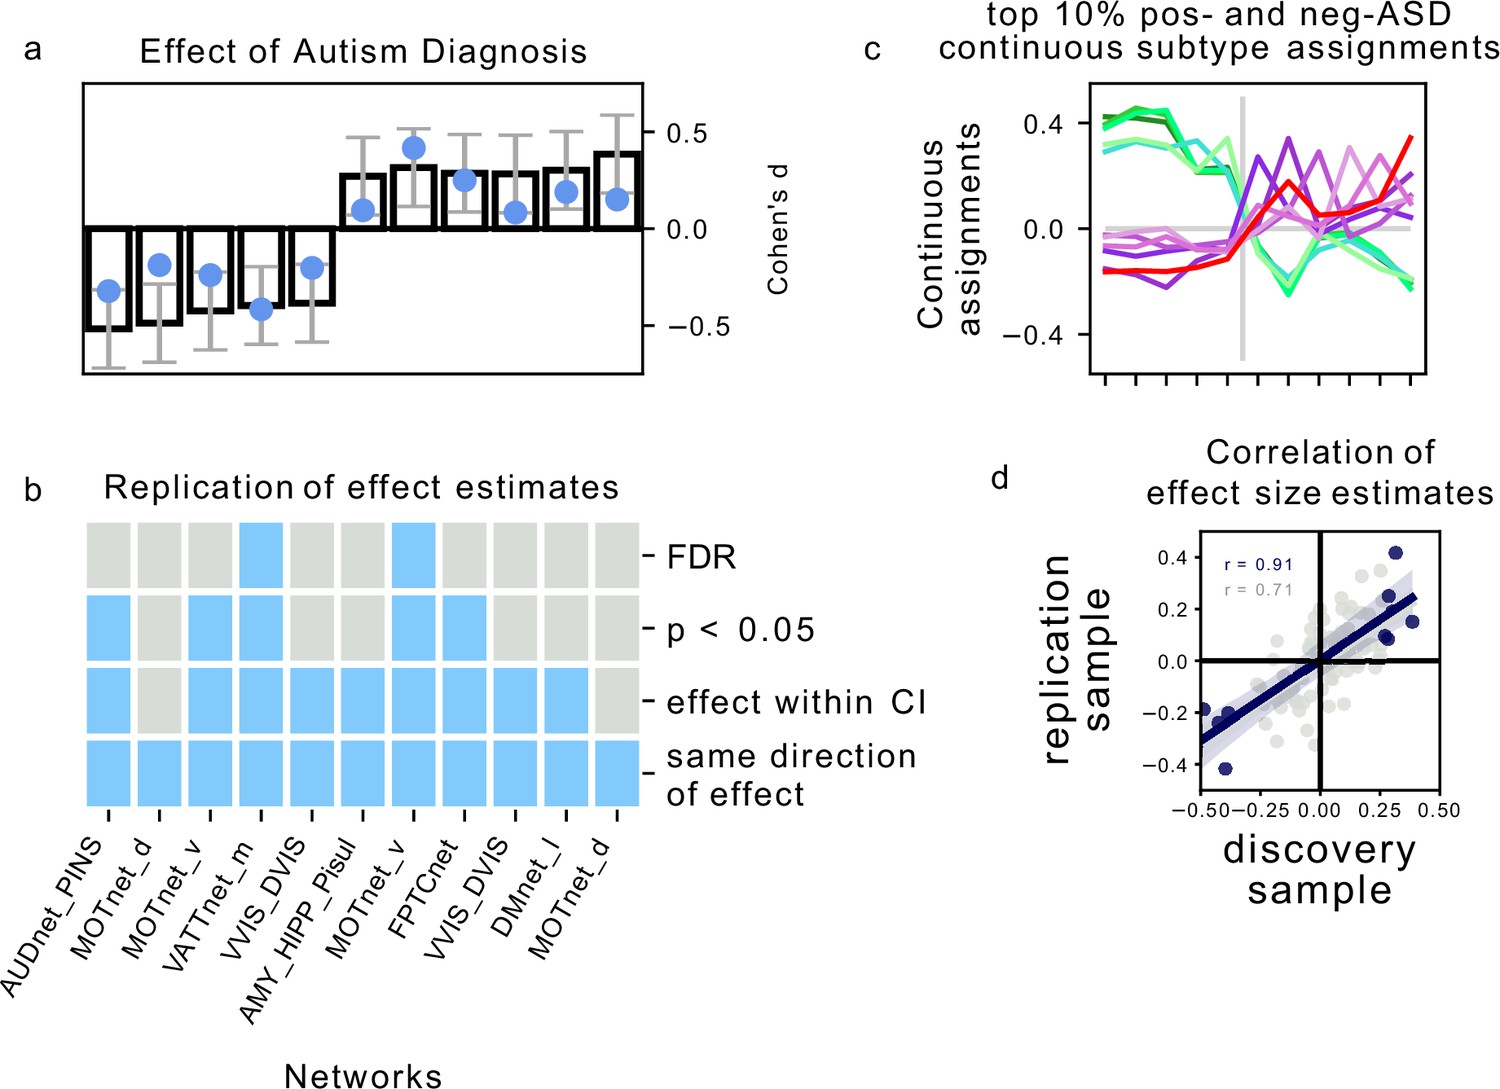
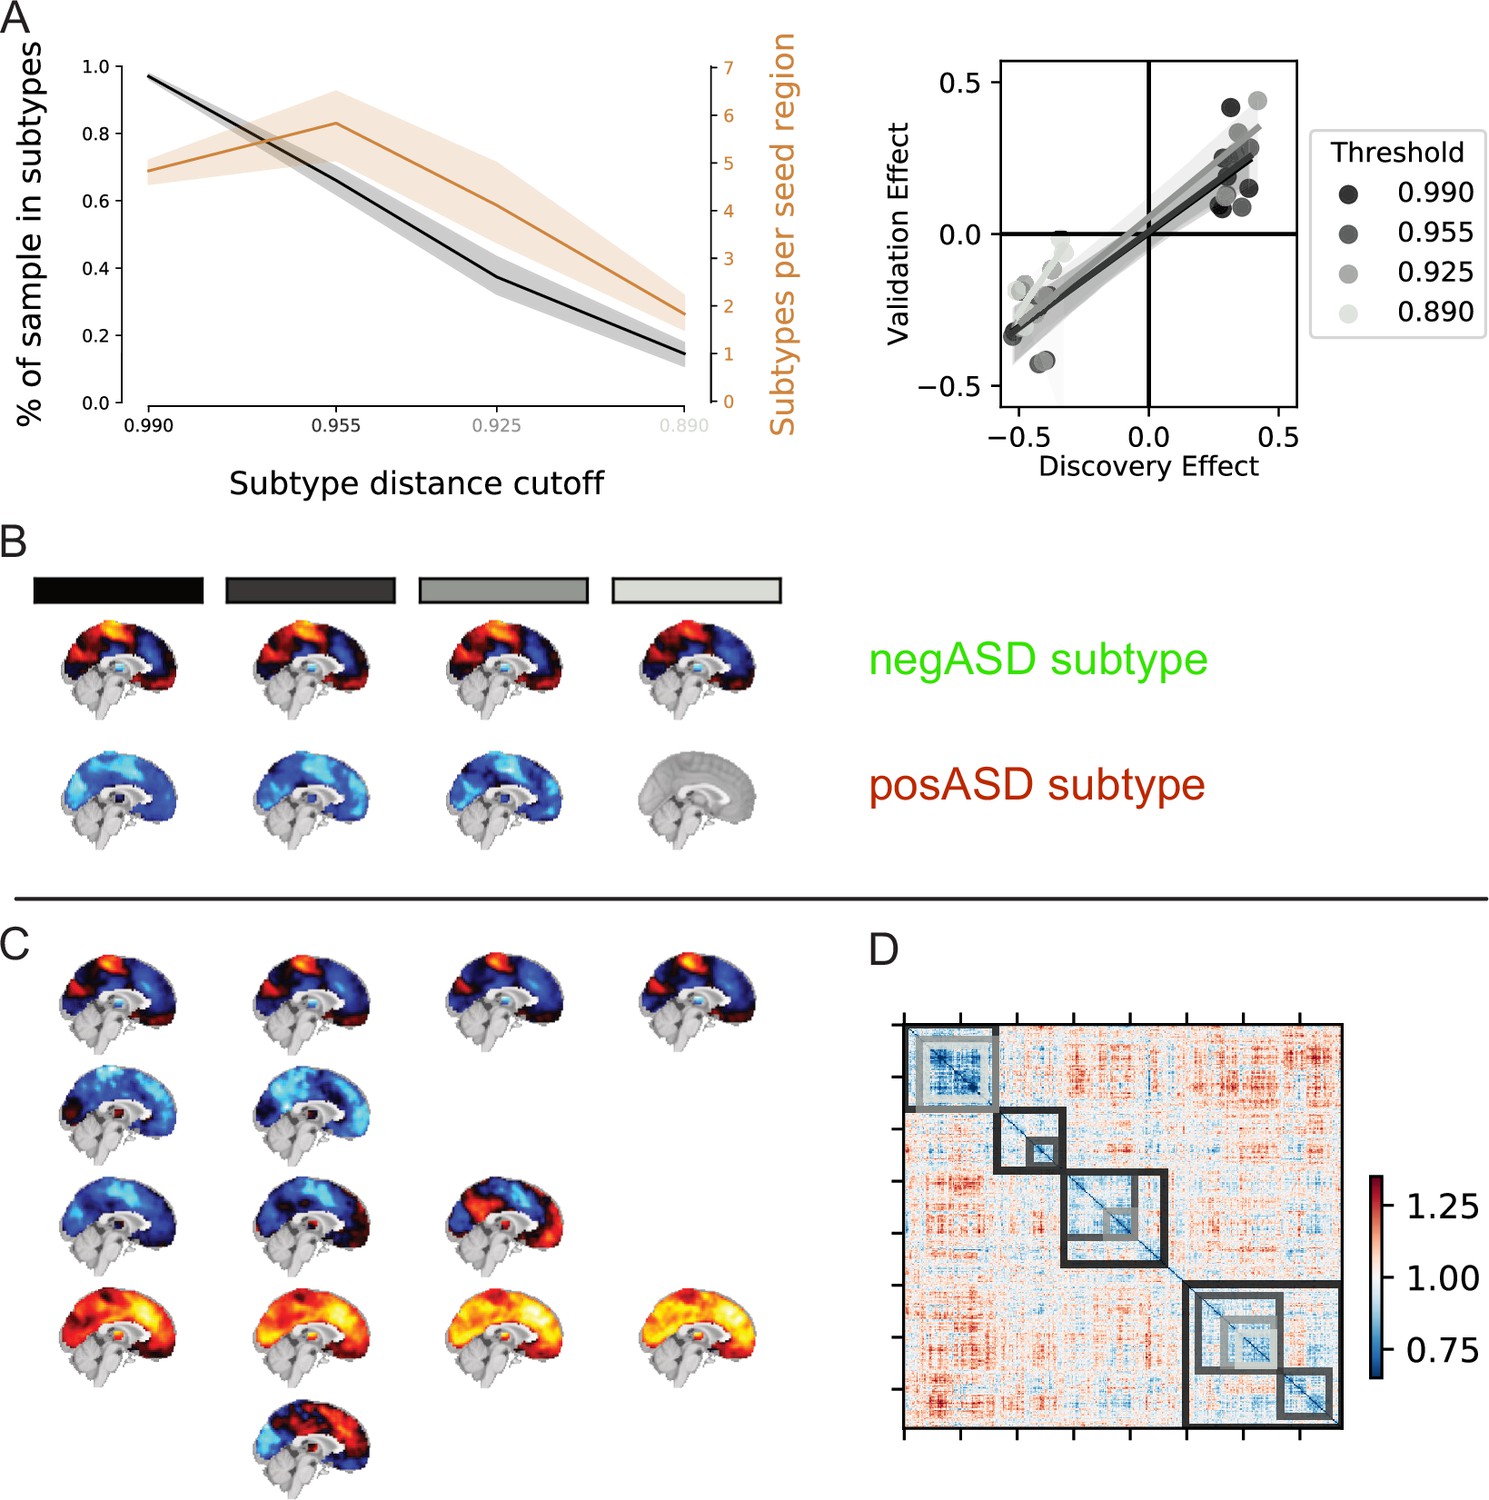
Association of continuous assignments to FC-subtypes and diagnosis.
(a) Bar plots represent the standardized group difference (Cohen’s d) of continuous assignments to FC-subtypes between NTC individuals and ASD patients. Negative value reflect greater similarity of neurotypical control subjects with the FC-subtype, positive values reflect greater similarity of ASD patients with the FC-subtype. Error bars reflect the 95% confidence interval of the effect size estimates. The effect size observed in the independent replication data set is shown as a blue dot. (b) Matrix showing the degree of replication in the independent replication dataset of the observed association with diagnosis for each of the 5 negASD and 6 posASD FC-subtypes. Each row corresponds to a bar-plot in (a). From top to bottom, the degrees of replication are: FDR: full replication of the effect after FDR correction, : replication of the effect for uncorrected statistics, effect within CI: observed effect size in the replication sample falls within the 95% confidence interval of the observed effect in the discovery sample, direction: observed effects in the discovery and independent replication sample go in the same direction. (c) Graph illustrating the similarity of continuous assignments to posASD and negASD FC-subtypes. The average continuous assignments of the top 10% of individuals with the highest similarity with a negASD (green shades) or posASD (red shades) FC-subtype are displayed across all identified negASD (left side) and posASD (right side) FC-subtypes. Note that an individual may belong to the top 10% in more than one FC-subtype, and we did check that the conclusions are robust for other thresholds (5%, 15%). (d) Correlation plot of the observed effect sizes in the discovery and independent replication datasets. The dark blue line represents the correlation of effect sizes for subtypes with significant ASD associations in the discovery sample (), the light grey line for all 87 subtypes (). The grey shaded areas reflects the respective estimated 95% CI of the linear fit. MIST_20 seed network names are abbreviated, see Table 1 for full seed network names.
Figure 8
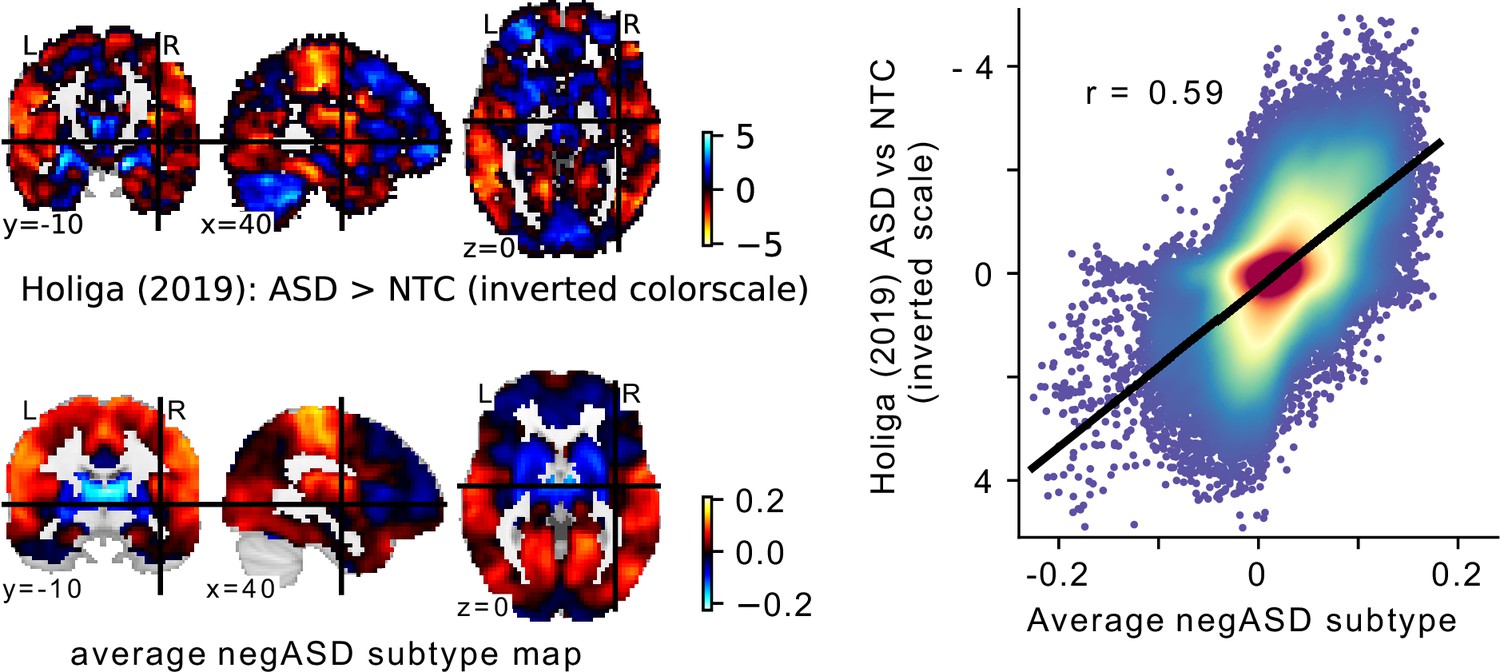
Comparison of the average negASD FC-subtype map to a case-control signature.
(a) The spatial map of a large sample size case-control contrast between ASD and NTC individuals (top row), compared to the average spatial map of the negASD FC-subtypes identified on our data (bottom row). Note that because of the opposite nature of the two contrasts (i.e. ASD >NTC for the case-control contrast and NTC >ASD for the negASD FC-subtype map), the color scale for the case-control map has been inverted for better comparability. (b) Plot of the voxel-wise spatial correlation between the (inverted) case-control contrast map and the average negASD FC-subtype map. The blue to red color gradient reflects the density of voxels represented in each area of the graph.
Appendix 1—figure 1

Topography of FC subtypes for Default Mode Network seed networks.
Appendix 1—figure 2
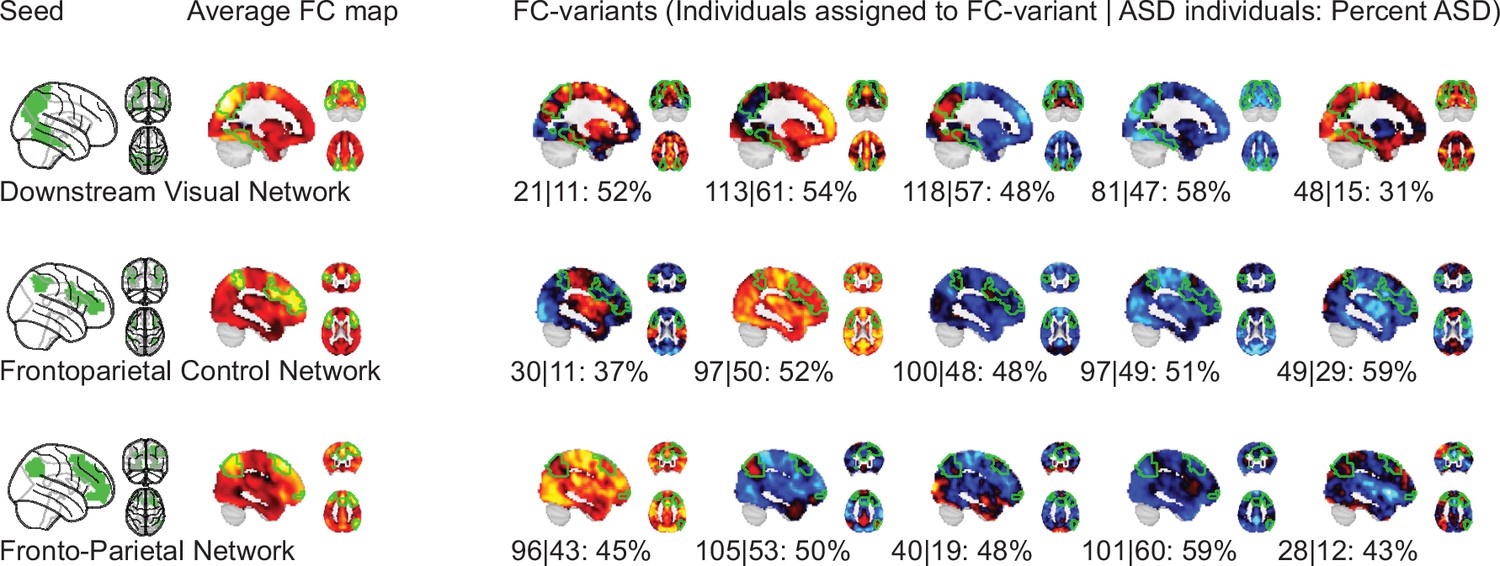
Topography of FC subtypes for seed networks in the frontoparietal control and downstream visual networks.
Appendix 1—figure 3
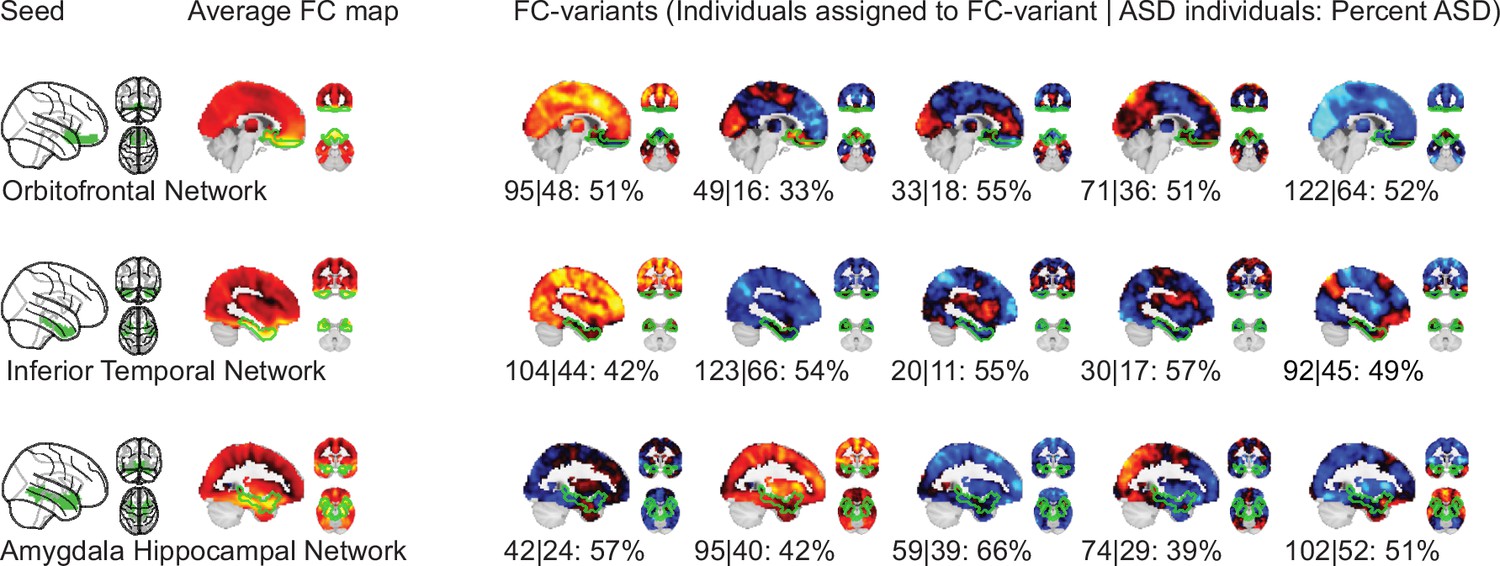
Topography of FC subtypes for seed networks in subcortical, orbitofrontal, and temporal networks.
Appendix 1—figure 4
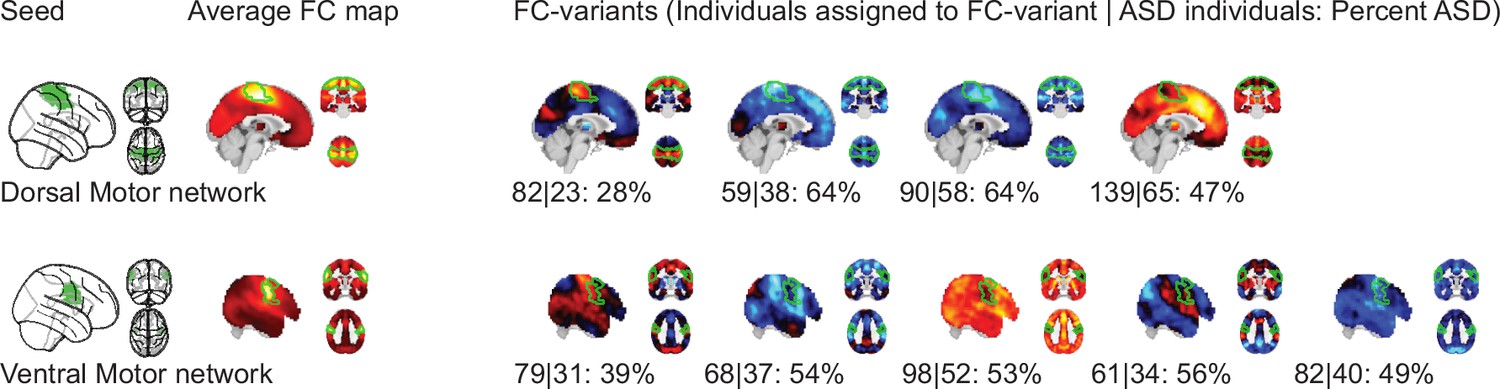
Topography of FC subtypes for motor seed networks.
Appendix 1—figure 5
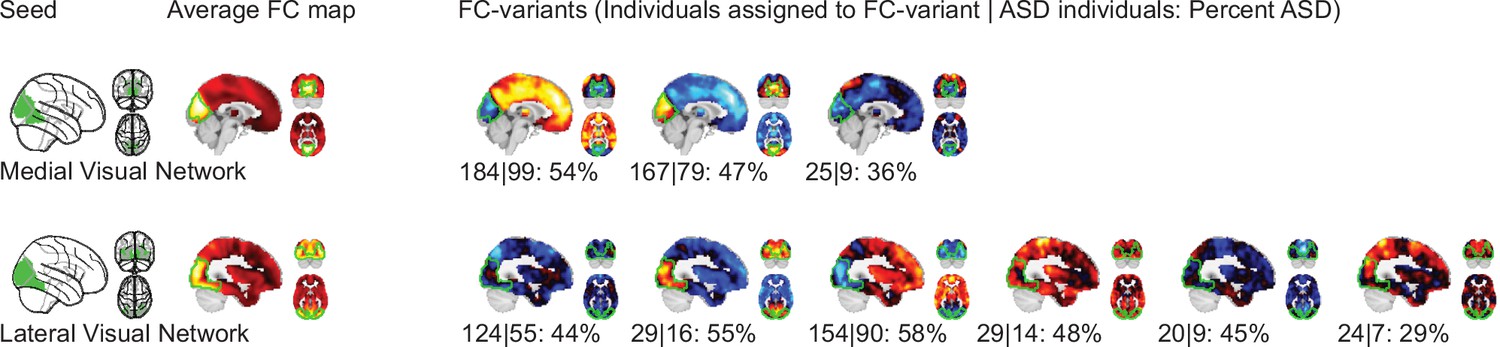
Topography of FC subtypes for visual seed networks.
Appendix 1—figure 6
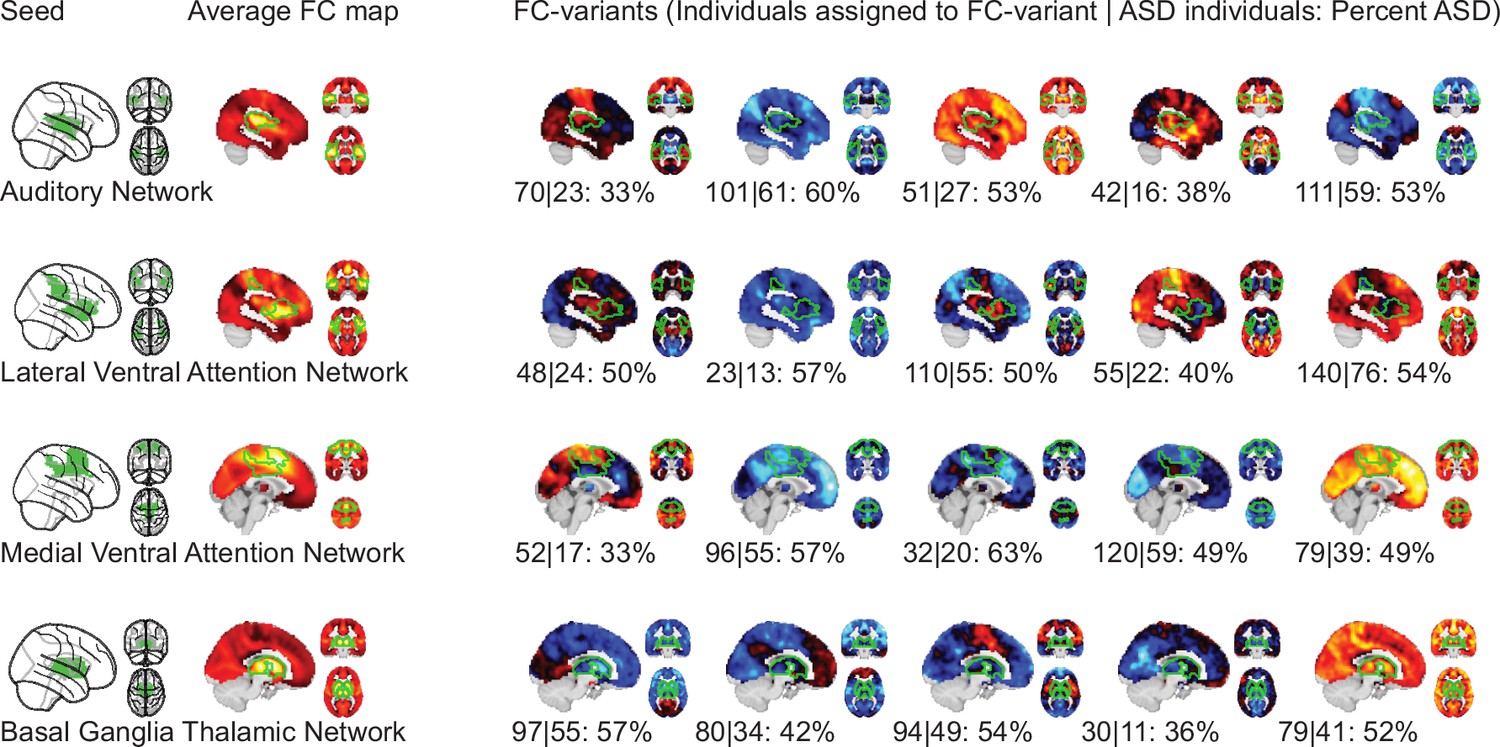
Topography of FC subtypes for seed networks in the ventral attention and salience networks.
Appendix 2—figure 1
Subtype Robustness.
Appendix 3—figure 1
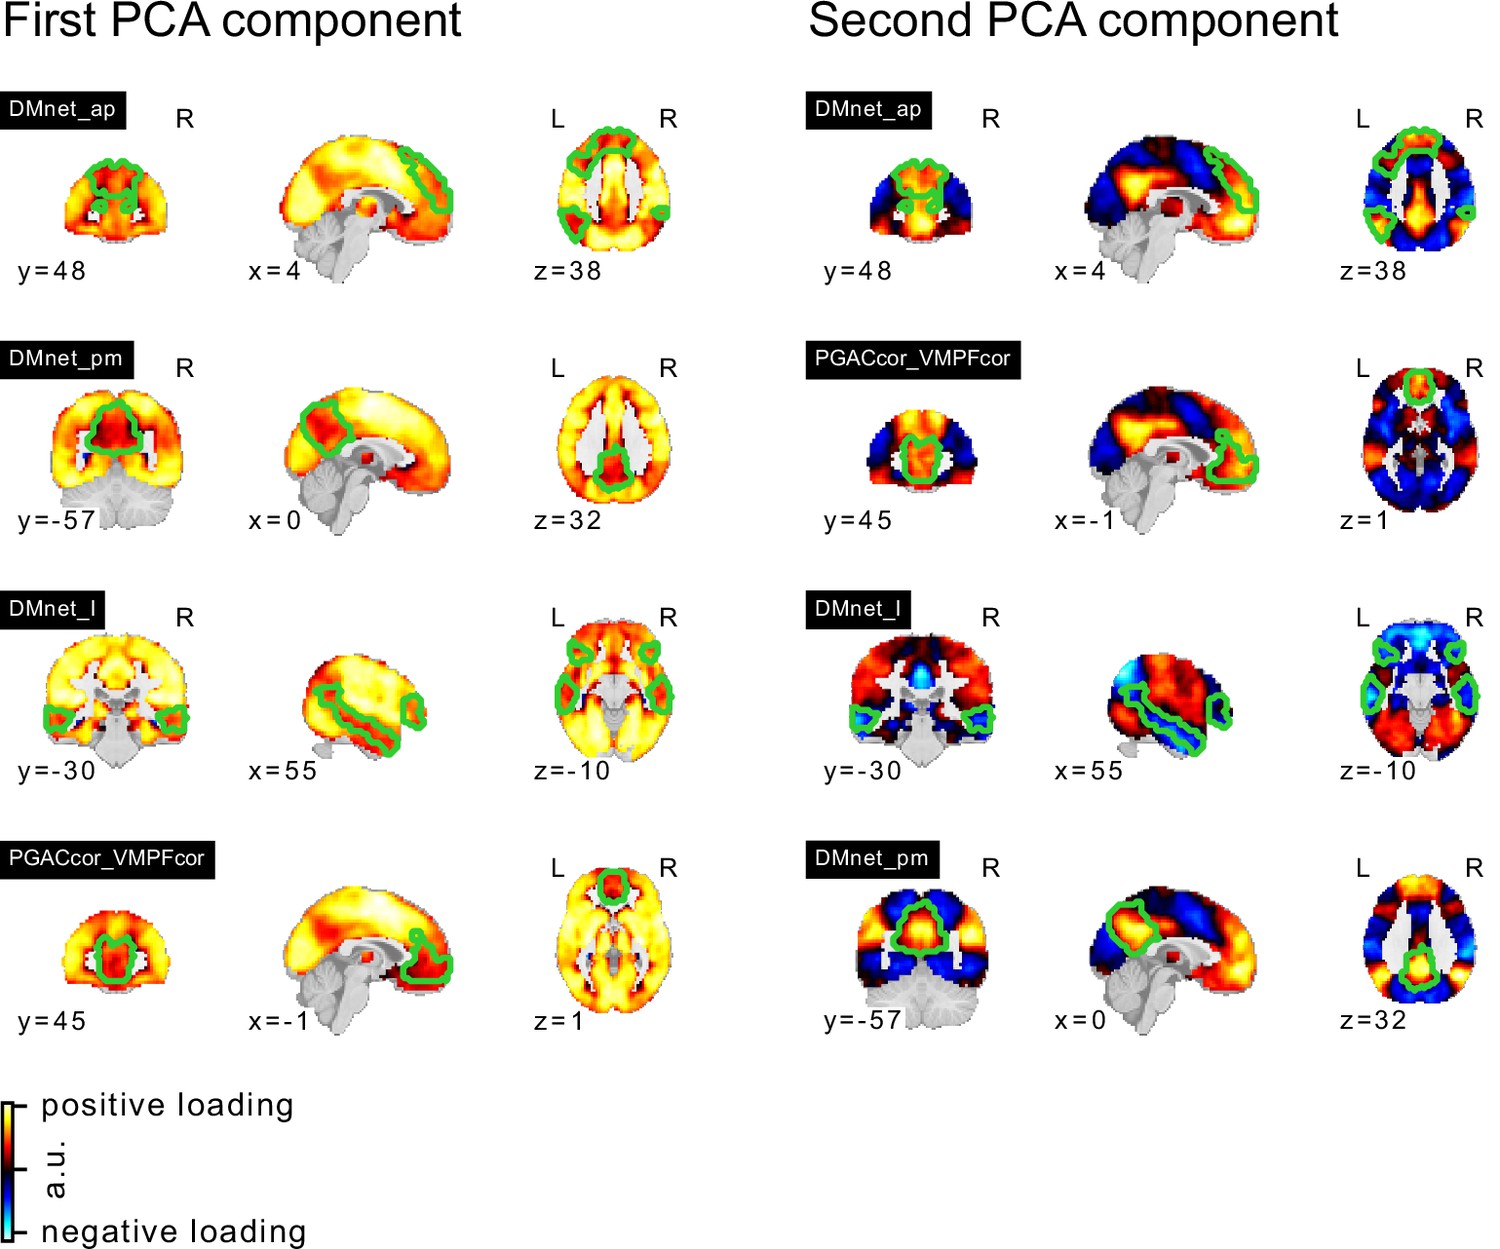
PCA components of Default Mode Network seed networks.
Appendix 3—figure 2
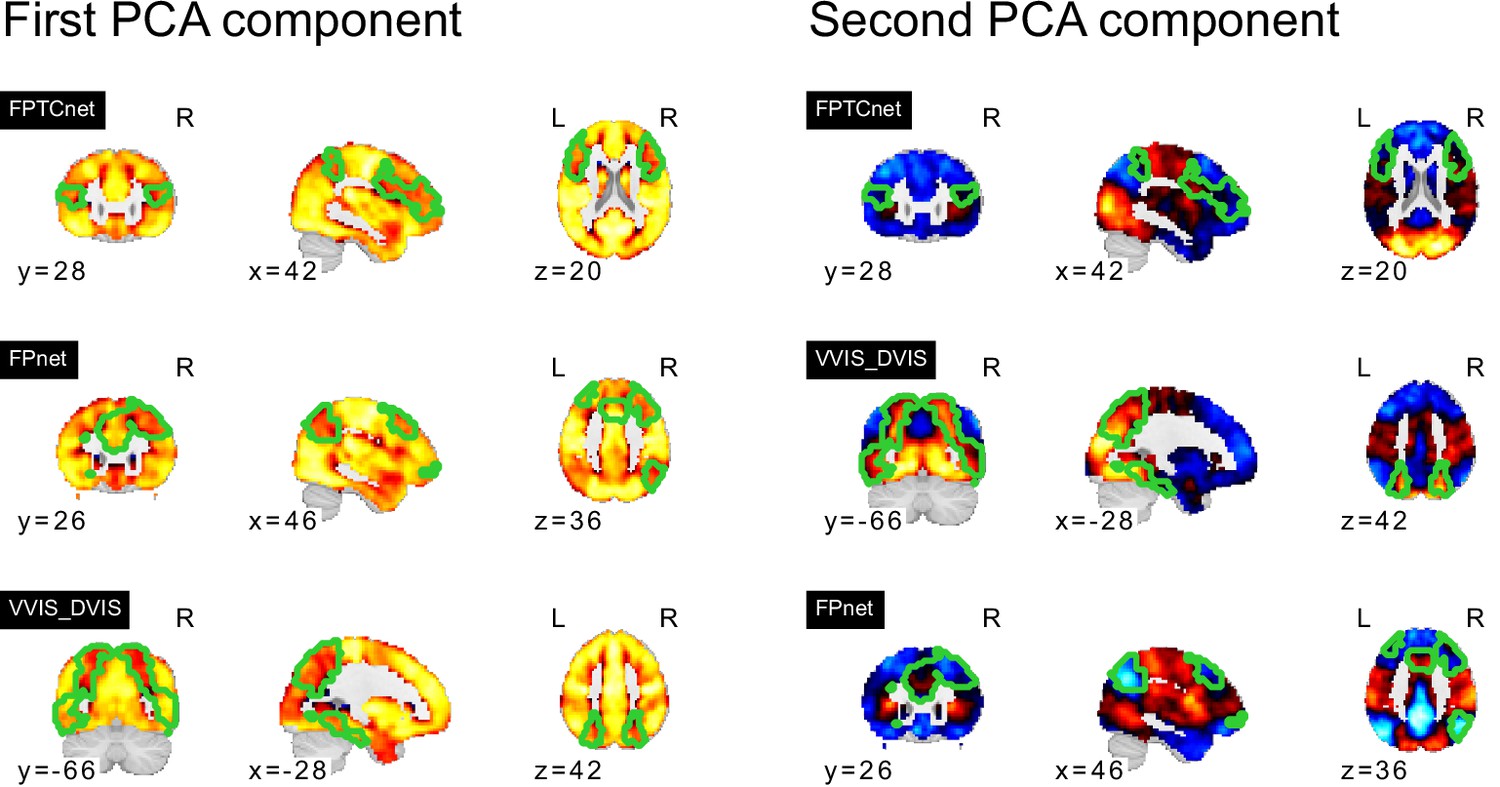
PCA components of seed networks in the frontoparietal control and downstream visual networks.
Appendix 3—figure 3
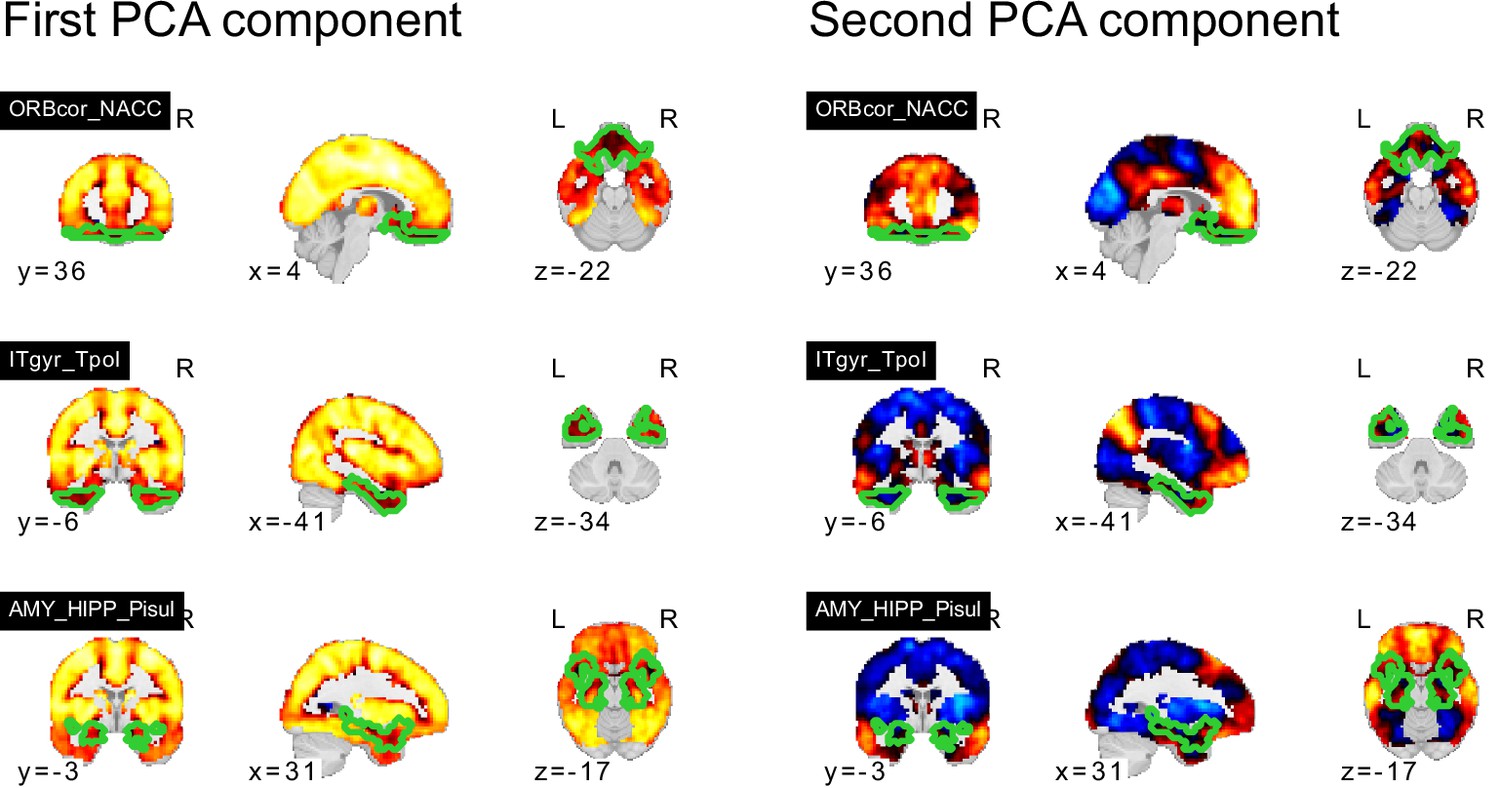
PCA components of seed networks in the subcortical, orbitofrontal, and temporal networks.
Appendix 3—figure 4
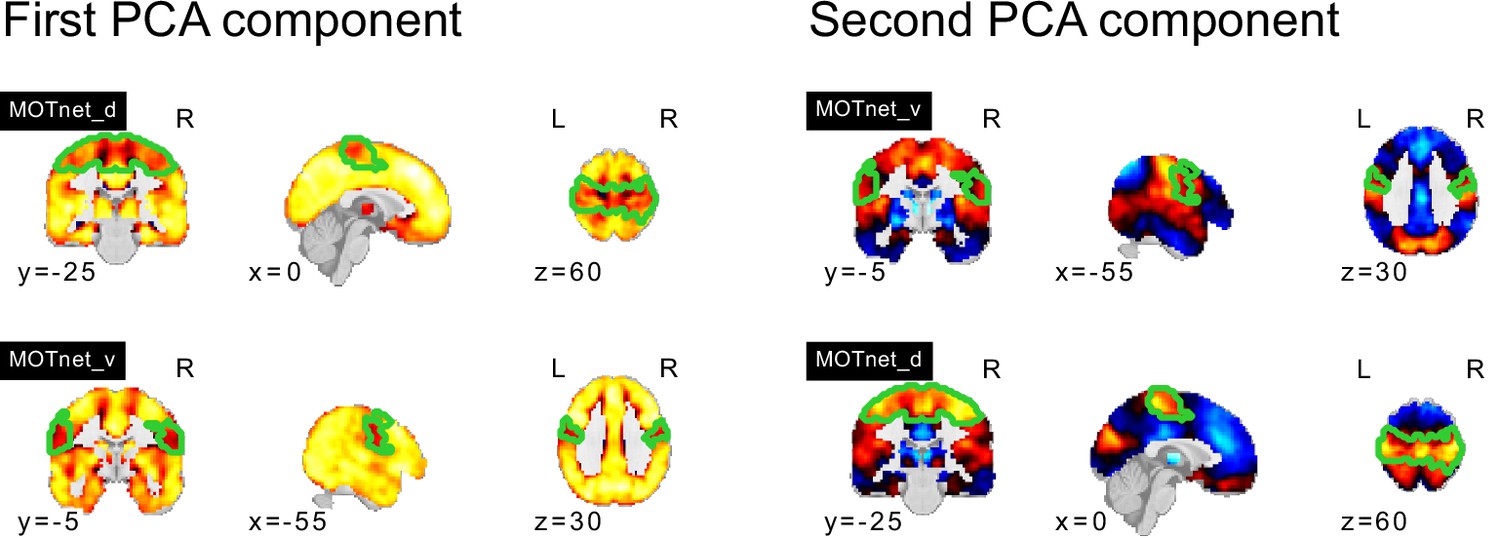
PCA components of motor seed networks.
Appendix 3—figure 5

PCA components of visual seed networks.
Appendix 3—figure 6
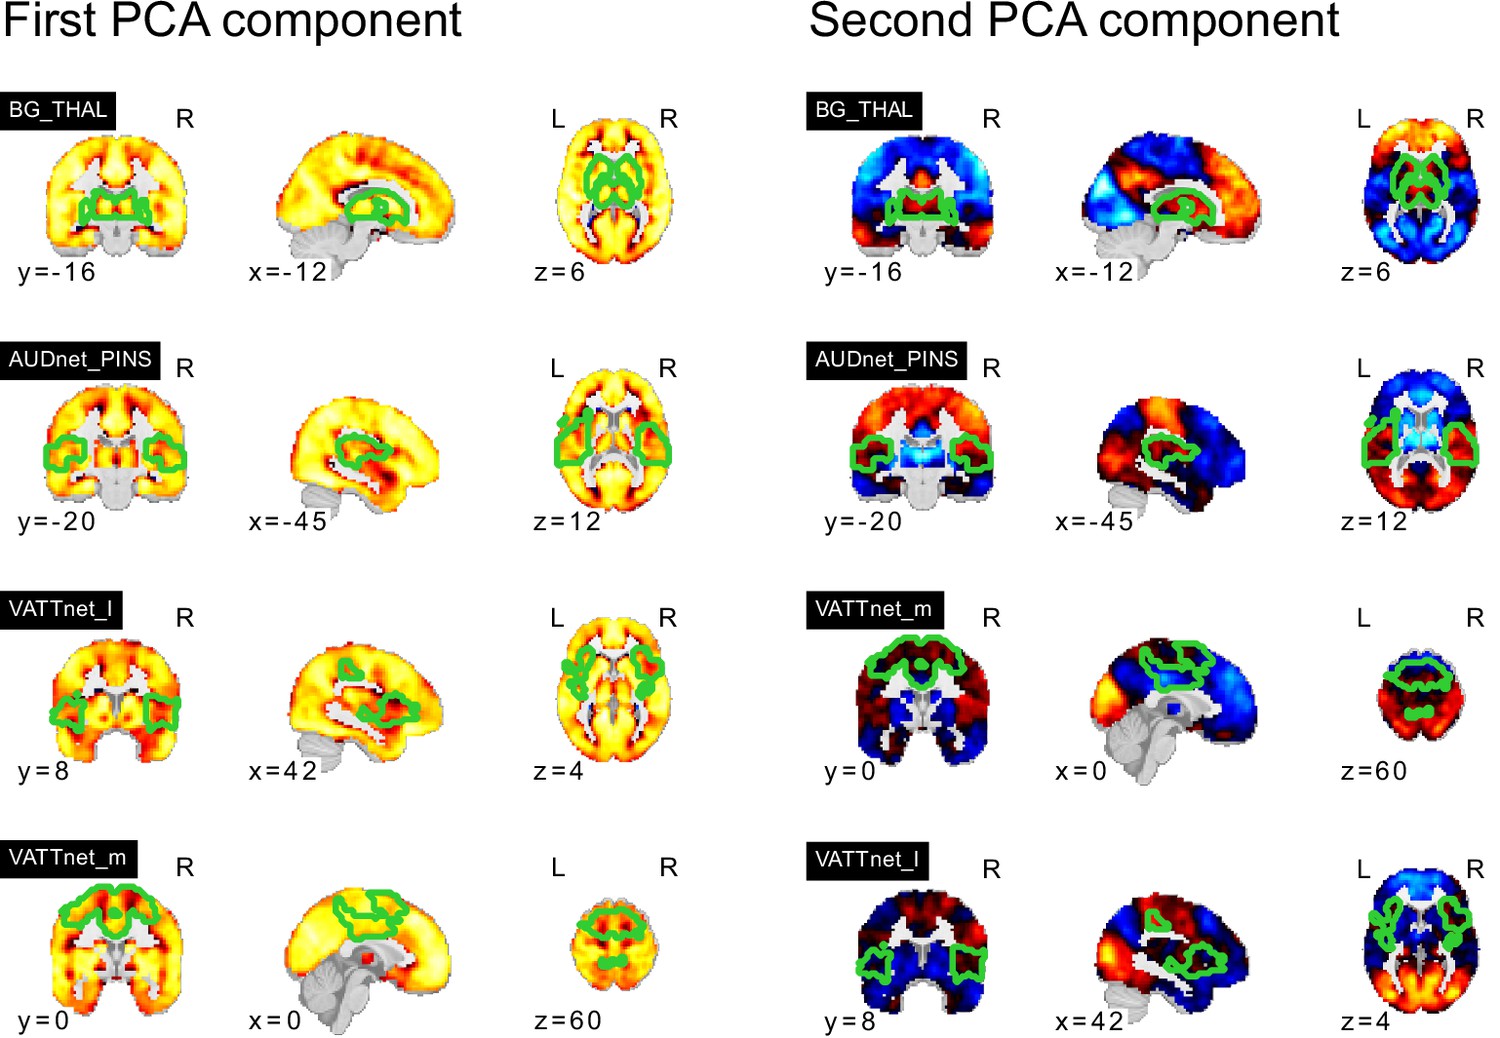
PCA components of seed networks in the ventral attention and salience networks.
Tables
Table 1
The 18 non-cerebellar MIST_20 seed network names and their abbreviation.
| Abbreviation | Network name |
|---|---|
| BG_THAL | Basal ganglia and thalamus |
| MOTnet_v | Somatomotor network ventral |
| ORBcor_NACC | Orbitofrontal cortex and nucleus accumbens |
| PGACcor_VMPFcor | Perigenual anterior cingulate cortex and ventromedial prefrontal cortex |
| ITgyr_Tpol | Inferior temporal gyrus and temporal pole |
| FPTCnet | Fronto parietal task control network |
| AUDnet_PINS | Auditory network and posterior insula |
| MVISnet | Medial visual network |
| AMY_HIPP_Pisul | Amygdala and hippocampus and peri insular sulcus |
| MOTnet_d | Somatomotor network dorsal |
| VATTnet_m | Ventral attention network medial |
| DMnet_ap | Default mode network anteriorposterior |
| DMnet_pm | Default mode network posteromedial |
| LVISnet | Lateral visual network |
| VVIS_DVIS | Ventral visual stream and dorsal visual stream |
| DMnet_l | Default mode network lateral |
| VATTnet_l | Ventral attention network lateral |
| FPnet | Fronto parietal network |
Additional files
Download links
A two-part list of links to download the article, or parts of the article, in various formats.
Downloads (link to download the article as PDF)
Open citations (links to open the citations from this article in various online reference manager services)
Cite this article (links to download the citations from this article in formats compatible with various reference manager tools)
Functional connectivity subtypes associate robustly with ASD diagnosis
eLife 11:e56257.
https://doi.org/10.7554/eLife.56257


