BAD inactivation exacerbates rheumatoid arthritis pathology by promoting survival of sublining macrophages
- The State Key Laboratory of Cell Biology, CAS Center for Excellence in Molecular Cell Science, Shanghai Institute of Biochemistry and Cell Biology, Chinese Academy of Sciences; University of Chinese Academy of Sciences, China
- School of Life Science and Technology, ShanghaiTech University, China
- Ben May Department for Cancer Research, The University of Chicago, United States
- Institute of Modern Biology, Nanjing University, China
- Blood Research Institute, Blood Center of Wisconsin, United States
- Department of Orthopaedics, Longhua Hospital, Shanghai University of Traditional Chinese Medicine, China
- Department of Biology, Illinois Institute of Technology, United States
Figures
Figure 1 with 1 supplement
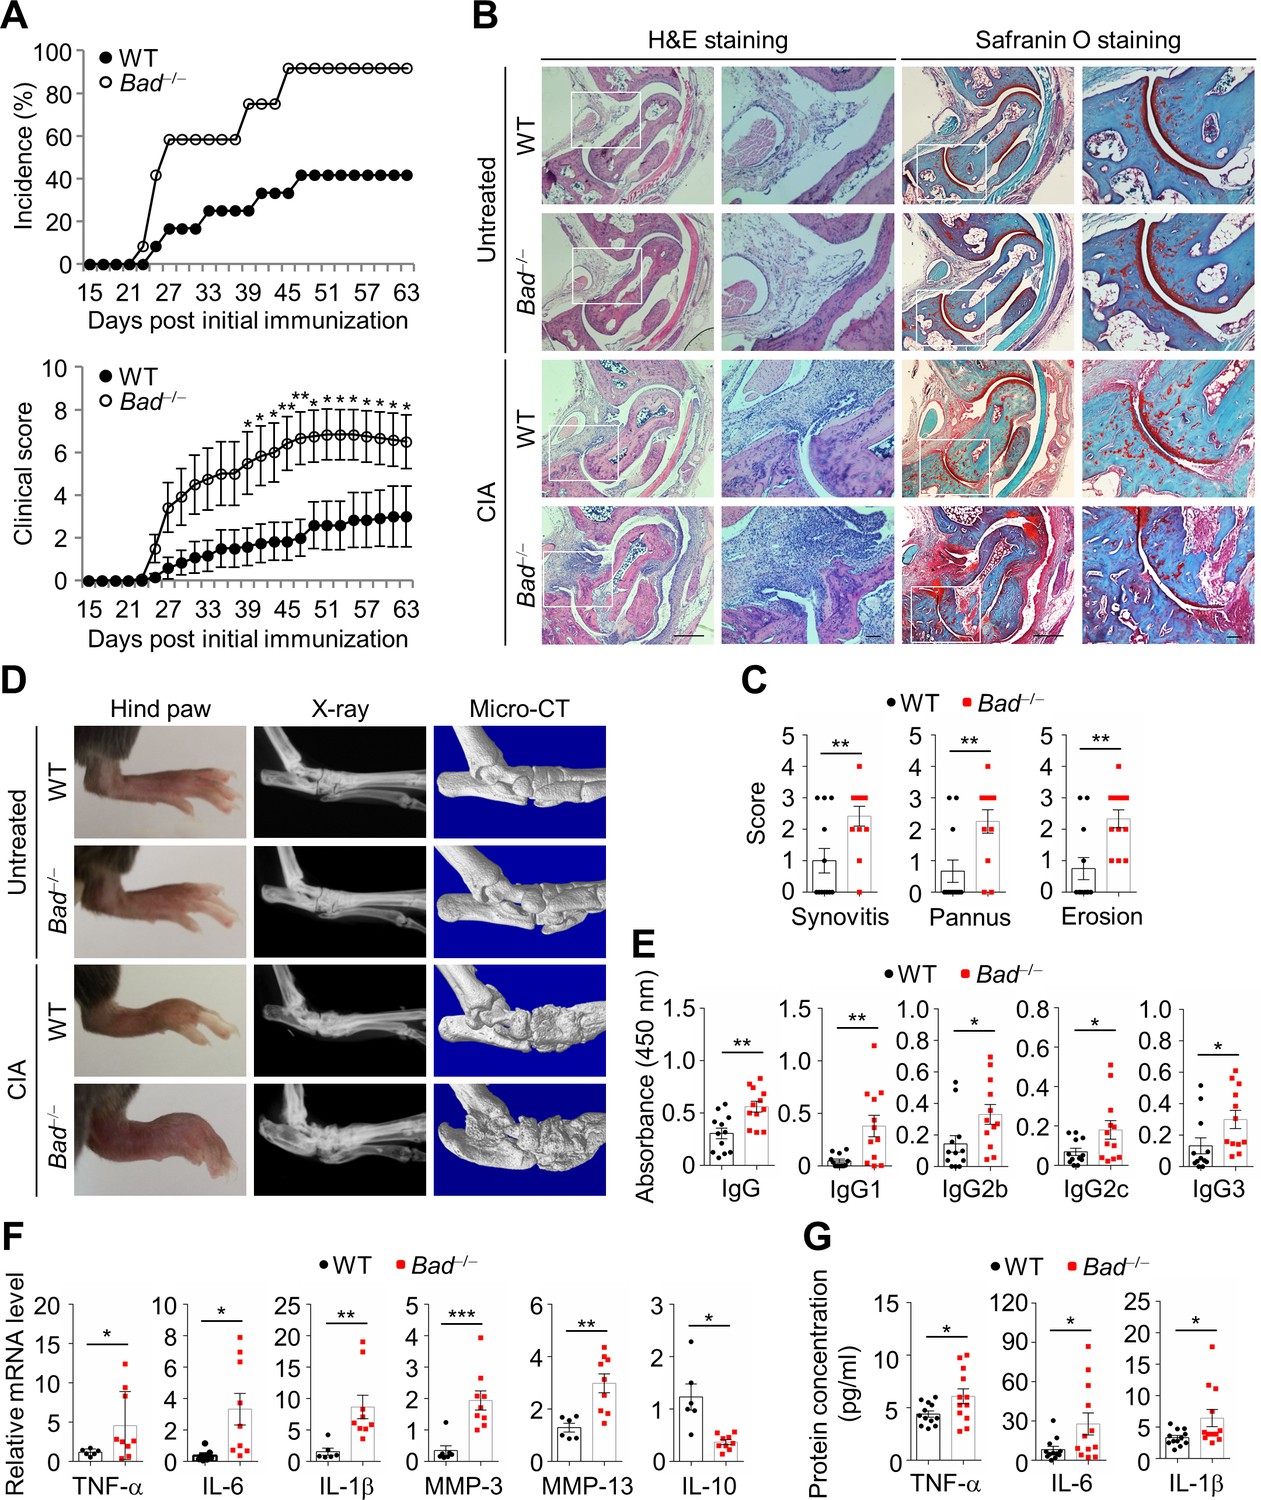
Bad loss aggravates collagen-induced arthritis (CIA).
(A) Incidence and clinical scores of wild-type (WT; n = 12) and Bad−/− (n = 12) mice in CIA model. (B) H & E and Safranin O staining in ankle joint sections of WT and Bad−/− mice in CIA model and untreated control mice, ankle joints were harvested 63 days after primary immunization. Scale bar, 500 μm; magnified inset, 100 μm. (C) Evaluation of synovitis, pannus, and erosion of ankle joints of WT (n = 12) and Bad−/− (n = 12) mice in CIA model. (D) Representative photographs and radiographs of the hind paws of WT and Bad−/− mice in CIA model and untreated control mice. (E) Circulating levels of collagen II-specific antibodies in serum of WT (n = 12) and Bad−/− (n = 12) mice in CIA model were determined by ELISA. (F) Relative mRNA expression levels of pro-inflammatory cytokines (TNFα, IL-6, and IL-1β), matrix degradation enzymes (MMP-3 and MMP-13), and anti-inflammatory cytokine IL-10 in the joints of WT (n = 6) and Bad−/− (n = 9) mice in CIA model were determined by real-time qPCR. (G) Protein levels of pro-inflammatory cytokines TNFα, IL-6, and IL-1β in the serum of WT (n = 12) and Bad−/− (n = 12) mice in CIA model were determined by ELISA. All data are presented as mean ± SEM, and dots represent individual mice. Significant difference was analyzed by Mann–Whitney U-test (A) or unpaired Student’s t-test (C, E, F, and G), *p<0.05; **p<0.01; ***p<0.001.
-
Figure 1—source data 1
Source data for graphs in Figure 1A,C,E,F, and G.
- https://cdn.elifesciences.org/articles/56309/elife-56309-fig1-data1-v1.xlsx
Figure 1—figure supplement 1
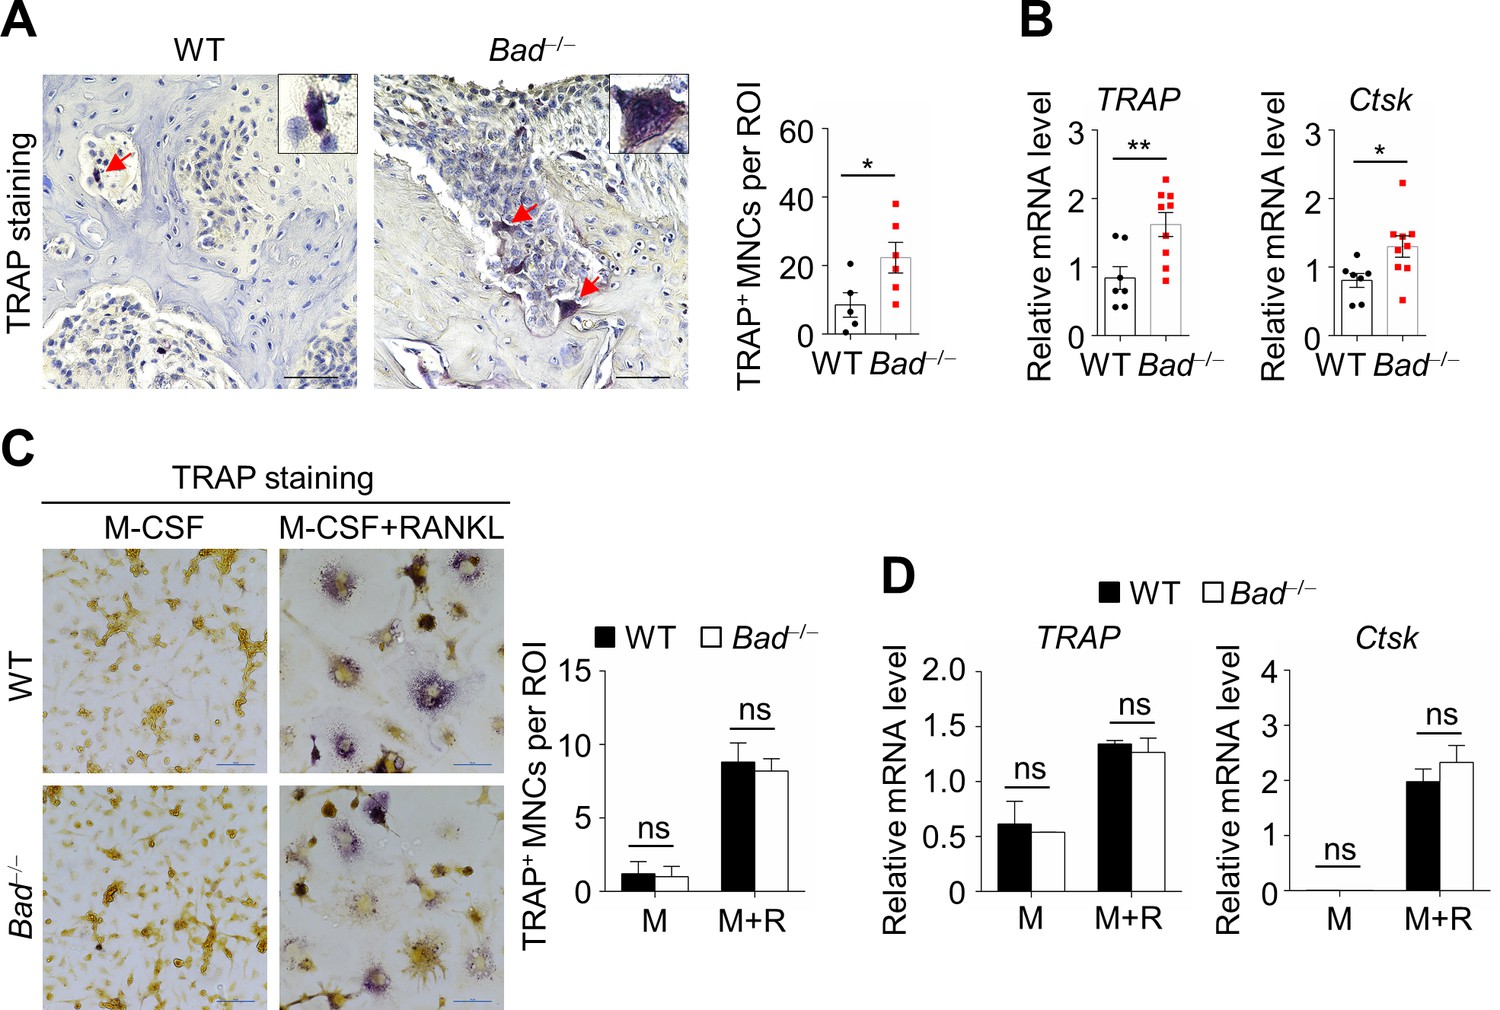
BAD deficiency does not affect osteoclast activation in vitro.
(A) TRAP staining and quantification of TRAP+ multinucleated cells (MNCs) per field in the joints of wild-type (WT) (n = 5) and Bad−/− (n = 6) mice in CIA model. Scale bar, 50 μm. (B) Relative mRNA expression levels of osteoclast specific markers (TRAP and Ctsk) in the joints of WT (n = 7) and Bad−/− (n = 9) mice in CIA model. (C) WT and Bad−/−bone marrow-derived macrophages (BMDMs) were treated with M-CSF and RANKL to induce osteoclast differentiation, osteoclasts were detected by TRAP staining. Scale bar, 50 μm. The number of TRAP positive MNCs per field was quantified. (D) Relative mRNA expression levels of TRAP and Ctsk in BMDMs treated with M-CSF and RANKL. Data in (C and D) represent two individual experiments with similar results. All data are presented as mean ± SEM, dots represent individual mice. Significant difference was analyzed by unpaired Student’s t-test, *p<0.05; **p<0.01.
-
Figure 1—figure supplement 1—source data 1
Source data for graphs in Figure 1—figure supplement 1.
- https://cdn.elifesciences.org/articles/56309/elife-56309-fig1-figsupp1-data1-v1.xlsx
Figure 2 with 7 supplements
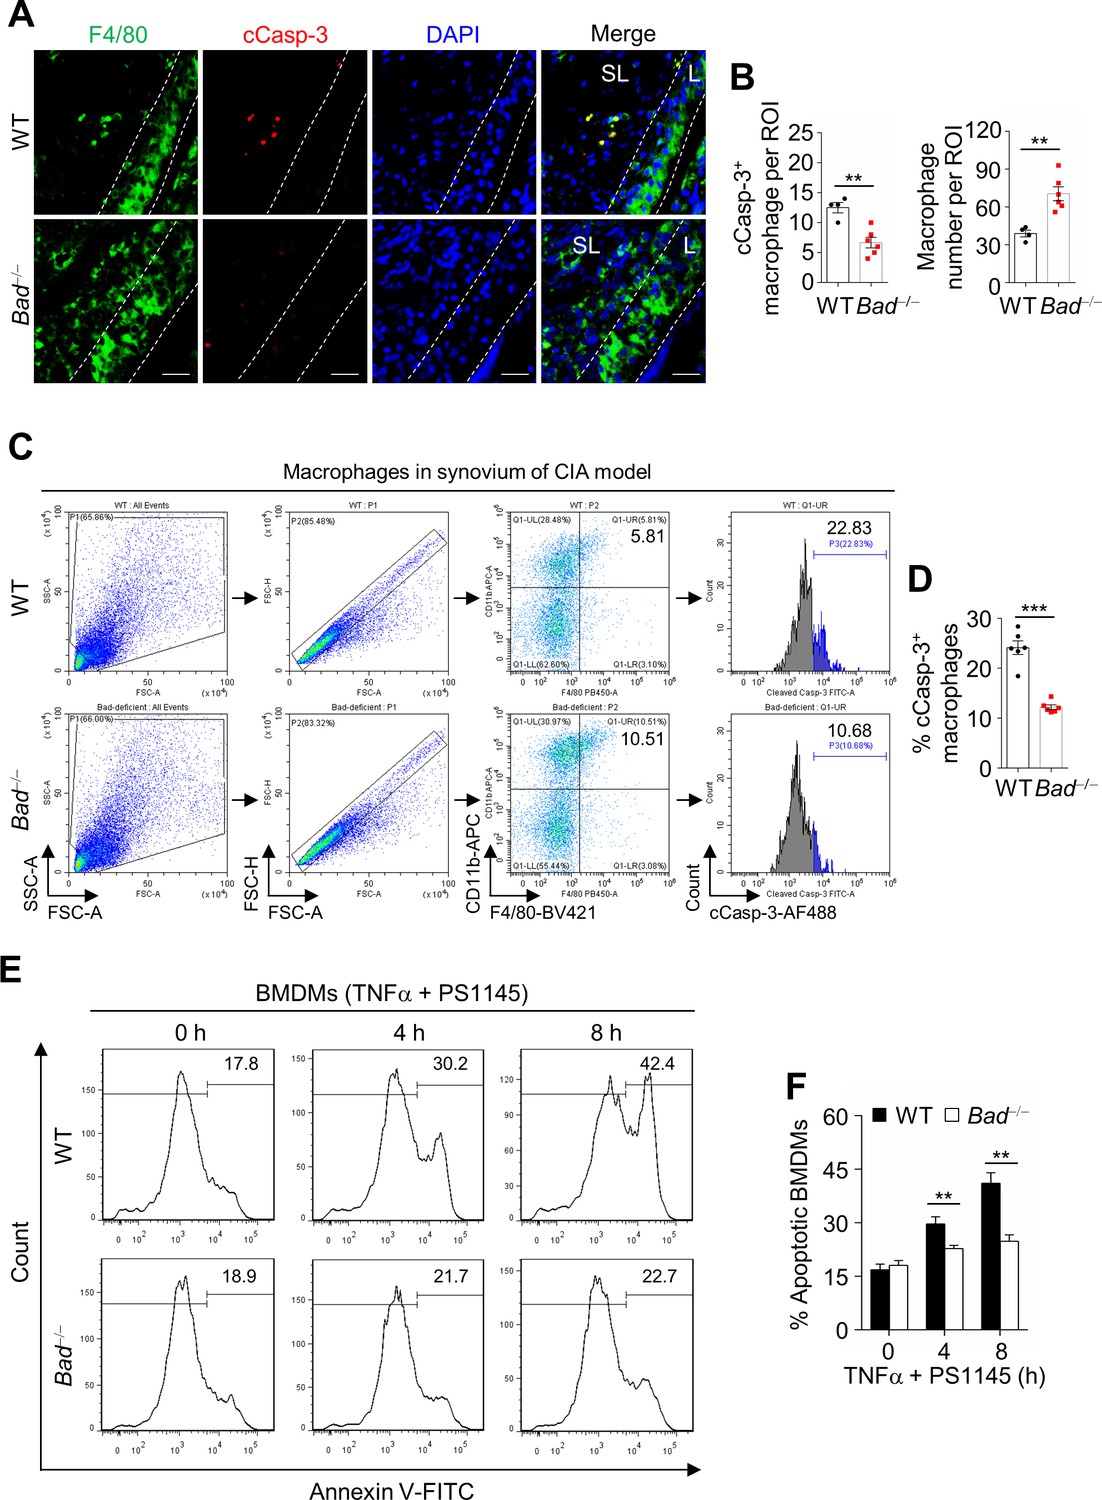
Bad loss protects synovial macrophages from apoptosis in collagen-induced arthritis (CIA).
(A) Double staining of anti-F4/80 and anti-cleaved Casp-3 in the ankle joint sections of wild-type (WT) and Bad−/− mice in CIA model. L: lining; SL: Sublining. Scale bar, 25 μm. (B) Quantification of the number of cleaved Casp-3 positive macrophage and total macrophage per region of interest (ROI) in the ankle joint sections of WT (n = 4) and Bad−/− (n = 6) mice in CIA model. (C) Apoptotic synovial macrophages from WT and Bad−/− mice in CIA model were analyzed by flow cytometry by staining cleaved Casp-3. (D) Quantification of the ratio of cleaved Casp-3 positive synovial macrophages in WT (n = 6) and Bad−/− (n = 6) mice in CIA model. (E) Apoptotic cell death of WT and Bad−/− bone marrow-derived macrophages (BMDMs) pretreated with PS1145 (10 μM) for 2 hr, followed by stimulation with TNFα (5 ng/ml) for various times as indicated, was analyzed by flow cytometry. (F) Quantification of apoptotic BMDMs for various time points as indicated. Data in (E and F) represent two individual experiments with similar results. All data are presented as mean ± SEM; dots represent individual mice. Significant difference was analyzed by unpaired Student’s t-test, **p<0.01; ***p<0.001.
-
Figure 2—source data 1
Source data for graphs in Figure 2B,D, and F.
- https://cdn.elifesciences.org/articles/56309/elife-56309-fig2-data1-v1.xlsx
-
Figure 2—source data 2
Source data for graphs in Figure 2—figure supplements 1–7.
- https://cdn.elifesciences.org/articles/56309/elife-56309-fig2-data2-v1.xlsx
Figure 2—figure supplement 1
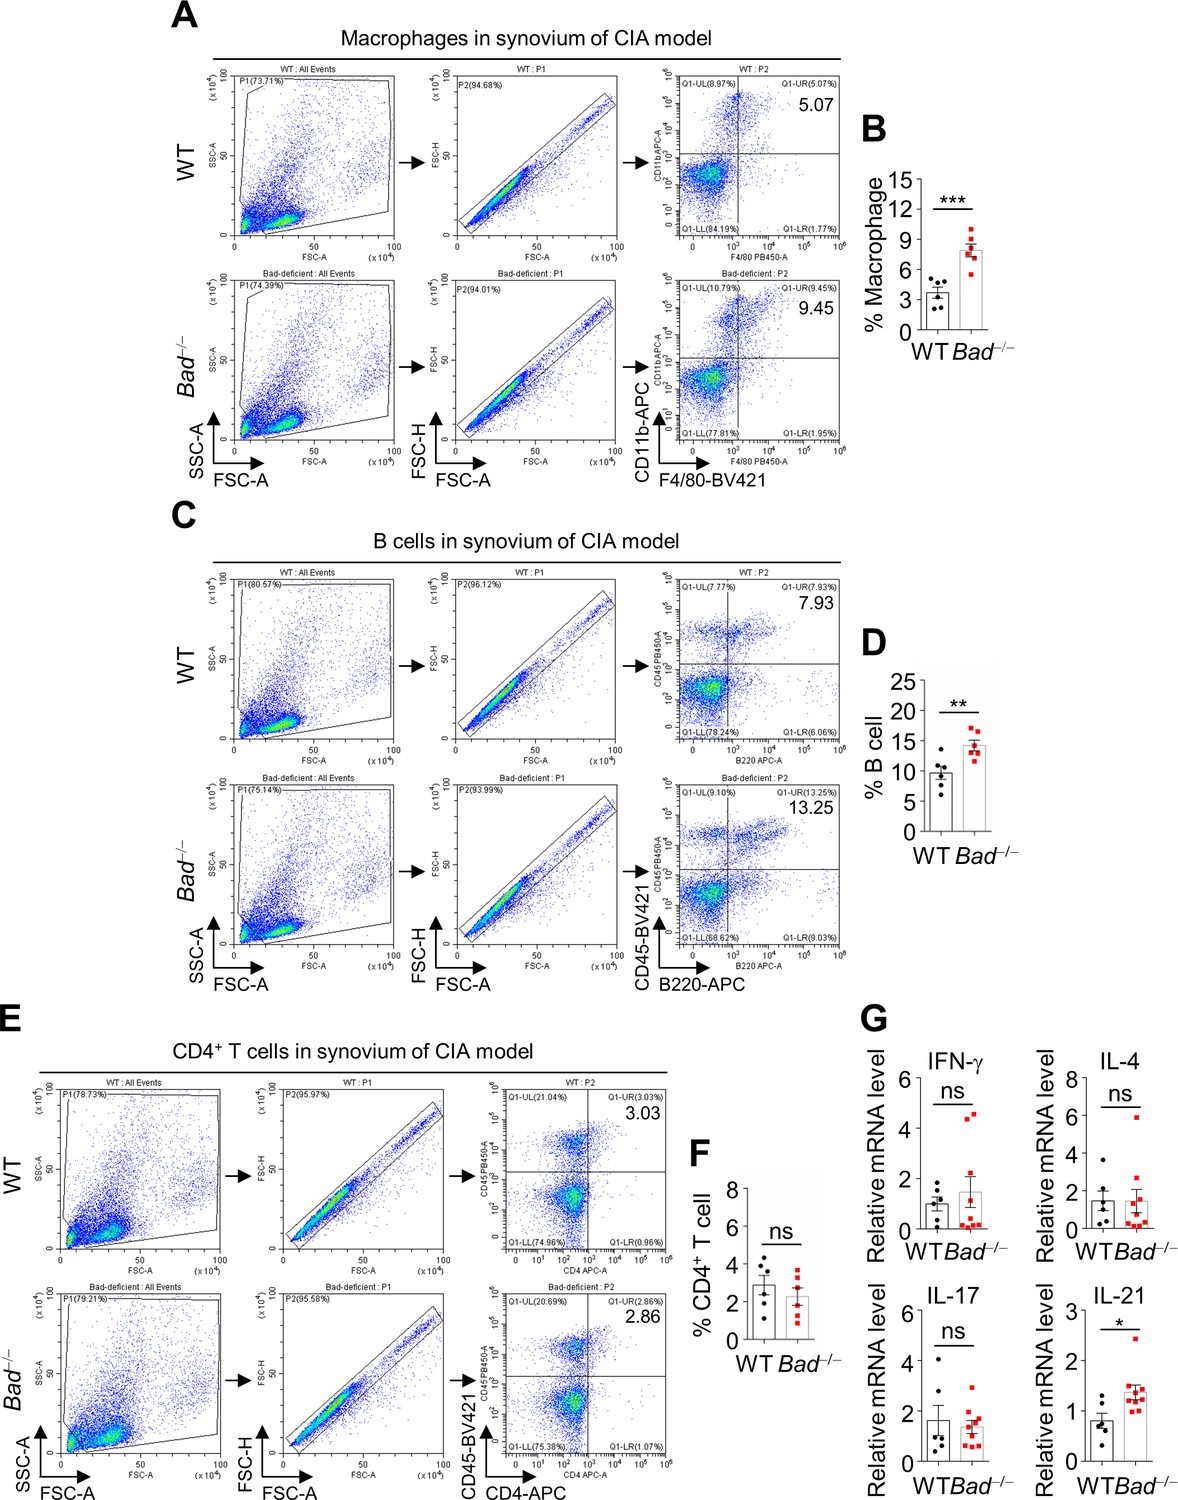
The percentages of macrophage, B cell, and CD4+ T cell in synovium of wild-type (WT) and Bad−/− mice in collagen-induced arthritis (CIA) model.
(A, C, and E) The percentages of macrophage (CD11b+ F4/80+) (A), B cell (CD45+ B220+) (C), and CD4+ T cell (CD45+ CD4+) (E) in the synovium of WT and Bad−/− mice in CIA model were determined by flow cytometry. (B, D, and F) Quantification of the percentages of macrophage (B), B cell (D), and CD4+ T cell (F) in the synovium of WT (n = 6) and Bad−/− (n = 6) mice in CIA model. (G) Relative mRNA expression levels of cytokines secreted by CD4+ T cell subtypes in the joints of WT (n = 6) and Bad−/− (n = 9) mice in CIA model. All data are presented as mean ± SEM; dots represent individual mice. Significant difference was analyzed by unpaired Student’s t-test, *p<0.05; **p<0.01; ***p<0.001.
Figure 2—figure supplement 2
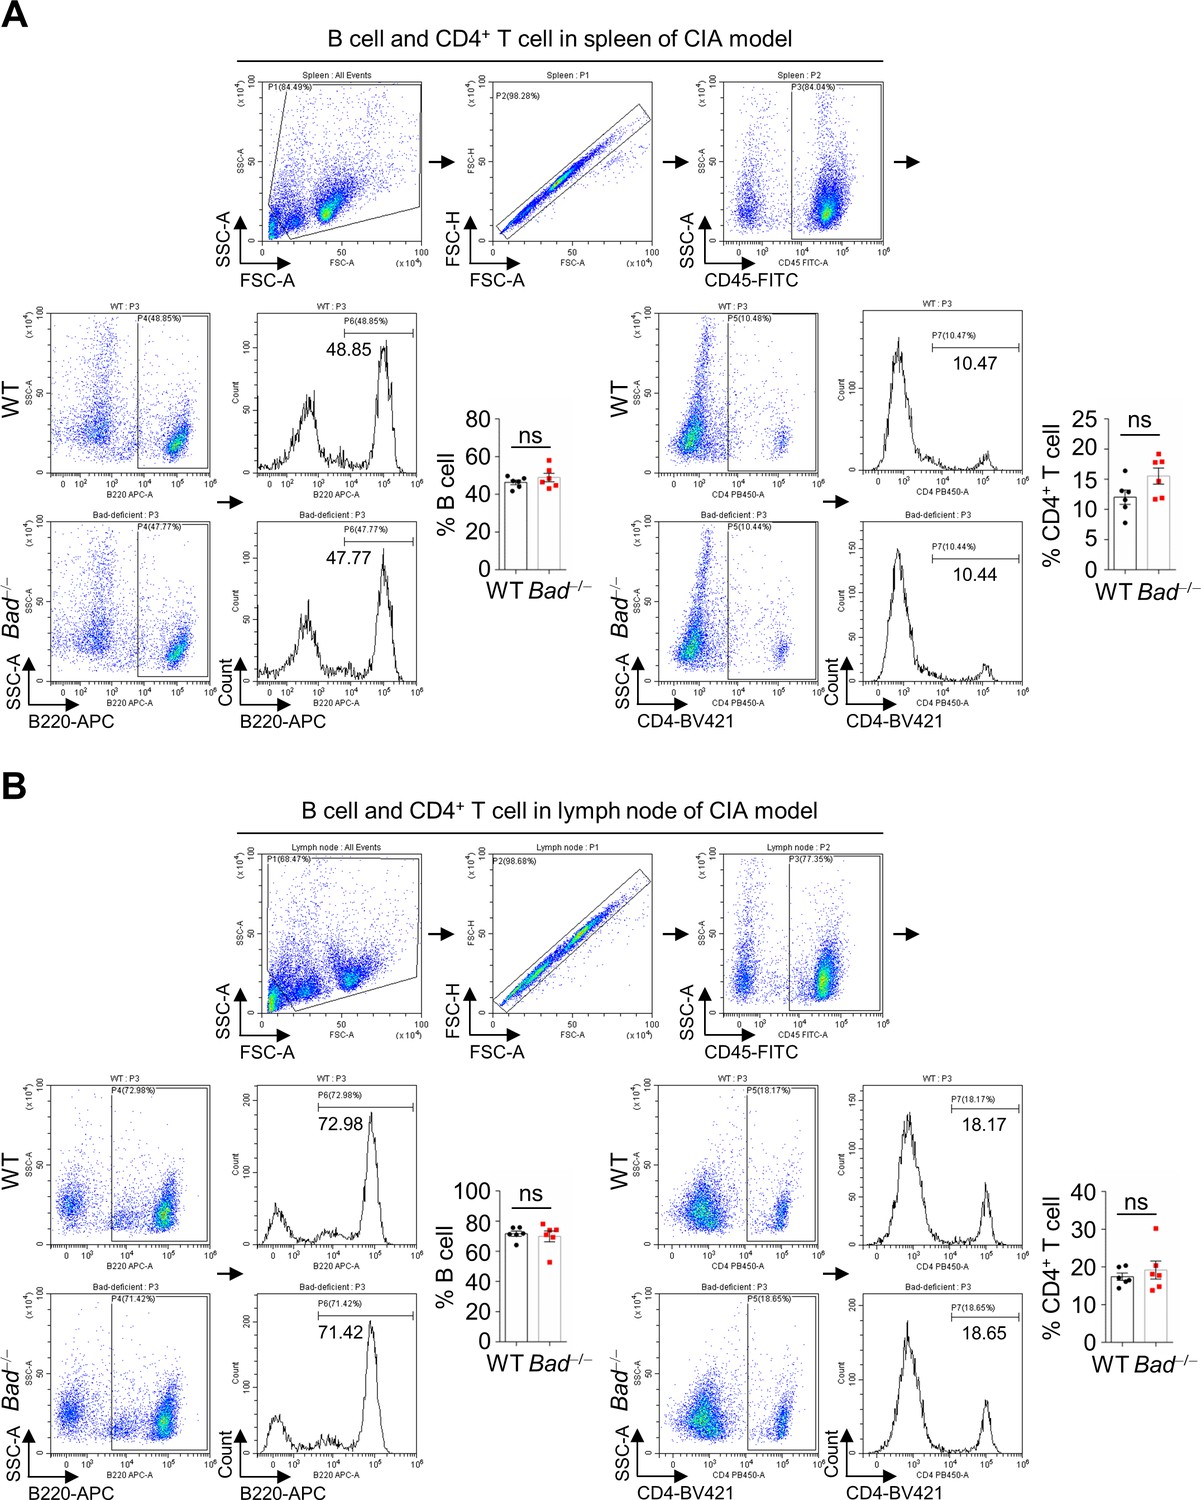
The number of B cell and CD4+ T cell in spleen and lymph node (LN) has no significant difference between wild-type (WT) and Bad−/− mice in collagen-induced arthritis (CIA) model.
(A) The percentages of B cell and CD4+ T cell in the spleen of WT and Bad−/− mice in CIA model were determined by flow cytometry. (B) The percentages of B cell and CD4+ T cell in the LN of WT and Bad−/− mice in CIA model were determined by flow cytometry. All data are presented as mean ± SEM, dots represent individual mice, and n = 6 for each group. Significant difference was analyzed by unpaired Student’s t-test.
Figure 2—figure supplement 3
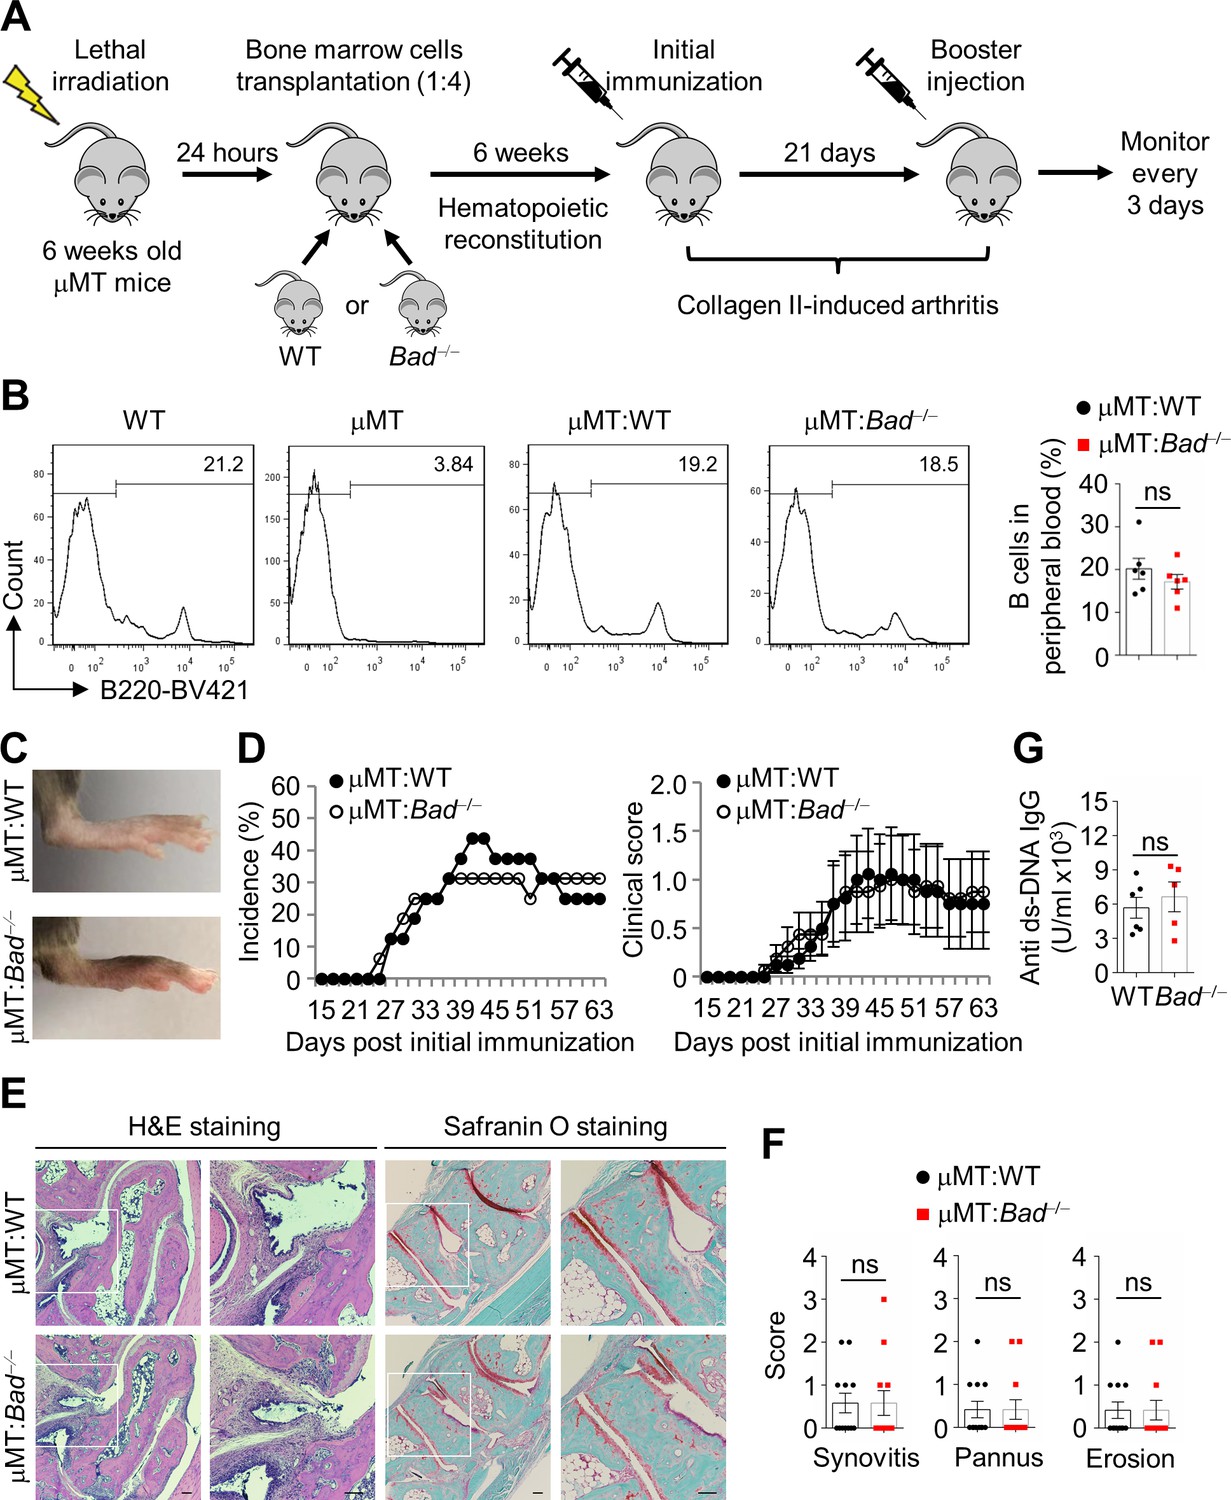
Bad-deficient B cells alone are not sufficient to promote collagen-induced arthritis (CIA).
(A) The experimental design diagram for bone marrow transplantation in μMT mice followed by CIA model. (B) The percentages of B cell in the peripheral blood (6 weeks after transplantation) of μMT:wild-type (WT) (n = 6) and μMT:Bad−/− (n = 6) mice were analyzed by flow cytometry. WT mice served as positive control and μMT mice served as negative control. (C) Representative photographs of the hind paws from μMT:WT mice and μMT:Bad−/− mice in CIA model. (D) Incidence and clinical scores of μMT:WT (n = 16) and μMT:Bad−/− (n = 16) mice in CIA model. (E) H & E and Safranin O staining in ankle joint sections of μMT:WT and μMT:Bad−/− mice in CIA model, ankle joints were harvested 63 days after primary immunization. Scale bar, 100 μm. (F) Evaluation of synovitis, pannus, and erosion of ankle joints from μMT:WT (n = 12) and μMT:Bad−/− (n = 12) mice in CIA model. (G) Anti-dsDNA IgG levels in the serum of 5-month-old WT (n = 6) and Bad−/− (n = 5) mice were detected by ELISA. All data are presented as mean ± SEM; dots represent individual mice. Significant difference was analyzed by Mann–Whitney U-test (D) or unpaired Student’s t-test (B, F, and G).
Figure 2—figure supplement 4
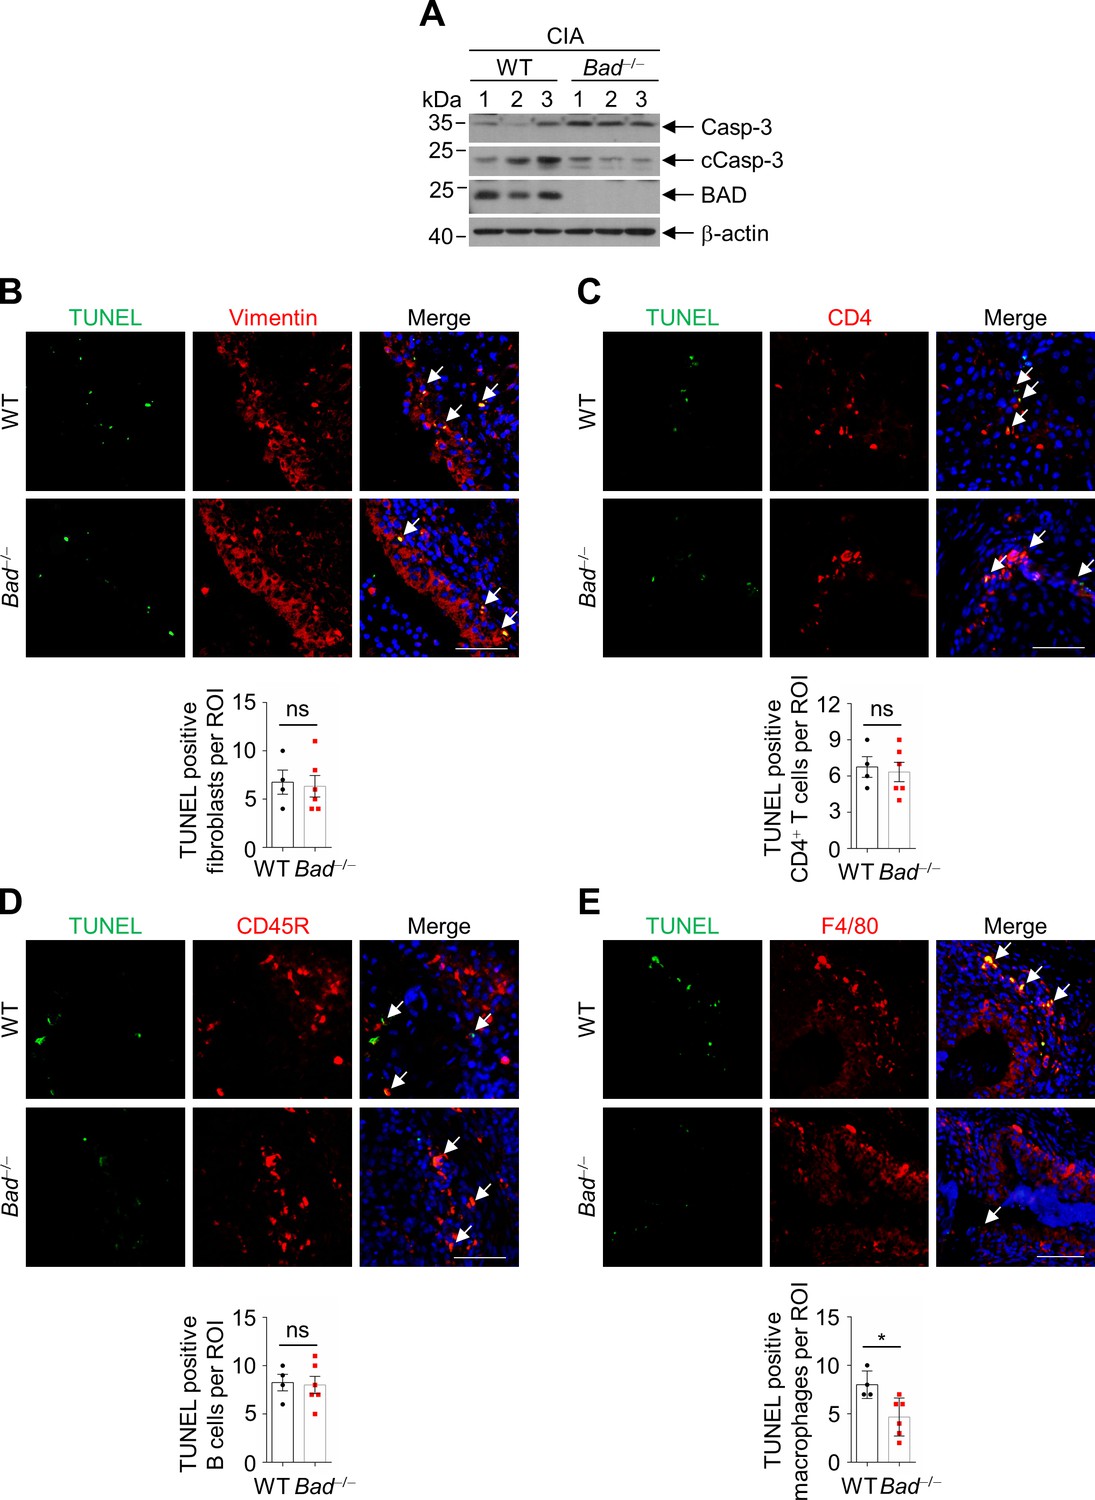
Bad loss inhibits apoptosis in macrophages but not in fibroblasts, CD4+ T cells, or B cells in collagen-induced arthritis (CIA).
(A) Immunoblotting analysis of caspase-3, cCasp-3, and BAD in ankle joint extracts of immunized wild-type (WT) (n = 3) and Bad−/− (n = 3) mice. (B) Double staining of anti-Vimentin (fibroblast marker) and TUNEL in ankle sections of WT (n = 4) and Bad−/− (n = 6) mice in CIA model. The number of Vimentin and TUNEL double positive cells per field was quantified. (C) Double staining of anti-CD4 (CD4+ T cell marker) and TUNEL in ankle sections of WT (n = 4) and Bad−/− (n = 6) mice in CIA model. The number of CD4 and TUNEL double positive cells per field was quantified. (D) Double staining of anti-CD45R (B cell marker) and TUNEL in ankle sections of WT (n = 4) and Bad−/− (n = 6) mice in CIA model. The number of CD45R and TUNEL double positive cells per field was quantified. (E) Double staining of anti-F4/80 (macrophage marker) and TUNEL in ankle sections of WT (n = 4) and Bad−/− (n = 6) mice in CIA model. The number of F4/80 and TUNEL double positive cells per field was quantified. Scale bar, 50 μm. All data are presented as mean ± SEM; dots represent individual mice. Significant difference was analyzed by unpaired Student’s t-test, *p<0.05.
Figure 2—figure supplement 5
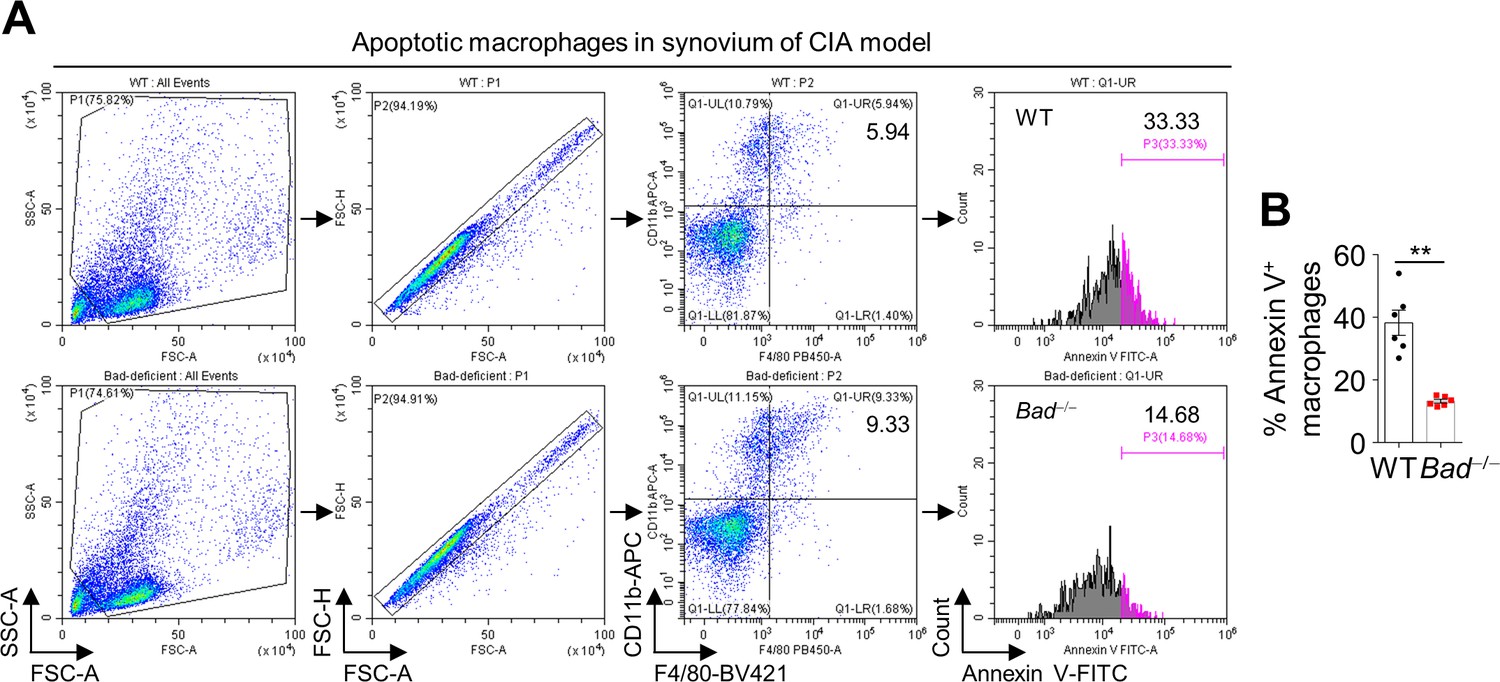
Bad loss protects synovial macrophages from apoptosis in collagen-induced arthritis (CIA).
(A) Apoptotic synovial macrophages from wild-type (WT) and Bad−/− mice in CIA model were analyzed by flow cytometry by staining Annexin V. (B) Quantification of the ratio of Annexin V positive synovial macrophages in WT (n = 6) and Bad−/− (n = 6) mice in CIA model. All data are presented as mean ± SEM; dots represent individual mice. Significant difference was analyzed by unpaired Student’s t-test, **p<0.01.
Figure 2—figure supplement 6
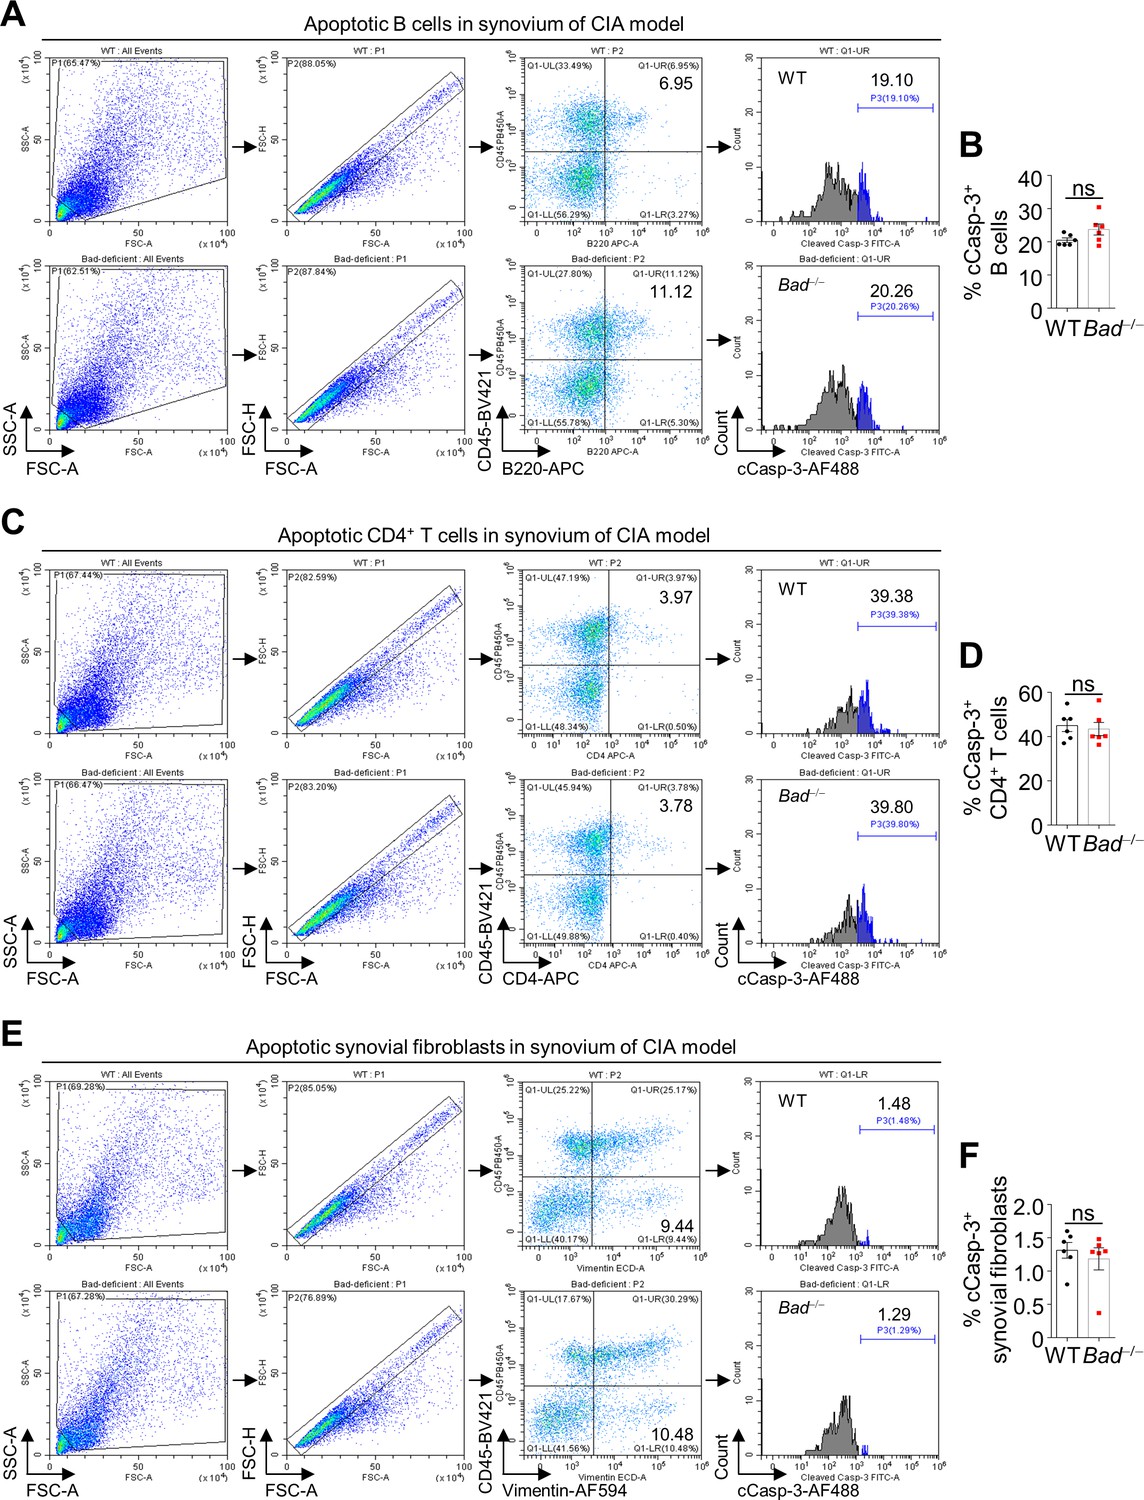
Bad loss does not significantly affect the apoptosis of B cells, CD4+ T cells, or synovial fibroblasts in collagen-induced arthritis (CIA) detected by cleaved Casp-3 staining.
(A, C, and E) Apoptotic synovial B cells (A), CD4+ T cells (C), and fibroblasts (E) from wild-type (WT) and Bad−/− mice in CIA model were analyzed by flow cytometry by staining cleaved Casp-3. (B, D, and F) Quantification of the apoptotic B cells (B), CD4+ T cells (D), and fibroblasts (F). All data are presented as mean ± SEM, dots represent individual mice, and n = 6 for each group. Significant difference was analyzed by unpaired Student’s t-test.
Figure 2—figure supplement 7
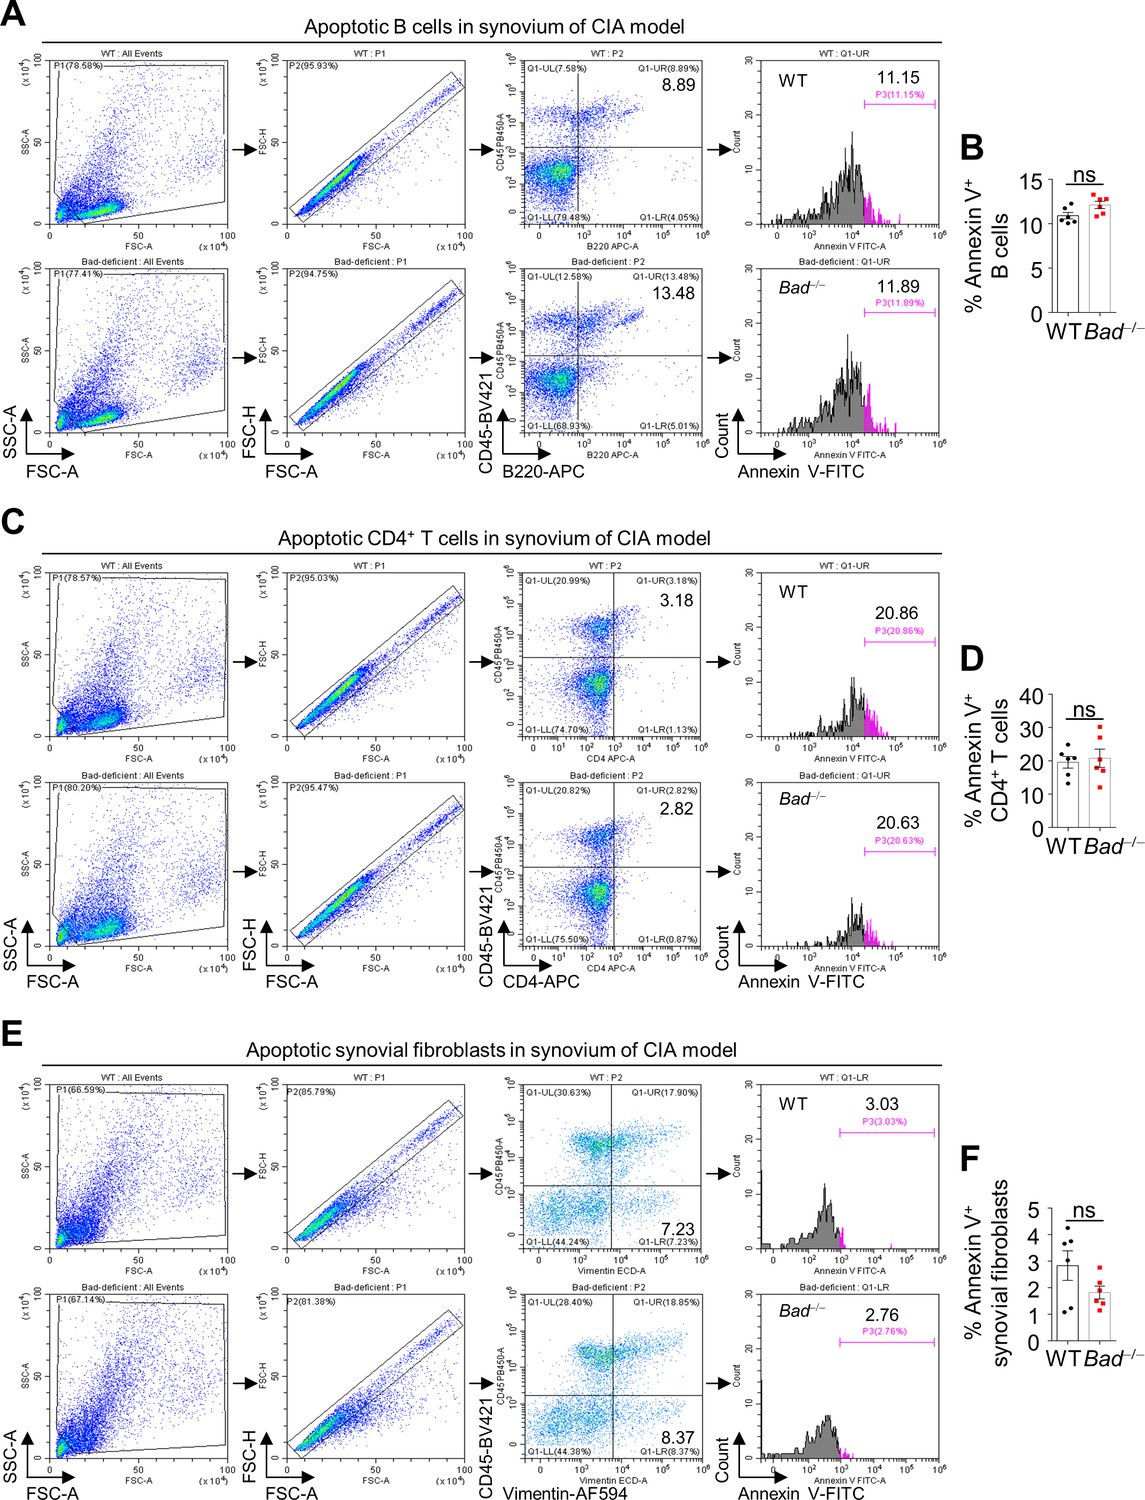
Bad loss does not significantly affect the apoptosis of B cells, CD4+ T cells, or synovial fibroblasts in collagen-induced arthritis (CIA) detected by Annexin V staining.
(A, C, and E) Apoptotic synovial B cells (A), CD4+ T cells (C), and fibroblasts (E) from WT and Bad−/− mice in CIA model were analyzed by flow cytometry by staining Annexin V. (B, D, and F) Quantification of the apoptotic B cells (B), CD4+ T cells (D), and fibroblasts (F). All data are presented as mean ± SEM, dots represent individual mice, and n = 6 for each group. Significant difference was analyzed by unpaired Student’s t-test.
Figure 3 with 1 supplement
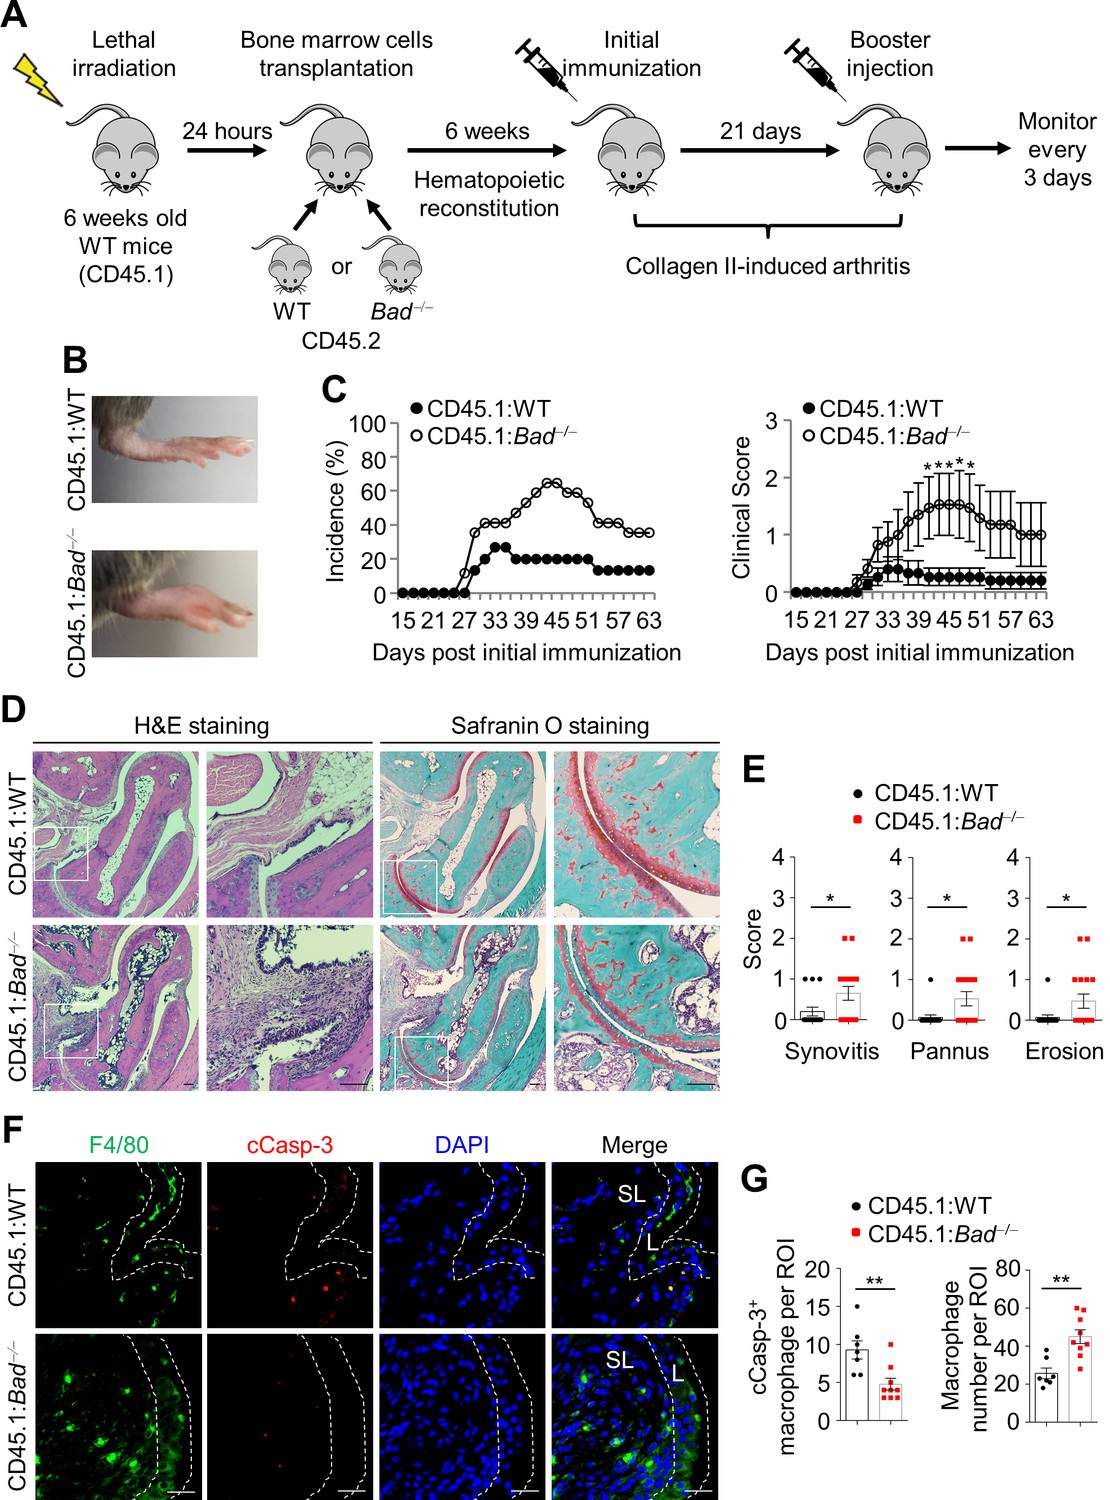
Bad-deficient macrophages sufficiently aggravate collagen-induced arthritis (CIA).
(A) The experimental design diagram for bone marrow transplantation in CD45.1 background mice followed by CIA model. (B) Representative photographs of the hind paws from CD45.1:WT and CD45.1:Bad−/− mice in CIA model. (C) Incidence and clinical scores of CD45.1:WT (n = 15) and CD45.1:Bad−/− (n = 17) mice in CIA model. (D) H & E and Safranin O staining in ankle joint sections of CD45.1:WT and CD45.1:Bad−/− mice in CIA model, ankle joints were harvested 63 days after primary immunization. Scale bar, 100 μm. (E) Evaluation of synovitis, pannus, and erosion of ankle joints from CD45.1:WT (n = 15) and CD45.1:Bad−/− (n = 17) mice in CIA model. (F) Double staining of anti-F4/80 and anti-cleaved Casp-3 in the ankle joint sections of CD45.1:WT and CD45.1:Bad−/− mice in CIA model. Scale bar, 25 μm. (G) Quantification of the number of cleaved Casp-3 positive macrophage and total macrophage per field in the ankle joint sections of CD45.1:WT (n = 7) and CD45.1:Bad−/− (n = 9) mice in CIA model. All data are presented as mean ± SEM; dots represent individual mice. Significant difference was analyzed by Mann–Whitney U-test (C) or unpaired Student’s t-test (E and G), *p<0.05; **p<0.01.
-
Figure 3—source data 1
Source data for graphs in Figure 3C,E, and G.
- https://cdn.elifesciences.org/articles/56309/elife-56309-fig3-data1-v1.xlsx
Figure 3—figure supplement 1
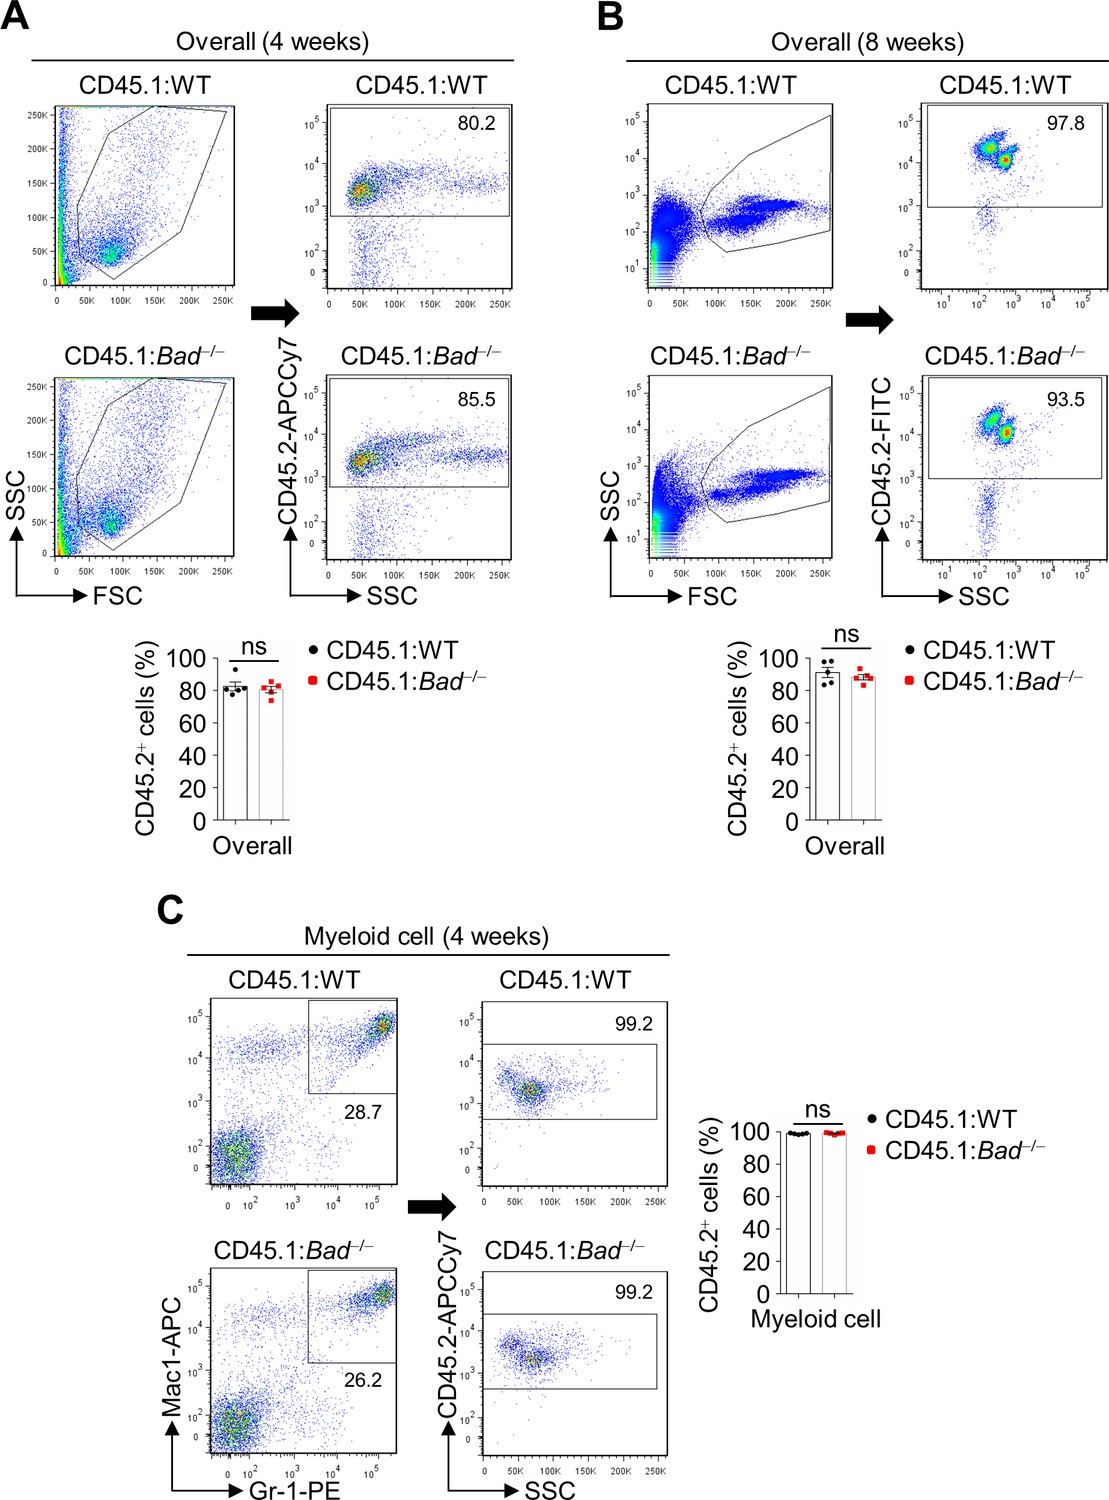
Efficiency of bone marrow transplantation in CD45.1 mice.
(A) The percentages of overall CD45.2 cells in the peripheral blood (4 weeks after transplantation) of CD45.1:WT and CD45.1:Bad−/− mice were analyzed by flow cytometry. (B) The percentages of overall CD45.2 cells in the peripheral blood (8 weeks after transplantation) of CD45.1:WT and CD45.1:Bad−/− mice were analyzed by flow cytometry. (C) The percentages of CD45.2 myeloid cells (gated by Mac1 and Gr1) in the peripheral blood (4 weeks after transplantation) of CD45.1:WT and CD45.1:Bad−/− mice were analyzed by flow cytometry. All data are presented as mean ± SEM, dots represent individual mice, and n = 5 mice for each group. Significant difference was analyzed by unpaired Student’s t-test.
-
Figure 3—figure supplement 1—source data 1
Source data for graphs in Figure 3—figure supplement 1.
- https://cdn.elifesciences.org/articles/56309/elife-56309-fig3-figsupp1-data1-v1.xlsx
Figure 4 with 2 supplements
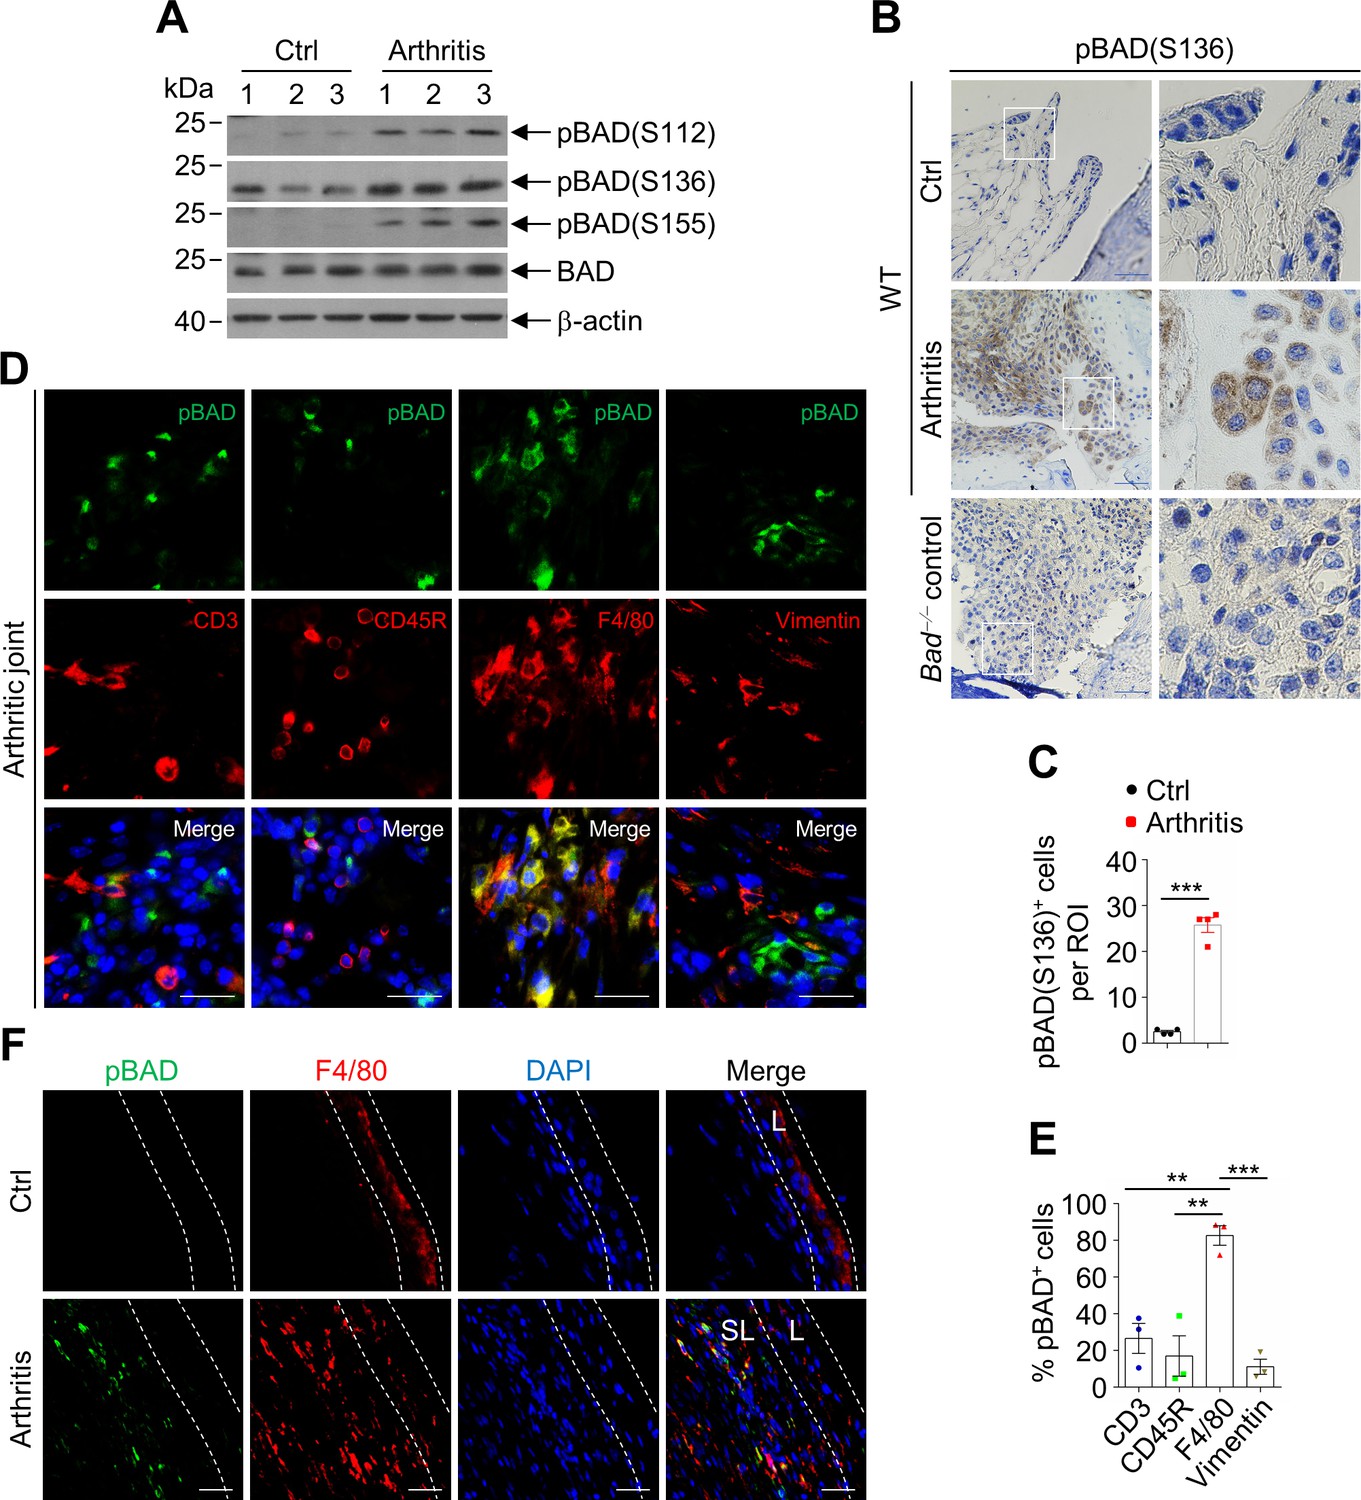
The pro-apoptotic activity of BAD was suppressed in synovial sublining macrophages in collagen-induced arthritis (CIA).
(A) Immunoblotting analysis of pBAD(S112), pBAD(S136), pBAD(S155), and BAD in ankle joints extracts of wild-type (WT) control (non-arthritic) and arthritic mice in CIA model (n = 3). (B) Immunohistochemistry staining of anti-pBAD(S136) in the synovium of WT control and arthritic mice in CIA model, Bad−/− mice serve as control. Scale bar, 50 μm. (C) Quantification of the number of pBAD(S136) positive cells per field (n = 4). (D) Double staining of anti-pBAD(S136) with T cell marker anti-CD3, B cell marker anti-CD45R, macrophage marker anti-F4/80, or synovial fibroblast marker anti-Vimentin respectively in the synovium of WT arthritic mice in CIA model. Scale bar, 25 μm. (E) Quantification of percentages of pBAD(S136) positive cells in total cells per field of different cell types (n = 3). (F) Double staining of anti-pBAD(S136) and anti-F4/80 in the synovium of WT control and arthritic mice in CIA model. Scale bar, 25 μm. All data are presented as mean ± SEM; dots represent individual mice. Significant difference was analyzed by unpaired Student’s t-test (C) or one-way ANOVA test (E), **p<0.01; ***p<0.001.
-
Figure 4—source data 1
Source data for graphs in Figure 4C and E.
- https://cdn.elifesciences.org/articles/56309/elife-56309-fig4-data1-v1.xlsx
-
Figure 4—source data 2
Source data for graphs in Figure 4—figure supplements 1 and 2.
- https://cdn.elifesciences.org/articles/56309/elife-56309-fig4-data2-v1.xlsx
Figure 4—figure supplement 1
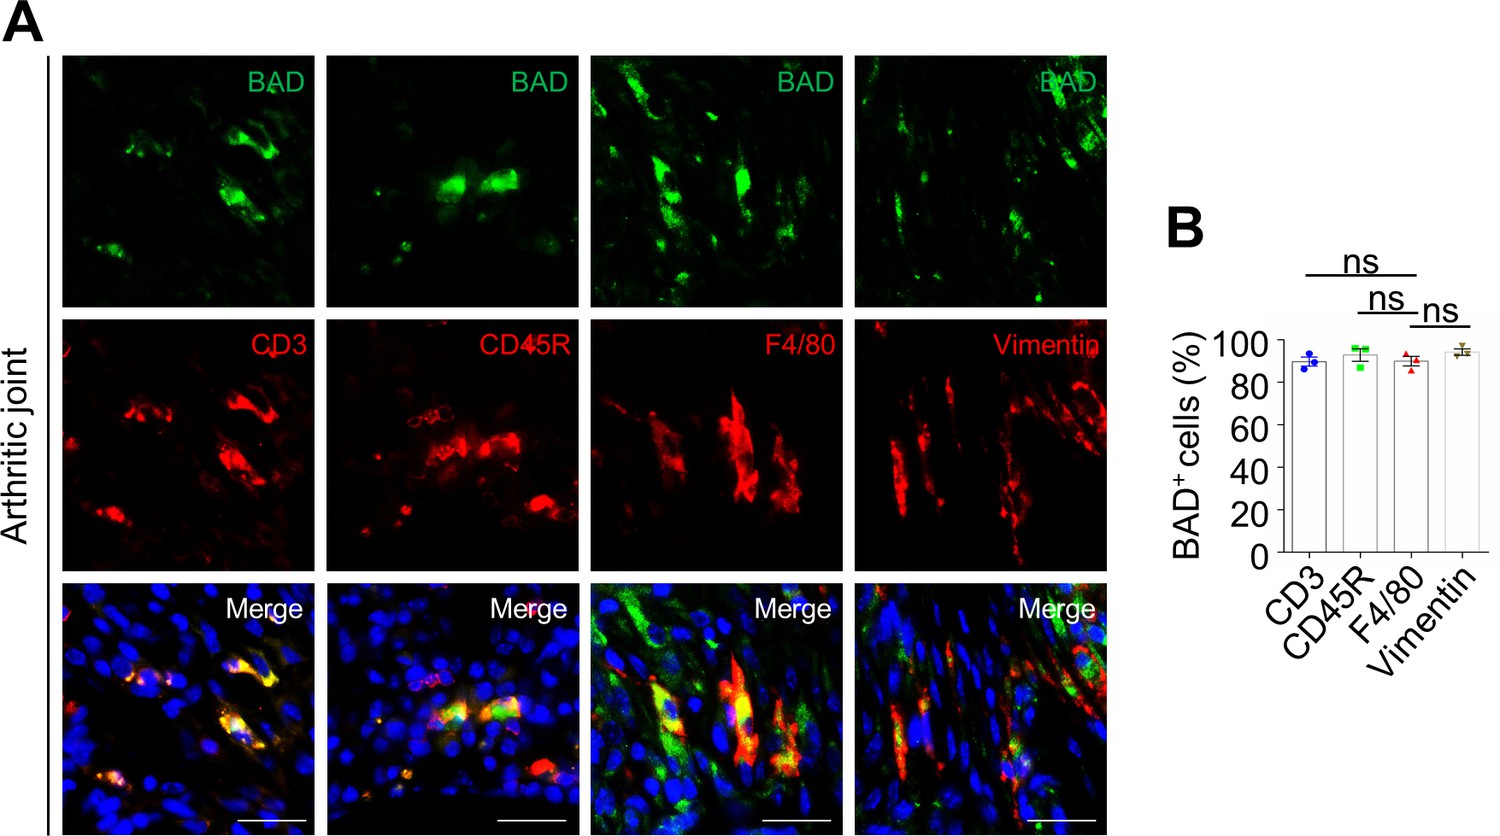
The expression of BAD is not cell-type specific in arthritic joints in collagen-induced arthritis (CIA) model.
(A) Double staining of anti-BAD with T cell marker anti-CD3, B cell marker anti-CD45R, macrophage marker anti-F4/80, or synovial fibroblast marker anti-Vimentin respectively in the synovium of wild-type (WT) arthritic mice in CIA model. Scale bar, 25 μm. (B) Quantification of percentages of BAD positive cells in total cells per field of different cell types (n = 3). Data are presented as mean ± SEM; dots represent individual mice. Significant difference was analyzed by one-way ANOVA test.
Figure 4—figure supplement 2
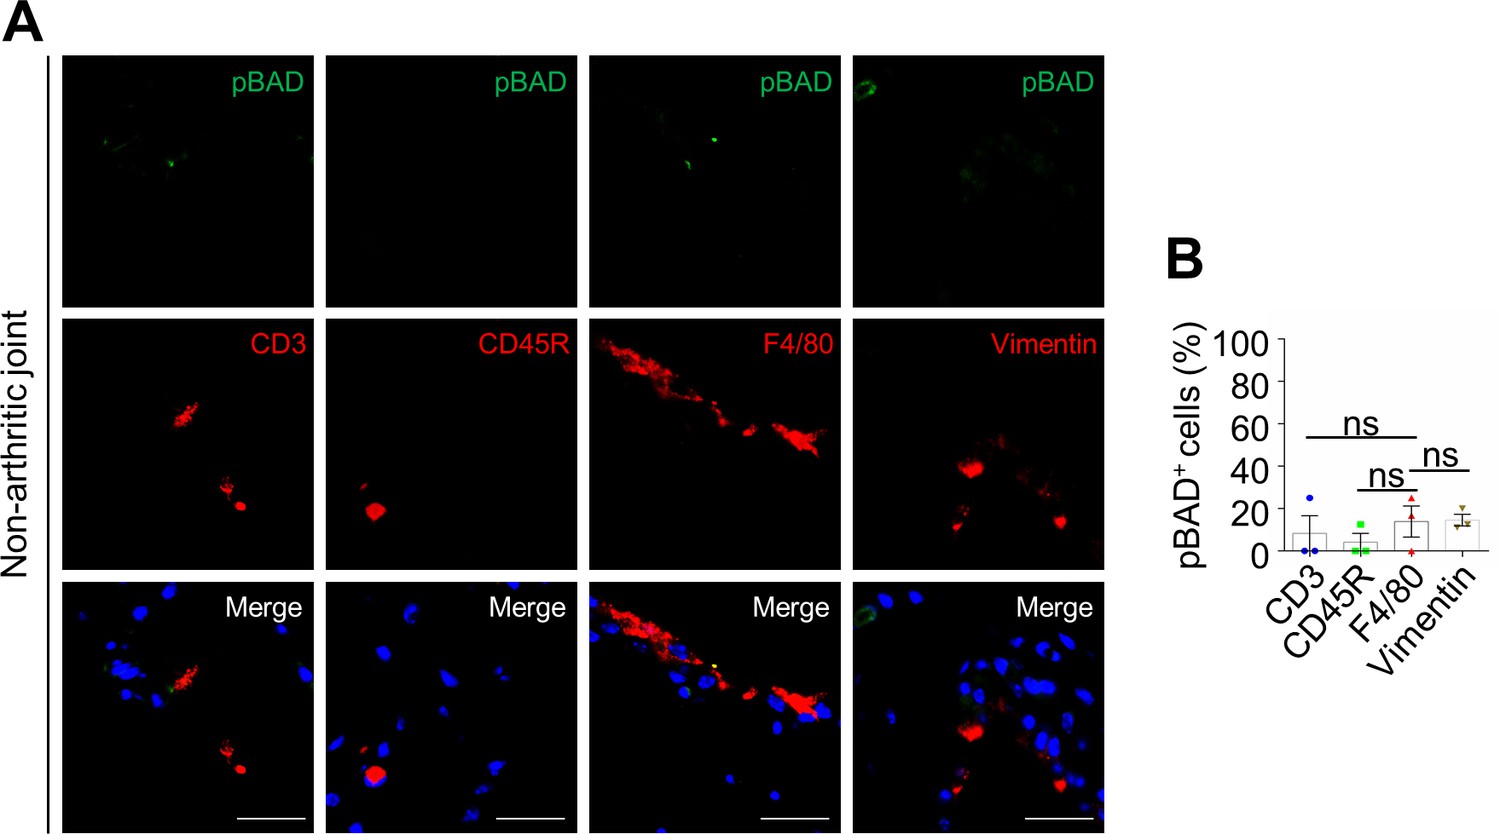
pBAD staining in various cell types of non-arthritic joints.
(A) Double staining of anti-pBAD(S136) with T cell marker anti-CD3, B cell marker anti-CD45R, macrophage marker anti-F4/80 or synovial fibroblast marker anti-Vimentin, respectively, in the synovium of WT non-arthritic mice. Scale bar, 25 μm. (B) Quantification of percentages of pBAD(S136) positive cells in total cells per field of different cell types (n = 3). Data are presented as mean ± SEM; dots represent individual mice. Significant difference was analyzed by one-way ANOVA test.
Figure 5
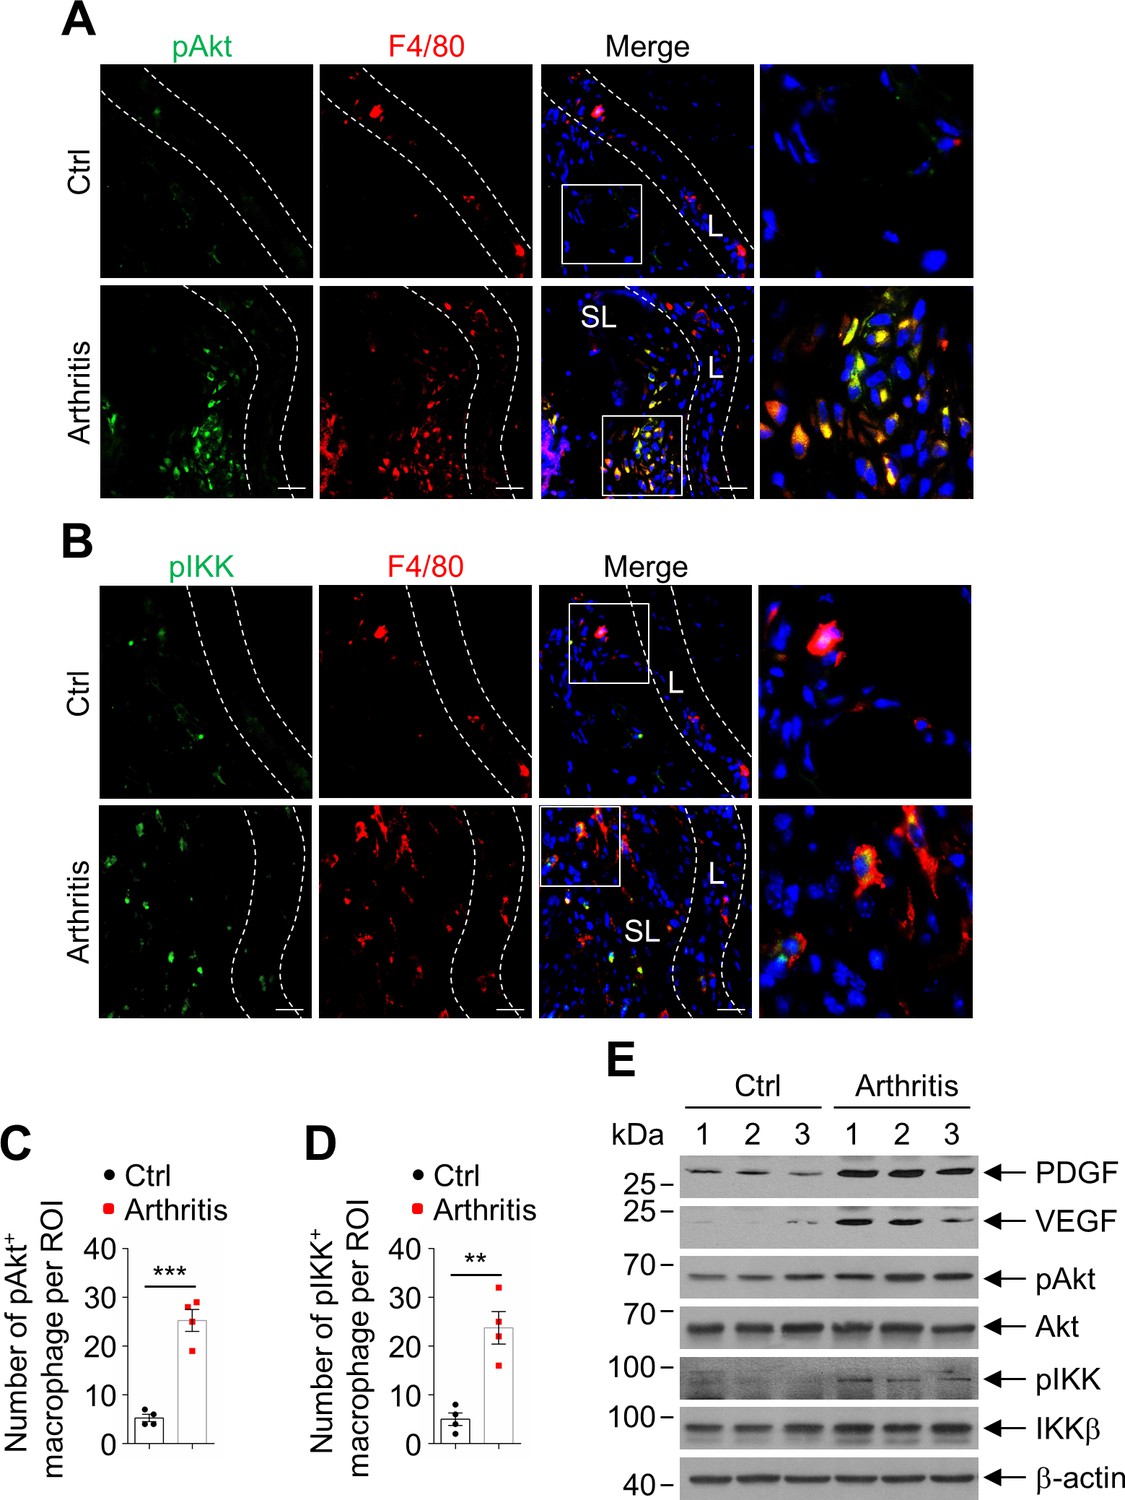
Akt and IKK activation was increased in synovial sublining macrophage in collagen-induced arthritis (CIA).
(A) Double staining of anti-pAkt and anti-F4/80 in the synovium of wild-type (WT) control and arthritic mice in CIA model. Scale bar, 25 μm. (B) Double staining of anti-pIKK and anti-F4/80 in the synovium of WT control and arthritic mice in CIA model. Scale bar, 25 μm. (C) Quantification of the number of pAkt and F4/80 double positive cells per field in the synovium of WT control (n = 4) and arthritic (n = 4) mice in CIA model. (D) Quantification of the number of pIKK and F4/80 double positive cells per field in the synovium of WT control (n = 4) and arthritic (n = 4) mice in CIA model. (E) Immunoblotting analysis of the protein levels of platelet-derived growth factor (PDGF), vascular endothelial growth factor (VEGF), pAkt, Akt, pIKK, and IKK in the joint extracts of WT non-arthritic (n = 3) and arthritic (n = 3) mice in CIA model. All data are presented as mean ± SEM; dots represent individual mice. Significant difference was analyzed by unpaired Student’s t-test, **p<0.01; ***p<0.001.
-
Figure 5—source data 1
Source data for graphs in Figure 5C and D.
- https://cdn.elifesciences.org/articles/56309/elife-56309-fig5-data1-v1.xlsx
Figure 6 with 1 supplement
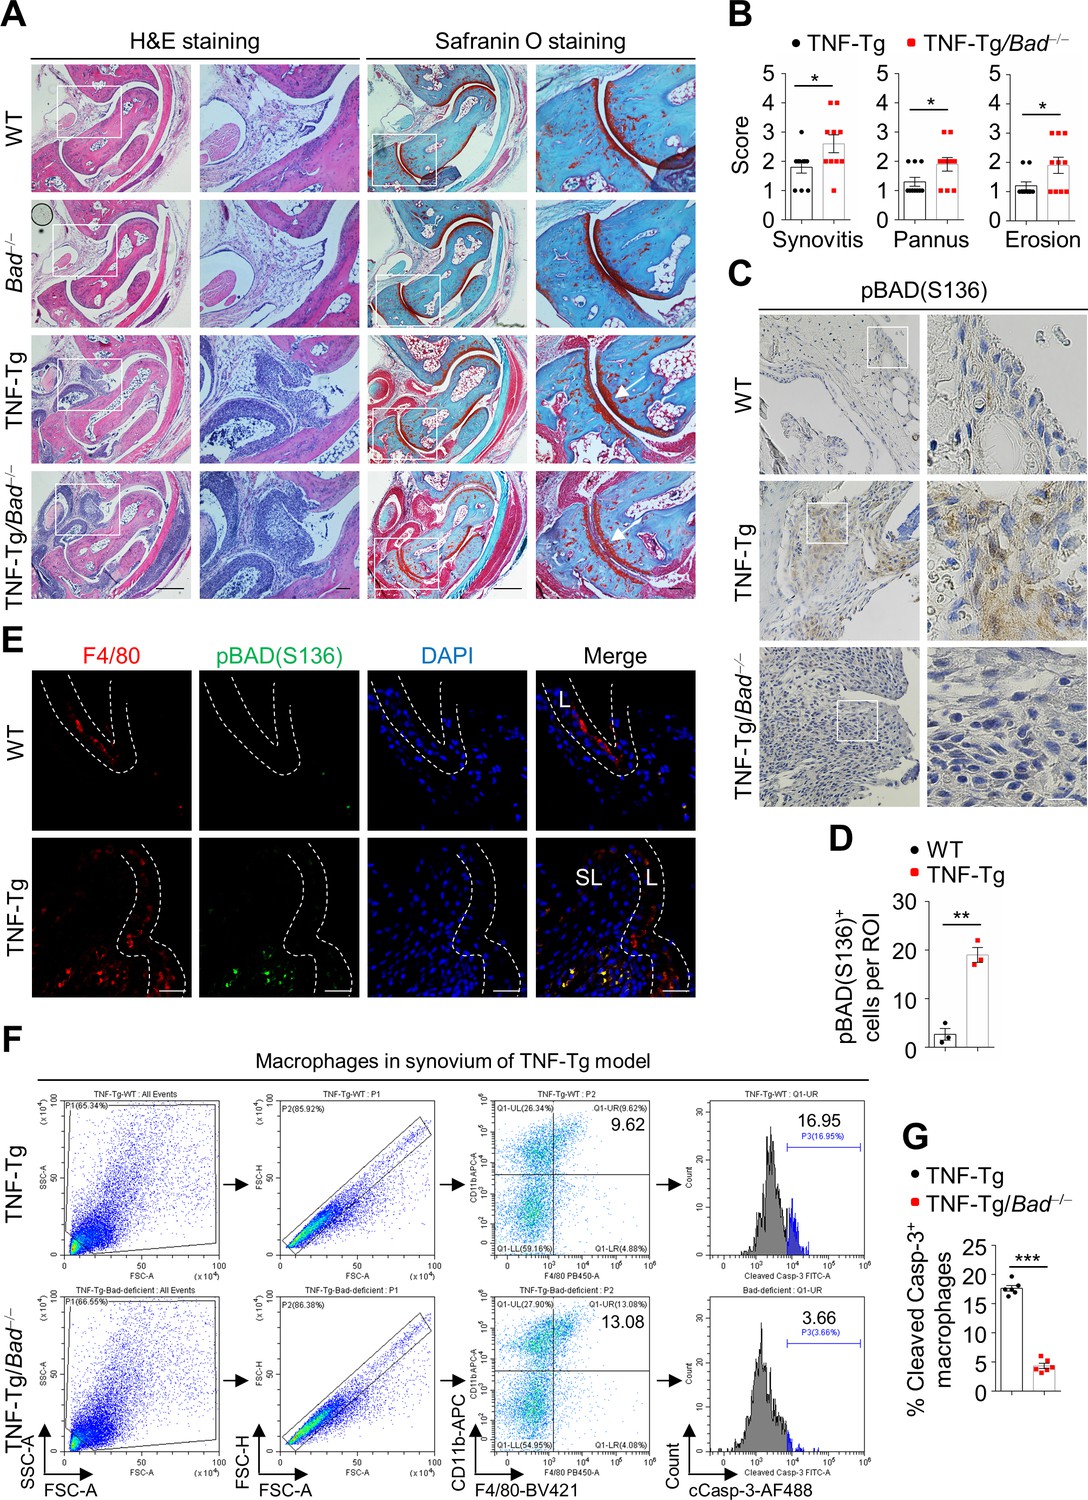
Bad loss aggravates arthritis in TNFα transgenic (TNF-Tg) mouse model.
(A) H & E and Safranin O staining in ankle joint sections of 3-month-old wild-type (WT), Bad−/−, TNF-Tg, and TNF-Tg/Bad−/− mice. Scale bar, 500 μm; magnified inset, 100 μm. (B) Evaluation of synovitis, pannus, and erosion of ankle joints of TNF-Tg (n = 10) and TNF-Tg/Bad−/− (n = 10) mice. (C) Immunohistochemistry staining of anti-pBAD(S136) in the synovium of 3-month-old WT, TNF-Tg, and TNF-Tg/Bad−/− mice. Scale bar, 50 μm. (D) Quantification of the number of pBAD(S136) positive cells per field (n = 3). (E) Double staining of anti-pBAD(S136) and anti-F4/80 in the synovium of 3-month-old WT control and TNF-Tg mice. Scale bar, 25 μm. (F) Apoptotic synovial macrophages from TNF-Tg and TNF-Tg/Bad−/− mice were analyzed by flow cytometry by staining cleaved Casp-3. (G) Quantification of the ratio of cleaved Casp-3 positive synovial macrophages in TNF-Tg (n = 6) and TNF-Tg/Bad−/− (n = 6) mice. All data are presented as mean ± SEM; dots represent individual mice. Significant difference was analyzed by unpaired Student’s t-test, *p<0.05; **p<0.01; ***p<0.001.
-
Figure 6—source data 1
Source data for graphs in Figure 6B,D, and G.
- https://cdn.elifesciences.org/articles/56309/elife-56309-fig6-data1-v1.xlsx
Figure 6—figure supplement 1
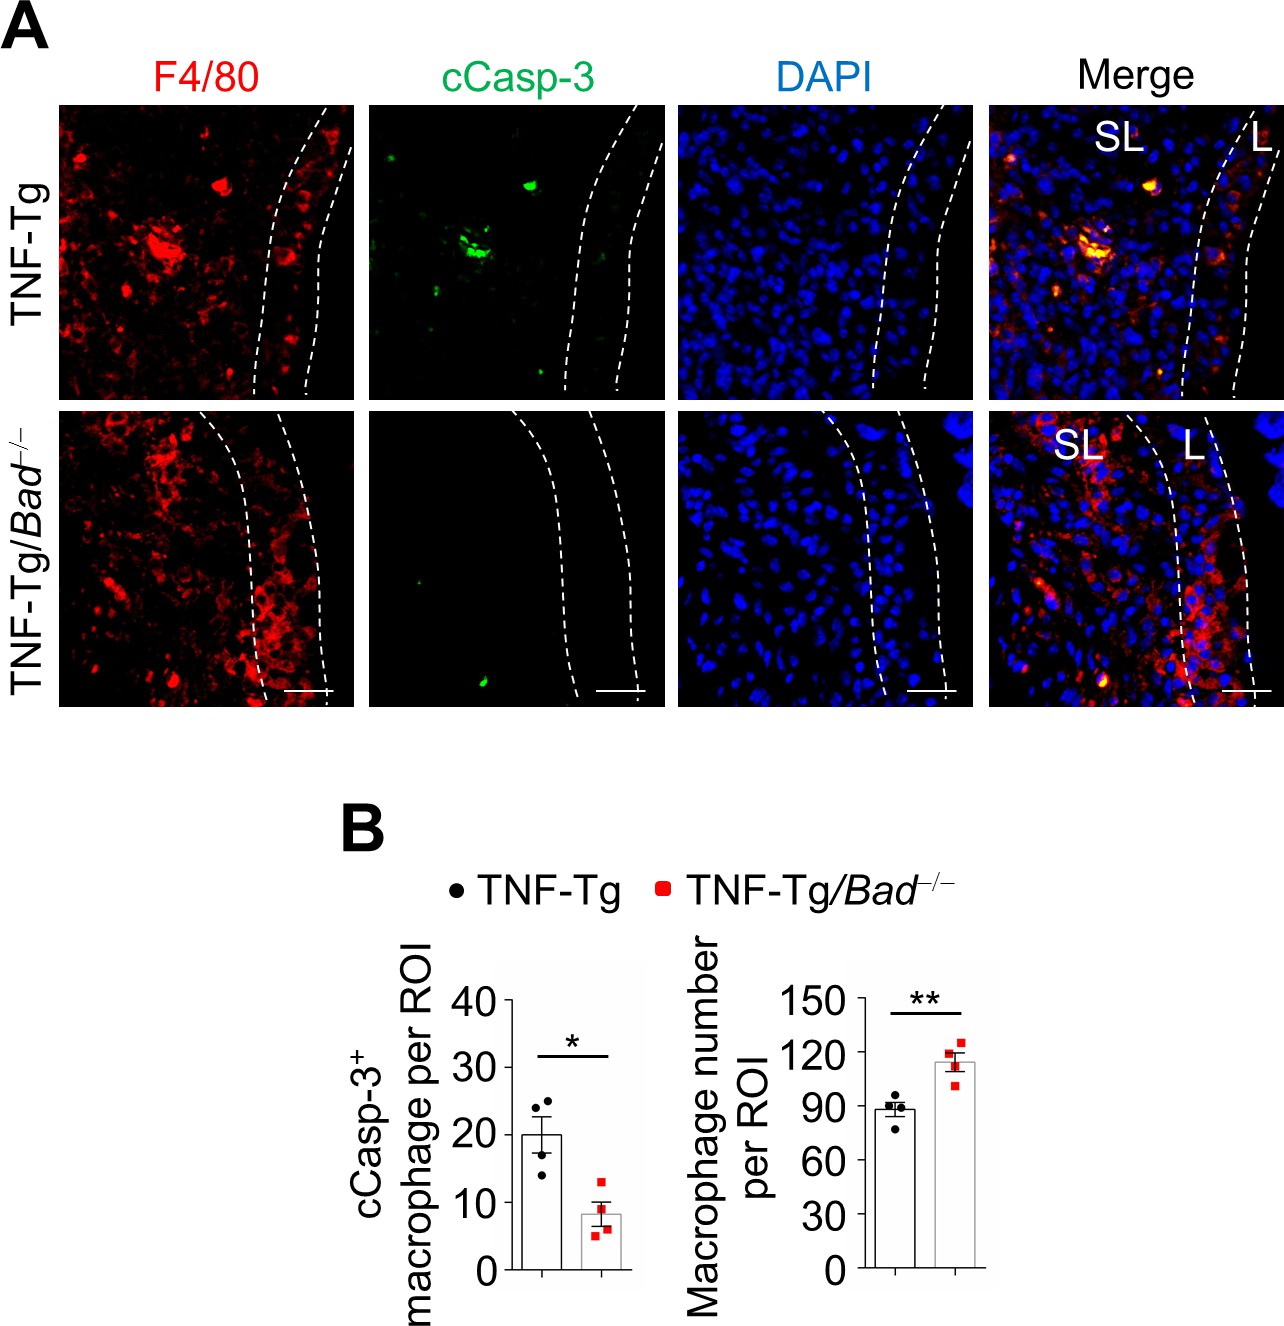
Bad loss prevents sublining macrophages from apoptosis in TNFα transgenic (TNF-Tg) mouse model.
(A) Double staining of anti-F4/80 and anti-cleaved Casp-3 in the ankle joint sections of 3-month-old TNF-Tg and TNF-Tg/Bad−/− mice. Scale bar, 25 μm. (B) Quantification of the number of cleaved Casp-3 positive macrophage and total macrophage per field in the ankle joint sections of TNF-Tg (n = 4) and TNF-Tg/Bad−/− (n = 4) mice. All data are presented as mean ± SEM; dots represent individual mice. Significant difference was analyzed by unpaired Student’s t-test, *p<0.05; **p<0.01.
-
Figure 6—figure supplement 1—source data 1
Source data for graphs in Figure 6—figure supplement 1.
- https://cdn.elifesciences.org/articles/56309/elife-56309-fig6-figsupp1-data1-v1.xlsx
Figure 7
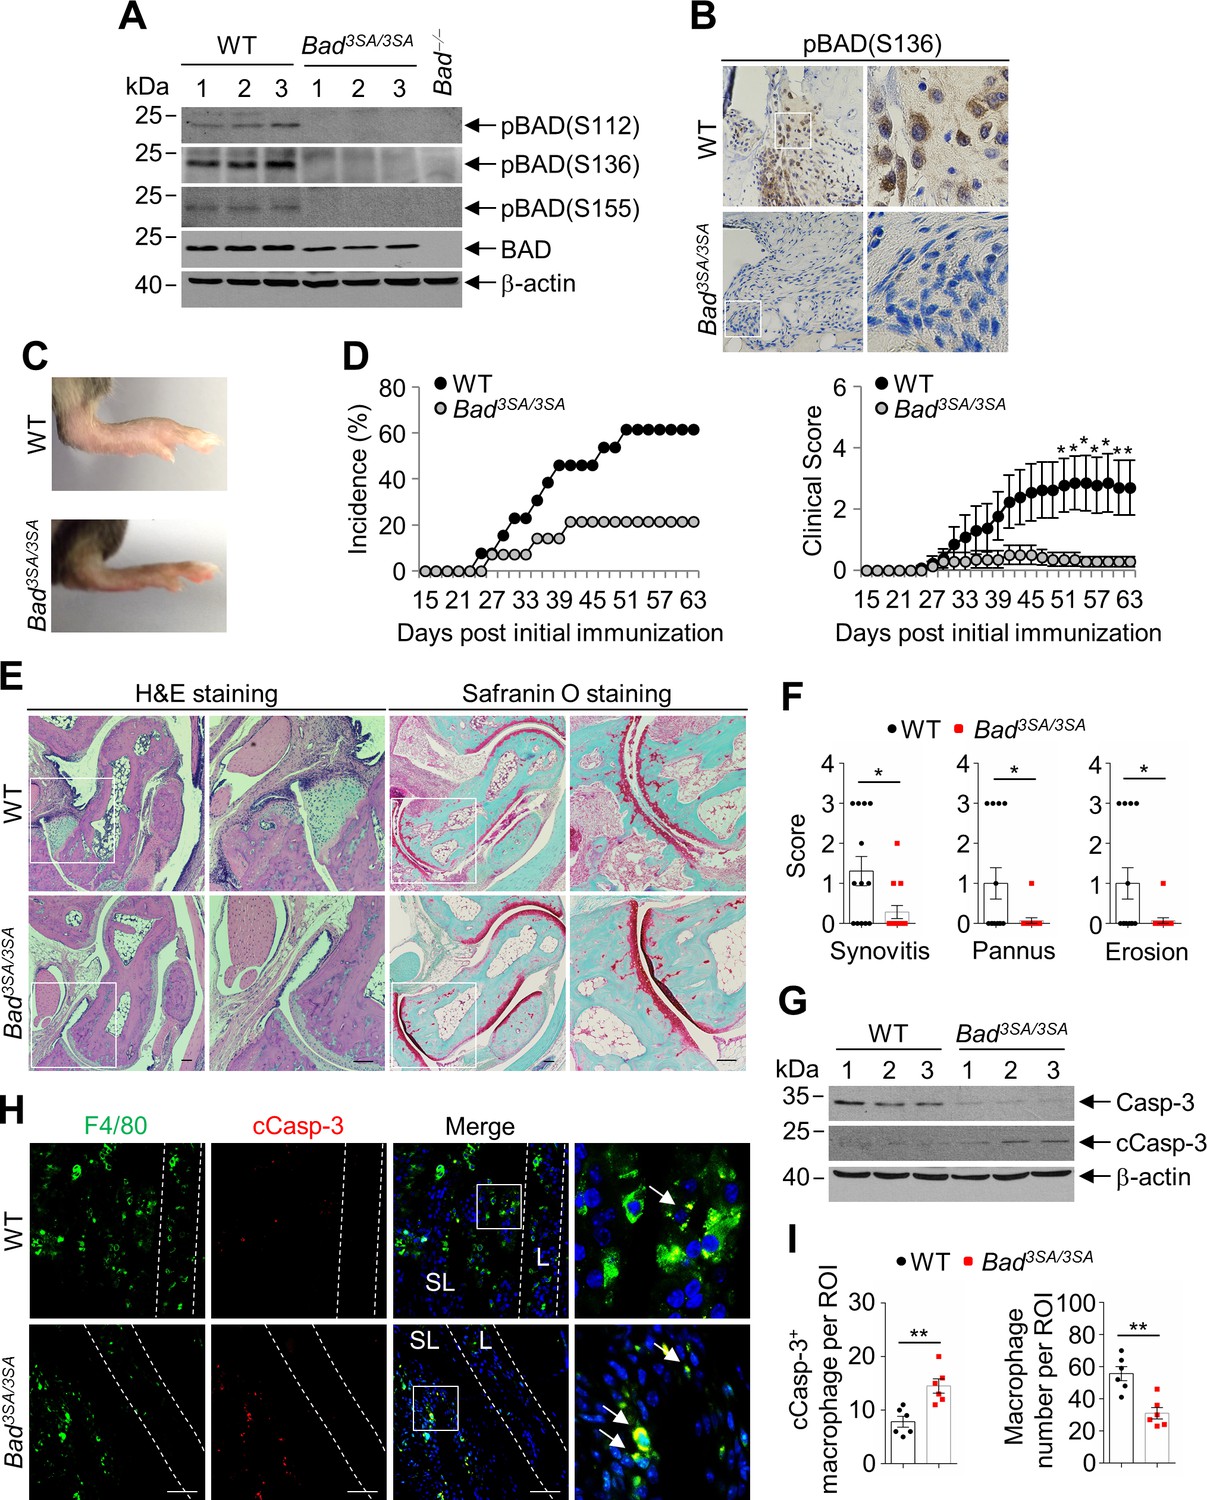
Bad3SA/3SA mice are resistant to collagen-induced arthritis (CIA).
(A) Immunoblotting analysis of pBAD(S112), pBAD(S136), pBAD(S155), and BAD in the joint extracts of wild-type (WT; n = 3) and Bad3SA/3SA (n = 3) mice in CIA model. (B) Representative IHC staining of pBAD(S136) in the synovium of immunized WT and Bad3SA/3SA mice. Scale bar, 50 μm. (C) Representative photographs of the hind paws of WT and Bad3SA/3SA mice in CIA model. (D) Incidence and clinical scores of WT (n = 13) and Bad3SA/3SA (n = 14) mice in CIA model. (E) H & E and Safranin O staining in ankle joint sections of WT and Bad3SA/3SA mice in CIA model. Ankle joints were harvested 63 days after primary immunization. Scale bar, 100 μm. (F) Evaluation of synovitis, pannus, and erosion of ankle joints from WT (n = 13) and Bad3SA/3SA (n = 14) mice in CIA model. (G) Immunoblotting analysis of caspase-3 and cleaved Casp-3 in ankle joints of immunized WT (n = 3) and Bad3SA/3SA (n = 3) mice. (H) Double staining of anti-F4/80 and anti-cleaved Casp-3 in the sublining area of ankle joint sections of WT and Bad3SA/3SA mice in CIA model. Scale bar, 50 μm. (I) Quantification of the cleaved Casp-3-positive macrophage and number of total macrophage per field in the ankle joint sections of WT (n = 6) and Bad3SA/3SA (n = 6) mice in CIA model. All of the data are presented as mean ± SEM; dots represent individual mice. Significant difference was analyzed by Mann–Whitney U-test (D) or unpaired Student’s t-test (F and I), *p<0.05; **p<0.01.
-
Figure 7—source data 1
Source data for graphs in Figure 7D,F, and I.
- https://cdn.elifesciences.org/articles/56309/elife-56309-fig7-data1-v1.xlsx
Figure 8 with 1 supplement
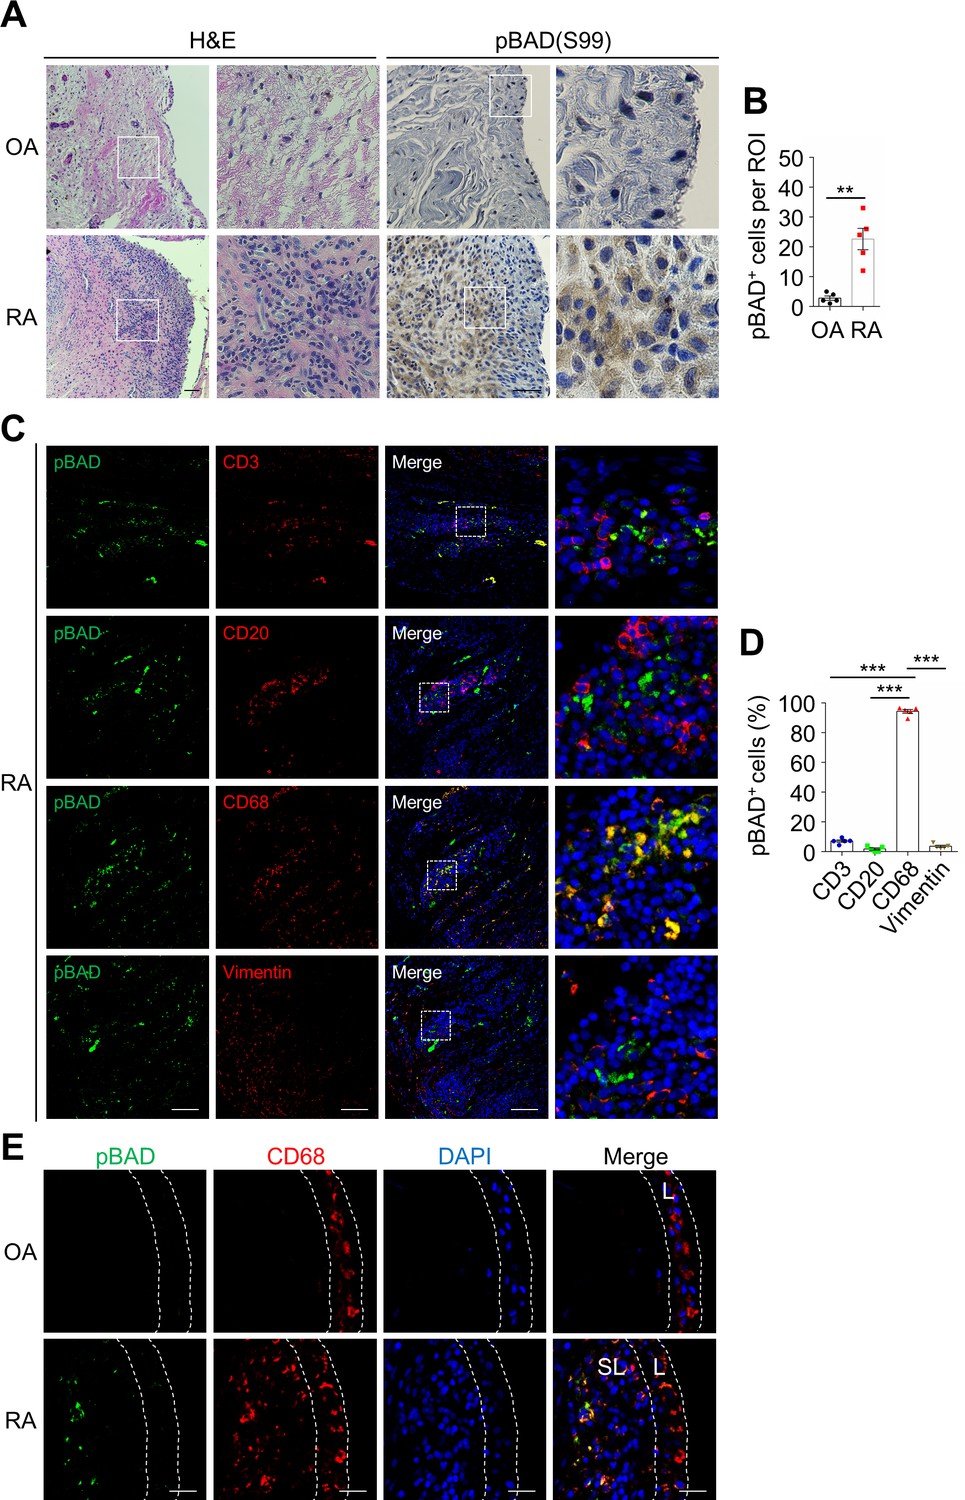
BAD phosphorylation is increased in the synovial sublining macrophages of rheumatoid arthritis (RA) patients.
(A) H & E and pBAD(S99) immunohistochemistry staining of the synovium specimen sections of patients with OA and RA. Scale bar, 100 μm. (B) Quantification of pBAD(S99)-positive cells per field in the synovial specimen sections of patients with OA (n = 5) and RA (n = 5). (C) Double staining of anti-pBAD(S99) with T cell marker anti-CD3, B cell marker anti-CD20, macrophage marker anti-CD68 or synovial fibroblast marker anti-Vimentin in serial synovial specimen sections of patients with RA. Scale bar, 100 μm. (D) Quantification of the percentage of pBAD(S99)-positive cells in total cells per field of different cell types (n = 5). (E) Double staining of anti-pBAD(S99) and anti-F4/80 in the synovial specimen sections of patients with OA and RA. Scale bar, 25 μm. All data are presented as mean ± SEM; dots represent individual human samples. Significant difference was analyzed by unpaired Student’s t-test (B) or one-way ANOVA test (D), **p<0.01, ***p<0.001.
-
Figure 8—source data 1
Source data for graphs in Figure 8B and D.
- https://cdn.elifesciences.org/articles/56309/elife-56309-fig8-data1-v1.xlsx
Figure 8—figure supplement 1

The expression of BAD is not cell-type specific in synovium of rheumatoid arthritis (RA) patients.
(A) Double staining of BAD with T cell marker anti-CD3, B cell marker anti-CD20, macrophage marker anti-CD68, or synovial fibroblast marker anti-Vimentin in serial synovial specimen sections of patients with RA. Scale bar, 100 μm. (B) Quantification of percentages of BAD positive cells in total cells per field of different cell types (n = 3). Data are presented as mean ± SEM; dots represent individual human samples. Significant difference was analyzed by one-way ANOVA test.
-
Figure 8—figure supplement 1—source data 1
Source data for graphs in Figure 8—figure supplement 1.
- https://cdn.elifesciences.org/articles/56309/elife-56309-fig8-figsupp1-data1-v1.xlsx
Tables
Key resources table
| Reagent type (species) or resource | Designation | Source or reference | Identifiers | Additional information |
|---|---|---|---|---|
| Biological sample (Homo sapiens) | Synovial tissue of RA and OA patients | The University of Chicago | Department of Pathology’s diagnostic archive | Paraffin-embedded slides |
| Strain, strain background Mus musculus | CD45.1 mice (C57BL/6 congenic) | The Jackson Laboratory | Stock #:002014 RRID:IMSR_JAX:002014 | B6.SJL-Ptprca Pepcb/BoyJ |
| Strain, strain background Mus musculus | μMT mice (C57BL/6 congenic) | The Jackson Laboratory | Stock #:002288 RRID:IMSR_JAX:002288 | B6.129S2-Ighmtm1Cgn/J |
| Antibody | Anti-BAD (rabbit polyclonal) | Cell Signaling Technology | Cat #:9292 RRID:AB_331419 | Immunoblotting (1:500) |
| Antibody | Anti-pBAD(S136) (rabbit monoclonal) | Cell Signaling Technology | Cat #:4366 RRID:AB_10547878 | Immunoblotting (1:500) Immunofluorescence (1:100) Immunohistochemistry (1:100) |
| Antibody | Anti-pBAD(S112) (rabbit polyclonal) | Cell Signaling Technology | Cat #:9291 RRID:AB_331417 | Immunoblotting (1:500) |
| Antibody | Anti-pBAD(S155) (rabbit polyclonal) | Cell Signaling Technology | Cat #:9297 RRID:AB_2062131 | Immunoblotting (1:500) |
| Antibody | Anti-pAkt(S473) (rabbit monoclonal) | Cell Signaling Technology | Cat #:4060 RRID:AB_2315049 | Immunoblotting (1:1000) Immunofluorescence (1:100) |
| Antibody | Anti-Akt (rabbit monoclonal) | Cell Signaling Technology | Cat #:4691 RRID:AB_915783 | Immunoblotting (1:1000) |
| Antibody | Anti-pIKKα/β (rabbit monoclonal) | Cell Signaling Technology | Cat #:2078 RRID:AB_2079379 | Immunoblotting (1:500) Immunofluorescence (1:100) |
| Antibody | Anti-IKKβ (rabbit polyclonal) | Cell Signaling Technology | Cat #:2684 RRID:AB_2122298 | Immunoblotting (1:500) |
| Antibody | Anti-cleaved Caspase-3 (rabbit polyclonal) | Cell Signaling Technology | Cat #:9661 RRID:AB_2341188 | Immunoblotting (1:500) Immunofluorescence (1:100) |
| Antibody | Anti-Caspase-3 (rabbit polyclonal) | Cell Signaling Technology | Cat #:9662 RRID:AB_331439 | Immunoblotting (1:500) |
| Antibody | Alexa Fluor 488-conjugated cleaved Caspase-3 (rabbit polyclonal) | Cell Signaling Technology | Cat #:9669 RRID:AB_2069869 | Flow cytometry (1:100) |
| Antibody | Anti-Vimentin (chicken polyclonal) | Novus Biologicals | Cat #:NB300-223 RRID:AB_10003206 | Immunofluorescence (1:100) |
| Antibody | Anti-BAD (rabbit monoclonal) | Abcam | Cat #:ab32445 RRID:AB_725614 | Immunofluorescence (1:100) |
| Antibody | Anti-CD11b (rabbit monoclonal) | Abcam | Cat #:ab133357 RRID:AB_2650514 | Immunofluorescence (1:200) |
| Antibody | Anti-F4/80 (rat monoclonal) | Abcam | Cat #:ab6640 RRID:AB_1140040 | Immunofluorescence (1:200) |
| Antibody | Anti-CD45R (rat monoclonal) | Abcam | Cat #:ab64100 RRID:AB_1140036 | Immunofluorescence (1:200) |
| Antibody | Anti-CD3 (rat monoclonal) | Abcam | Cat #:ab11089 RRID:AB_369097 | Immunofluorescence (1:200) |
| Antibody | Anti-Vimentin (mouse monoclonal) | Abcam | Cat #:ab8069 RRID:AB_306239 | Immunofluorescence (1:200) |
| Antibody | Anti-CD68 (mouse monoclonal) | Dako | Cat #:M0876 RRID:AB_2074844 | Immunofluorescence (1:200) |
| Antibody | Anti-β-actin (mouse monoclonal) | Santa Cruz | Cat #:sc-47778 RRID:AB_2714189 | Immunoblotting (1:2000) |
| Antibody | APC-conjugated anti-mouse CD11b (rat monoclonal) | Biolegend | Cat #:101211 RRID:AB_312794 | Flow cytometry (1:100) |
| Antibody | BV421-conjugated anti-mouse F4/80 (rat monoclonal) | Biolegend | Cat #:123131 RRID:AB_10901171 | Flow cytometry (1:100) |
| Antibody | APC-conjugated anti-mouse CD4 (rat monoclonal) | Biolegend | Cat #:100411 RRID:AB_312696 | Flow cytometry (1:100) |
| Antibody | BV421-conjugated anti-mouse CD4 (rat monoclonal) | Biolegend | Cat #:100437 RRID:AB_10900241 | Flow cytometry (1:100) |
| Antibody | APC-conjugated anti-mouse/human CD45R/B220 (rat monoclonal) | Biolegend | Cat #:103211 RRID:AB_312996 | Flow cytometry (1:100) |
| Antibody | BV421-conjugated anti-mouse B220 (rat monoclonal) | Biolegend | Cat #:103239 RRID:AB_10933424 | Flow cytometry (1:100) |
| Antibody | BV421-conjugated anti-mouse CD45 (rat monoclonal) | Biolegend | Cat #:103133 RRID:AB_10899570 | Flow cytometry (1:100) |
| Antibody | FITC-conjugated anti-mouse CD45 (rat monoclonal) | Biolegend | Cat #:103107 RRID:AB_312972 | Flow cytometry (1:100) |
| Antibody | APC-conjugated anti-mouse CD45.1 (mouse monoclonal) | Biolegend | Cat #:110713 RRID:AB_313502 | Flow cytometry (1:100) |
| Antibody | APCCy7-conjugated anti-mouse CD45.2 (mouse monoclonal) | Biolegend | Cat #:109824 RRID:AB_830789 | Flow cytometry (1:100) |
| Antibody | Alexa Fluor 594-conjugated anti-mouse Vimentin (mouse monoclonal) | Biolegend | Cat #:677804 RRID:AB_2566179 | Flow cytometry (1:100) |
| Antibody | PE-conjugated anti-mouse Gr1 (rat monoclonal) | eBioscience | Cat #:12-5931-82 RRID:AB_466045 | Flow cytometry (1:100) |
| Antibody | APC-conjugated anti-mouse Mac1 (rat monoclonal) | eBioscience | Cat #:17-0112-82 RRID:AB_469343 | Flow cytometry (1:100) |
| Commercial assay or kit | FITC Annexin V Apoptosis Detection Kit I | BD Pharmingen | Cat #:556547 | Flow cytometry (5 μl) |
| Commercial assay or kit | In Situ Cell Death Detection Kit | Roche | Cat #:11684817910 | TUNEL staining |
| Commercial assay or kit | Mouse IL-1β ELISA Kit | R and D Systems | Cat #:MLB00C | ELISA |
| Commercial assay or kit | Mouse IL-6 ELISA Kit | R and D Systems | Cat #:M6000B | ELISA |
| Commercial assay or kit | Mouse TNFα ELISA Kit | R and D Systems | Cat #:MTA00B | ELISA |
| Commercial assay or kit | Mouse anti-dsDNA IgG ELISA Kit | Alpha Diagnostic | Cat #:5120 | ELISA |
| Commercial assay or kit | Leukocyte Acid Phosphatase Kit | Sigma-Aldrich | Cat #:387A | TRAP staining |
| Software, algorithm | GraphPad Prism 6.0 | GraphPad Prism | RRID:SCR_002798 | http://www.graphpad.com/ |
| Software, algorithm | ImageJ | ImageJ | RRID:SCR_003070 | https://imagej.net/ |
| Software, algorithm | FlowJo 10 | FlowJo | RRID:SCR_008520 | https://www.flowjo.com/solutions/flowjo |
| Software, algorithm | CytExpert | CytExpert Software | RRID:SCR_017217 | https://www.beckman.fr/flow-cytometry/instruments/cytoflex/software |
| Other | Chicken type II collagen | Chondrex | Cat #:20012 | 2 mg/ml |
| Other | Complete Freund’s adjuvant (CFA) | Chondrex | Cat #:7023 | 5 mg/ml heat-denatured mycobacterium |
Additional files
-
Supplementary file 1
Validation of antibodies used for immunofluorescence staining.
(A) Immunoblotting analysis of BAD. (B) Immunoblotting analysis of pBAD(S136) in joint extracts after removing nonspecific bands using Bad−/− joint extracts. (C) Immunoblotting analysis of Vimentin. (D) Immunoblotting analysis of CD45R. (E) Immunoblotting analysis of F4/80. (F) Immunoblotting analysis of CD3. (G) Immunoblotting analysis of cleaved Casp-3 in mouse embryonic fibroblast (MEF) cells treated with TNFα (5 ng/ml) plus cycloheximide (CHX, 10 μg/ml). (H) Immunoblotting analysis of pBAD(S99) in THP-1 cells treated with TNFα (5 ng/ml). (I) Immunoblotting analysis of CD3 in THP-1 and Jurkat cell extracts. (J) Immunoblotting analysis of Vimentin in THP-1 and Hela cell extracts. (K) Immunoblotting analysis of CD68 in THP-1 and Jurkat cell extracts.
- https://cdn.elifesciences.org/articles/56309/elife-56309-supp1-v1.docx
-
Supplementary file 2
Original blots for immunoblotting analysis in Figure 2—figure supplement 4A, Figure 4A, Figure 5E, Figure 7A, and Figure 7G, as indicated.
- https://cdn.elifesciences.org/articles/56309/elife-56309-supp2-v1.docx
-
Transparent reporting form
- https://cdn.elifesciences.org/articles/56309/elife-56309-transrepform-v1.docx
Download links
A two-part list of links to download the article, or parts of the article, in various formats.
Downloads (link to download the article as PDF)
Open citations (links to open the citations from this article in various online reference manager services)
Cite this article (links to download the citations from this article in formats compatible with various reference manager tools)
BAD inactivation exacerbates rheumatoid arthritis pathology by promoting survival of sublining macrophages
eLife 9:e56309.
https://doi.org/10.7554/eLife.56309


