A novel function of R-spondin1 in regulating estrogen receptor expression independent of Wnt/β-catenin signaling
- State Key Laboratory of Cell Biology, CAS Center for Excellence in Molecular Cell Science, Institute of Biochemistry and Cell Biology, University of Chinese Academy of Sciences, China
- Medical Research Institute, Wuhan University, China
- Department of Endocrinology and Metabolism, Ruijin Hospital, Shanghai Jiao Tong University School of Medicine (SJTUSM), China
- School of Life Science, Hangzhou Institute for Advanced Study, University of Chinese Academy of Sciences, Chinese Academy of Sciences, China
Figures
Figure 1 with 2 supplements
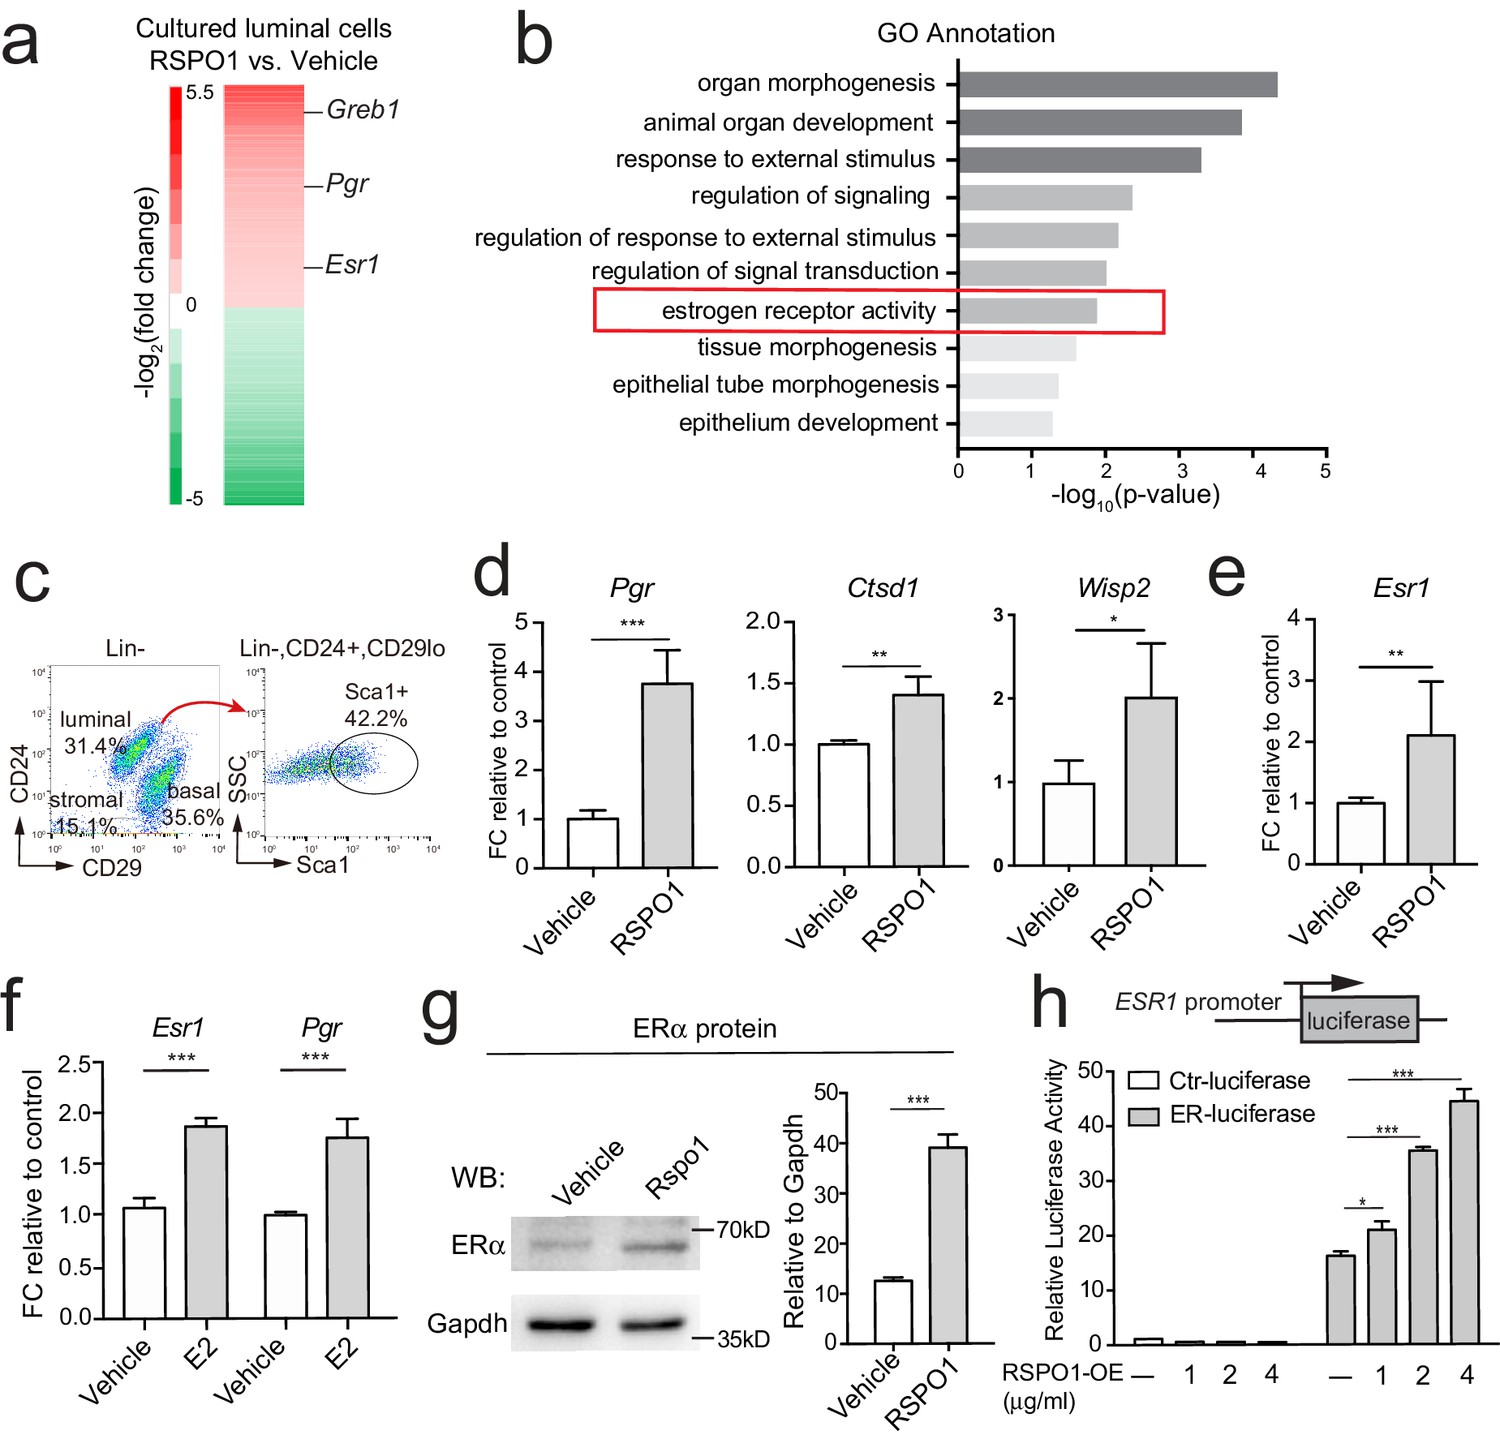
Rspo1 enhances Esr1 transcription and ERα signaling activities.
(a) RNA-seq of 3D cultured luminal cells in the presence of RSPO1 (0.5 μg/ml) or vehicle. Increased expression of ERα target genes (Pgr, Greb1) and Esr1 were enlisted in heatmap of differentially expressed genes (DEGs). (b) GO analysis was conducted on upregulated genes and estrogen receptor activity was enhanced in the presence of RSPO1. (c) Sca1+ luminal cells were FACS-isolated. (d, e) qPCR analysis of cultured cells in day two indicating increased expression of Esr1 (e) and its target genes (d) in the presence of RSPO1 (0.5 μg/ml). (f) E2 (1 μM) treatment was used as positive control indicating the upregulation of Esr1 and its target Pgr. (g) Western analysis of cultured cells in day 2 showing increased ERα protein levels after RSPO1 treatment. (h) A luciferase reporter driven by the ESR1 promoter was constructed and transfected into HEK293T cells. RSPO1 treatment activated the ESR1 promoter-luciferase reporter activities in a dose dependent manner. (d–h) Data are presented as mean ± s.e.m. of three independent experiments. Student’s t test: ***p<0.001, **p<0.01, *p<0.05.
Figure 1—figure supplement 1
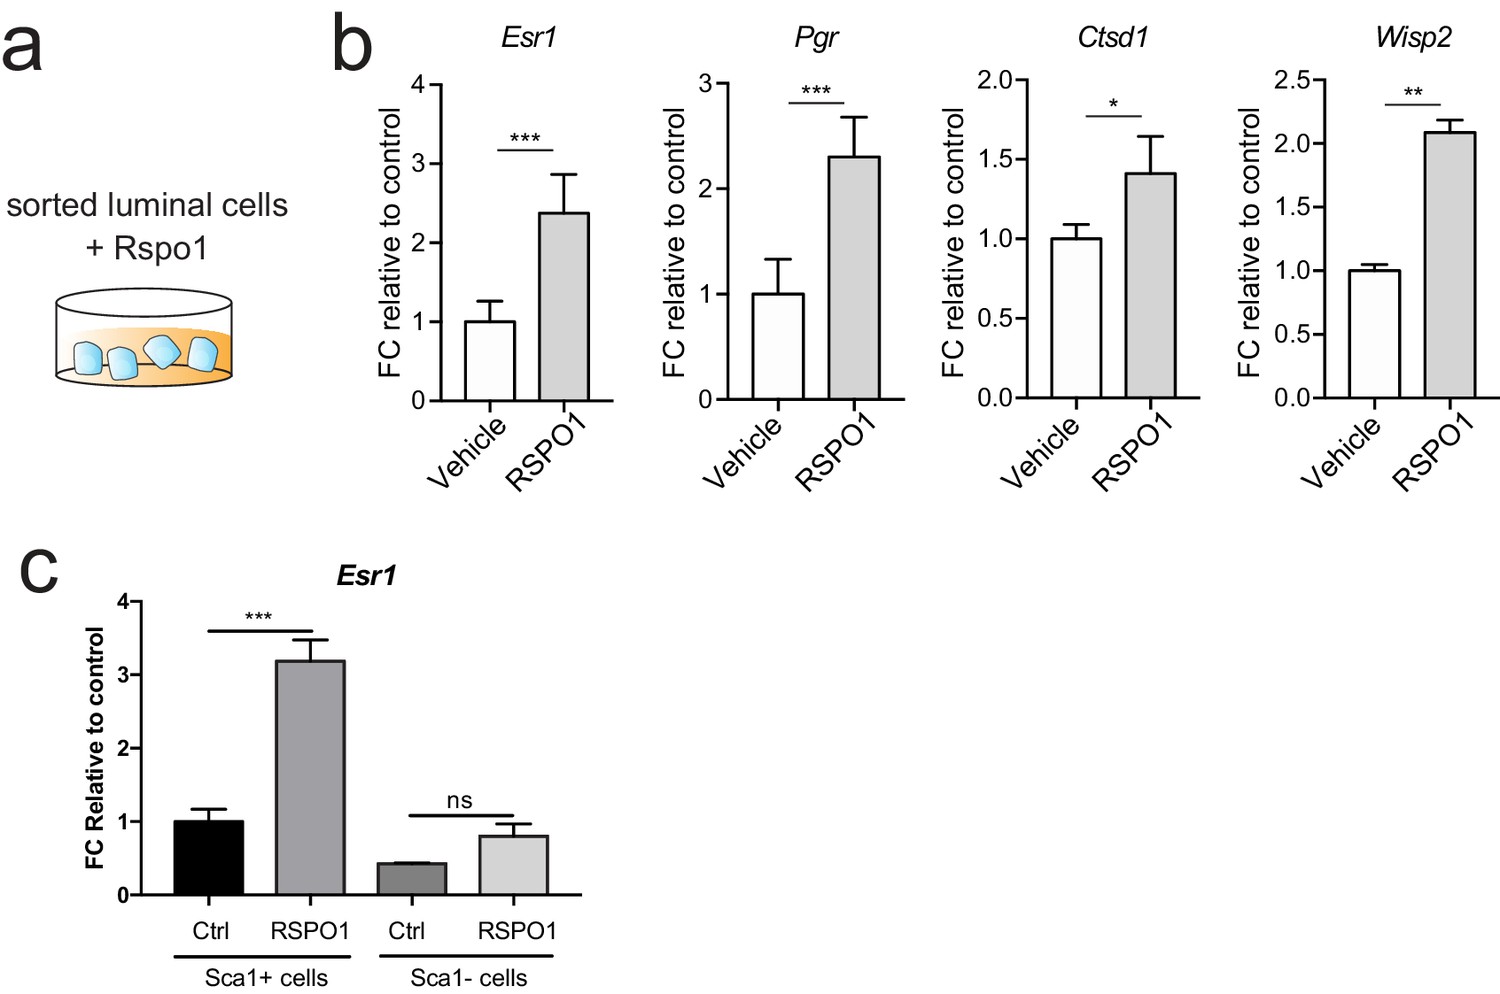
Rspo1 promotes ERα signaling activities.
(a) Sorted Lin-, CD24+, CD29lo luminal cells were cultured in Matrigel as illustrated. (b) qPCR validation indicating increased Esr1 expression and upregulation of ERα target genes in response to RSPO1 stimulation. (c) Sorted Lin-, CD24+, CD29lo, Sca1+ (ER+) or Sca1- (ER-) luminal cells were cultured with or without the stimulation by RSPO1. Esr1 transcription increased in ER+ luminal cells after RSPO1 treatment but not in ER- luminal cells. (b, c) Data are presented as mean ± s.e.m. Student’s t test: ***p<0.001, **p<0.01, *p<0.05.
Figure 1—figure supplement 2
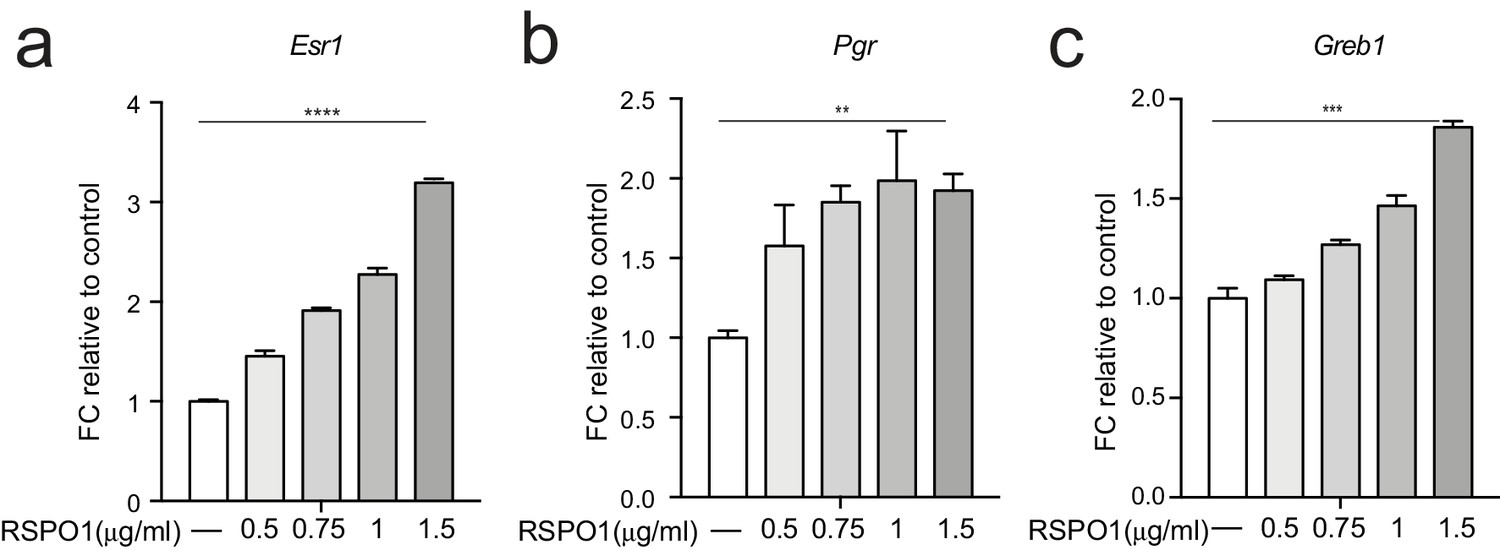
RSPO1 induces Esr1 expression in a dose-dependent manner in Eph4 cell line.
(a) RSPO1 treatment induced the expression of Esr1 in a dose-dependent manner. (b,c) ERα signaling target genes Pgr (b) and Greb1 (c) were upregulated dose-dependently in the presence of RSPO1. Data are presented as mean ± s.e.m. Student’s t test: ****p<0.0001, ***p<0.001, **p<0.01, *p<0.05.
Figure 2 with 1 supplement

Rspo1 inducing Esr1 expression is dependent on Lgr4.
(a) qPCR analysis of Lgrs in FACS-isolated basal and luminal cells. Lgr4, Lgr5 and Lgr6 are all expressed in basal cells, while only Lgr4 is distinctively expressed in luminal cells with even distribution in Sca1+ (ER+) and Sca1- (ER-) luminal subpopulations. (b) Lgr4 in situ hybridization (in pink) confirming its expression in basal (arrow) and luminal cells (arrowhead). Nuclei were counterstained with hematoxylin (in purple). Scale bar, 20 μm. (c) qPCR analysis of Lgr4 expression in cultured luminal cells indicating successful knockdown by shRNA. (d) qPCR analysis of Esr1 expression in cultured luminal cells indicating that knockdown of Lgr4 by shRNA counteracts the upregulation of Esr1 by RSPO1. (e) ESR1 promoter-luciferase reporter assays on T47D cells indicating that knockdown of LGR4 mRNA by shRNA counteracts the upregulation of ESR1 by RSPO1, while scramble shRNA cannot. Data in (c–f) are pooled from three independent experiments and are presented as mean ± s.e.m. Student’s t test: ***p<0.001, **p<0.01, *p<0.05; ns, not significant.
Figure 2—figure supplement 1
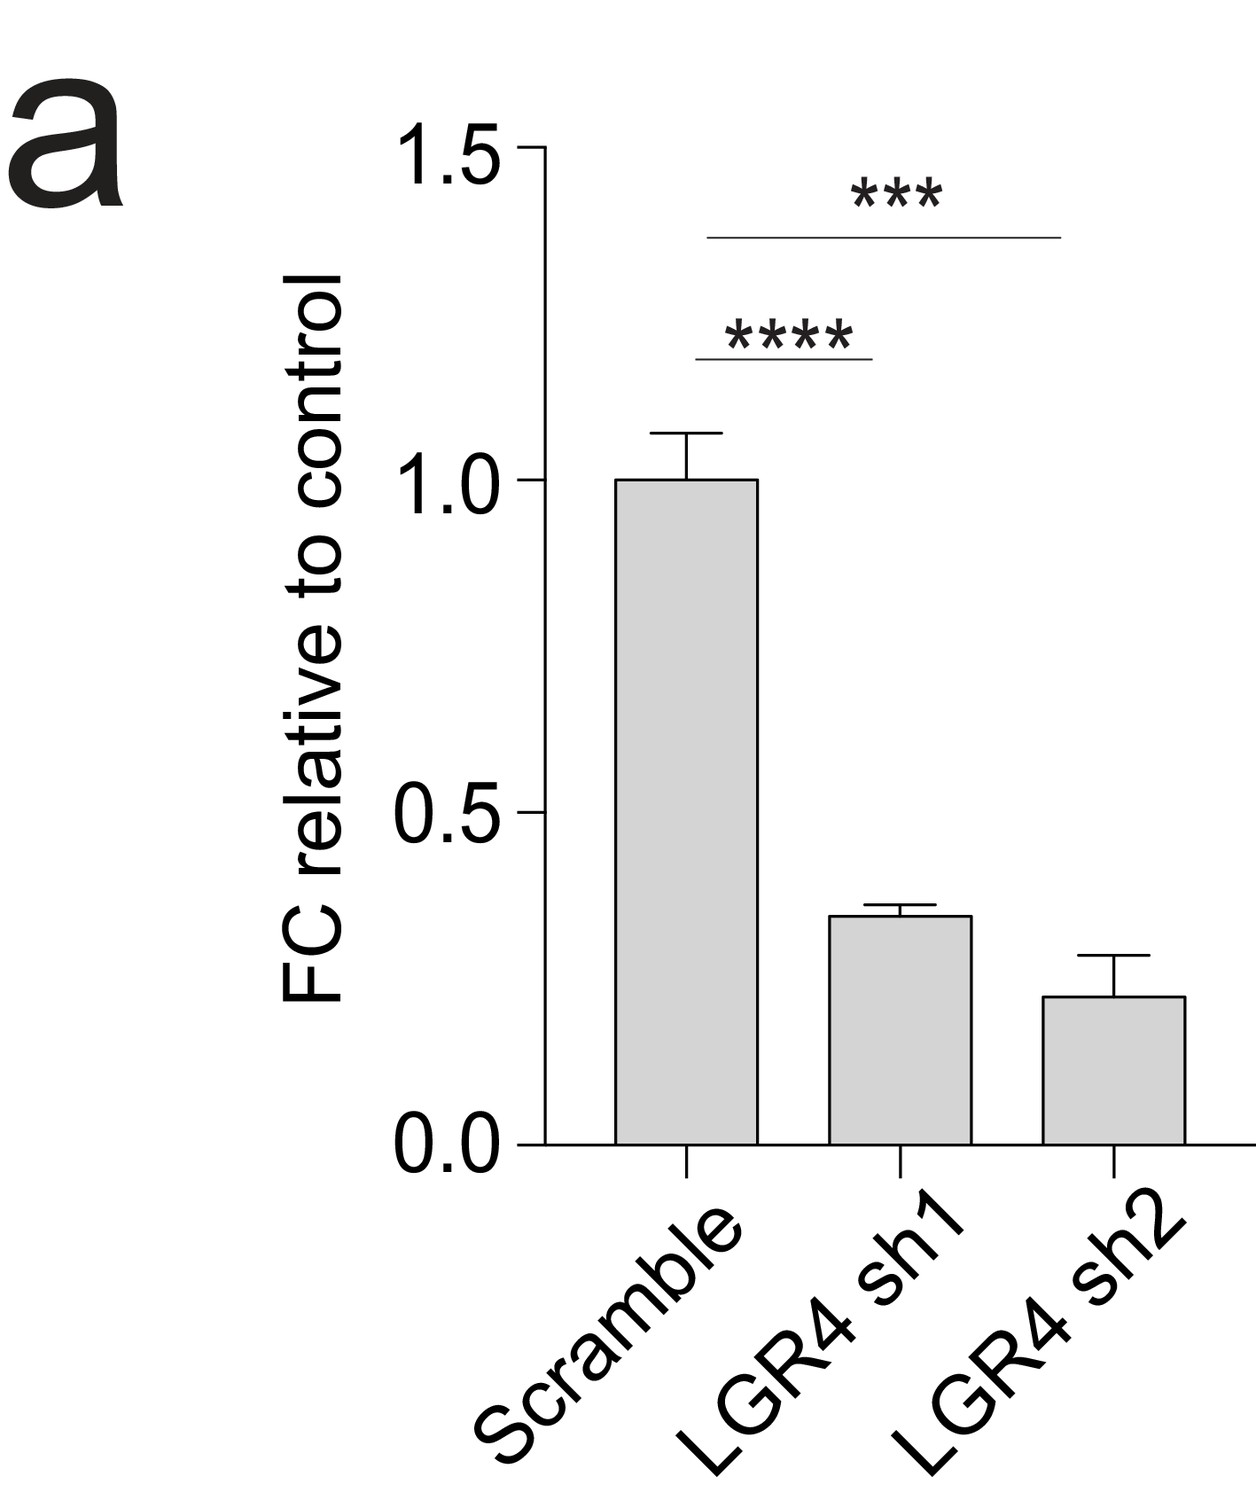
Validation of LGR4 shRNAs knockdown efficiency.
(a) qPCR analysis of LGR4 expression in T47D cells indicating successful knockdown by shRNA.
Figure 3
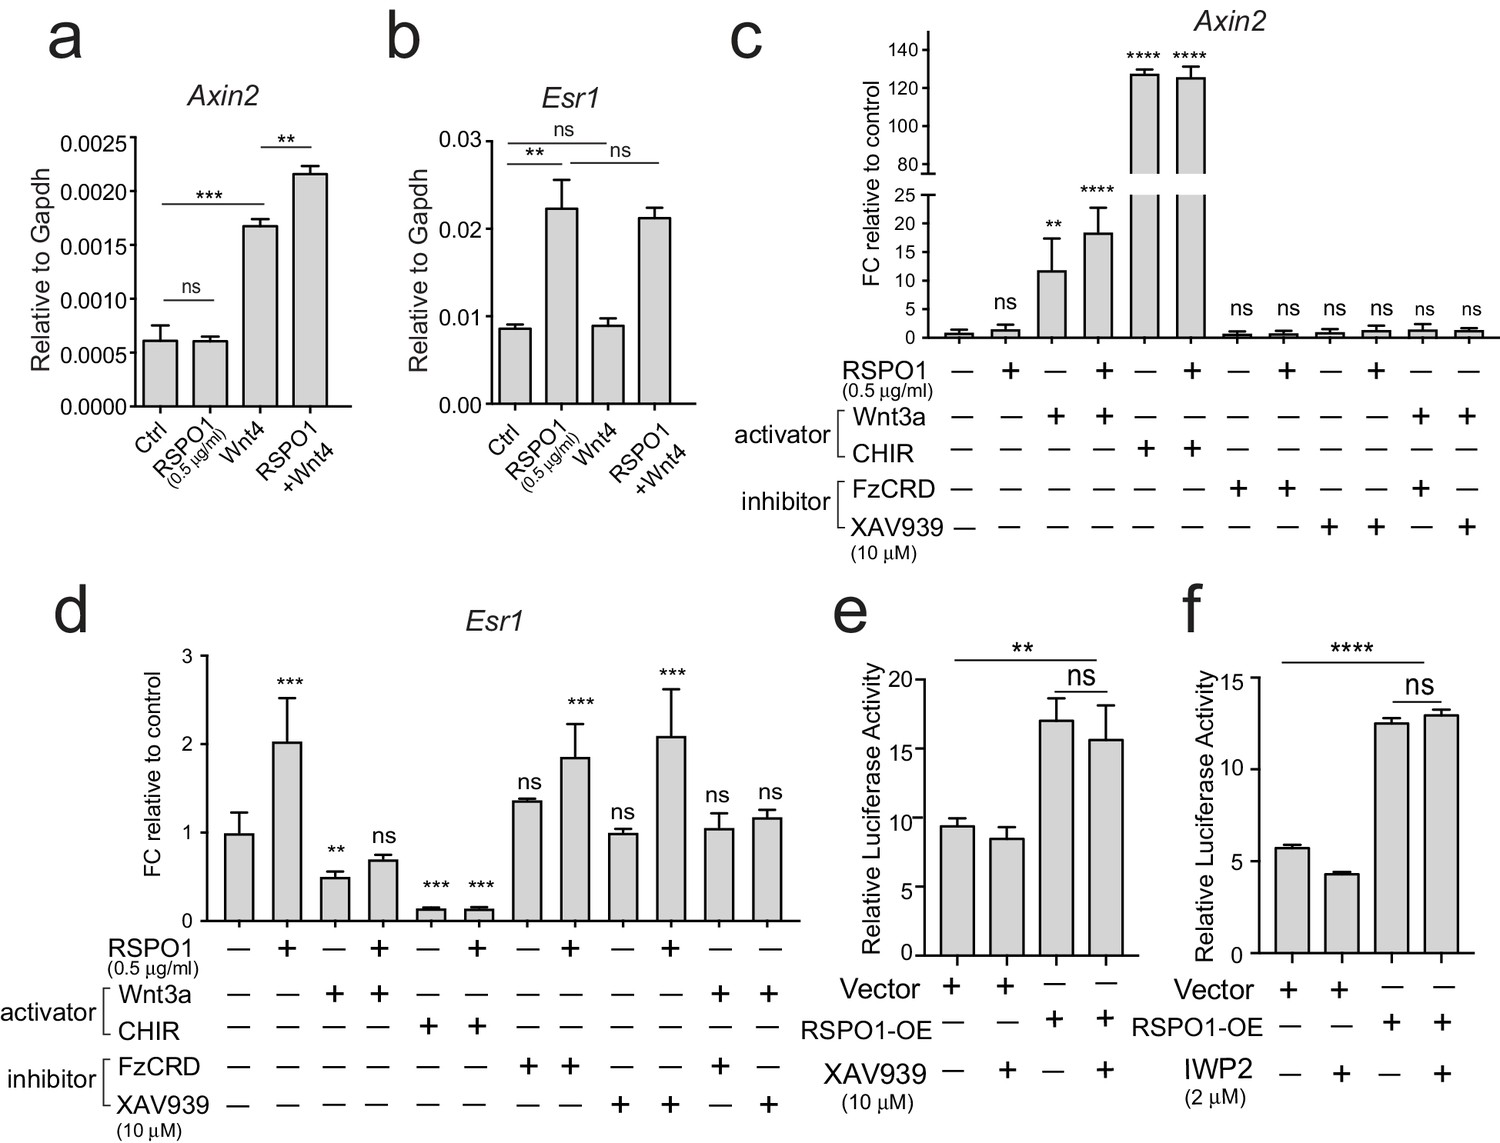
Esr1 expression induced by Rspo1 is independent of Wnt/β-catenin signaling.
(a–b) qPCR analysis of cultured luminal cells indicating that Wnt4 alone or in combination with RSPO1 can activate Wnt target Axin2 expression (a). While RSPO1 alone promoted Esr1 expression, Wnt4 was ineffective for Esr1. Combination of RSPO1 and Wnt4 displayed no difference compared with RSPO1 alone (b). (c–d) qPCR analysis of cultured luminal cells indicating that Wnt signaling activators (Wnt3a and GSK3β inhibitor CHIR) cannot activate Esr1 expression, and that Esr1 expression induced by RSPO1 cannot be suppressed by addition of Wnt signaling inhibitor (FzCRD or β-catenin inhibitor XAV939) (d). In contrast, Wnt-target gene Axin2 expression was activated in the presence of Wnt signaling activators, and was suppressed by adding the signaling inhibitors (c). (e–f) HEK293T cells with transiently expressing ESR1-luciferase reporter were cultured in the presence of RSPO1, or in combination with Wnt inhibitors (XAV939 and IWP2). Wnt inhibitors cannot suppress ESR1-luciferase activities induced by RSPO1. Data in (a–f) are pooled from more than three independent experiments and presented as mean ± s.e.m. Student’s t test. ****p<0.0001, ***p<0.001, **p<0.01, *p<0.05; ns, not significant.
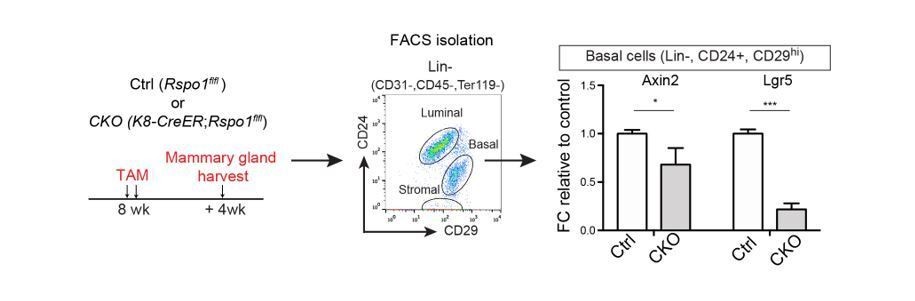
Figure 4 with 2 supplements
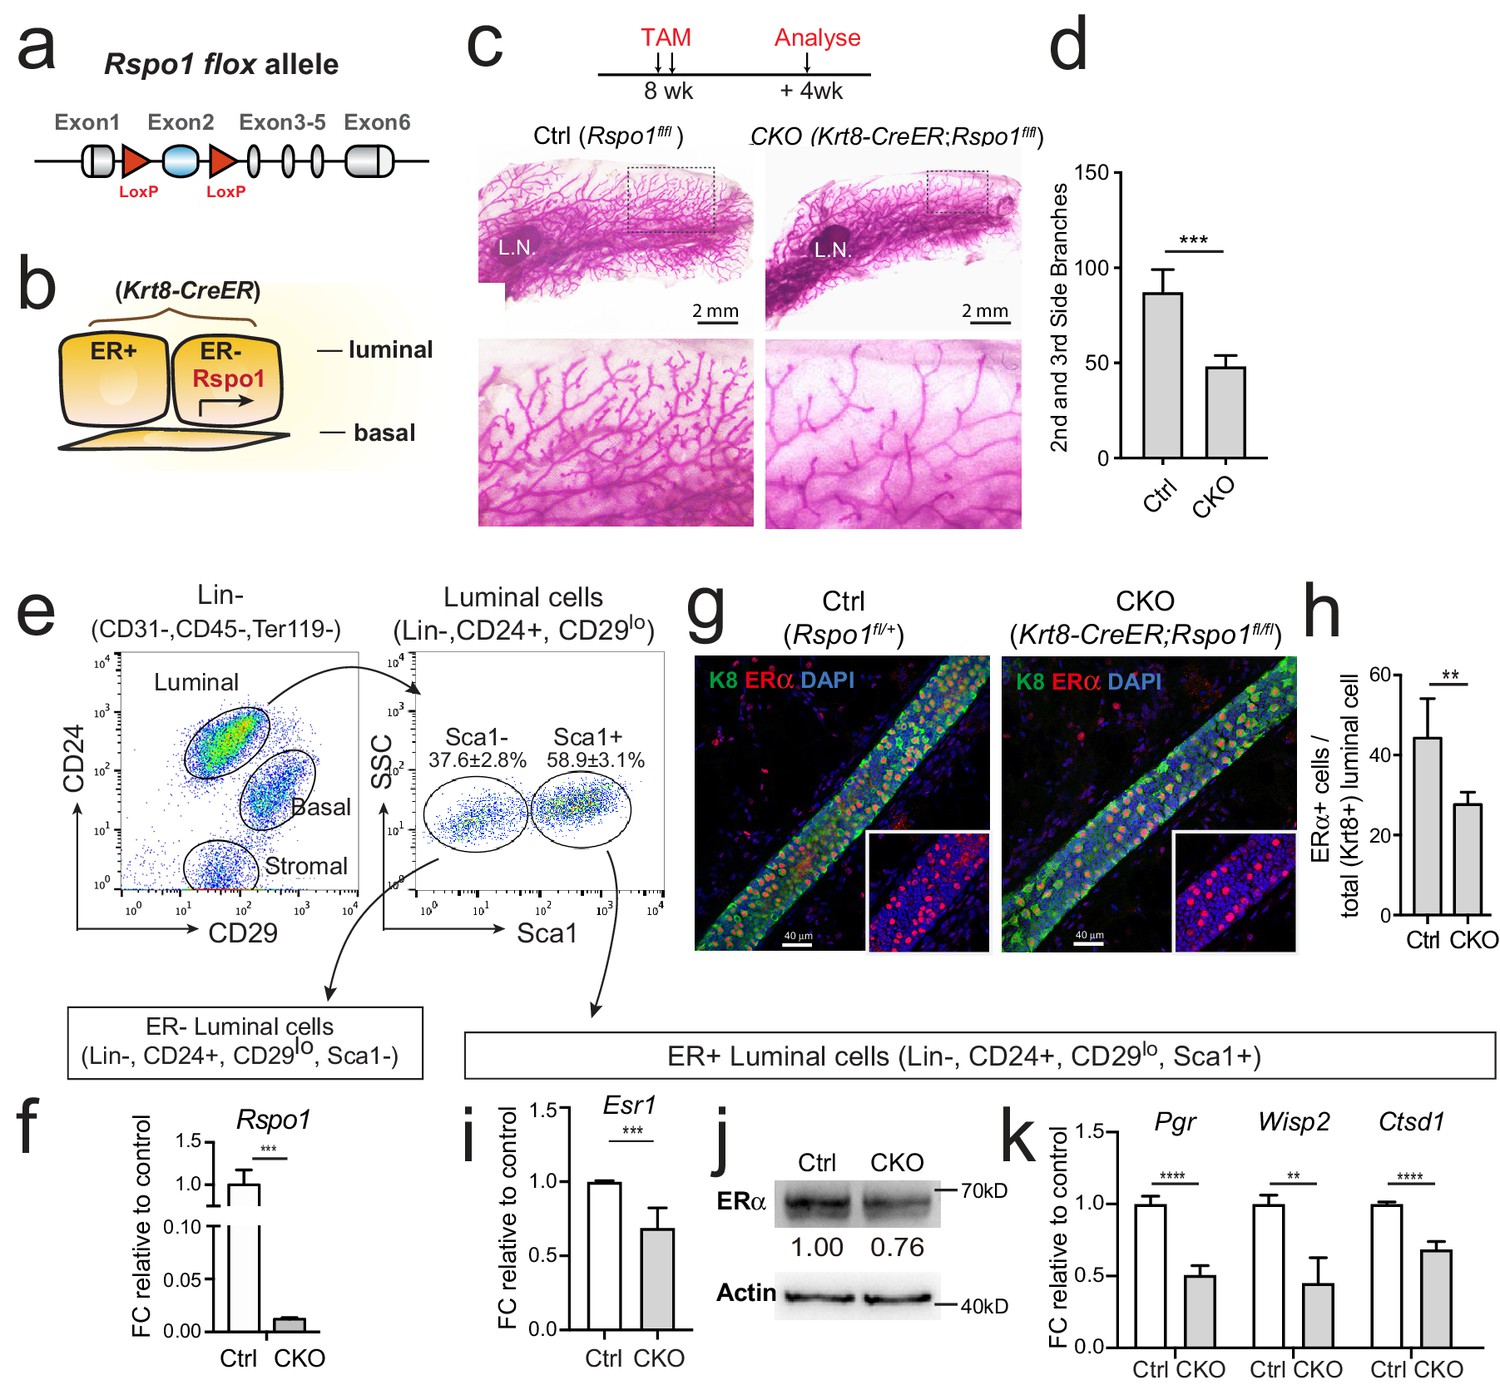
Loss of Rspo1 in mammary luminal cells results in reduced side branching and decreased ERα expression.
(a) Schematic illustration of Rspo1flox knock-in allele generation (see also Figure 4—figure supplement 1). (b) Krt8-CreER;Rspo1fl/fl inducible model specifically knockdown Rspo1 in luminal cells. (c–d) 8-week-old adult virgin mice were Tamoxifen injected twice, 1 day apart (2 mg/25 g body weight per injection). Mammary glands were obtained 4 weeks later. Whole-mount imaging (c) of mammary epithelium and quantification (d) showing decreased side branches in Rspo1-cKO mice. n = 3. Scale bar, 2 mm. More than six views were used for quantification. (e–f) FACS gating strategy for mammary basal and luminal cell isolation. Luminal ER+ and ER- subpopulations were separated based on Sca1 (e). qPCR analyses of luminal cells showing efficient Rspo1 knockdown in Krt8-CreER;Rspo1fl/fl (f). (g–h) Immunostaining indicated decreased ERα+ cell number after Rspo1 knockdown (g). Scale bar, 40 μm. Quantification of ERα+ cells were performed in (h). (i) qPCR analyses of ER+ luminal cells indicated downregulation of Esr1 transcription after Rspo1 knockdown in ER- cells. (j) Sca1+ (ER+) luminal cells were FACS isolated and Western blot was performed to indicate decreased ERα expression after Rspo1 knockdown. (k) qPCR analyses of ER+ luminal cells indicated downregulation of ERα target genes after Rspo1 knockdown in ER- cells. Data are presented as mean ± s.e.m. of more than three independent experiments. Student’s t test: ****p<0.0001, ***p<0.001, **p<0.01, *p<0.05. L.N. Lymph node.
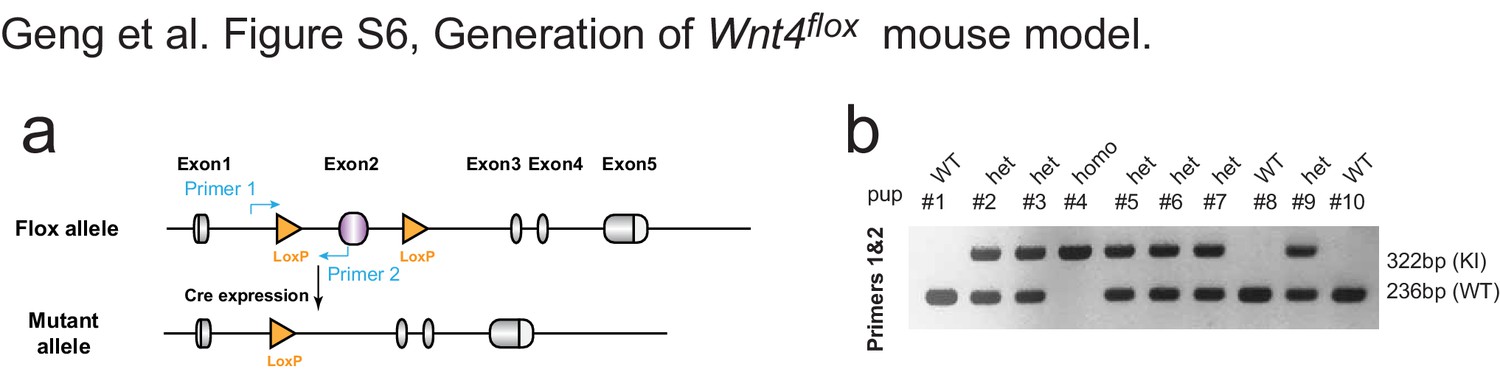
Figure 4—figure supplement 1
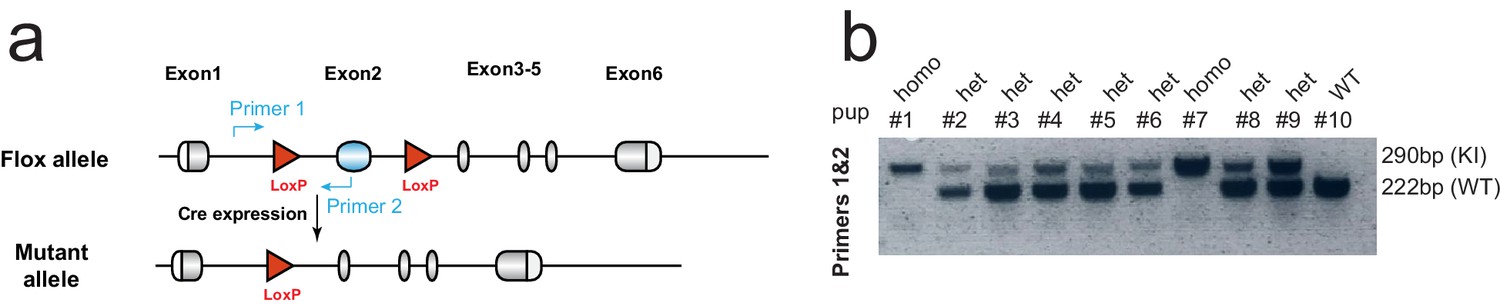
Generation of Rspo1flox mouse model.
(a) Targeting strategy to generate the Rspo1flox knock-in (KI) mouse. Design of genotyping primers are as indicated. Exon2 of the Rspo1 gene was replaced by inserting cassette. (b) Pups born from crossing heterozygous male and female mice were genotyped by PCR. Pups with KI allele were identified by the presence of a larger 290 bp band. Genotyping PCR indicated the proper distribution of wild type and heterozygous as Mendel’s law of segregation.
Figure 4—figure supplement 2
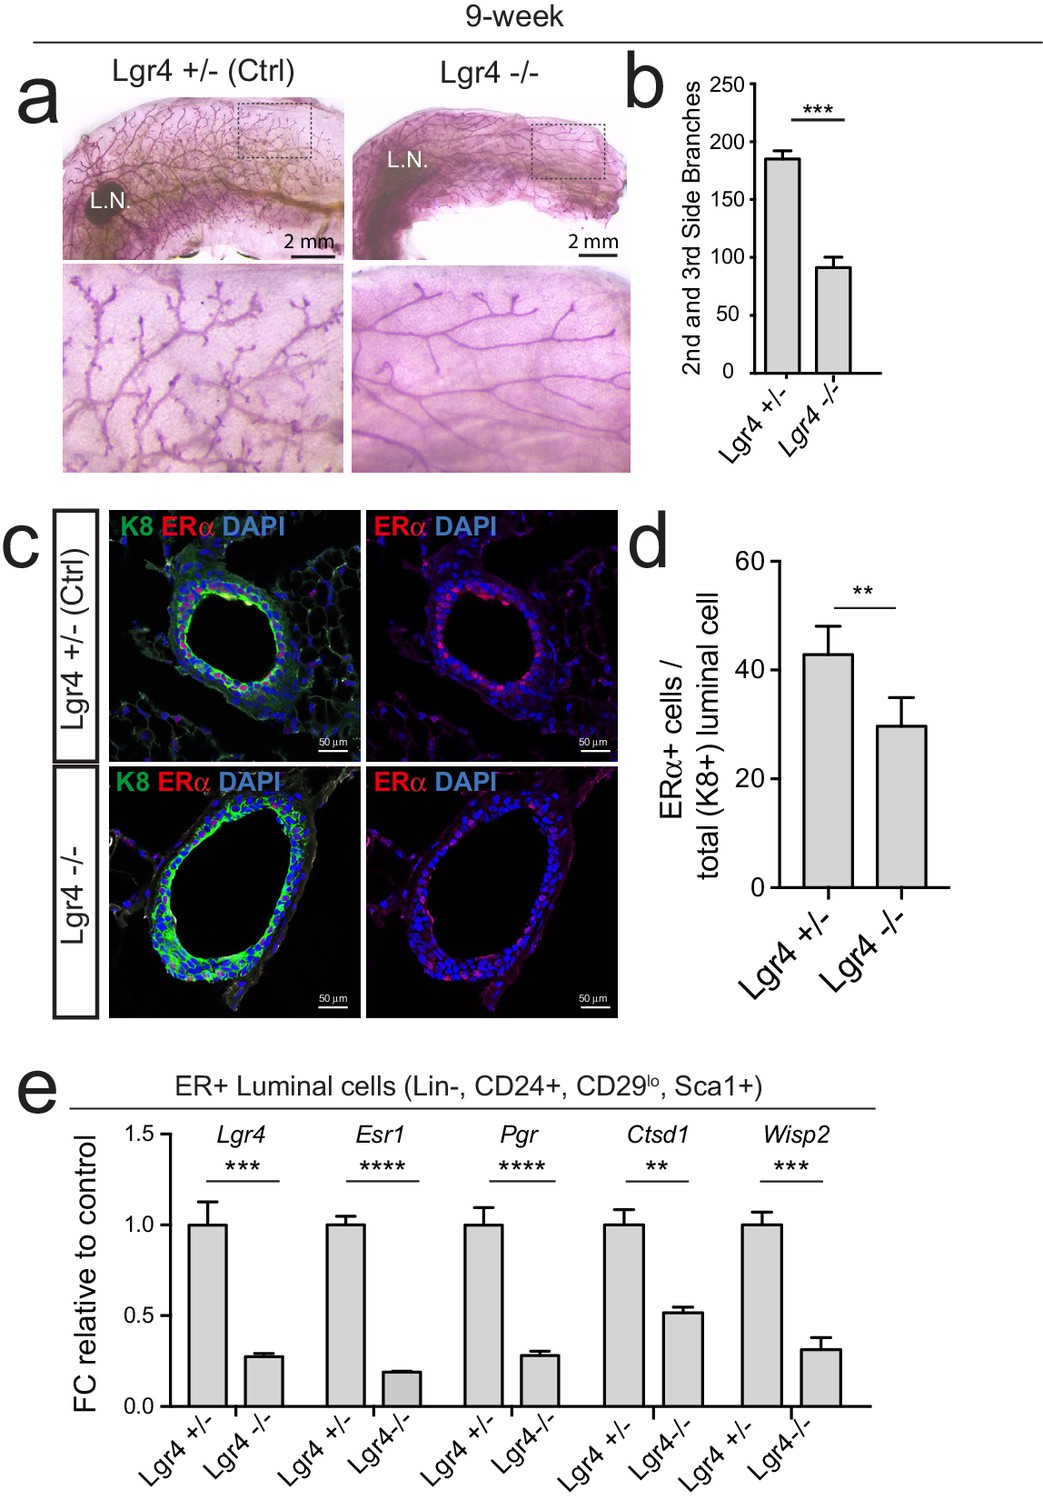
Loss of Lgr4 reduces Esr1 expression and ERα signaling activities.
(a) Lgr4-/- mammary glands display reduced side branches. (b) Quantification of side branches was performed in designated area. More than six views were used for quantification. (c) Immunostaining of ERα in 8-week-old virgin control and Lgr4-/- mammary gland. More than six views were used for quantification. Scale bar, 50 μm. (d) Quantification of the proportion of ERα+ luminal cell among all luminal cells. (e) qPCR analysis of ER+ luminal cells (Lin-,CD24+,CD29lo,Sca1+) from mammary gland 1) confirming Lgr4 deficiency in Lgr4-/- mammary gland; 2) indicating that Esr1 expression is significantly decreased in Lgr4-/- mammary gland, and 3) reduced ERα targets Pgr, Ctsd1 and Wisp2. n = 3 mice. L.N. Lymph node. (d, e) Data are presented as mean ± s.e.m. Student’s t test: ****p<0.0001, ***p<0.001, **p<0.01, *p<0.05. ns, not significant.
Figure 5 with 1 supplement
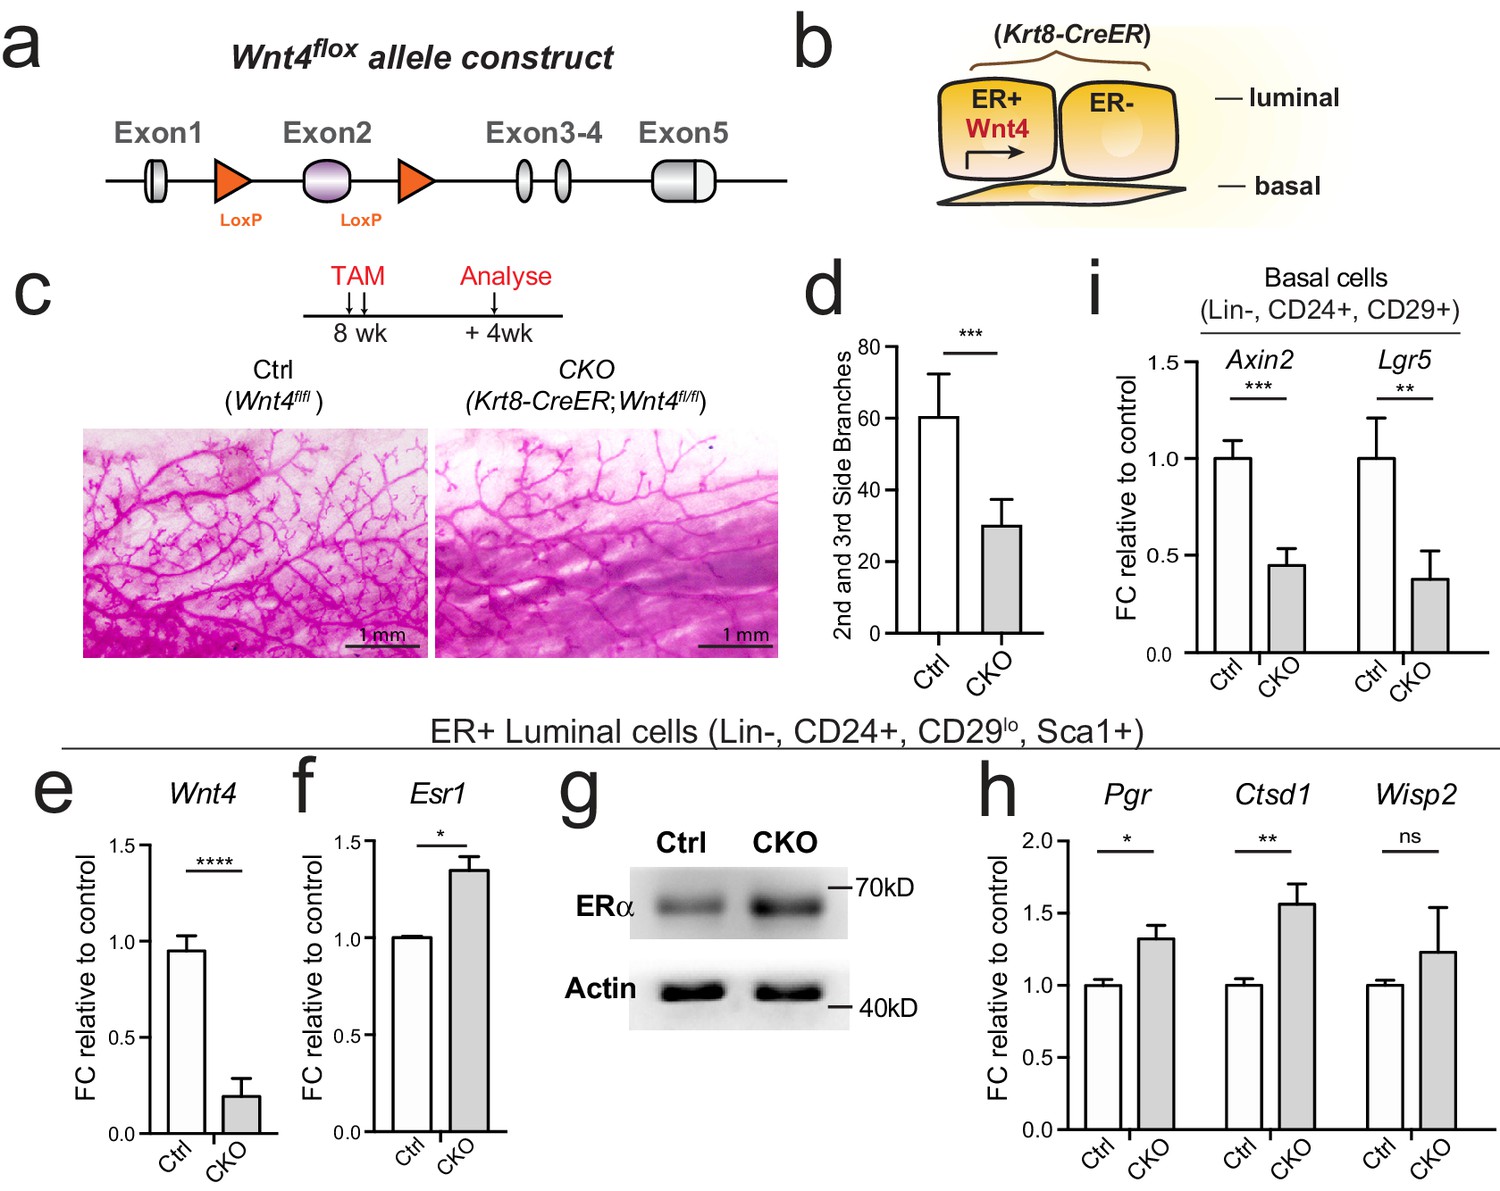
Loss of Wnt4 increases Esr1 expression in luminal cells.
(a) Schematic illustration of Wnt4flox knock-in allele generation (see also Figure 5—figure supplement 1). (b) Krt8-CreER;Wnt4flox inducible model specifically knockdown Wnt4 in luminal cells. (c–d) 8-week-old adult virgin mice were Tamoxifen administered for 2 courses at 1 day apart, 2 mg/25 g body weight per injection and harvested 4 weeks later. Whole-mount imaging of the mammary epithelium showing decreased side branches in Wnt4-cKO mice (c). n = 3. Scale bar, 1 mm. More than six views were used for quantification. (e) qPCR of isolated ER+ luminal cells validated efficient Wnt4 knockdown in cKO mice. (f) qPCR analysis of ER+ luminal cells indicated Wnt4 loss increased Esr1 expression levels. (g) Western blot analysis indicated increased ERα protein level in Wnt4-cKO. (h) qPCR analysis of ER+ luminal cells indicated increased ERα signaling pathway activity after Wnt4 knockdown. (i) qPCR analysis of basal cells showed Wnt signaling pathway was decreased after Wnt4 knockdown. Data are presented as mean ± s.e.m. Student’s t test: ****p<0.0001, ***p<0.001, **p<0.01, *p<0.05; ns, not significant.
Figure 5—figure supplement 1
Generation of Wnt4flox mouse model.
(a) Targeting strategy to generate the Wnt4flox knock-in (KI) mouse. Design of genotyping primers are as indicated. Exon2 of the Wnt4 gene was replaced by inserting cassette. (b) Pups born form crossing of heterozygous male and female mice were genotyped by PCR. Pups with KI allele were identified by the presence of a larger 322 bp band. Genotyping PCR indicated the proper distribution of wild type and heterozygous as Mendel’s law of segregation.
Figure 6 with 1 supplement
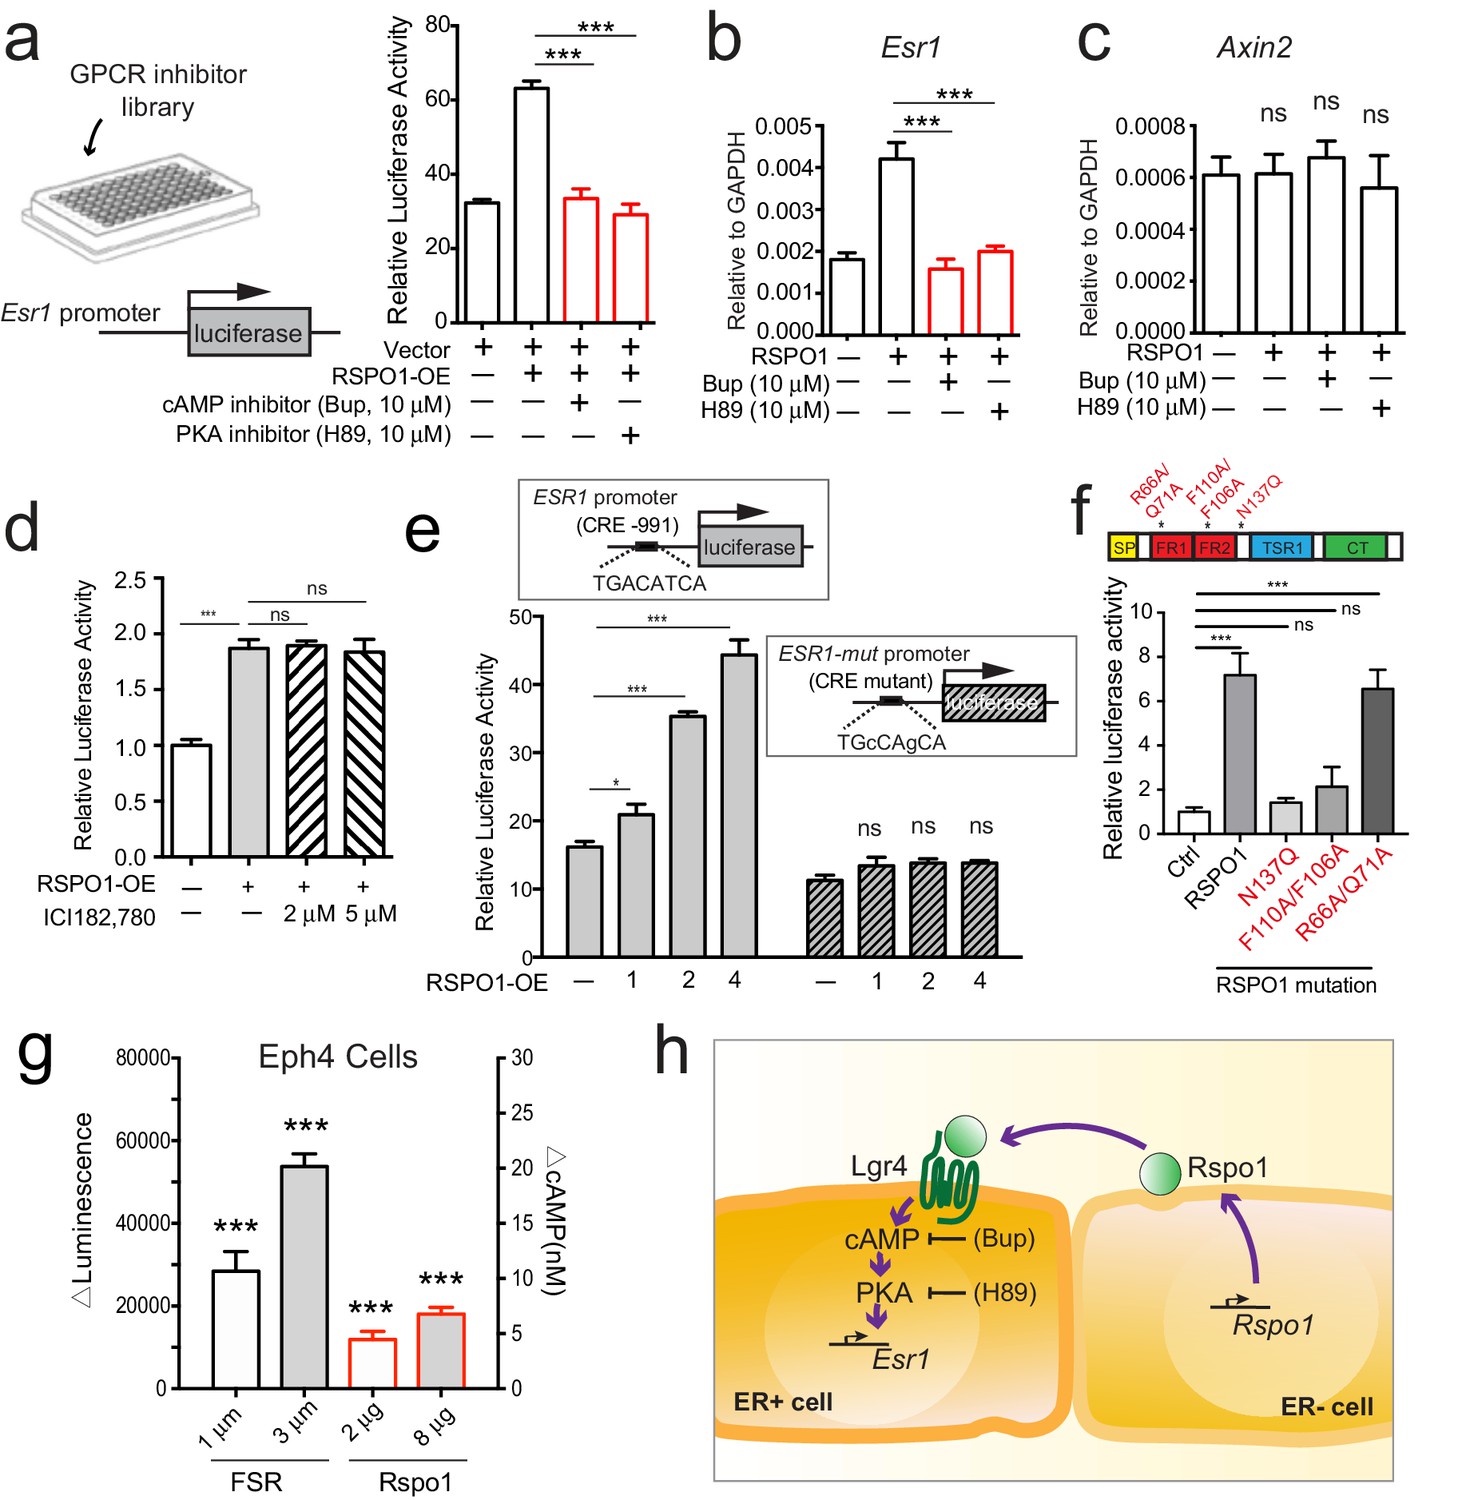
Rspo1 inducing Esr1 expression relies on cAMP-PKA pathway.
(a) HEK293T cells transfected with ESR1-luciferase reporter were cultured in the presence of RSPO1, and in combination with pharmaceutical compounds from a GPCR inhibitor library (Selleck). Bupivacaine HCl (Bup), a cAMP inhibitor, and H89, a PKA inhibitor, suppressed Esr1-luciferase activities induced by RSPO1 (see Figure 6—figure supplement 1a–b). (b–c) qPCR analysis of cultured luminal cells indicating both Bup and H89 counteracted the upregulation of Esr1 expression induced by RSPO1 (b), while Axin2 expression is not affected (c). (d) HEK293T cells with transiently expressing ESR1-luciferase reporter were cultured in the presence of RSPO1 alone or with ERα inhibitor ICI182, 780. Luciferase activities were measured. ICI did not affect the ESR1 upregulation induced by RSPO1. (e) CRE site on ESR1 promoter-luciferase reporter was mutated, and RSPO1 could not activate the reporter with CRE mutation. (f) RSPO1-FL, RSPO1-R66A/Q71A mutant could, but RSPO1-N137Q and RSPO1-F110A/F106A mutants could not induce Esr1 promoter luciferase activities. (g) ΔLuminescence was read out after Eph4 cells were treated with forskolin (FSR) or RSPO1 for 30 min, ΔLuminescence was calculated as Luminescencetreated—Luminescenceuntreated. Rspo1 treatment induced cAMP production in Eph4 cells in a dose dependent manner. (h) Illustration of Rspo1 regulated Esr1 expression mediated by cAMP-PKA pathway. Data in (a–d) are pooled from three independent experiments and presented as mean ± s.e.m. Student’s t test: ***p<0.001, **p<0.01, *p<0.05; ns, not significant.
-
Figure 6—source data 1
ESR1-luciferase activities induced by RSPO1 in combination with a GPCR inhibitor library.
- https://cdn.elifesciences.org/articles/56434/elife-56434-fig6-data1-v1.xls
Figure 6—figure supplement 1
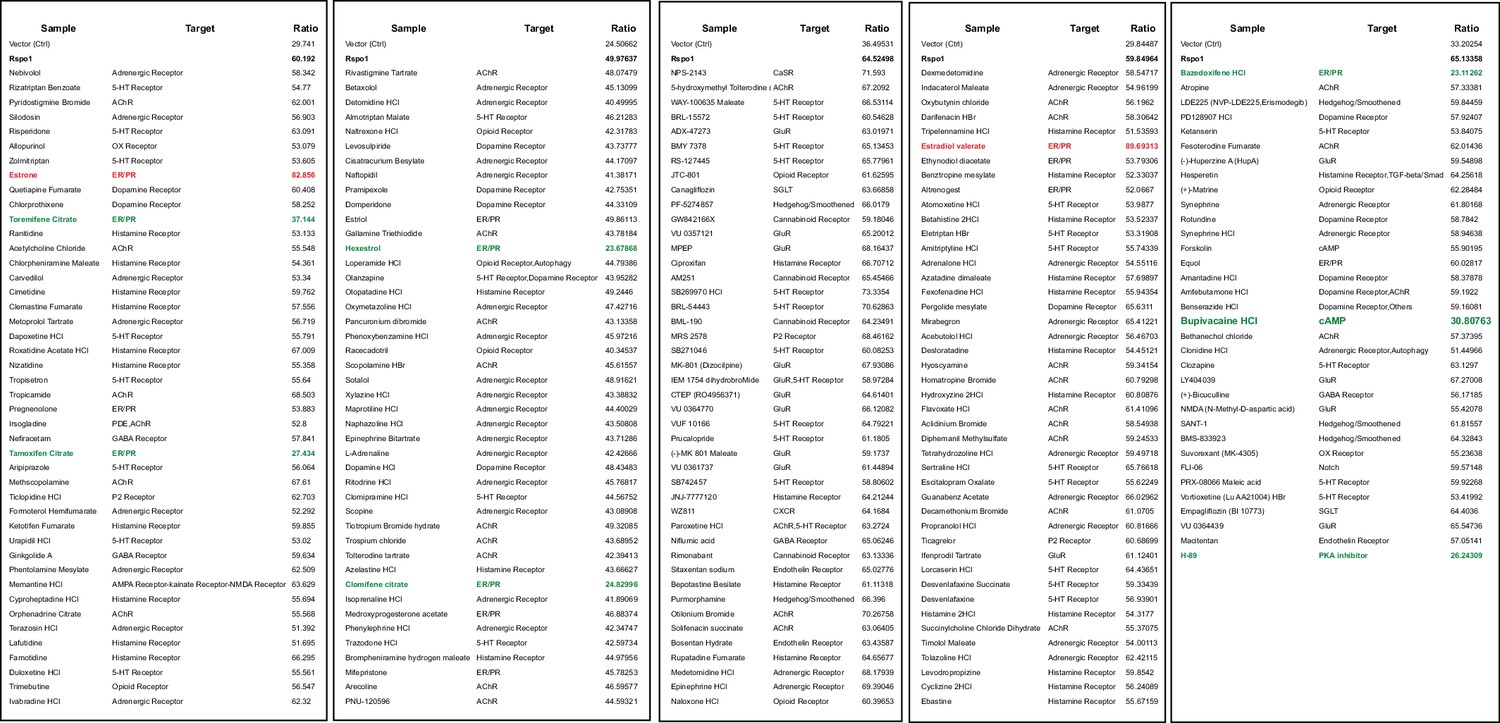
ESR1-luciferase activities induced by RSPO1 in combination with a GPCR inhibitor library HEK293 cells with transiently expressing ESR1-luciferase reporter were cultured in the presence of RSPO1, and screened for the molecules that could suppress the luciferase activities using a GPCR inhibitor library (Selleck, L2200).
Luciferase activities were measured.
Author response image 1

Author response image 2
Tables
Key resources table
| Reagent type (species) or resource | Designation | Source or reference | Identifiers | Additional information |
|---|---|---|---|---|
| Genetic reagent (M. musculus) | Krt8-CreERT2 | PMID:22350718 | RRID:MGI:5314229 | Dr. Li Xin (Department of Molecular and Cellular Biology, Baylor College of Medicine, United States) |
| Genetic reagent (M. musculus) | Rspo1flox/+ | This paper | Generated in our laboratory Detail refer to Figure 4 and Figure 4—figure supplement 1 | |
| Genetic reagent (M. musculus) | Wnt4flox/+ | This paper | Generated in our laboratory Detail refer to Figure 5 and Figure 5—figure supplement 1 | |
| Genetic reagent (M. musculus) | Lgr4LacZ/+ | PMID:15192078 | RRID:MGI:3052121 | Drs. Minyao Liu and Dali Li |
| Cell line (M. musculus) | Eph4 | PMID:25260709 | Mouse mammary epithelial cell line | |
| Cell line (H. sapiens) | HEK293T (293T) | http://www.cellbank.org.cn | Cat. #: SCSP-502 | |
| Cell line (H. sapiens) | T47D | Dr. Gaoxiang Ge's laboratory | Human breast cancer cell line Dr. Gaoxiang Ge (Institute of Biochemistry and Cell Biology) | |
| Antibody | Rabbit anti Gapdh GAPDH Polyclonal Antibody | Proteintech | Cat. #: 10494–1-AP RRID:AB_2263076 | WB (1:3000) |
| Antibody | Mouse anti β-Actin Monoclonal Antibody | Sigma | Cat. #: A2228 RRID:AB_476697 | WB (1:2000) |
| Antibody | Rabbit anti ERα Polyclonal Antibody | Millipore | Cat. #: 06–935 RRID:AB_310305 | WB (1:1000), IHC (1:200) |
| Antibody | Rat anti Krt8 Monoclonal Antibody | DSHB | Cat. #: TROMA-1 | IHC (1:500) |
| Antibody | Rat Anti-Mouse CD31 Monoclonal Antibody, Biotin Conjugated | BD PharMingen | Cat. #: 553371 RRID:AB_394817 | Flow cytometry (1:200) |
| Antibody | Rat Anti-Mouse CD45 Monoclonal Antibody, Biotin Conjugated | BD PharMingen | Cat. #: 553078 RRID:AB_394608 | Flow cytometry (1:200) |
| Antibody | Rat Anti-Mouse TER-119 Monoclonal Antibody, Biotin Conjugated | BD PharMingen | Cat. #: 553672 | Flow cytometry (1:200) |
| Antibody | Rat Anti-Mouse CD31 Monoclonal Antibody, FITC Conjugated | BD PharMingen | Cat. #: 553372 RRID:AB_394818 | Flow cytometry (1:200) |
| Antibody | Rat Anti-Mouse CD45 Monoclonal Antibody, FITC Conjugated | BD PharMingen | Cat. #: 553080 RRID:AB_394610 | Flow cytometry (1:200) |
| Antibody | Rat Anti-Mouse TER119 Monoclonal Antibody, FITC Conjugated | BD PharMingen | Cat. #: 557915 | Flow cytometry (1:200) |
| Antibody | PE/Cy7 Rat Anti-Mouse CD24 Monoclonal Antibody | Biolegend | Cat. #: 101–822 RRID:AB_756048 | Flow cytometry (1:200) |
| Antibody | APC Armenian Hamster Anti-Mouse/Rat CD29 Monoclonal Antibody | Biolegend | Cat. #: 102216 RRID:AB_492833 | Flow cytometry (1:200) |
| Antibody | Rat Anti-Ly-6A/E (Sca-1) Monoclonal Antibody, PE | eBioscience | Cat. #: 12-5981-82 RRID:AB_466086 | Flow cytometry (1:200) |
| Antibody | Streptavidin eFluor 450 Conjugate | eBioscience | Cat. #: 48-4317-82 RRID:AB_10359737 | Flow cytometry (1:200) |
| Peptide, recombinant protein | Epithelial growth factor (EGF) | Corning | Cat. #: 354001 | 50 ng/mL |
| Peptide, recombinant protein | FzCRD | PMID:25260709 | Inhibition of the Frizzled receptor using its soluble CRD domain. Purified in our laboratory (1:200) | |
| Peptide, recombinant protein | Wnt3A | PMID:20569694 | Purified in our laboratory 200 ng/ml | |
| Recombinant DNA reagent | plko.1 backbone | Addgene | RRID:Addgene_30323 | |
| Recombinant DNA reagent | pGL4.17 basic vector | Promega, Madison, WI, U.S.A. | Cat. #: E6721 | |
| Recombinant DNA reagent | pRL-TK Renilla | Promega, Madison, WI, U.S.A. | Cat. #: E2241 | |
| Recombinant DNA reagent | pcDNA3.1-RSPO1 overexpression (RSPO1-OE) plasmid | This paper | Constructed in our laboratoryDetail refer to Materials and methods | |
| Chemical compound, drug | tamoxifen (TAM) | Sigma-Aldrich | Cat. #: T5648 | 2 mg/20 g |
| Chemical compound, drug | HEPES | Sigma | Cat. #: H4034-500G | 25 mM |
| Chemical compound, drug | Collagenase III | Worthington | Cat. #: LS004183 | 300 U/ml |
| Chemical compound, drug | red blood cell lysing buffer | Sigma | Cat. #: R7757 | |
| Chemical compound, drug | DNase I | Sigma | Cat. #: D4263 | 0.1 mg/mL |
| Chemical compound, drug | Carmine | Sigma | Cat. #: C1022 | 2 mg/ml |
| Chemical compound, drug | Histoclear | National Diagnostics | Cat. #: HS-200 | |
| Chemical compound, drug | Matrigel | BD Bioscience | Cat. #: 354230 | |
| Chemical compound, drug | Insulin-Transferrin-Selenium (ITS) | Gibco | Cat. #: 41400045 | Cell culture (1:100) |
| Chemical compound, drug | E2 | Sigma | Cat. #: E8875 | 1 μM |
| Chemical compound, drug | IWP2 | Selleck | Cat. #: s7085 | 2.5 μM |
| Chemical compound, drug | CHIR | Selleck | Cat. #: S1263 | 3 μM |
| Chemical compound, drug | XAV-939 | Selleck | Cat. #: S1180 | 10 μM |
| Chemical compound, drug | Protein A Agarose | Santa Cruz | Cat. #: sc-2003 | |
| Chemical compound, drug | DAPI | Life Technologies | Cat. #: P36931 | |
| Chemical compound, drug | GPCR compound library | Selleckchem L2200 | Chemical Biology Core Facility, Institute of Biochemistry and Cell Biology, SIBS, CAS | |
| Commercial assay or kit | In situ hybridization RNAscope kit | Advanced Cell Diagnostics | Following the manufacturer’s instructions | |
| Commercial assay or kit | Dual-Luciferase Reporter Assay System | Promega | Cat. #: E1910 | Following the manufacturer’s instructions |
| Commercial assay or kit | cAMP-Glo assay kit | Promega | Cat. #: V1501 | Following the manufacturer’s instructions |
| Commercial assay or kit | SuperScript III kit | Invitrogen | Cat. #: RR036A | Following the manufacturer’s instructions |
| Software, algorithm | GraphPad Prism | GraphPad Prism (https://graphpad.com) | ||
| Software, algorithm | ImageJ | ImageJ (http://imagej.nih.gov/ij/) |
Additional files
Download links
A two-part list of links to download the article, or parts of the article, in various formats.
Downloads (link to download the article as PDF)
Open citations (links to open the citations from this article in various online reference manager services)
Cite this article (links to download the citations from this article in formats compatible with various reference manager tools)
A novel function of R-spondin1 in regulating estrogen receptor expression independent of Wnt/β-catenin signaling
eLife 9:e56434.
https://doi.org/10.7554/eLife.56434


