Gli3 utilizes Hand2 to synergistically regulate tissue-specific transcriptional networks
- Division of Developmental Biology, Cincinnati Children’s Hospital Medical Center, United States
- Division of Plastic Surgery, Department of Surgery, Cincinnati Children’s Hospital Medical Center, United States
- Graduate Program in Molecular and Developmental Biology, Cincinnati Children's Hospital Research Foundation, United States
- Center for Autoimmune Genomics and Etiology, Department of Pediatrics, Cincinnati Children’s Hospital Medical Center, United States
- Medical-Scientist Training Program, University of Cincinnati College of Medicine, United States
- Jackson Laboratory, United States
- Developmental Genetics, Department of Biomedicine, University of Basel, Switzerland
- Shriners Children’s Hospital, United States
Figures
Figure 1 with 1 supplement
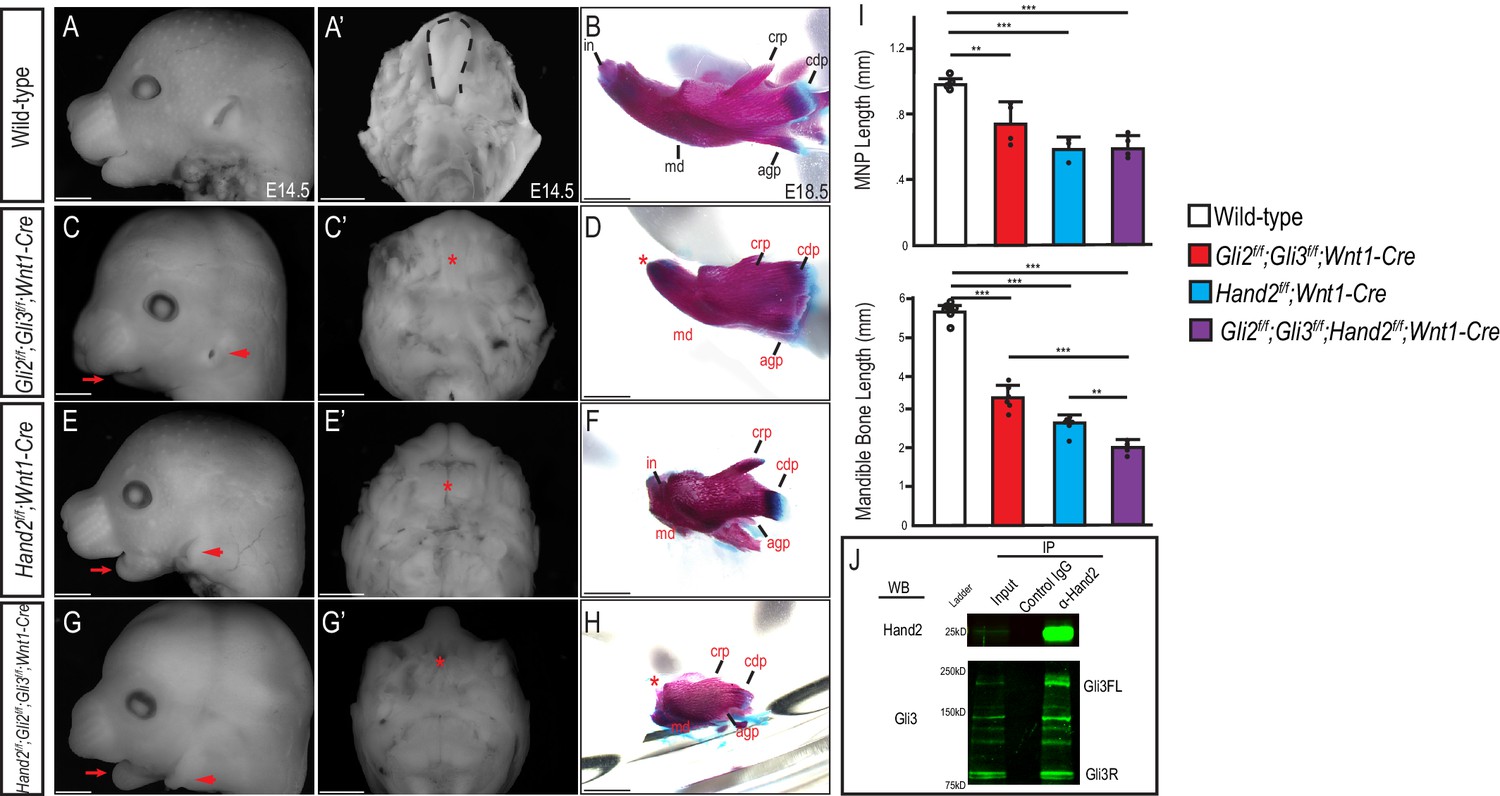
Gli and Hand2 are required for mandibular development in vivo.
(A,C,E,G) Lateral cranial view or (A’,C’,E’,G’) dorsal mandibular view of wild-type, Gli2f/f;Gli3f/f;Wnt1-Cre, Hand2f/f;Wnt1-Cre, and Gli2f/f;Gli3f/f;Hand2f/f;Wnt1-Cre embryos at E14.5. Red arrow indicates micrognathia. Red arrowhead indicates low-set pinnae. Dotted black line denotes tongue and red asterisk highlights observed aglossia. (B,D,F,H) Lateral view of Alizarin Red and Alcian Blue staining to mark bone and cartilage respectively in wild-type, Gli2f/f;Gli3f/f;Wnt1-Cre, Hand2f/f;Wnt1-Cre, and Gli2f/f;Gli3f/f;Hand2f/f;Wnt1-Cre mandibles at E18.5. Abbreviations: md, mandible; in, incisor; crp, coronoid process; cdp, condylar process; (I) Measurements of MNP and mandibular bone. Data are expressed as mean + SD with individual data points. *p<0.05, **p<0.01, ***p<0.001. (J) Co-immunoprecipitation showing interaction between Gli3 and Hand2 within E10.5 MNPs. Scale bar: 1 mm. See also Figure 1—figure supplement 1.
-
Figure 1—source data 1
Differences in gene expression levels from conditional KO bulk RNA-seq.
- https://cdn.elifesciences.org/articles/56450/elife-56450-fig1-data1-v2.xlsx
Figure 1—figure supplement 1
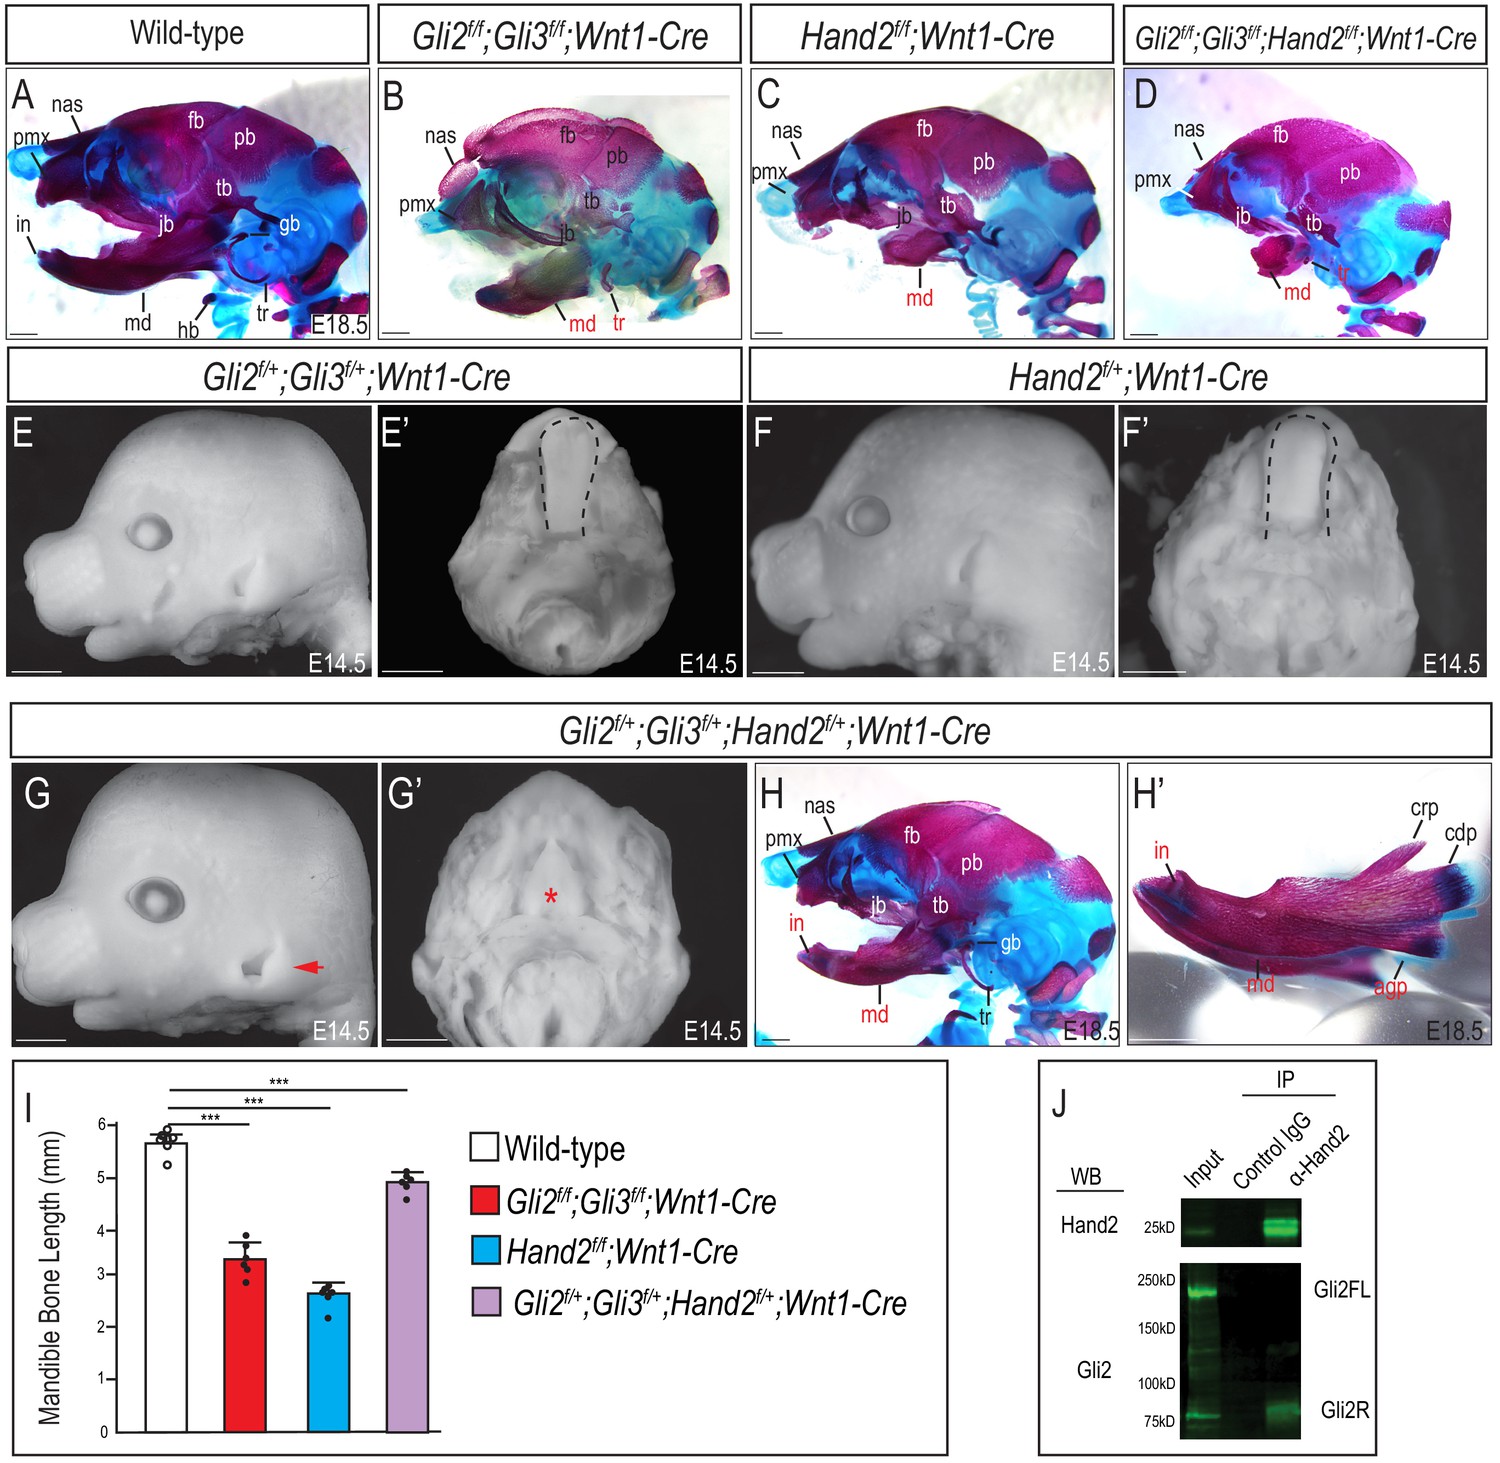
Variations in Gli and Hand2 affect craniofacial development.
(A–D) Lateral cranial view of skeletal stains for whole heads of wild-type, Gli2f/f;Gli3f/f;Wnt1-Cre, Hand2f/f;Wnt1-Cre, and Gli2f/f;Gli3f/f;Hand2f/f;Wnt1-Cre mutants at E18.5. (E, F) Lateral cranial view and (E’, F’) dorsal mandibular view of Gli2f/+;Gli3f/+;Wnt1-Cre and Hand2f/+;Wnt1-Cre embryos at E14.5. Dotted black line indicates presence of tongue in both allelic combinations. (G–G’) Lateral cranial and dorsal mandibular view of Gli2f/+;Gli3f/+;Hand2f/+;Wnt1-Cre mutants at E14.5. Red arrowhead indicates mildly low-set pinnae. Red asterisk highlights observed aglossia. (H–H’) Lateral cranial view of skeletal stain for whole head or mandible of Gli2f/+;Gli3f/+;Hand2f/+;Wnt1-Cre mutants at E18.5. (I) Measurements of triple heterozygotus mutant mandibular bone in relation to other conditional KOs (also shown in Figure 1). Data are expressed as mean + SD with individual data points. ***p<0.001. (J) Co-immunoprecipitation showing interaction between Gli2 and Hand2 within E10.5 MNPs. Abbreviations: agp, angular process; pmx, pre-maxilla; nas, nasal bone; jb, jugal bone; hb, hyoid bone; fb, frontal bone; pb, parietal bone; tb, temporal bone; g, gonial; tr, tympanic ring; hb, hyoid bone. Scale bar: 1 mm.
Figure 2 with 1 supplement
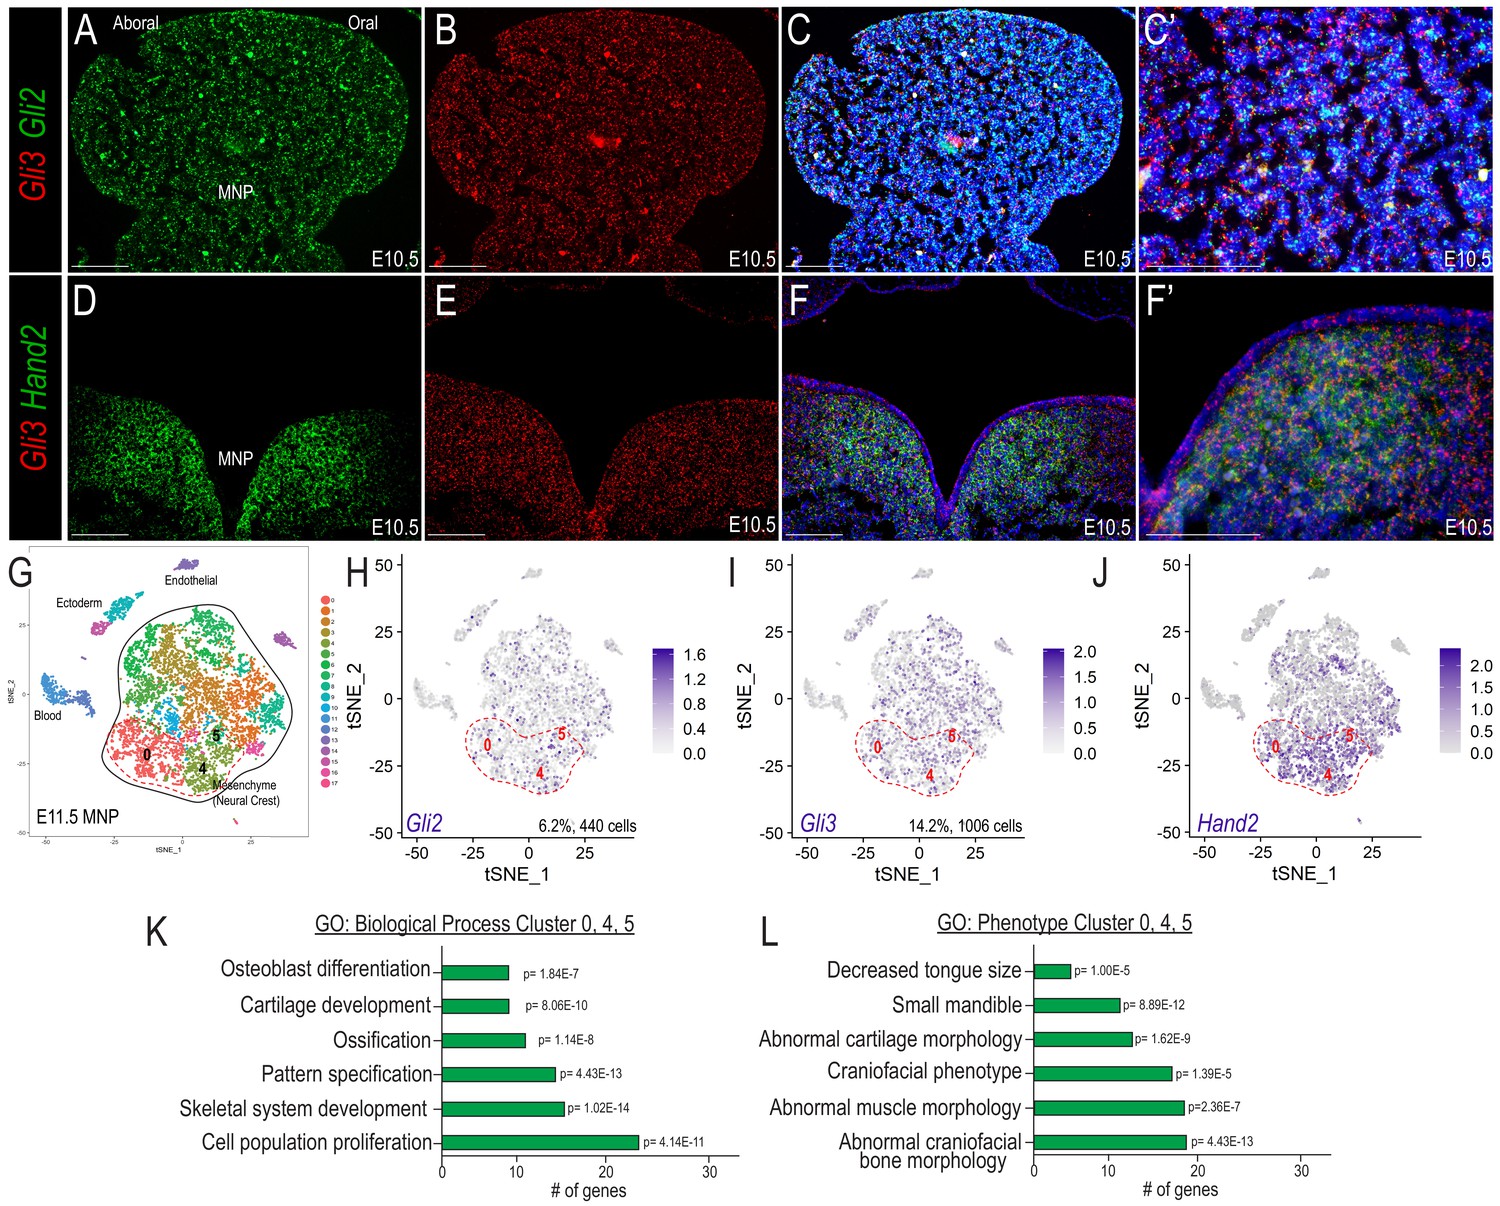
Co-expression of Gli and Hand2 in a subset of skeletal and muscle-promoting NCCs.
(A–C) Expression of Gli2 and Gli3 within the developing MNP as revealed by smFISH on sagittal sections of E10.5 embryos. (C’) Higher magnification of C. (D–F) Expression of Gli3 and Hand2 within the developing MNP as revealed by smFISH on frontal sections of E10.5 embryos. (F’) Higher magnification of F. (G) tSNE plot of single-cell RNA-sequencing of the E11.5 MNP. (H–J) Single-cell expression of Gli2, Gli3, and Hand2 in the E11.5 MNP. Dotted red line indicates Gli+/Hand2+ NCC clusters (0, 4, 5). (K–L) GO-terms associated with marker genes for clusters 0, 4, 5 indicate Gli+/Hand2+ cells may contribute to skeletogenesis and glossal development. Scale bar: 100 µm. See also Figure 2—figure supplement 1.
Figure 2—figure supplement 1
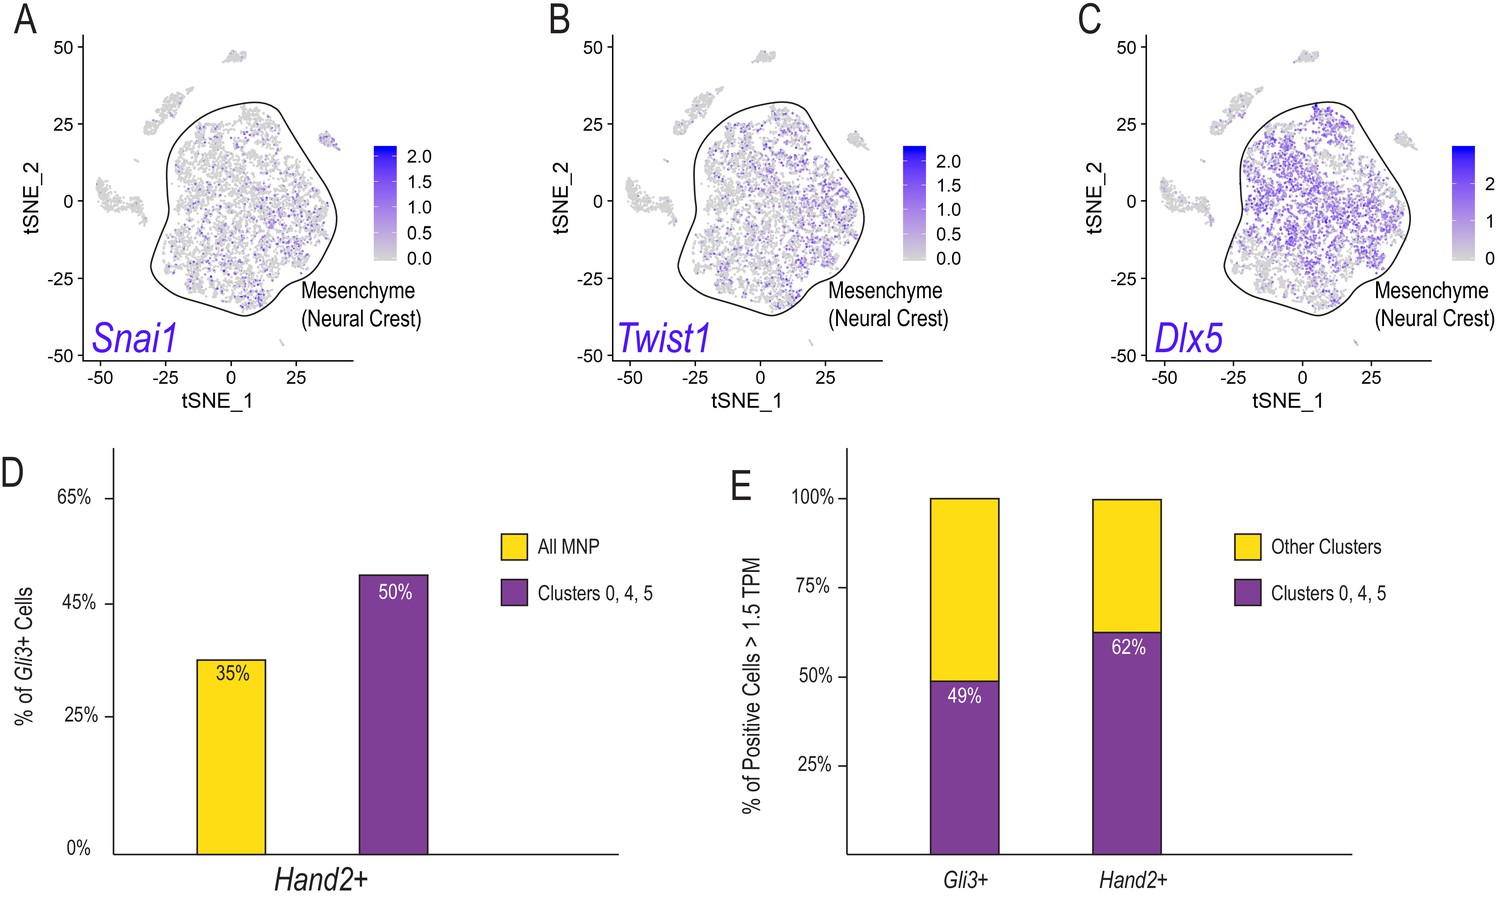
cNCC derivates in the early MNP.
(A–C) Single-cell expression of Snai1, Twist1, and Dlx5 in the E11.5 MNP. Black outline emphasizes the enriched expression of these markers to indicate NCC-derived mesenchyme. (D) Percent of Gli3+ cells that co-express Hand2 in all E11.5 MNP scRNA-seq clusters or clusters 0, 4, and 5. (E) Percent of Gli3+ or Hand2+ cells with greater than 1.5 TPM that reside in E11.5 scRNA-seq clusters 0, 4, and 5, or all other clusters.
Figure 3 with 1 supplement
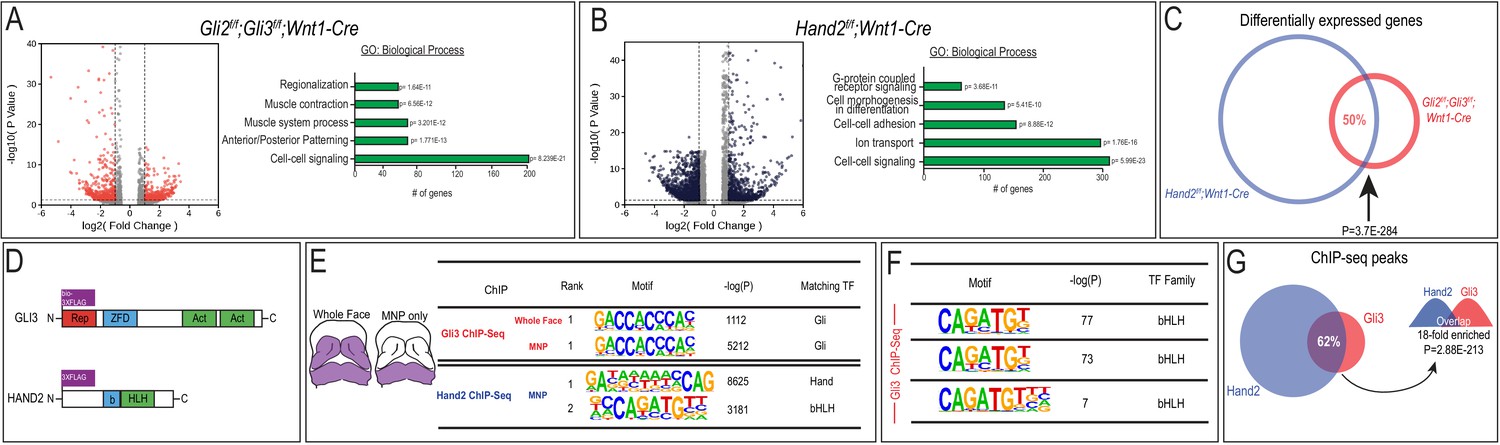
Gli3 and Hand2 occupy CRMs near shared targets in the developing MNP.
(A–B) Volcano plots and GO terms associated with differentially expressed genes from Gli2f/f;Gli3f/f;Wnt1-Cre or Hand2f/f;Wnt1-Cre E10.5 MNPs (fold change >1.5, adjusted p-value<0.05). (C) Venn diagram of shared differentially expressed genes in Gli2f/f;Gli3f/f;Wnt1-Cre and Hand2f/f;Wnt1-Cre MNPs. (D) Endogenously FLAG-tagged mice used for in vivo ChIP-seq. (E) Known motif enrichment of Gli3 and Hand2 ChIP-seq peaks. (F) E-box motif enrichment by HOMER in Gli3 MNP ChIP-seq peaks. (G) Venn diagram comparing overlap between Gli3 and Hand2 ChIP-seq peaks, p-value calculated using RELI.
Figure 3—figure supplement 1
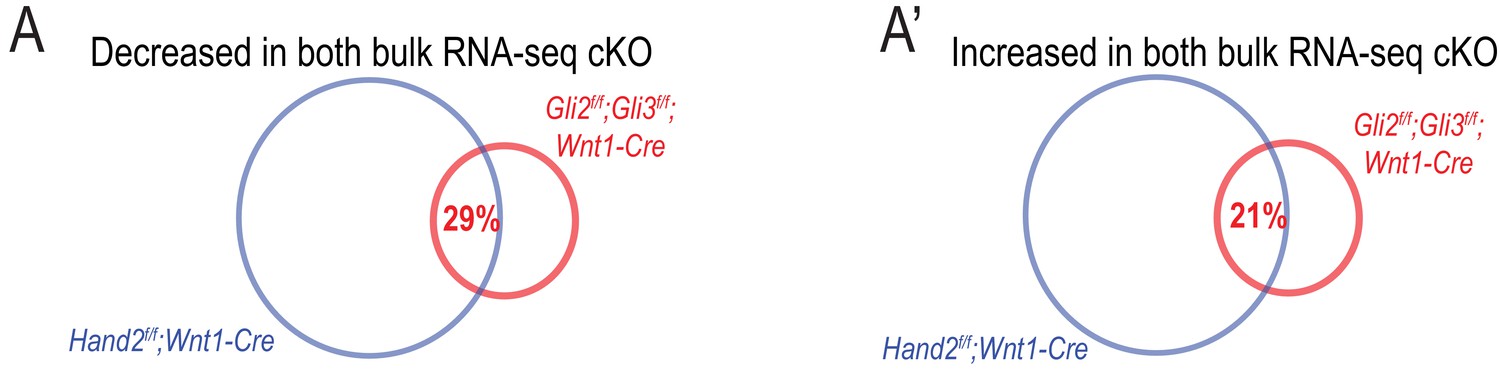
Differential expression in cKO mutants by direction.
(A–A’) Venn diagrams of shared significantly decreased (A) or shared significantly increased (A’) in bulk RNA-seq of Gli2f/f;Gli3f/f;Wnt1-Cre and Hand2f/f;Wnt1-Cre MNPs.
Figure 4 with 1 supplement
Hand2 and Gli3 coordinate glossal and skeletal gene regulatory networks.
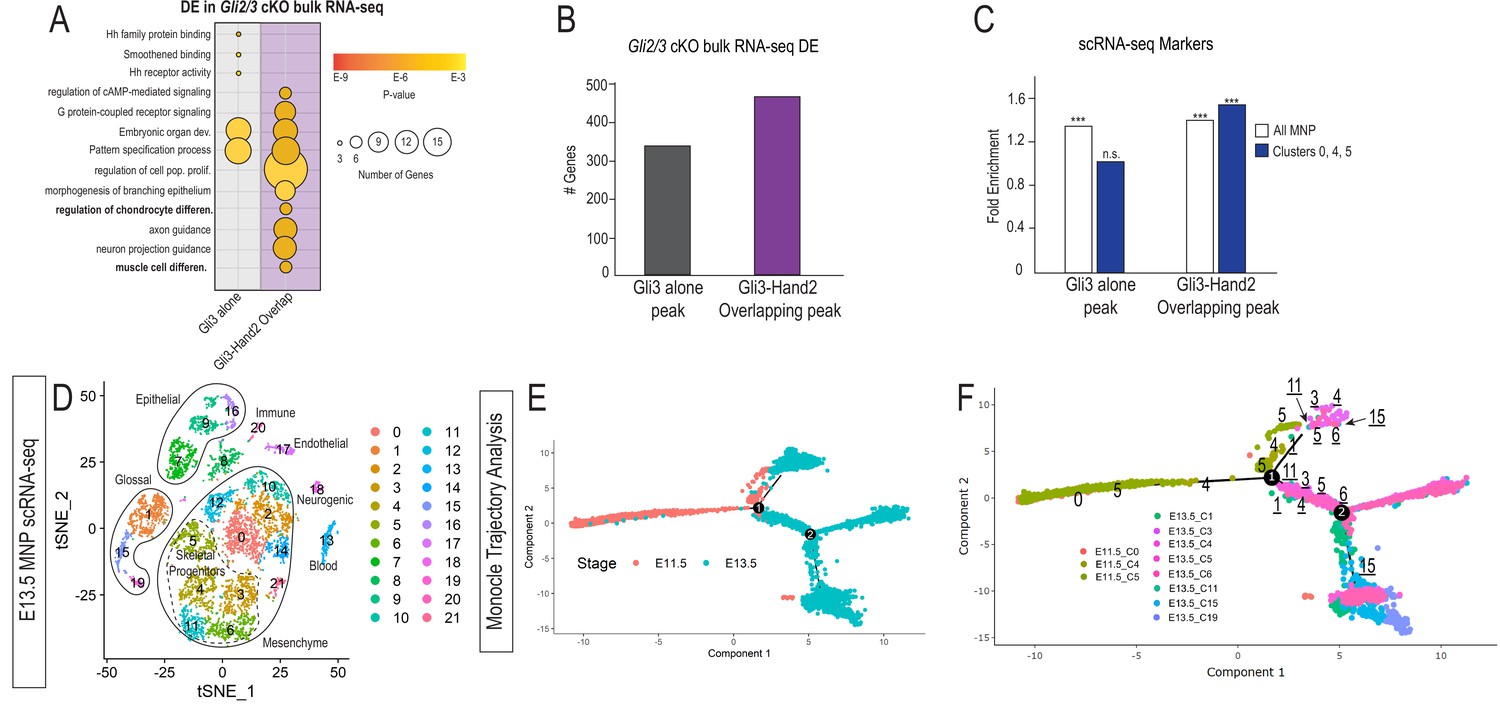
(A) GO-terms associated with significantly decreased differentially expressed (DE) genes from Gli2/3 cKO MNP bulk RNA-seq near Gli3 ChIP-seq peaks without Hand2 (Gli3 alone) or near Gli3-Hand2 overlap peaks. (B) Number of DE genes from Gli2/3 cKO MNP bulk RNA-seq near Gli3 ChIP-seq peaks without Hand2 (Gli3 alone) or near Gli3-Hand2 overlap peaks. (C) Enrichment of all MNP clusters or clusters 0, 4, and 5 from E11.5 scRNA-seq near Gli3 ChIP-seq peaks without Hand2 (Gli3 alone) or near Gli3-Hand2 overlap peaks calculated using RELI. ***p<0.001, n.s. not significant. (D) tSNE plot of single-cell RNA-sequencing from E13.5 wild-type MNP. (E–F) Single-Cell Trajectory analysis plot of integrated E11.5 and E13.5 scRNA-seq MNP samples showed the E13.5 glossal (1,15, 19) and skeletal (3, 4, 5, 6, 11) clusters are likely derived from E11.5 Gli3+/Hand2+ NCC clusters (0,4,5). See also Figure 4—figure supplement 1.
Figure 4—figure supplement 1
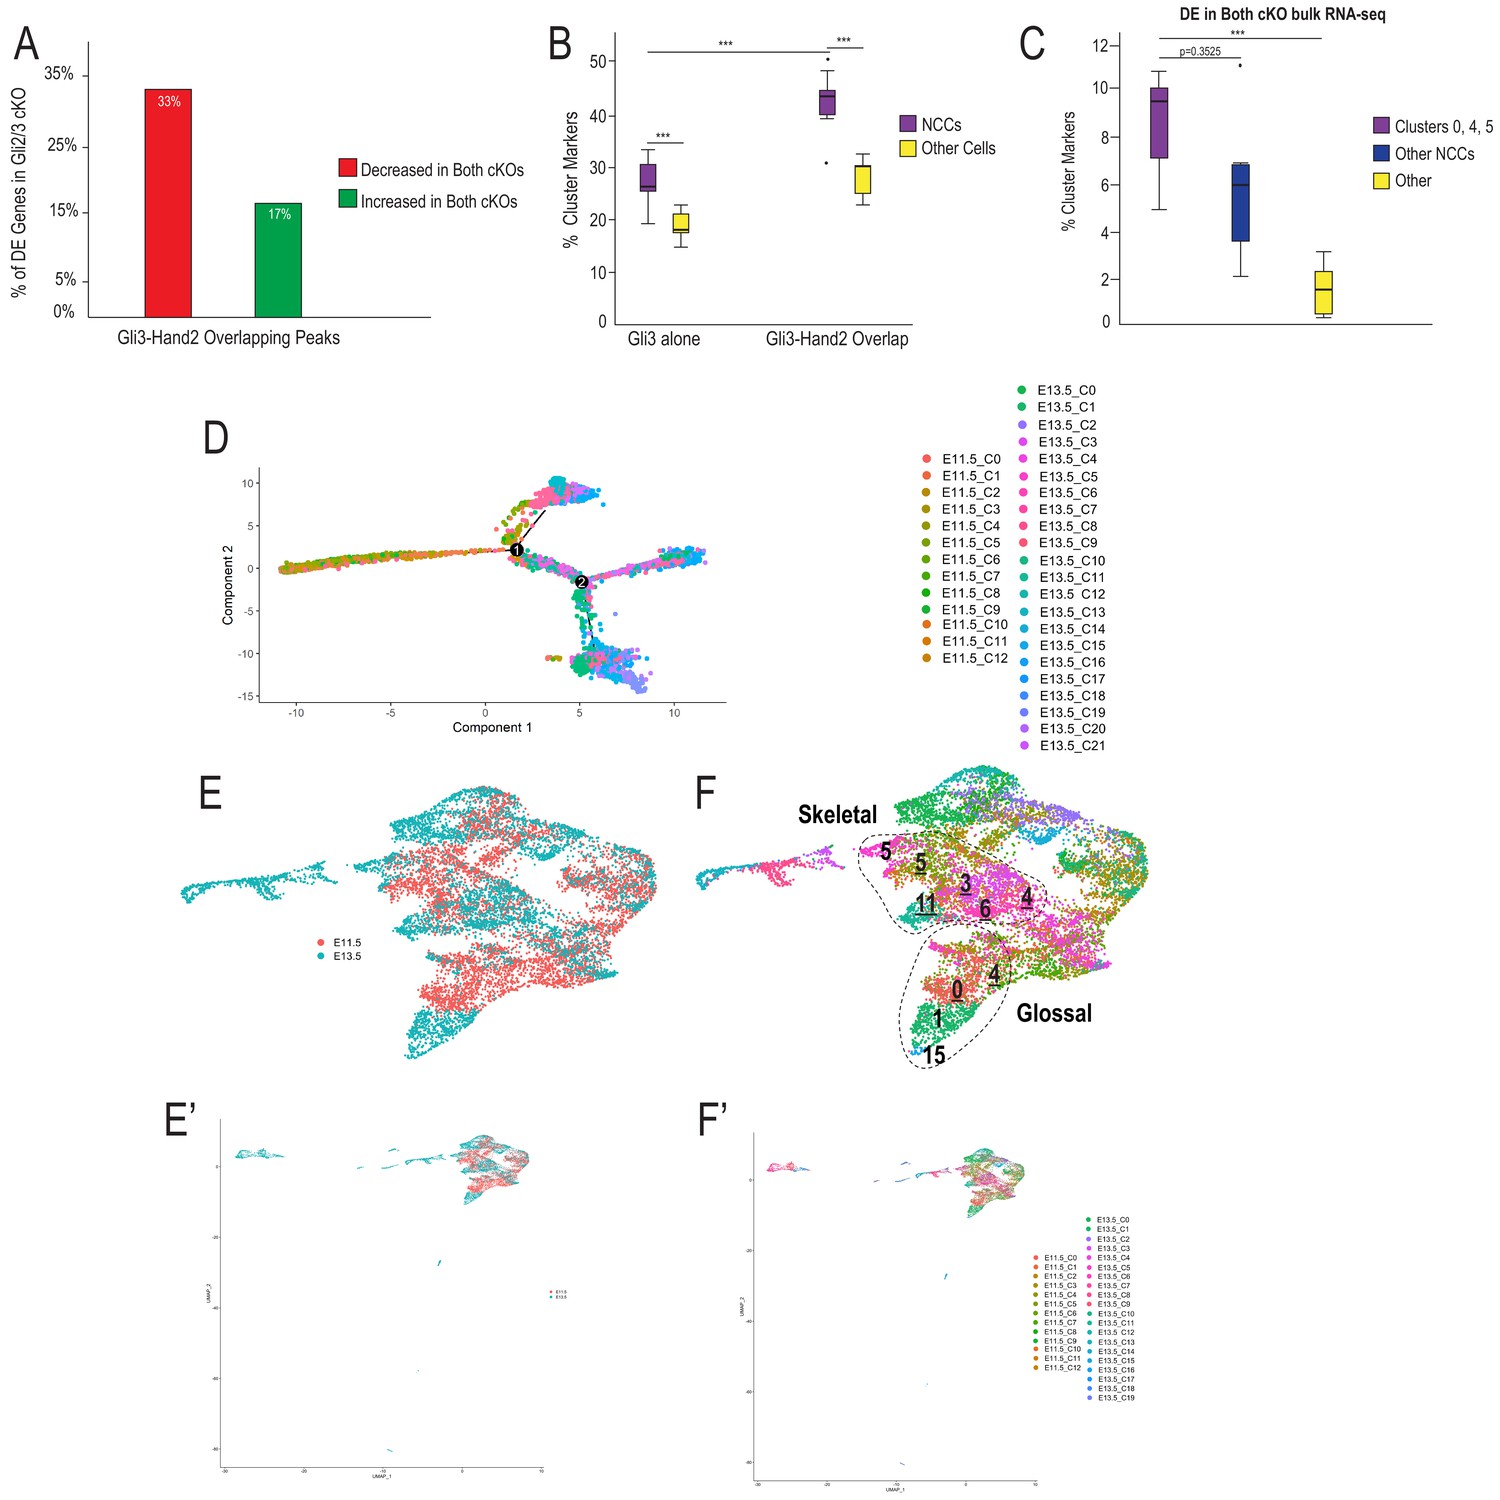
scRNA-seq and Integration analysis support a subset of NCCs contribute to skeletal and glossal cells of the MNP.
(A) A higher percentage of genes near Gli3-Hand2 overlap peaks with significantly decreased expression in the Gli2/3 cKO MNP by bulk RNA-seq is also significantly decreased in the Hand2 cKO compared to genes with significantly increased expression in both cKOs. (B) Box and whisker plots of percent of E11.5 scRNA-seq cluster markers with a Gli3 alone or Gli3-Hand2 peak nearby. (C) Box and whisker plots of percent of E11.5 scRNA-seq cluster markers that are DE in Gli2/3 cKO MNP bulk RNA-seq, *p<0.05, **p<0.01, ***p<0.001. (D) Full single-cell trajectory analysis of E11.5 and E13.5 MNP scRNA-seq data. (E–F) UMAP after Integration analysis and re-clustering of E11.5 and E13.5 MNP scRNA-seq data shows E11.5 cluster 0, 4, and five are most similar to skeletal and glossal E13.5 clusters. (E’–F’) Full UMAP after integration of E11.5 and E13.5 MNP scRNA-seq and re-clustering with visualization of clusters based on timepoint.
Figure 5 with 1 supplement
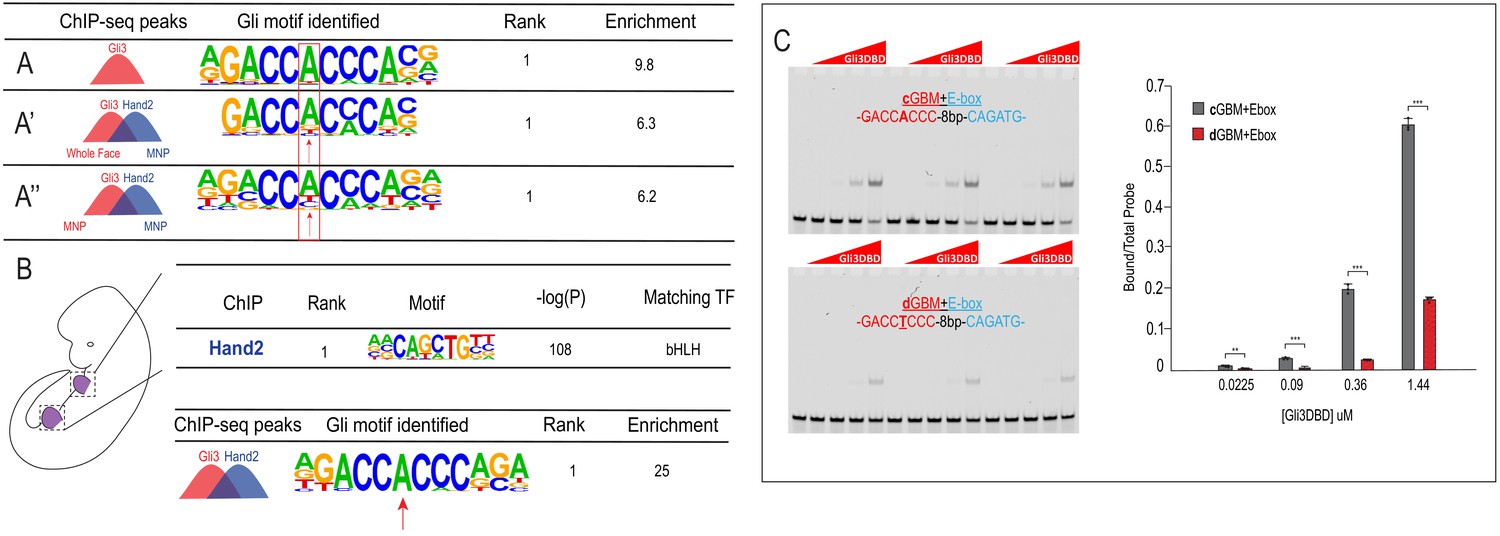
Low-affinity divergent Gli-binding motifs are found near E-boxes.
(A–A’’) De novo motif enrichment for Gli3-only peaks in MNP, Gli3/Hand2 overlapping peaks, comparing (A’) Gli3-whole face peaks to Hand2 MNP peaks or (A’’) Gli3 MNP peaks to Hand2 MNP peaks. (B) (Top) Known motif enrichment of Hand2 peaks from limb buds of endogenously FLAG-tagged mice. (Bottom) De novo motif enrichment of Gli3/Hand2 overlapping peaks, comparing Gli3 peaks from whole face and Hand2 peaks from limb. (C) Electrophoretic mobility shift assay (EMSA) and quantification of affinity showing that the Gli3 DNA-binding domain (Gli3DBD) binds with increased affinity to canonical GBMs (cGBM) relative to divergent GBMs (dGBMs). Results used for quantification are shown in triplicate, *p<0.05, **p<0.01, ***p<0.001. See also Figure 5—figure supplement 1.
-
Figure 5—source data 1
Results from Simple counting method of quantifying instances of GBMs in ChIP-seq data.
- https://cdn.elifesciences.org/articles/56450/elife-56450-fig5-data1-v2.xlsx
Figure 5—figure supplement 1
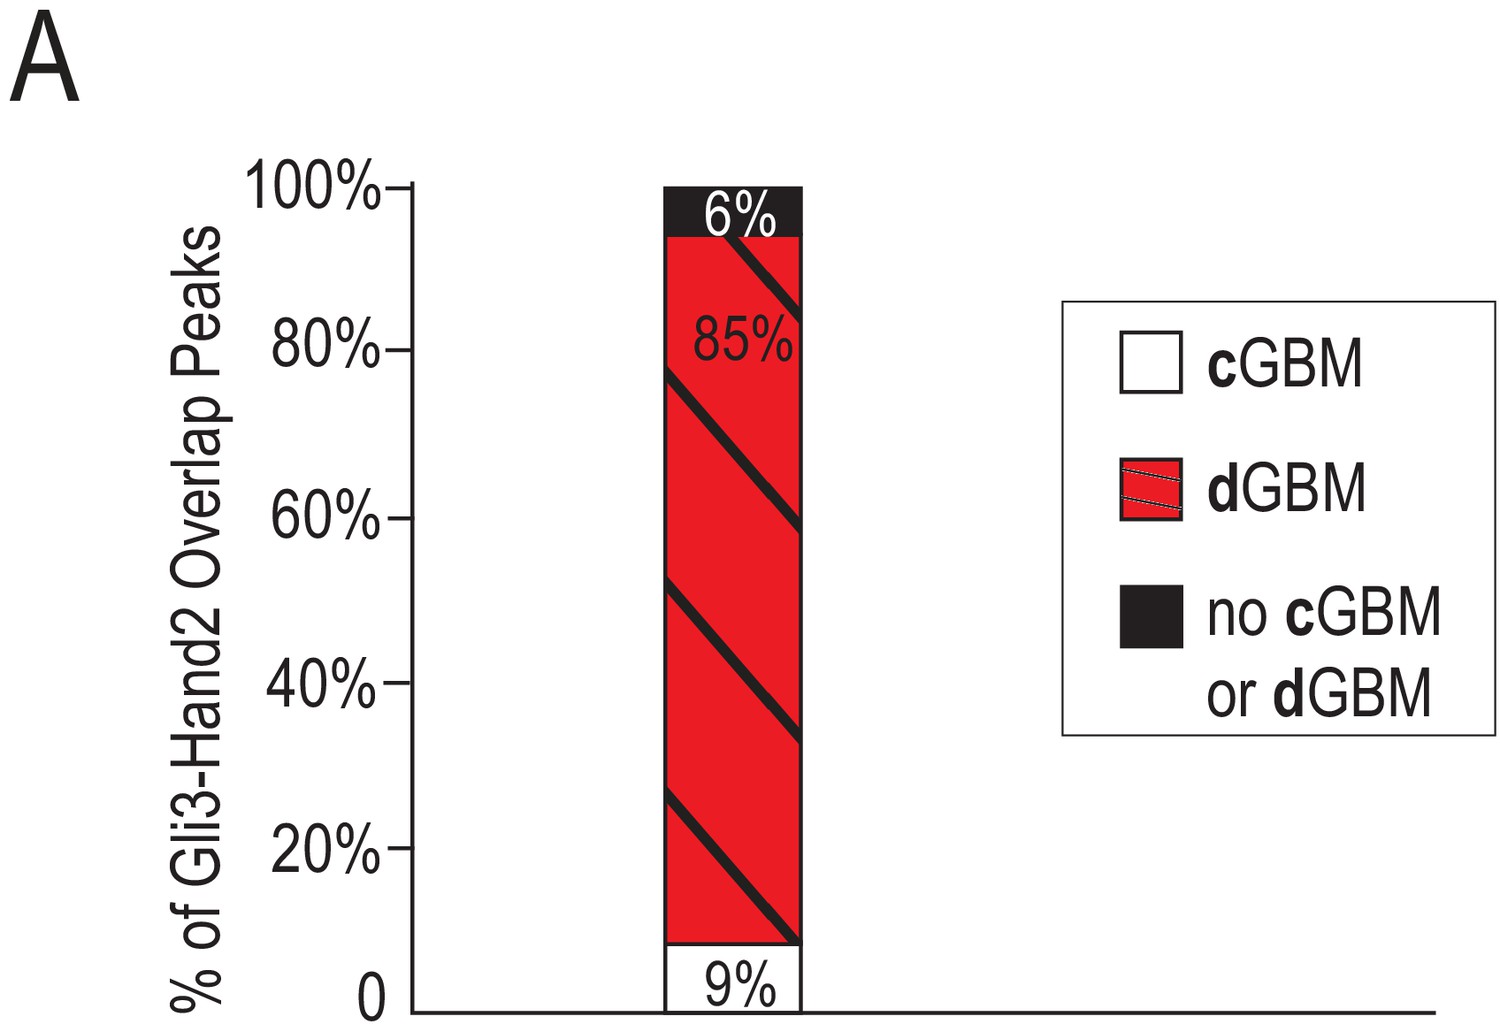
Gli3-Hand2 overlapping ChIP-seq peaks that contain a cGBM or dGBM.
(A) 9% of Gli3-Hand2 overlapping ChIP-seq peaks contained a cGBM, 85% lacked a cGBM but did contain a dGBM, and 6% contained neither a cGBM or a dGBM.
Figure 6
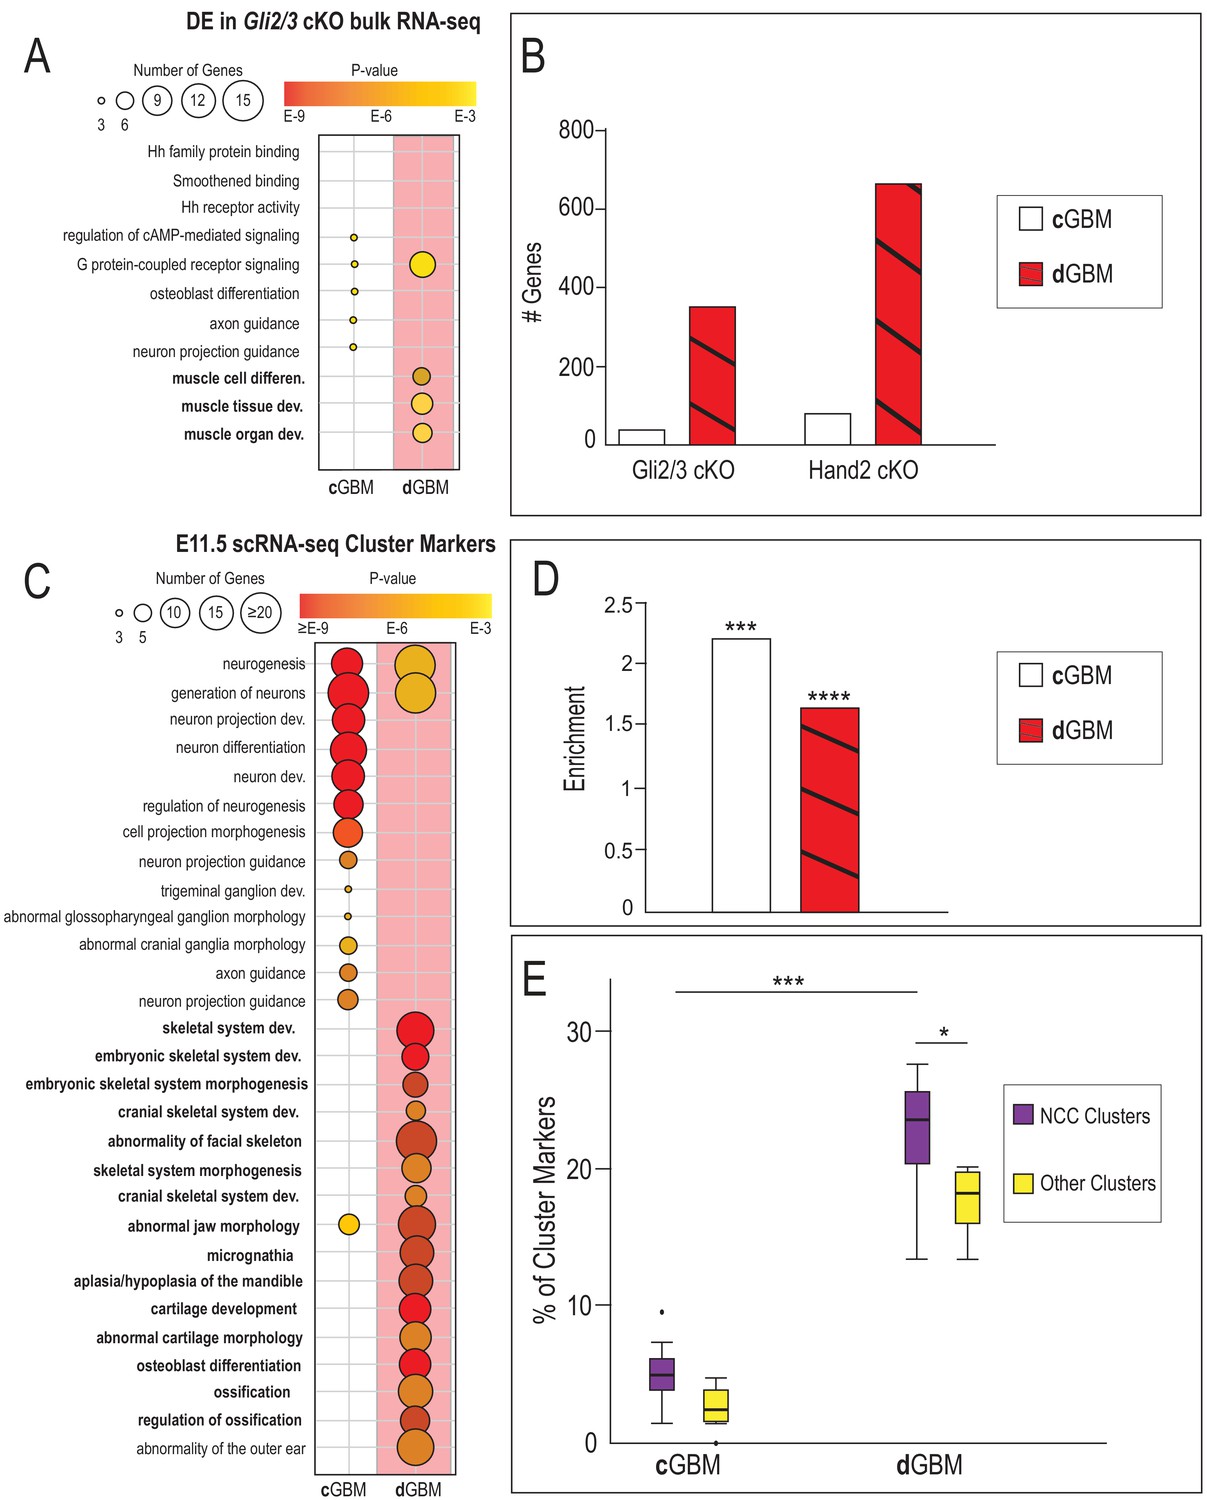
Divergent GBMs direct unique GRNs in neural crest-derived skeletal and glossal progenitors of the MNP.
(A) GO-terms associated with significantly decreased differentially expressed (DE) genes from Gli2/3 cKO MNP bulk RNA-seq near Gli3-Hand2 overlap peaks with a cGBM and with a dGBM. (B) Number of DE genes from Gli2/3 cKO or Hand2 cKO MNP bulk RNA-seq near Gli3-Hand2 overlap peaks with a cGBM and with a dGBM, *p<0.05, **p<0.01, ***p<0.001, ****p<1E-11. (C) GO-terms associated with E11.5 scRNA-seq NCC clusters near near Gli3-Hand2 overlap peaks with a cGBM and with a dGBM reveal distinct mechanistic consequences when a dGBM is present in Gli3-Hand2 overlap peaks. (D) Enrichment of E11.5 scRNA-seq NCC cluster markers in genes near Gli3-Hand2 overlap peaks with a cGBM and with a dGBM using RELI. (E) Box and whisker plots showing percent of E11.5 scRNA-seq cluster markers near Gli3-Hand2 overlap peaks with a cGBM and with a dGBM. Significantly higher overlap in NCC cluster markers is seen near Gli3-Hand2 overlap peaks with a dGBM compared to those with a cGBM.
Figure 7 with 1 supplement

Hand2 correlates with non-canonical Gli-responsive expression patterns.
(A–D) Overview of MNP-specific regulatory input to the Foxd1, Plagl1, Myh6, and Maf locus. cGBMs (black line) and dGBMs (red lines) are indicated below the signal tracks for Gli3 (red) and Hand2 (blue) ChIP-seq and ATAC-seq (green). PP1 = promoter proximal 1, PP2 = promoter proximal 2. (E–H) Single-cell expression of Foxd1, Plagl1, Myh6, and Maf in the E11.5 MNP. Dotted red line indicates Gli+/Hand2+ NCC clusters (0, 4, 5). (I–L) E13.5 scRNA-seq expression in Gli3/Hand2+ -derived clusters of Gli3 and Hand2 targets involved with MNP patterning. (M–S) Single-cell Trajectory analysis plot of integrated E11.5 and E13.5 scRNA-seq MNP samples highlighting E11.5 clusters 0, 4, and 5 likely give rise to the E13.5 glossal and skeletal clusters (T–U) Expression of Shh, Ptch1, and Gli3 as revealed by smFISH in sagittal sections of E10.5 MNPs. Dotted yellow line indicates highest Shh-responsive area marked by Ptch1. (V–Y) smFISH expression of Gli3 and Hand2 targets involved with MNP patterning. Scale bar: 100 µm. See also Figure 7—figure supplement 1.
Figure 7—figure supplement 1
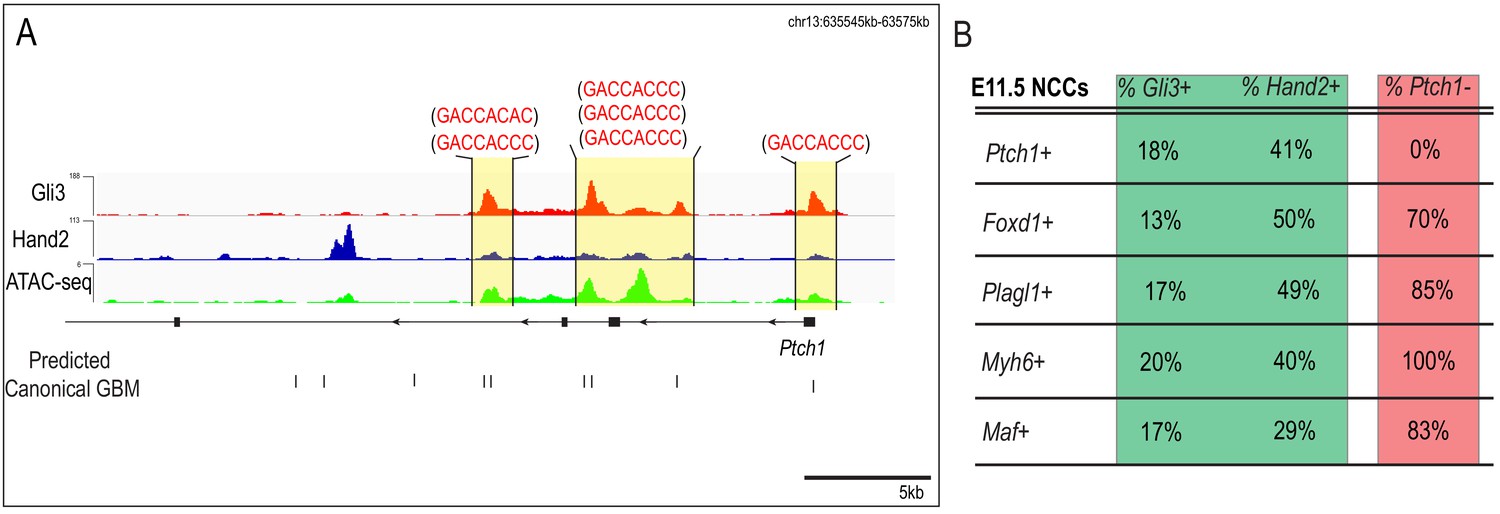
Ptch1 is activated in response to high Shh through canonical GBMs.
(A) MNP regulatory landscape for Ptch1. Predicated cGBMs are shown as black tickmarks below the tracks and the associated motif is shown above. (B) Table showing percent of Foxd1+, Plagl1+, Myh6+, or Maf+ NCCs from scRNA-seq of the E11.5 MNP are also Gli3+, Hand2+, or Ptch1-.
Figure 8 with 2 supplements

Gli3 and Hand2 synergistically activate low-affinity dGBMs.
(A–C) Luciferase reporter activity of the endogenous Foxd1 putative regulatory region fragments PP1, PP2, and +37086 after transfection with Gli3, Hand2, or both in O9-1 cells. (D) Luciferase reporter activity of synthetic constructs containing a cGBM and E-box (solid bars) or dGBM and E-box (hatched bars) in response to transfection of Gli3, Hand2, or both in O9-1 cells. Data are expressed as mean + SD with biological replicates shown as dots. *p<0.05, **p<0.01, ***p<0.001. See also Figure 8—figure supplements 1 and 2.
-
Figure 8—source data 1
Pooled ChIP-seq replicate peak calls.
- https://cdn.elifesciences.org/articles/56450/elife-56450-fig8-data1-v2.xlsx
Figure 8—figure supplement 1
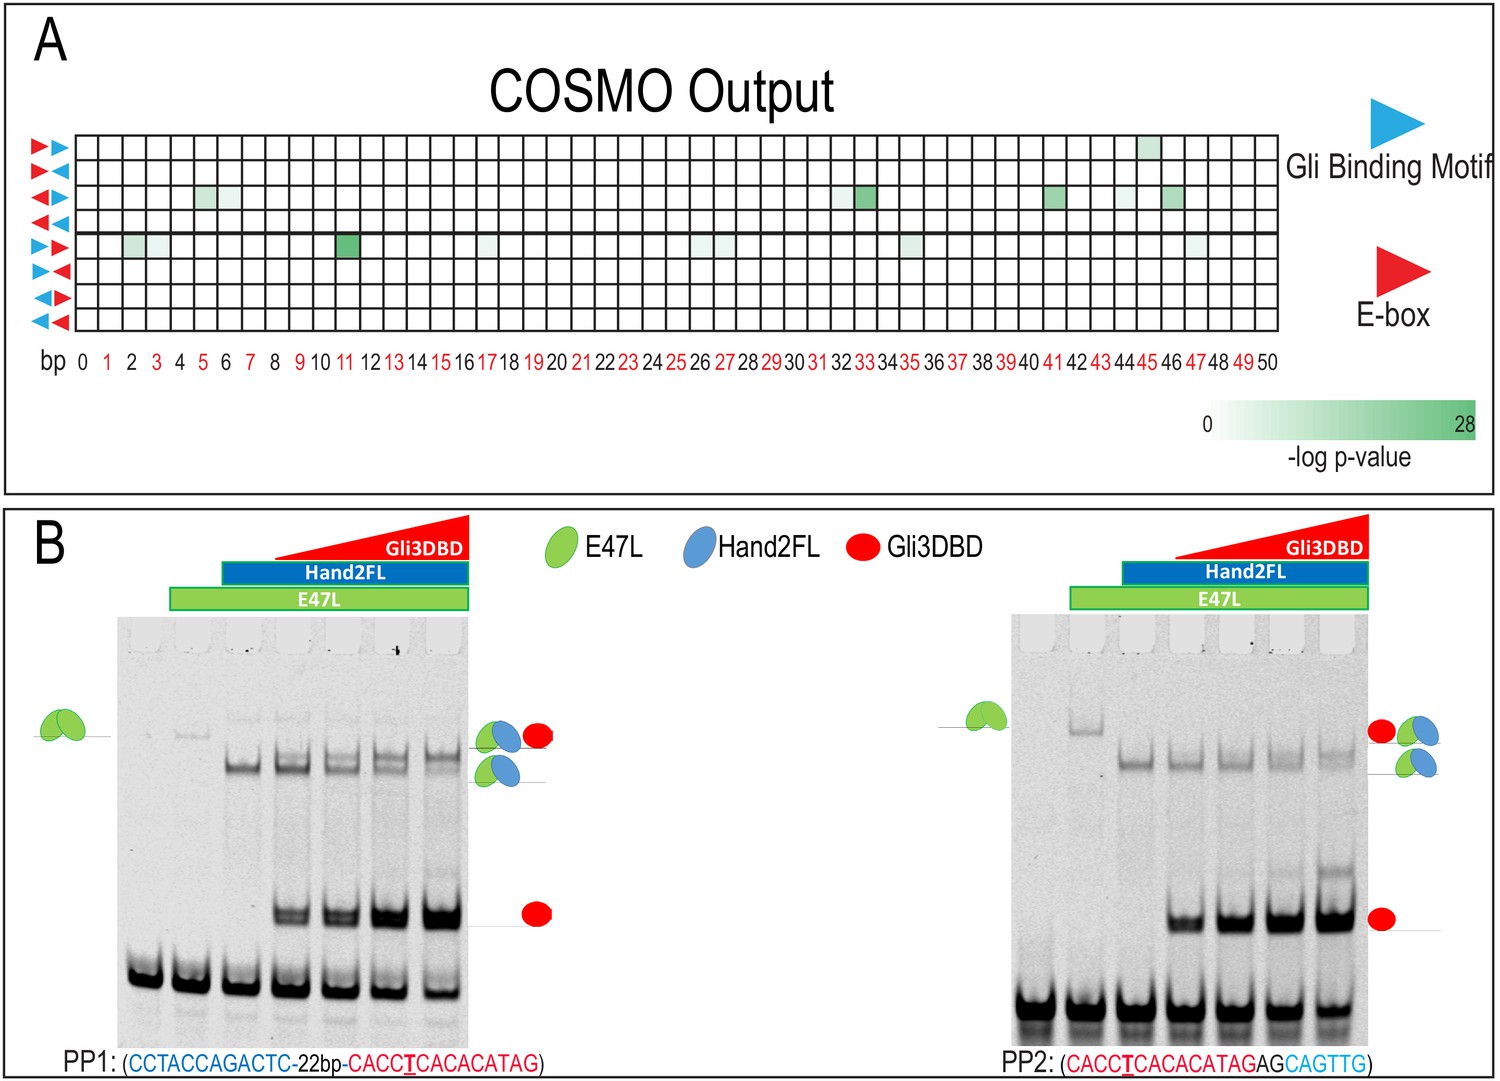
No observed enriched spacing or orientation of GBM and Ebox.
(A) Heatmap showing p-values associated with COSMO outputs for spacing and orientation of TF binding site enrichment. Number of base pairs separating motifs increase from left to right, orientations and directionality of motifs tested are schematized on the left. No single orientation or spacing was conserved for GBMs and E-boxes within Gli3 and Hand2 overlapping ChIP-seq peaks in the MNP. (B) EMSA for PP1 and PP2 using increasing concentrations of Gli3DBD, Hand2 full-length (FL), and E47L/Tcf3, the Hand2 heterodimerization partner. Increasing concentrations of Gli3DBD results in increased binding of a supershift complex. The observed complexes are illustrated for clarity.
Figure 8—figure supplement 2
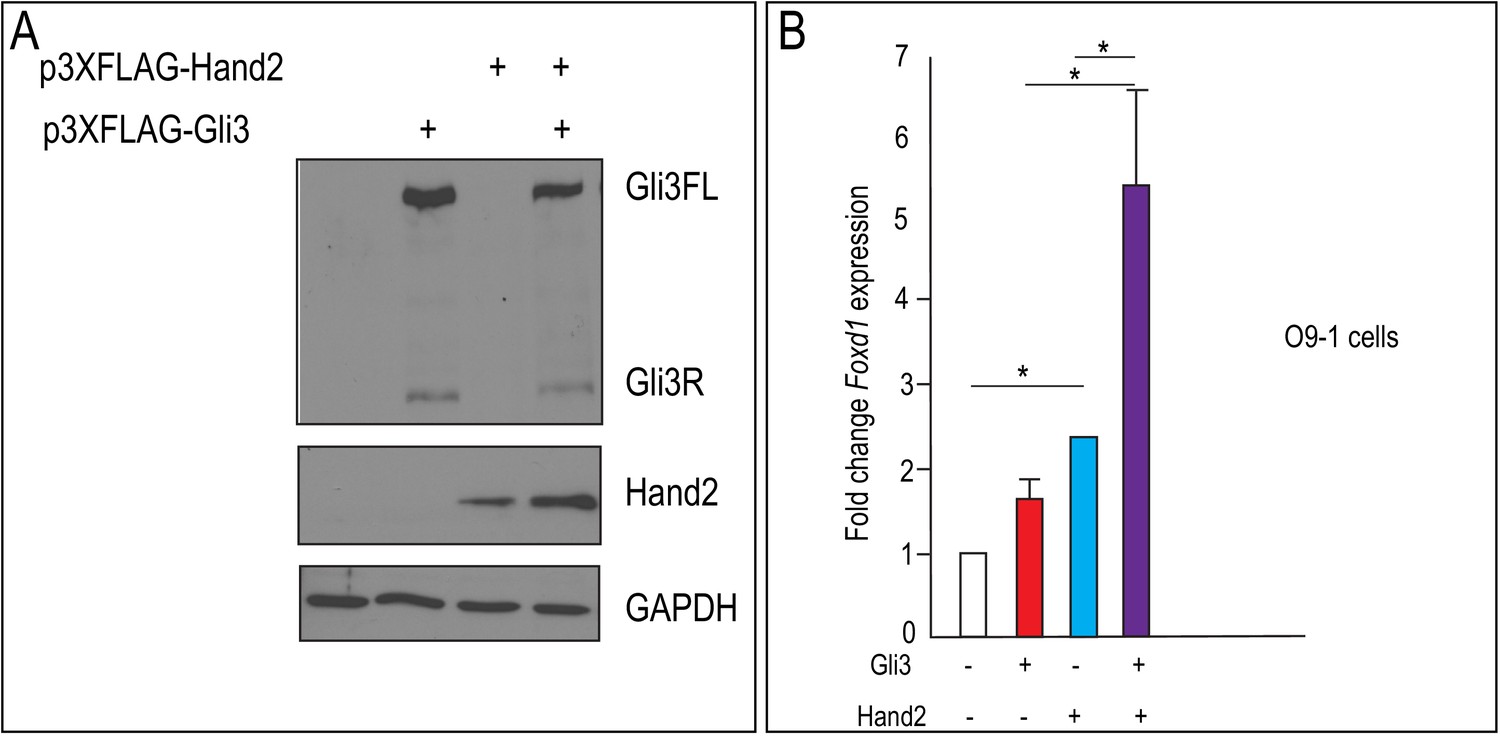
Gli3 and Hand2 co-expression synergistically activates Foxd1 in vitro.
(A) Western blot using α-FLAG antibody to detect protein expression from plasmids p3XFLAG-Hand2 and p3XFLAG-Gli3, following transfection into mouse embryonic fibroblasts. (B) RT-qPCR fold change of Foxd1 after transfection with Gli3, Hand2, or both in O9-1 cells. Data are expressed as mean + SD with biological replicates indicated as dots. *p<0.05, **p<0.01, ***p<0.001.
-
Figure 8—figure supplement 2—source data 1
Results from COSMO algorithm.
- https://cdn.elifesciences.org/articles/56450/elife-56450-fig8-figsupp2-data1-v2.xlsx
Figure 9 with 1 supplement
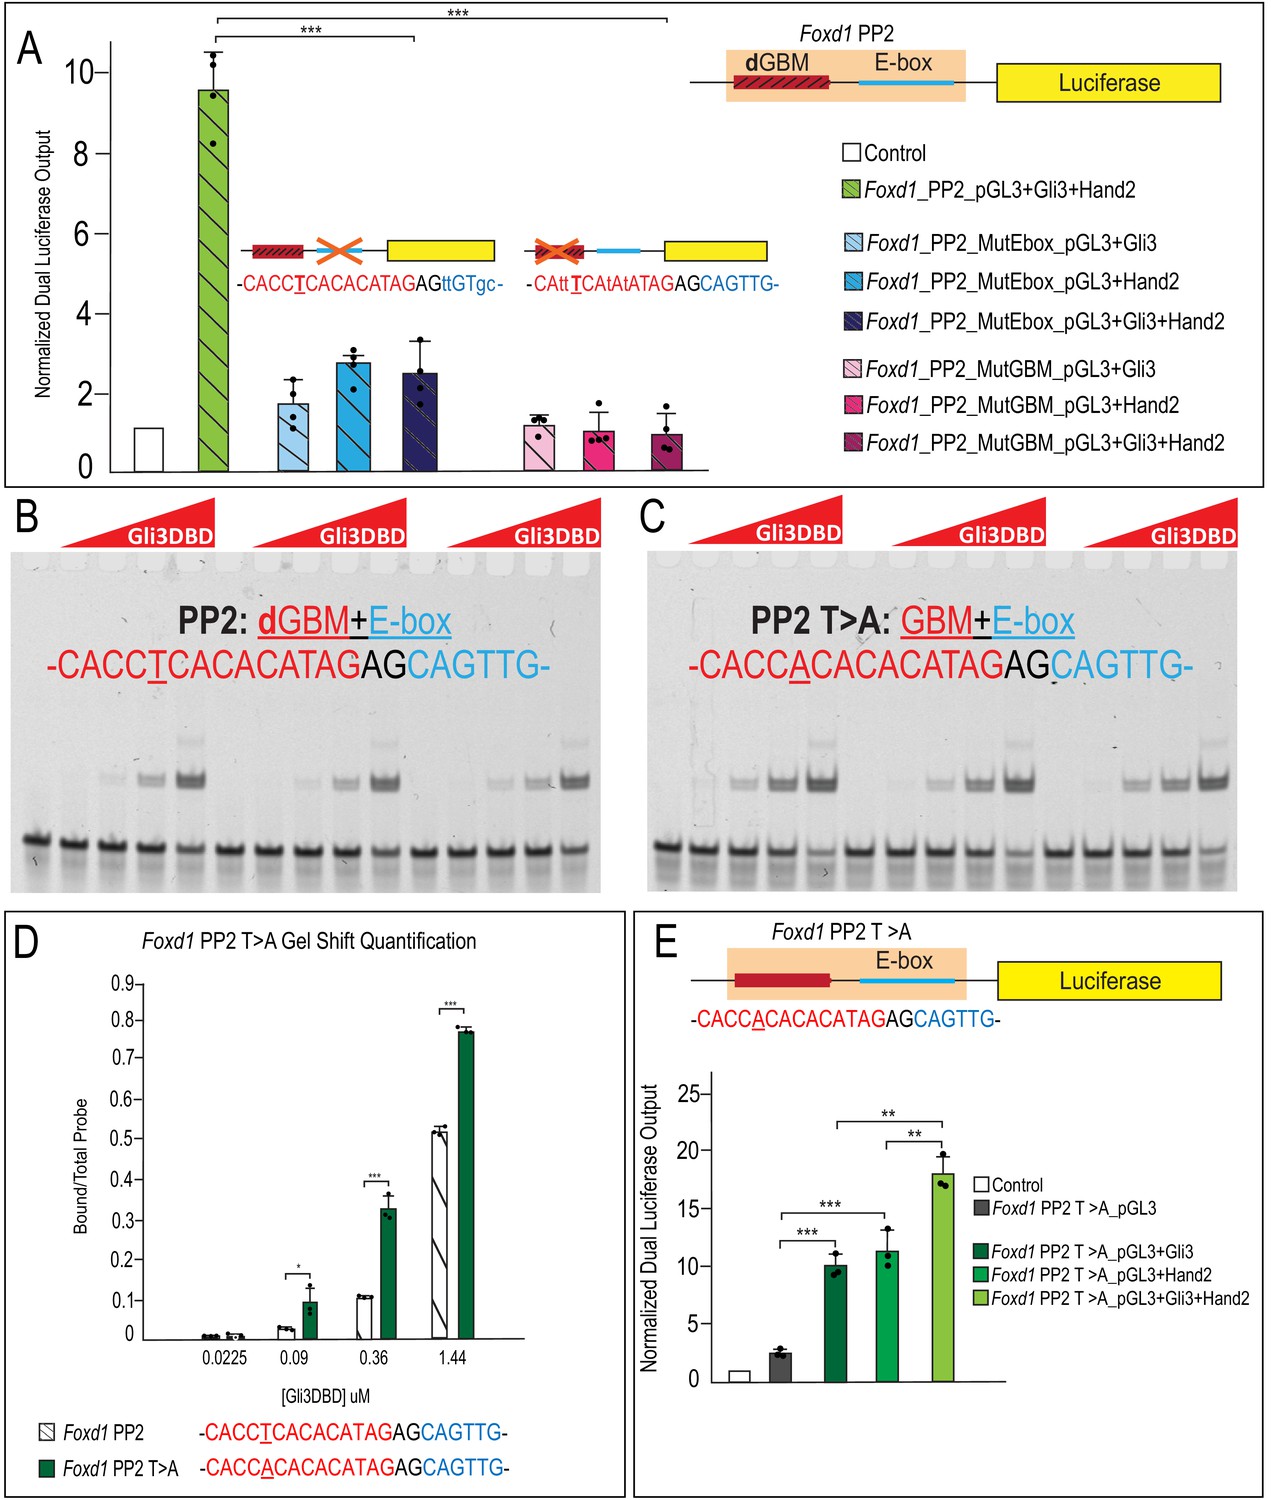
Occupancy of low-affinity dGBM and E-box are required for synergism.
(A) Luciferase reporter activity of mutant GBM or E-box motifs from Foxd1 PP2 showing mutation of E-box or GBM abolishes synergistic activation. (B–C) EMSA for Gli3DBD binding affinity of (C) endogenous Foxd1 PP2 or (D) T > A mutant Foxd1 PP2. (D) Quantification of (B) and (C) showing increased Gli3DBD binding affinity of endogenous Foxd1 PP2 (white hatched) compared to T > A mutant Foxd1 PP2 (green). (E) Increased luciferase reporter activity when T > A change is made within Foxd1 PP2. Data are expressed as mean + SD. Luciferase data have biologic replicates shown as dots. *p<0.05, **p<0.01, ***p<0.001. See also Figure 9—figure supplement 1.
-
Figure 9—source data 1
GO terms associated with Differentially Expressed Genes.
- https://cdn.elifesciences.org/articles/56450/elife-56450-fig9-data1-v2.xlsx
Figure 9—figure supplement 1

Mutations of dGBM or E-box of Foxd1 +37086 putative enhancer abolish Gli3-Hand2 synergism.
(A) Luciferase reporter activity of mutant GBM or E-box motifs from Foxd1 +37086 showing mutation of E-box or GBM abolishes synergistic activation. Data are expressed as mean + SD with biological replicates indicated as dots. *p<0.05, **p<0.01, ***p<0.001.
-
Figure 9—figure supplement 1—source data 1
hared ChIP-seq peaks between replicates.
- https://cdn.elifesciences.org/articles/56450/elife-56450-fig9-figsupp1-data1-v2.xlsx
Figure 10
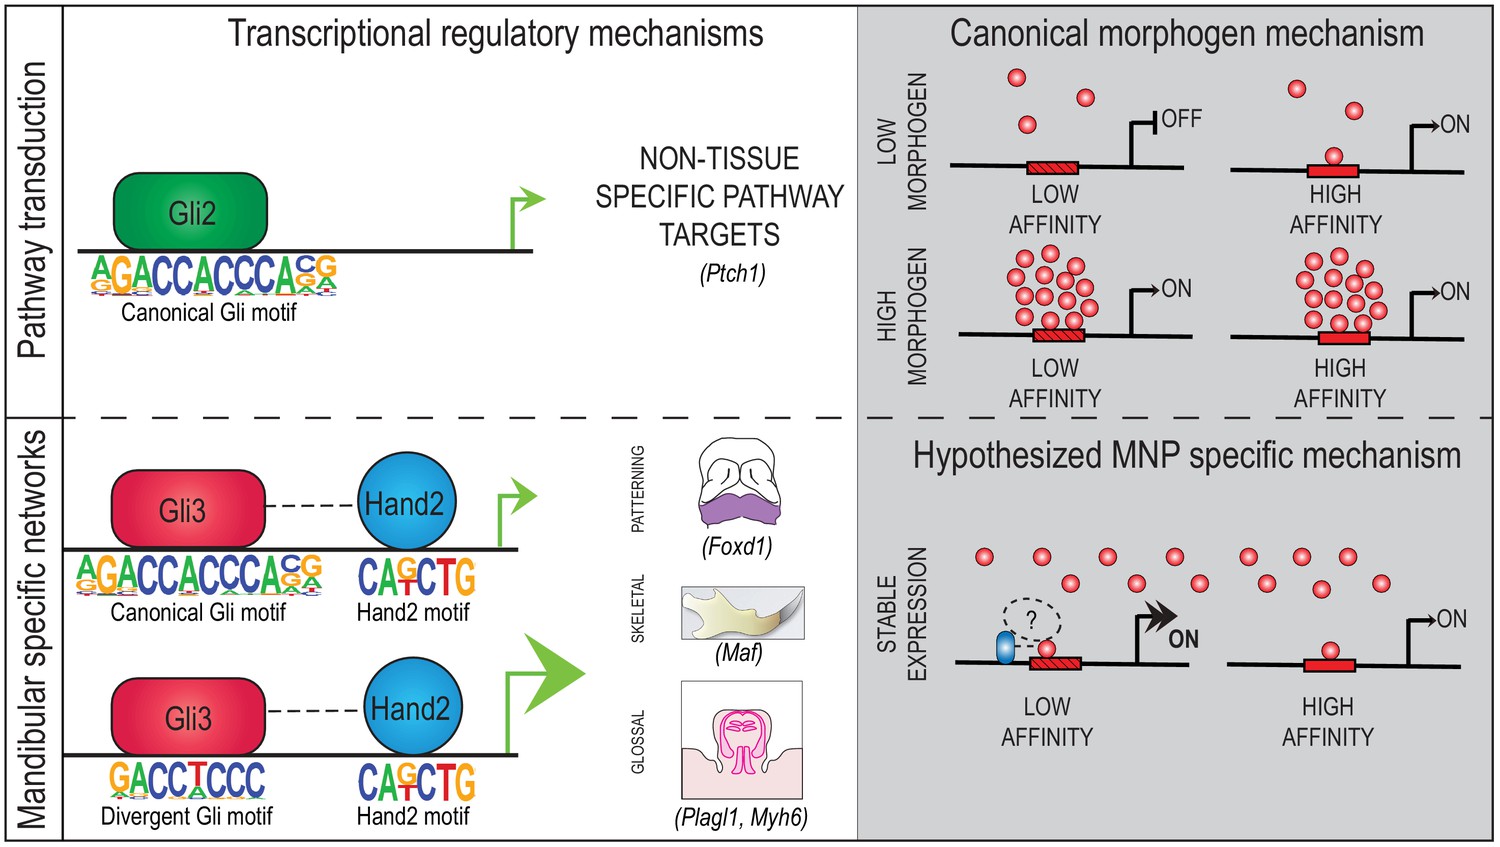
Model of Gli3-Hand2 cooperation in the developing MNP.
Model of Gli3-Hand2-specific cooperation at low-affinity dGBMs drives patterning, skeletal and glossal GRN in regions of the MNP outside of the highest Shh ligand concentration.
Tables
Key resources table
| Reagent type (species) or resource | Designation | Source or reference | Identifiers | Additional information |
|---|---|---|---|---|
| Antibody | Anti-Gli3 (Goat polyclonal) | R and D Systems | Cat.#AF3690; RRID:AB_2232499 | (1:1000) |
| Antibody | Anti-dHand M-19 (Goat polyclonal) | Santa Cruz Biotechnology | Cat.#Sc-9409; RRID:AB_2115995 | (1:1000) |
| Antibody | Anti-Flag M2 (Mouse monoclonal) | Sigma-Aldrich | Cat.#F1804; RRID:AB_262044 | (1:1000) |
| Cell line (M. musculus) | O9-1 cells | Ishii et al., 2012 | Gift from R. Lipinski Lab | |
| Cell line (E. coli) | BL21 cells | Promega | Cat.#L1195 | |
| Peptide, recombinant protein | E47L/Tcf3 | Purified protein, contact B. Gebelein | NP_001157619.1 | peptide, recombinant protein |
| Peptide, recombinant protein | Gli3DBD | This paper | NP_032156.2 (full protein) | Purified protein, inquiries should be addressed to B. Gebelein |
| Peptide, recombinant protein | Hand2 | This paper | NP_034532.3 | Purified protein, inquiries should be addressed to B. Gebelein |
| Peptide, recombinant protein | Human FGF basic | R and D Systems | Cat.# 233-FB-025 | |
| Peptide, recombinant protein | Leukemia Inhibitory Factor (LIF) | Millipore | Cat.# ESG1106 | |
| Commercial assay or kit | Dual Luciferase Reporter Assay System | Promega | Cat.#E1910 | |
| Genetic reagent (M. musculus) | Gli2flox | PMID:16571625 | JAX stock # 007926; RRID:IMSR_JAX:007926 | Gift from A. Joyner, Memorial-Sloan-Kettering Cancer Center |
| Genetic reagent (M. musculus) | Gli3flox | PMID:18480159 | JAX stock # 008873; RRID:IMSR_JAX:008873 | |
| Genetic reagent (M. musculus) | Hand2flox | PMID:17075884 | JAX stock # 027727; RRID:IMSR_JAX:027727 | |
| Genetic reagent (M. musculus) | Wnt1-Cre: H2az2Tg(Wnt1-cre)11Rth | PMID:9843687 | MGI:2386570; RRID:IMSR_JAX:003829 | Gift from R. Stottmann |
| Genetic reagent (M. musculus) | Gli3tm1.1Amc/Grsr (3XFLAGbio) | PMID:24990743; 27146892 | JAX stock #026135 | Generated by K.A. Peterson |
| Genetic reagent (M. musculus) | Hand23xFlag | PMID:25453830 | Generated by R. Zeller | |
| Recombinant DNA reagent | pGL3-promoter (plasmid) | Promega | Cat.#E1761 | Luciferase reporter |
| Recombinant DNA reagent | p3XFLAG-Gli3 (plasmid) | This paper | Full-length Mouse Gli3 cloned into p3XFlag backbone. Inquiries should be addressed to S. Brugmann | |
| Recombinant DNA reagent | p3XFLAG-Hand2 (plasmid) | This paper | Full-length Mouse Hand2 cloned into p3XFlag backbone. Inquiries should be addressed to S. Brugmann | |
| Sequence-based reagent | Gli2_Flox_F | This paper | PCR primers | AGG TCC TCT TAT TGT CAG GC; Inquiries should be addressed to S. Brugmann |
| Sequence-based reagent | Gli2_Flox_R | This paper | PCR primers | GAG ACT CCA AGG TAC TTA GC; Inquiries should be addressed to S. Brugmann |
| Sequence-based reagent | Gli3_Flox_F | This paper | PCR primers | GTC TGT AAC CAG ACG GCA CT; Inquiries should be addressed to S. Brugmann |
| Sequence-based reagent | Gli3_Flox_R | This paper | PCR primers | GAG AAT GTG TGA CTC CAT GC; Inquiries should be addressed to S. Brugmann |
| Sequence-based reagent | Hand2_Flox_F | JAX | PCR primers | ACT TGC TGA CTG GGT CCT TG; |
| Sequence-based reagent | Hand2_Flox_R | JAX | PCR primers | CTC GGC CTA GAG GAC ACT GA |
| Sequence-based reagent | Cre_F | This paper | PCR primers | GTCCCATTTA CTGACCGTAC ACC; Inquiries should be addressed to S. Brugmann |
| Sequence-based reagent | Cre_R | This paper | PCR primers | GTTATTCGGA TCATCAGCTA CACC; Inquiries should be addressed to S. Brugmann |
| Sequence-based reagent | 5’IREdye-700 labeled oligo | IDT | For EMSA assays | N/A |
| Sequence-based reagent | RNAscope probe- Mm Gli3 | Advanced Cell Diagnostics | Cat.#445511 | |
| Sequence-based reagent | RNAscope probe- Mm Hand2 | Advanced Cell Diagnostics | Cat.#499821 | |
| Sequence-based reagent | RNAscope probe- Mm Shh | Advanced Cell Diagnostics | Cat.#314361 | |
| Sequence-based reagent | RNAscope probe- Mm Ptch1 | Advanced Cell Diagnostics | Cat.#402811 | |
| Sequence-based reagent | RNAscope probe- Mm Foxd1 | Advanced Cell Diagnostics | Cat.#495501-C3 | |
| Sequence-based reagent | RNAscope probe- Mm Plagl1 | Advanced Cell Diagnostics | Cat.#462941 | |
| Sequence-based reagent | RNAscope probe- Mm Myh6 | Advanced Cell Diagnostics | Cat.#506251 | |
| Sequence-based reagent | RNAscope probe- Mm Gli2 | Advanced Cell Diagnostics | Cat.#405771 | |
| Sequence-based reagent | RNAscope probe- Mm Maf | Advanced Cell Diagnostics | Cat.#412951 | |
| Software, algorithm | Strand NGS | https://www.strand-ngs.com/ | ||
| Software, algorithm | HOMER | PMID:20513432 | RRID:SCR_010881 | |
| Software, algorithm | RELI | PMID:29662164 | ||
| Software, algorithm | COSMO | PMID:25905672 | ||
| Other | Cis-BP | PMID:25215497 | RRID:SCR_017236 | Transcription factor motif library http://cisbp.ccbr.utoronto.ca/index.php |
Additional files
-
Supplementary file 1
Differences in gene expression levels from conditional KO bulk RNA-seq.
- https://cdn.elifesciences.org/articles/56450/elife-56450-supp1-v2.docx
-
Supplementary file 2
Results from Simple counting method of quantifying instances of GBMs in ChIP-seq data.
- https://cdn.elifesciences.org/articles/56450/elife-56450-supp2-v2.xlsx
-
Supplementary file 3
Results from COSMO algorithm.
Number of instances of GBM and E-box spacing and orientation varieties in Gli3-Hand2 overlap peaks.
- https://cdn.elifesciences.org/articles/56450/elife-56450-supp3-v2.xlsx
-
Supplementary file 4
Pooled ChIP-seq replicate peak calls.
- https://cdn.elifesciences.org/articles/56450/elife-56450-supp4-v2.xlsx
-
Supplementary file 5
Shared ChIP-seq peaks between replicates.
- https://cdn.elifesciences.org/articles/56450/elife-56450-supp5-v2.xlsx
-
Supplementary file 6
GO-terms associated with Differentially Expressed Genes.
- https://cdn.elifesciences.org/articles/56450/elife-56450-supp6-v2.xlsx
-
Transparent reporting form
- https://cdn.elifesciences.org/articles/56450/elife-56450-transrepform-v2.docx
Download links
A two-part list of links to download the article, or parts of the article, in various formats.
Downloads (link to download the article as PDF)
Open citations (links to open the citations from this article in various online reference manager services)
Cite this article (links to download the citations from this article in formats compatible with various reference manager tools)
Gli3 utilizes Hand2 to synergistically regulate tissue-specific transcriptional networks
eLife 9:e56450.
https://doi.org/10.7554/eLife.56450


