Private–public mappings in human prefrontal cortex
- Wellcome Centre for Human Neuroimaging, UCL, United Kingdom
- Department of Experimental Psychology, University of Oxford, United Kingdom
- School of Cognitive Sciences, Institute for Research in Fundamental Sciences, Islamic Republic of Iran
- Wellcome Centre for Integrative Neuroimaging, Centre for Functional Magnetic Resonance Imaging of the Brain, University of Oxford, United Kingdom
- Max Planck UCL Centre for Computational Psychiatry and Ageing Research, UCL, United Kingdom
- Department of Experimental Psychology, UCL, United Kingdom
Figures
Figure 1 with 3 supplements
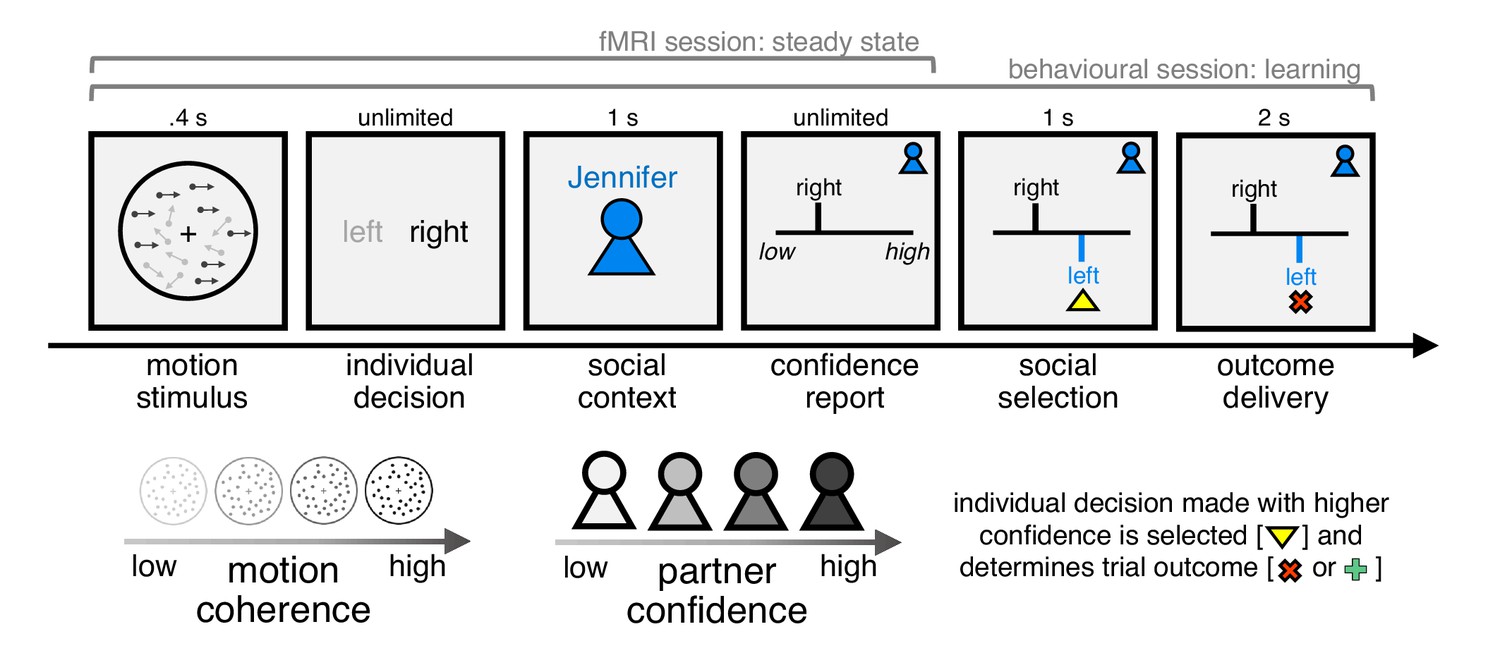
Experimental framework for dissociating private and public confidence.
On each trial, subjects made a perceptual group decision with one of four partners. They first decided whether a random dot motion stimulus was moving left or right. We varied the fraction of coherently moving dots in order to manipulate subjects’ internal sense of confidence in their decision. Subjects were then informed about their partner on the current trial and were asked to submit a report of confidence in their initial decision (discrete scale from 1 to 6). Subjects were then shown the partner’s response, after which the individual decision made with higher confidence was selected as the group decision. Finally, subjects received feedback about choice accuracy, before continuing to the next trial. We engineered the partners to have the same choice accuracy as subjects but to differ in mean confidence. Subjects were incentivised to help each group achieve as many correct decisions as possible: they were told that we would randomly select two trials for each group in each session (4 × 2 × 2 = 16 trials) and pay £1 in bonus for every correct group decision (in reality, all subjects received £10 in bonus). In this design, the strategy for maximising group accuracy (reward) is to match your partner’s mean confidence. The structure of the task differed between the behavioural and fMRI sessions as explained in the main text.
Figure 1—figure supplement 1
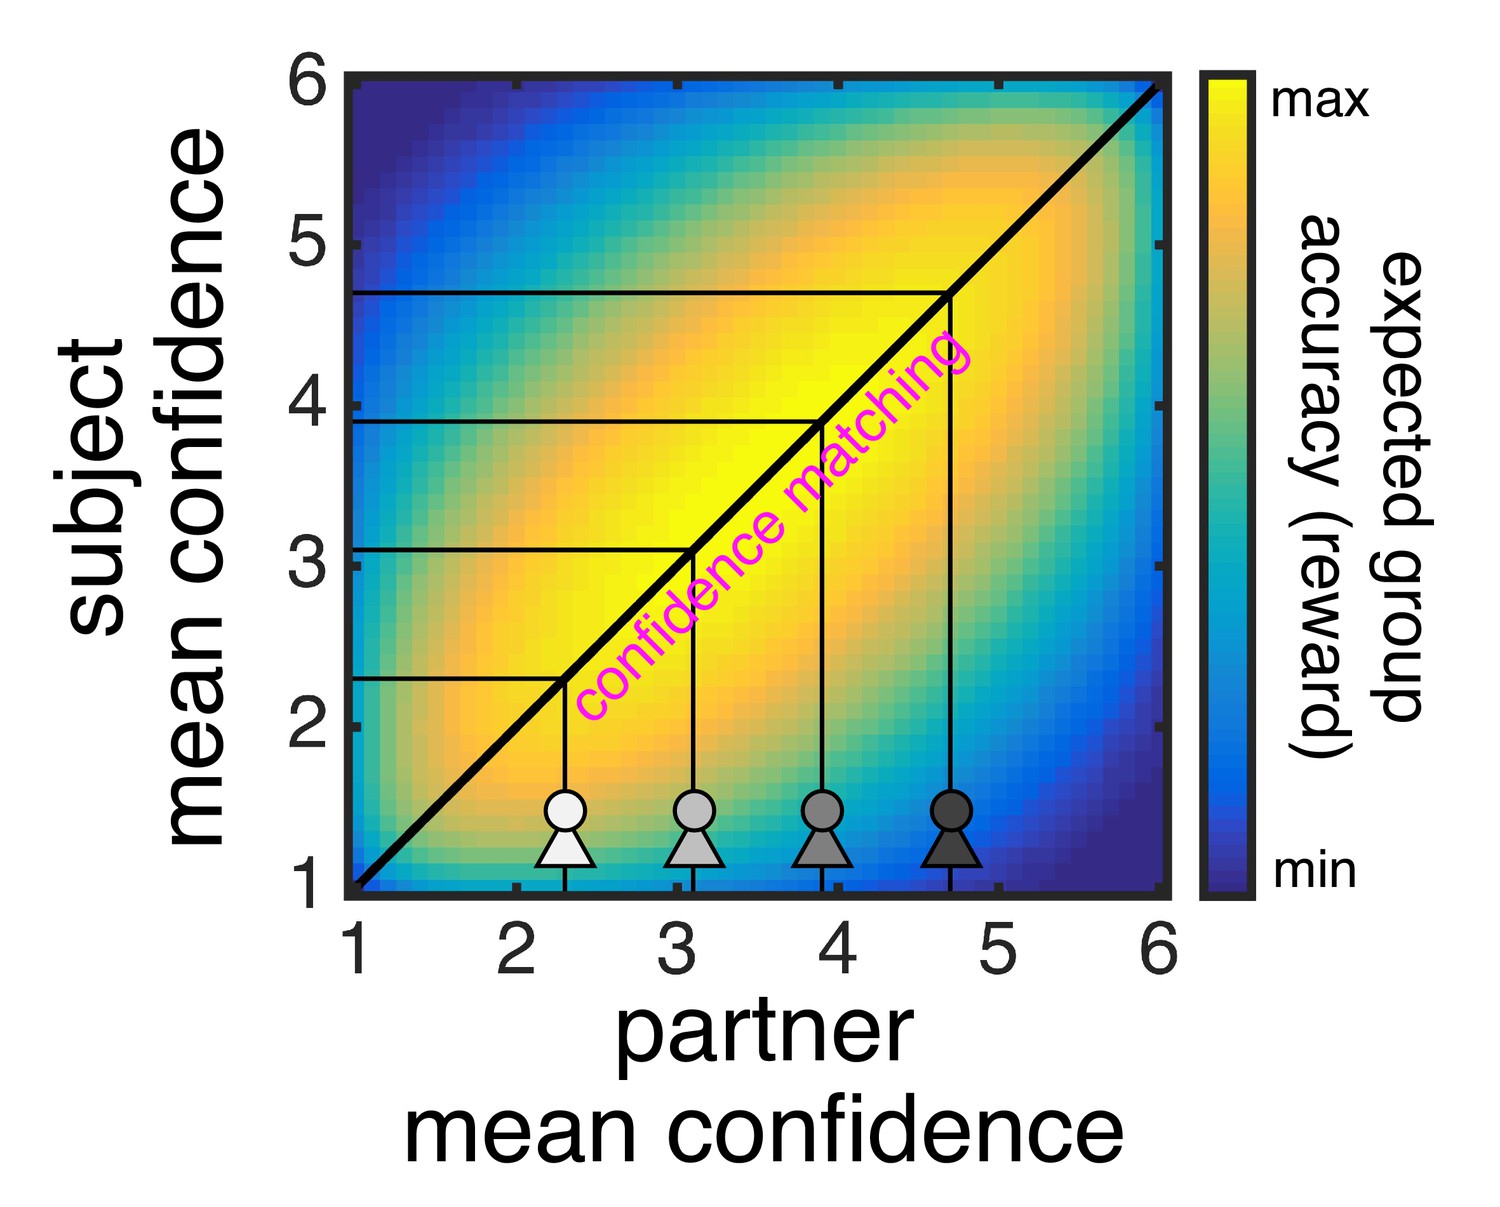
Confidence matching maximises group accuracy and thereby reward.
The heat map shows expected group accuracy as a function of the mean confidence of two players with the same level of task performance (i.e. sensory noise). The heat map was derived analytically using the sensory noise fitted to an example subject and by assuming maximum entropy confidence distributions (see Bang et al., 2017, for details on calculation). The heat map shows that expected group accuracy is highest along the identity line: that is, when a subject’s mean confidence (y-axis) is matched to that of the current partner (x-axis; the four avatars indicate the four partners’ mean confidence as specified in the task). Under our incentive structure, expected reward is proportional to expected group accuracy: the higher the expected group accuracy, the higher the probability that a randomly selected group decision will be correct.
Figure 1—figure supplement 2
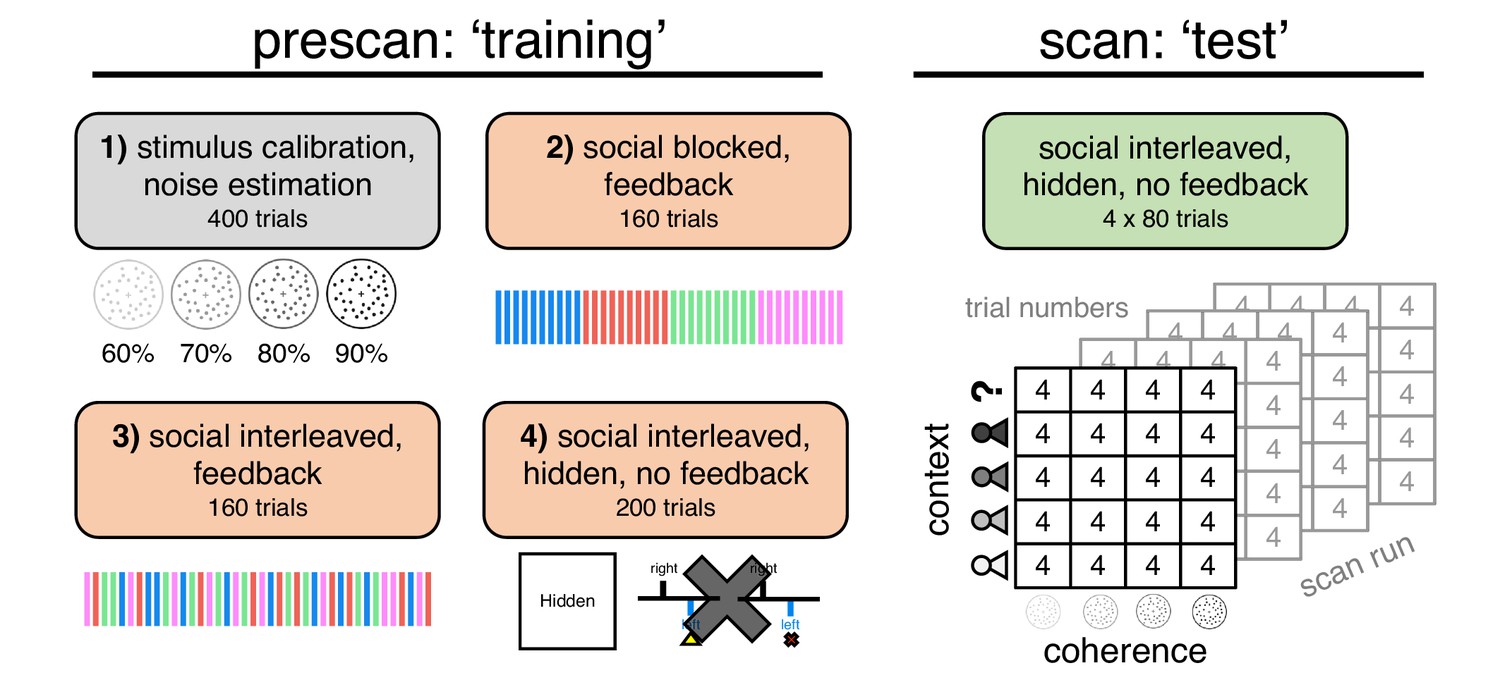
Schematic of study protocol.
Subjects took part in separate behavioural and fMRI sessions on the same day. The prescan session involved four phases. In phase 1, we calibrated four levels of coherence so as to achieve target levels of choice accuracy (60%, 70%, 80% and 90%). In phases 2–4, we trained subjects on the social task. In phase 2, subjects were paired with the partners in a block-wise manner (each partner is indicated by a unique colour and name). There were four cycles of blocks of 10 trials per partner (e.g., A–B–C–D–A–B–C–D–A–B–C–D–A–B–C–D). The context screen was shown before each block of trials but not after a perceptual decision. In phase 3, subjects were paired with the four partners in an interleaved manner, with the current partner’s identity revealed after each perceptual decision. In phase 4, the ‘showdown’ stage was played out in the background. In addition, we introduced a condition where the social context was hidden. The scan session involved four runs, using the same design as in phase 4 of the prescan session. We matched the distribution of conditions (coherence × context) across scan runs in order to facilitate multivariate analysis of the fMRI data.
Figure 1—figure supplement 3
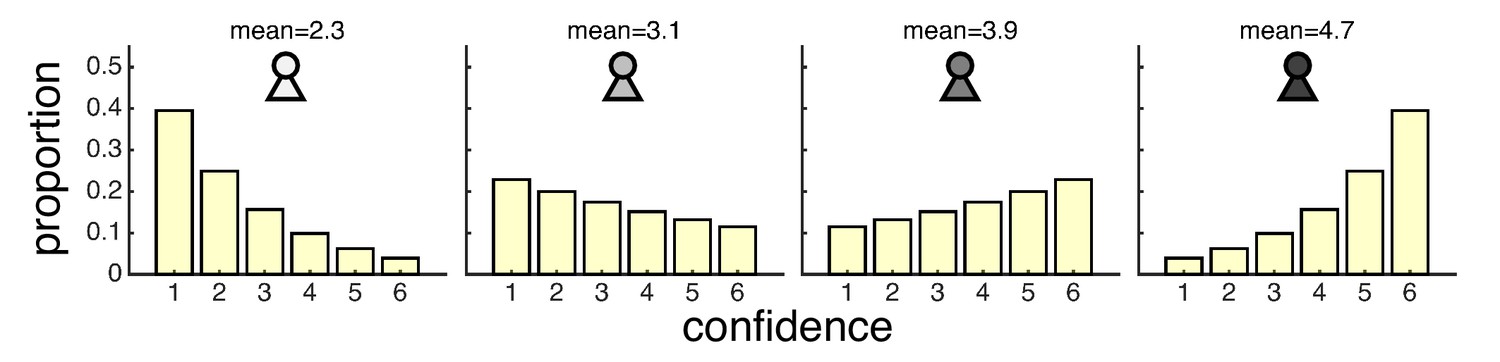
Confidence distributions used to generate four partners who differ in mean confidence.
The distributions were constructed so as to have maximum entropy for a given level of mean confidence (see Bang et al., 2017, for details on calculation).
Figure 2 with 2 supplements

Separate influences of motion coherence and social context on confidence reports.
(A) Mean confidence reported for each level of coherence. (B) Mean confidence reported when playing with each partner. The question mark indicates a condition where the partner’s identity was hidden. (C) Heat map visualising mean confidence in each condition of our factorial design (confidence was z-scored for each subject before averaging across subjects). Warmer colours indicate higher confidence. All data are from the fMRI session. In (A) and (B), data are represented as group mean ± SEM. Each dot is a subject.
Figure 2—figure supplement 1
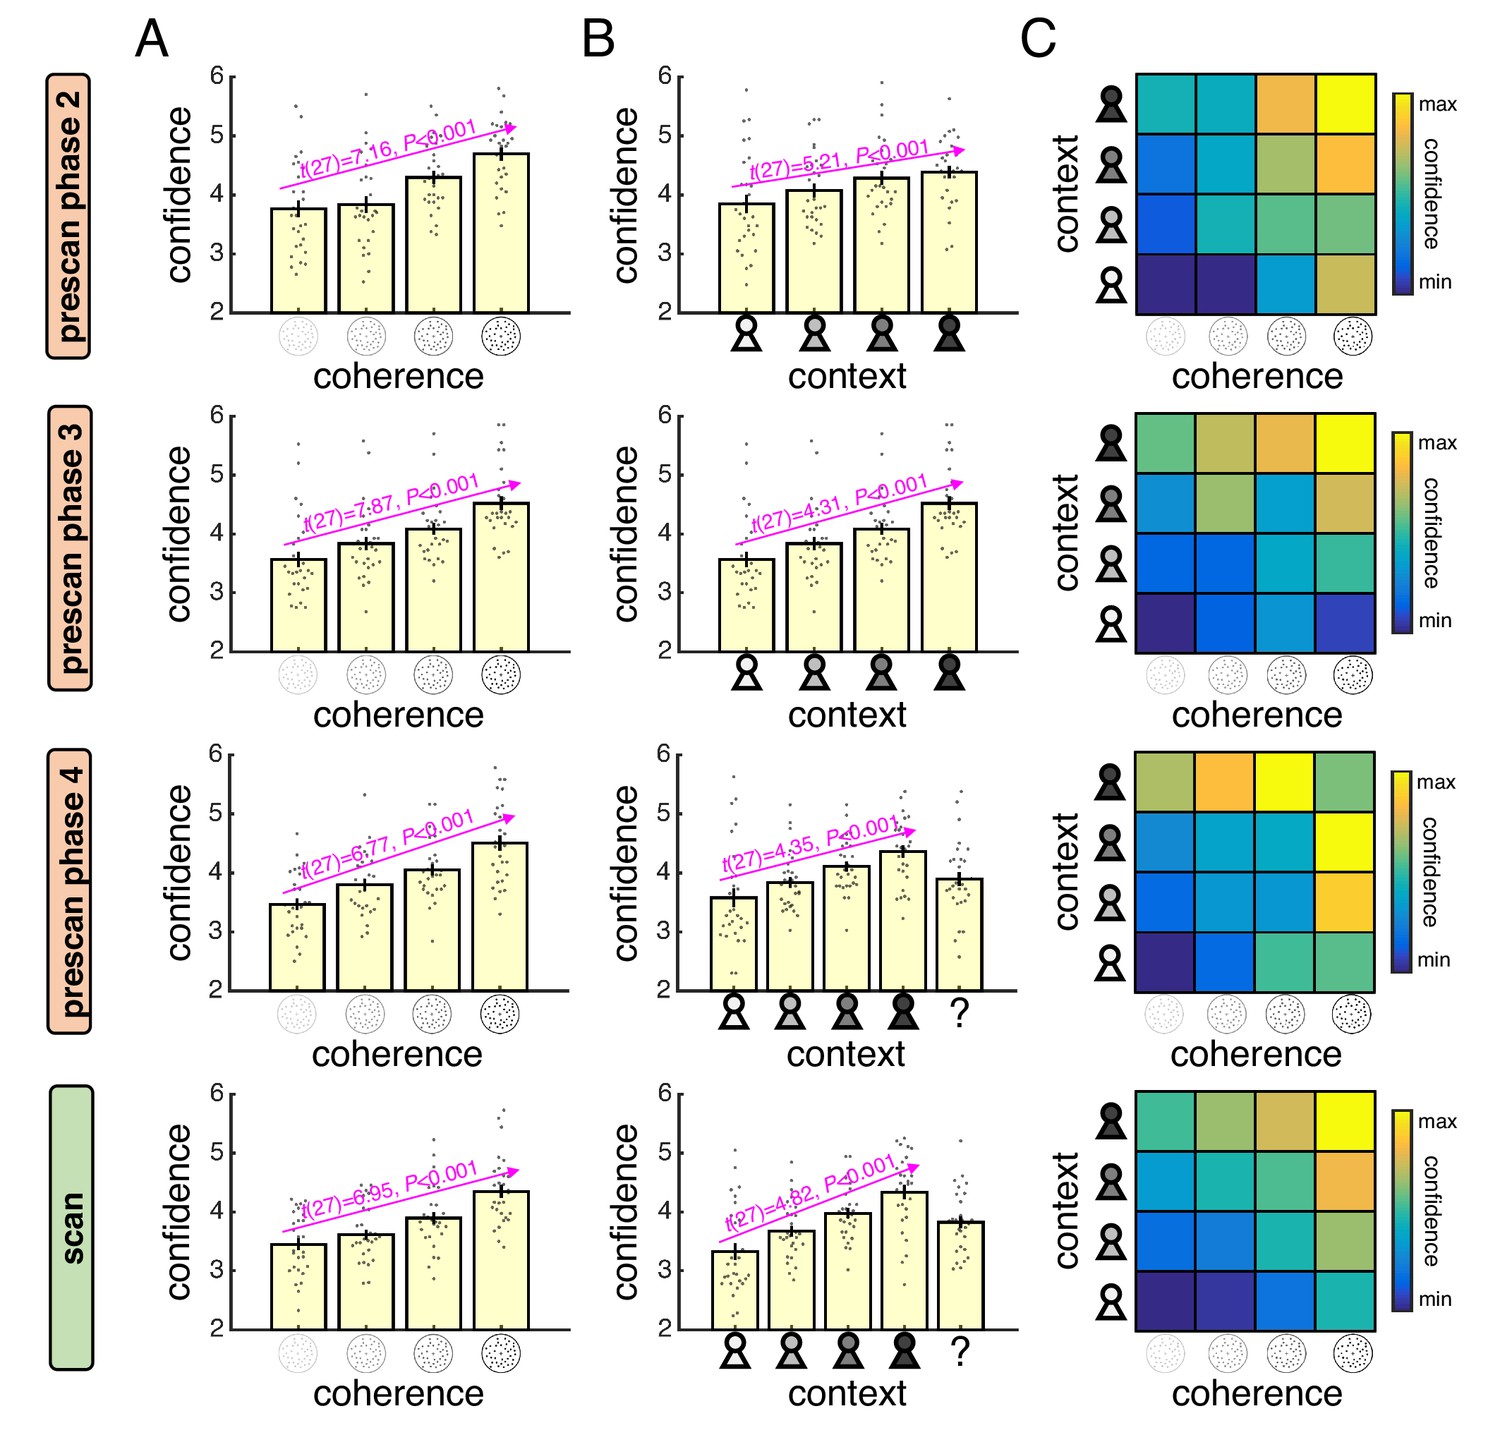
Analysis of confidence reports in prescan session.
Rows 1–3 indicate phases 2–4 in the behavioural session (see Figure 1—figure supplement 2). Row 4 indicates the fMRI session and is included for comparison. (A) Mean confidence reported for each level of coherence. (B) Mean confidence reported when playing with each partner. The question mark indicates a condition in which the partner’s identity was hidden. (C) Heat map over mean confidence in each condition of our factorial design (confidence was z-scored for each subject before averaging across subjects). Warmer colours indicate higher confidence. In (A) and (B), data are represented as group mean ± SEM. Each dot is a subject.
Figure 2—figure supplement 2
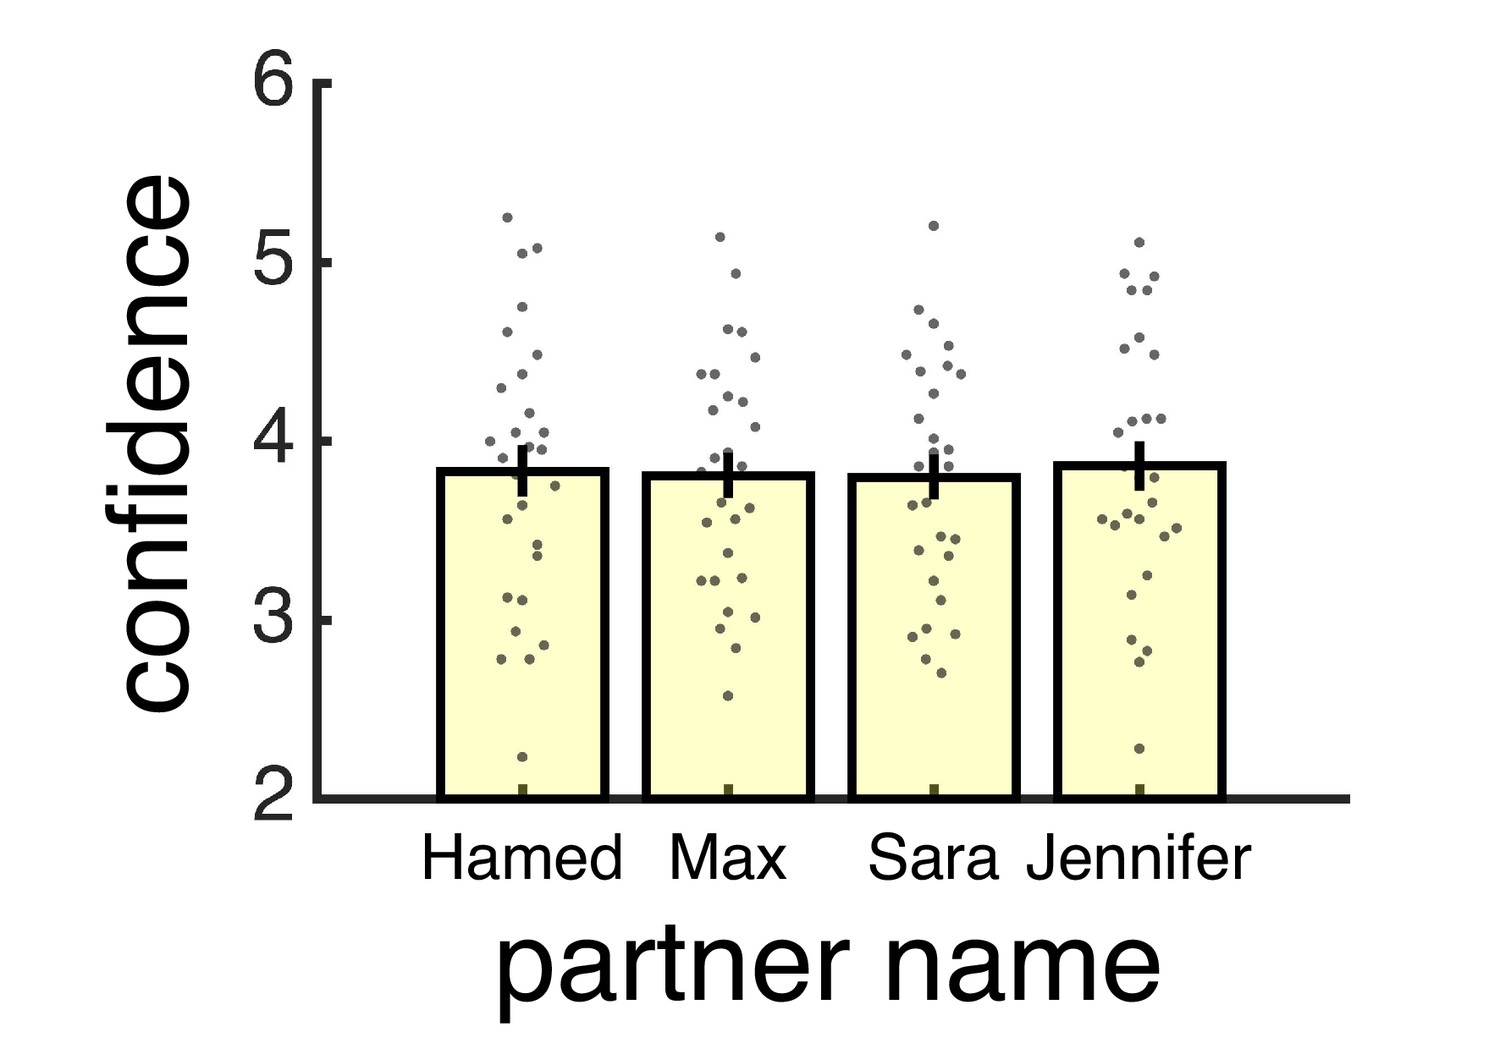
Analysis of confidence reports separated by partner identity.
Each partner was identified by a unique colour (pink, blue, green or red) and name (Hamed, Max, Sara or Jennifer) – with the name indicating the partner’s gender. The attributes were randomly assigned to the four partner types (low, medium-low, medium-high and high). Visualisation of mean confidence reported for each partner name indicates that there was no modulation by partner identity. As the task was not optimised for studying identity effects (e.g., a subject does not experience the same name in association with different partner types or the same partner type in association with different names), we did not seek to further unpack behaviour in terms of partner identity. Data are represented as group mean ± SEM. Each dot is a subject.
Figure 3 with 1 supplement
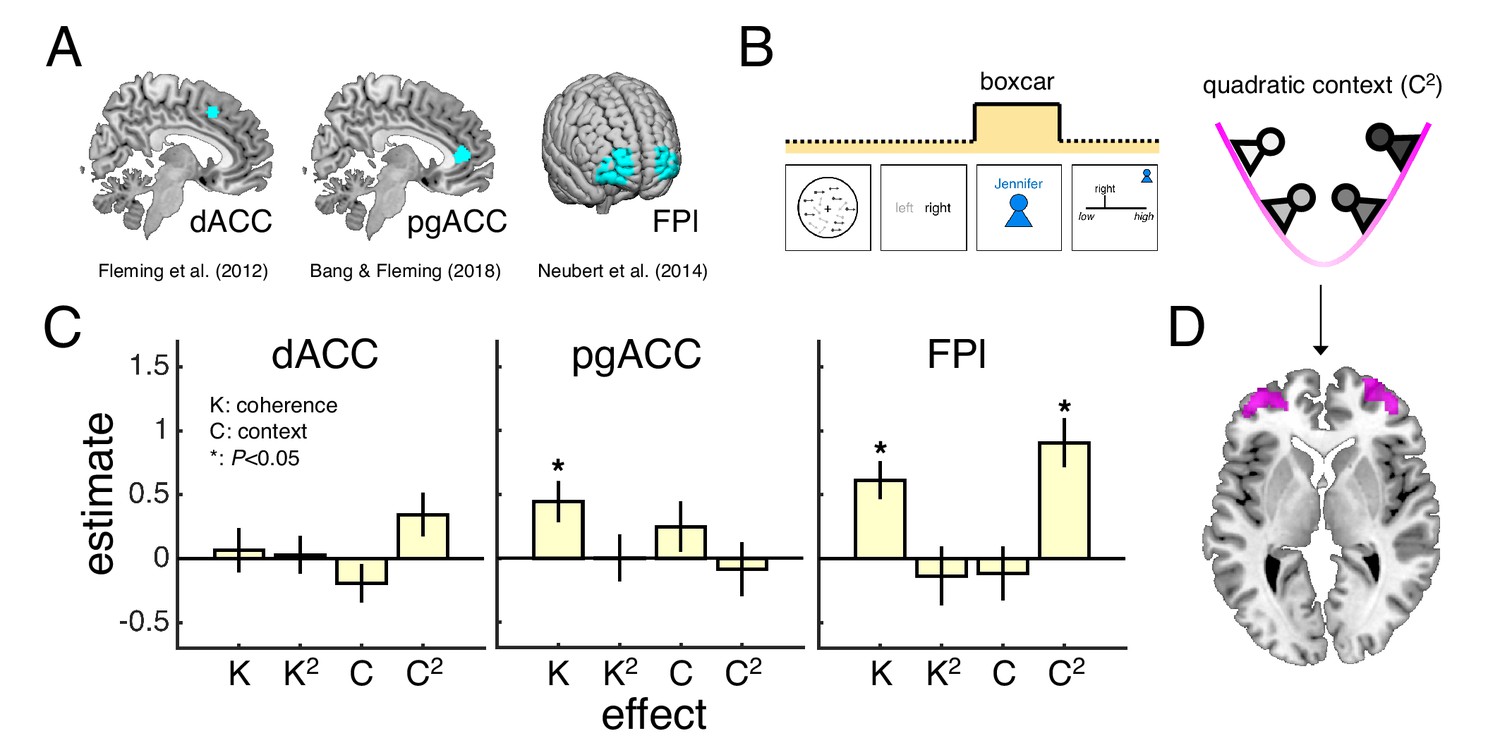
Encoding of motion coherence and social context in lateral frontal pole.
(A) Regions of interest (ROIs). (B) We modelled neural responses to the context screen, including both linear and quadratic terms for coherence and context as parametric modulators – with the quadratic context term indexing the need for a context-dependent private-public mapping. (C) ROI contrast estimates for coherence (K), quadratic coherence (K2), context (C) and quadratic context (C2). We tested significance (asterisk) by comparing contrast estimates across subjects to zero (p<0.05, one-sample t-test). Statistical results are summarised in Table 1. Data are represented as group mean ± SEM. (D) Visualisation of whole-brain activation for quadratic context in lateral prefrontal cortex (clusters significant at p<0.05, FWE-corrected for multiple comparisons, with a cluster-defining threshold of p<0.001, uncorrected). See Appendix 1 for whole-brain activations in response to context screen and Appendix 2 for whole-brain activations in response to presentation of the motion stimulus. dACC: dorsal anterior cingulate cortex. pgACC: perigenual anterior cingulate cortex. FPl: lateral frontal pole.
Figure 3—figure supplement 1
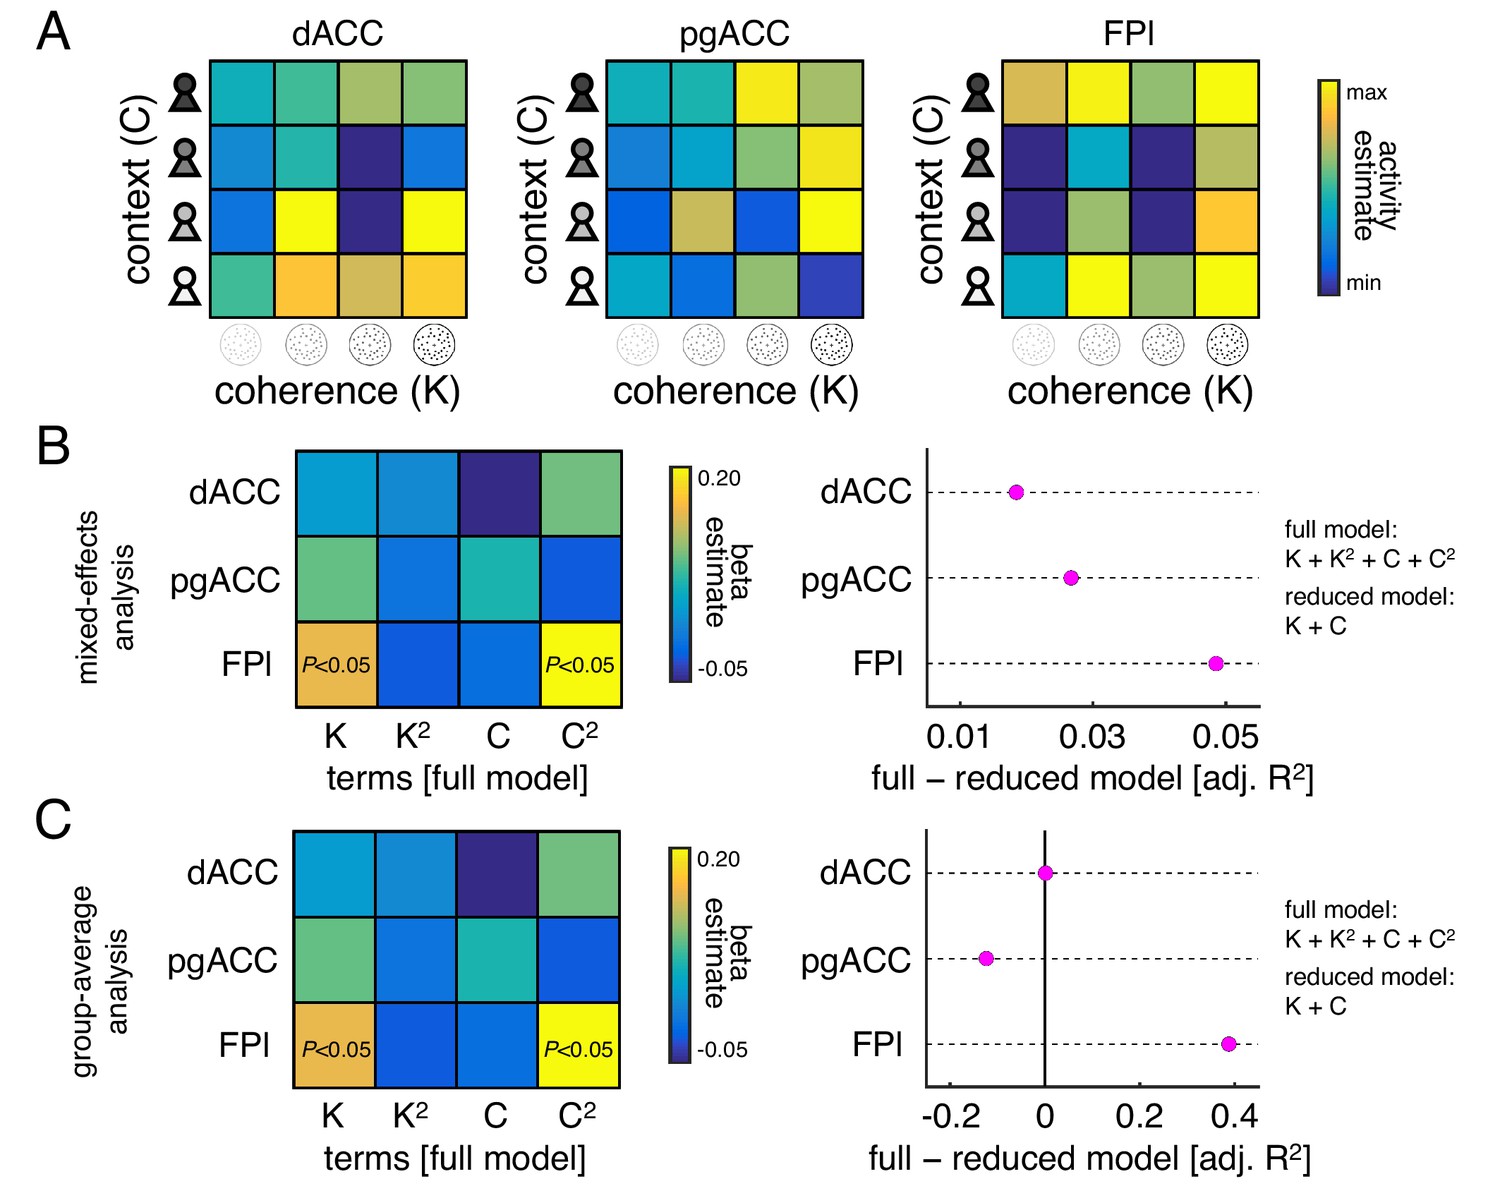
Evaluation of quadratic terms.
The analysis of ROI responses to the context screen shown in Figure 3C was based on a model (GLM1) that included linear and quadratic terms for coherence (K) and context (C) as parametric modulators. Both the linear and the quadratic terms were derived from our factorial design and theoretically motivated. Nevertheless, we ran an independent set of analyses to validate the inclusion of the quadratic terms in our model. To this end, we extracted ROI activity estimates under GLM3 – originally estimated for RSA – which modelled neural responses to the context screen separately for each condition of our factorial design (4 × 4 = 16). We applied a full model (linear and quadratic) and a reduced model (only linear) to these activity estimates within a regression framework and compared their goodness-of-fit (here defined as adjusted R2 which controls for the number of model predictors). This approach revealed that the goodness-of-fit was higher for the full than the reduced model in FPl and that this difference was higher for FPl than the other ROIs. (A) Heat map visualising mean ROI activity estimates for each condition of our factorial design under GLM3 (activity estimates were z-scored for each subject before averaging across subjects). (B) Mixed-effects analysis of ROI activity estimates. Plots show (left) fixed effects under full model and (right) difference in adjusted R2 between full and reduced model under a linear mixed-effects regression model (both fixed and random effects for each subject). (C) Group-average analysis of ROI activity estimates. Plots show (left) fixed effects under full model and (right) difference in adjusted R2 between full and reduced model under a linear regression analysis of the mean ROI activity estimates shown in panel A.
Figure 4 with 2 supplements
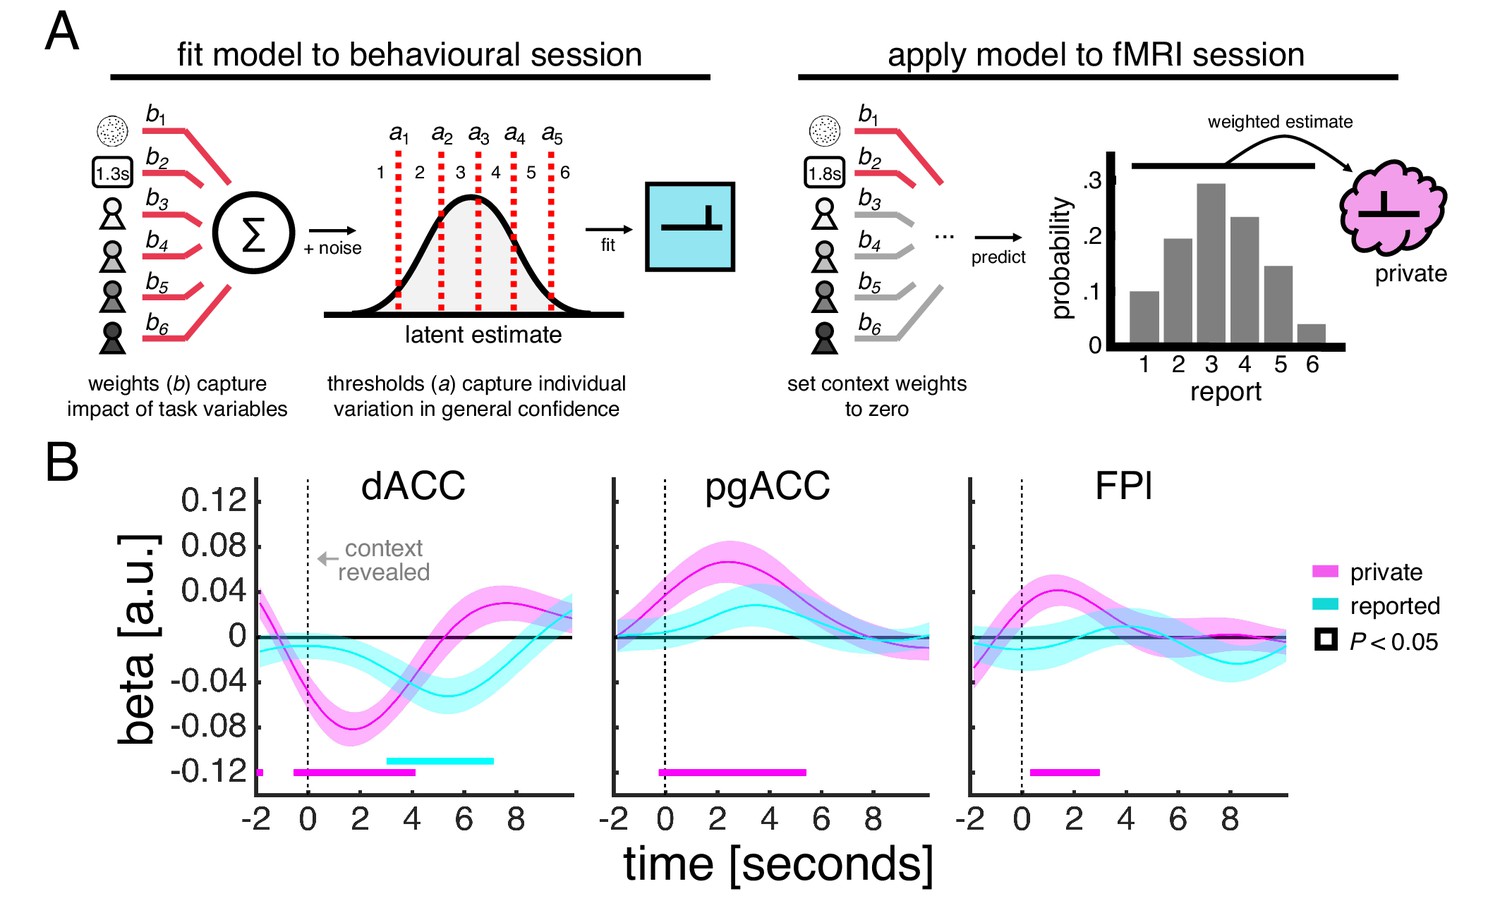
Encoding of private and reported confidence in prefrontal cortex.
(A) Model-based estimate of private confidence. We fitted an ordinal regression model to a subject’s confidence reports from the behavioural session (we used the data from the final phase as this phase had the same task design as the fMRI session). The model has a set of weights, which parameterise the influence of the perceptual decision (coherence and choice reaction time) and social context (one term for each partner), and a set of thresholds, which parameterise report biases. We used the fitted model to predict the confidence that a subject would have reported in the fMRI session had there been no contextual modulation – by applying the model to a subject’s data while setting the context weights to zero. This prediction is a probability distribution over reports (e.g., a report of ‘1’ has a 10% probability, ‘2’ has 20% probability and so on). We used the expectation under this distribution as our estimate of private confidence. (B) GLM analysis of the effects of private confidence and empirically observed confidence reports on ROI activity time courses. Vertical dashed line indicates the onset of the context screen - the context screen, which is presented for 1 s, is shown .5 s after the submission of the perceptual decision and is immediately followed by the confidence scale. Analyses were performed on trials in which the context was explicitly signalled. We tested significance (coloured square) for each time point by comparing coefficients across subjects to zero (p<0.05, one-sample t-test).
Figure 4—figure supplement 1
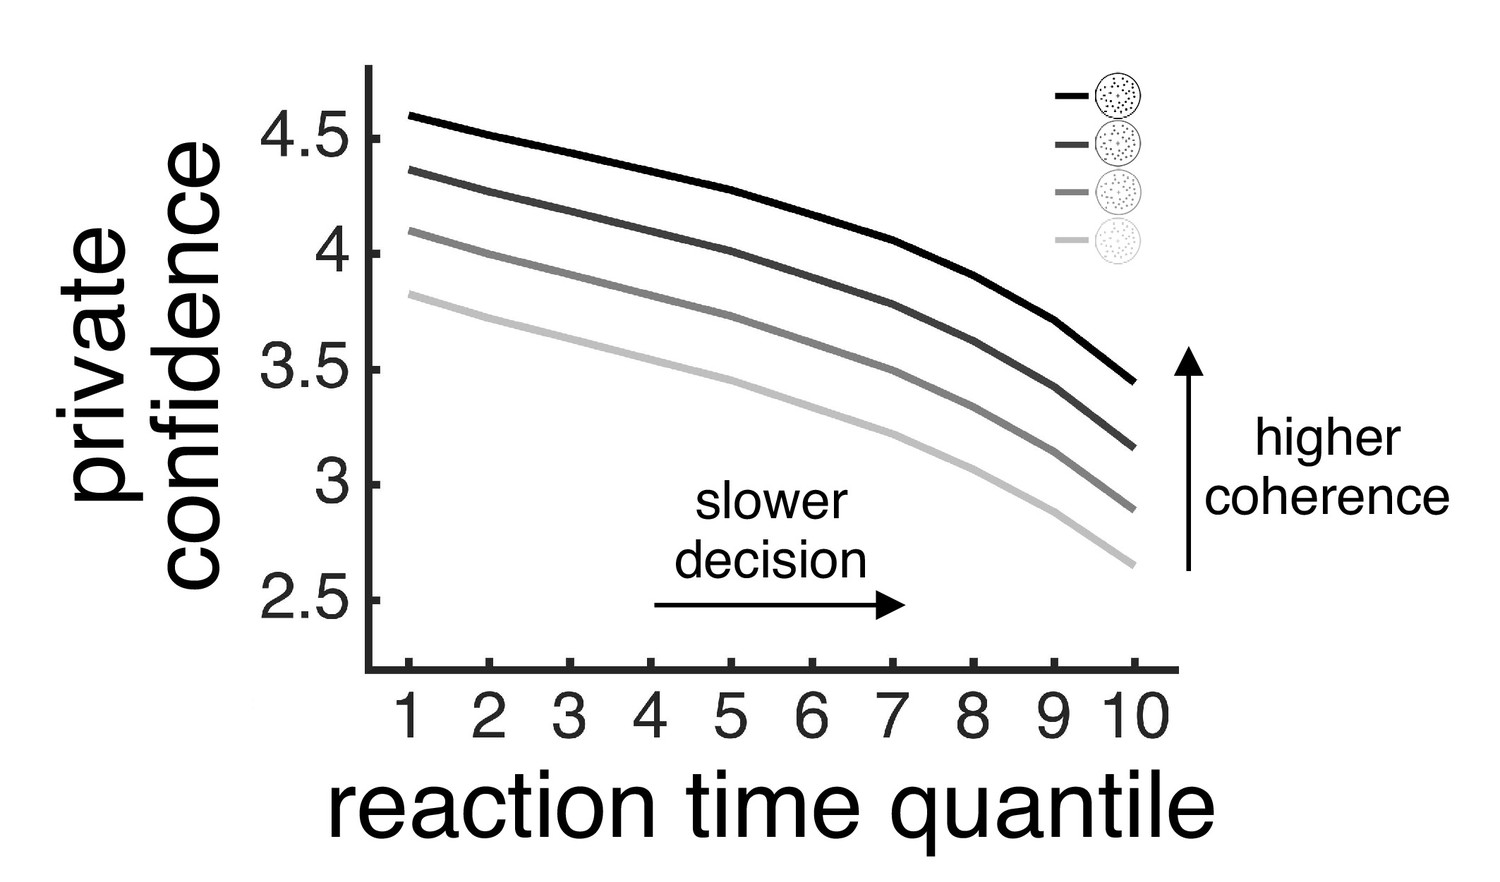
Model-based estimate of private confidence varies with both motion coherence and choice reaction time.
For each subject, we used the model fitted to their data (see Figure 4A) to estimate private confidence (y-axis) for each level of motion coherence (lines) and for 10 choice reaction times specified using quantiles (x-axis). We then averaged the model-based estimate of private confidence across subjects for visualisation.
Figure 4—figure supplement 2
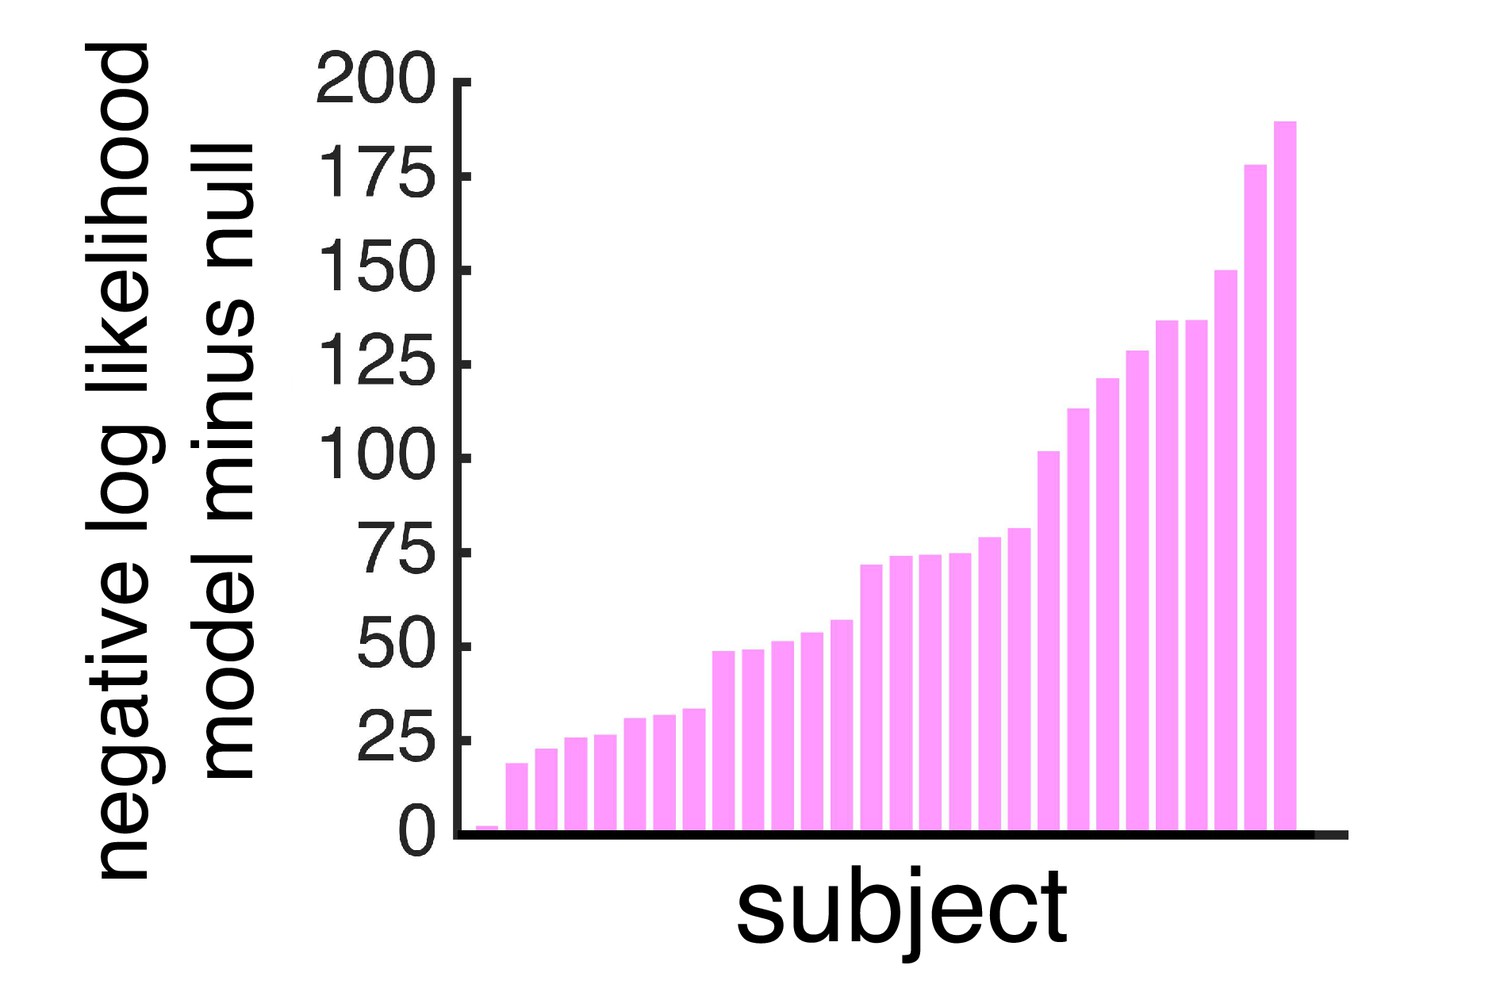
Cross-validation accuracy for confidence model.
We used a leave-one-trial-out procedure to assess cross-validation accuracy within the data used to fit the confidence model (final phase of the behavioural session). For each subject, we iteratively fitted the model to all trials but one and computed the negative log likelihood of the report observed on the left-out trial under the confidence model (where the probability distribution over reports depends on the fitted model) and a null model (where the probability distribution over reports is uniform). We then summed the cross-validated negative log-likelihoods across all trials and computed the difference between the confidence model and the null model (y-axis) – with a positive value indicating higher cross-validation accuracy under the confidence model than the null model. In support of our approach, the difference between the confidence model and the null model was positive in all subjects.
Figure 5

Functional connectivity between medial and lateral prefrontal context varies with contextual requirements of task.
(A) Psychophysiological interaction analysis of ROI activity time courses. Traces are coefficients from a GLM in which we predicted dACC/pgACC activity from the interaction between FPl activity and (1) the model-based estimate of private confidence (pink), (2) the empirically observed confidence reports (cyan) and (3) the interaction between private and reported confidence (green) – while controlling for the main effect of each term. Vertical dashed line indicates the onset of the context screen - the context screen, which is presented for 1 s, is shown .5 s after the submission of the perceptual decision and is immediately followed by the confidence scale. Analyses were performed on trials in which the context was explicitly signalled. We tested significance (coloured square) for each time point by comparing coefficients across subjects to zero (p<0.05, one-sample t-test). (B) Visualisation of FPl-dACC connectivity. Hotter colours indicate greater FPl-dACC connectivity as a function of variation (in z-score units) in private confidence (x-axis) and reported confidence (y-axis). FPl-dACC connectivity was estimated using group-level coefficients averaged across a time window from 6 s to 8 s (box in panel A).
Figure 6
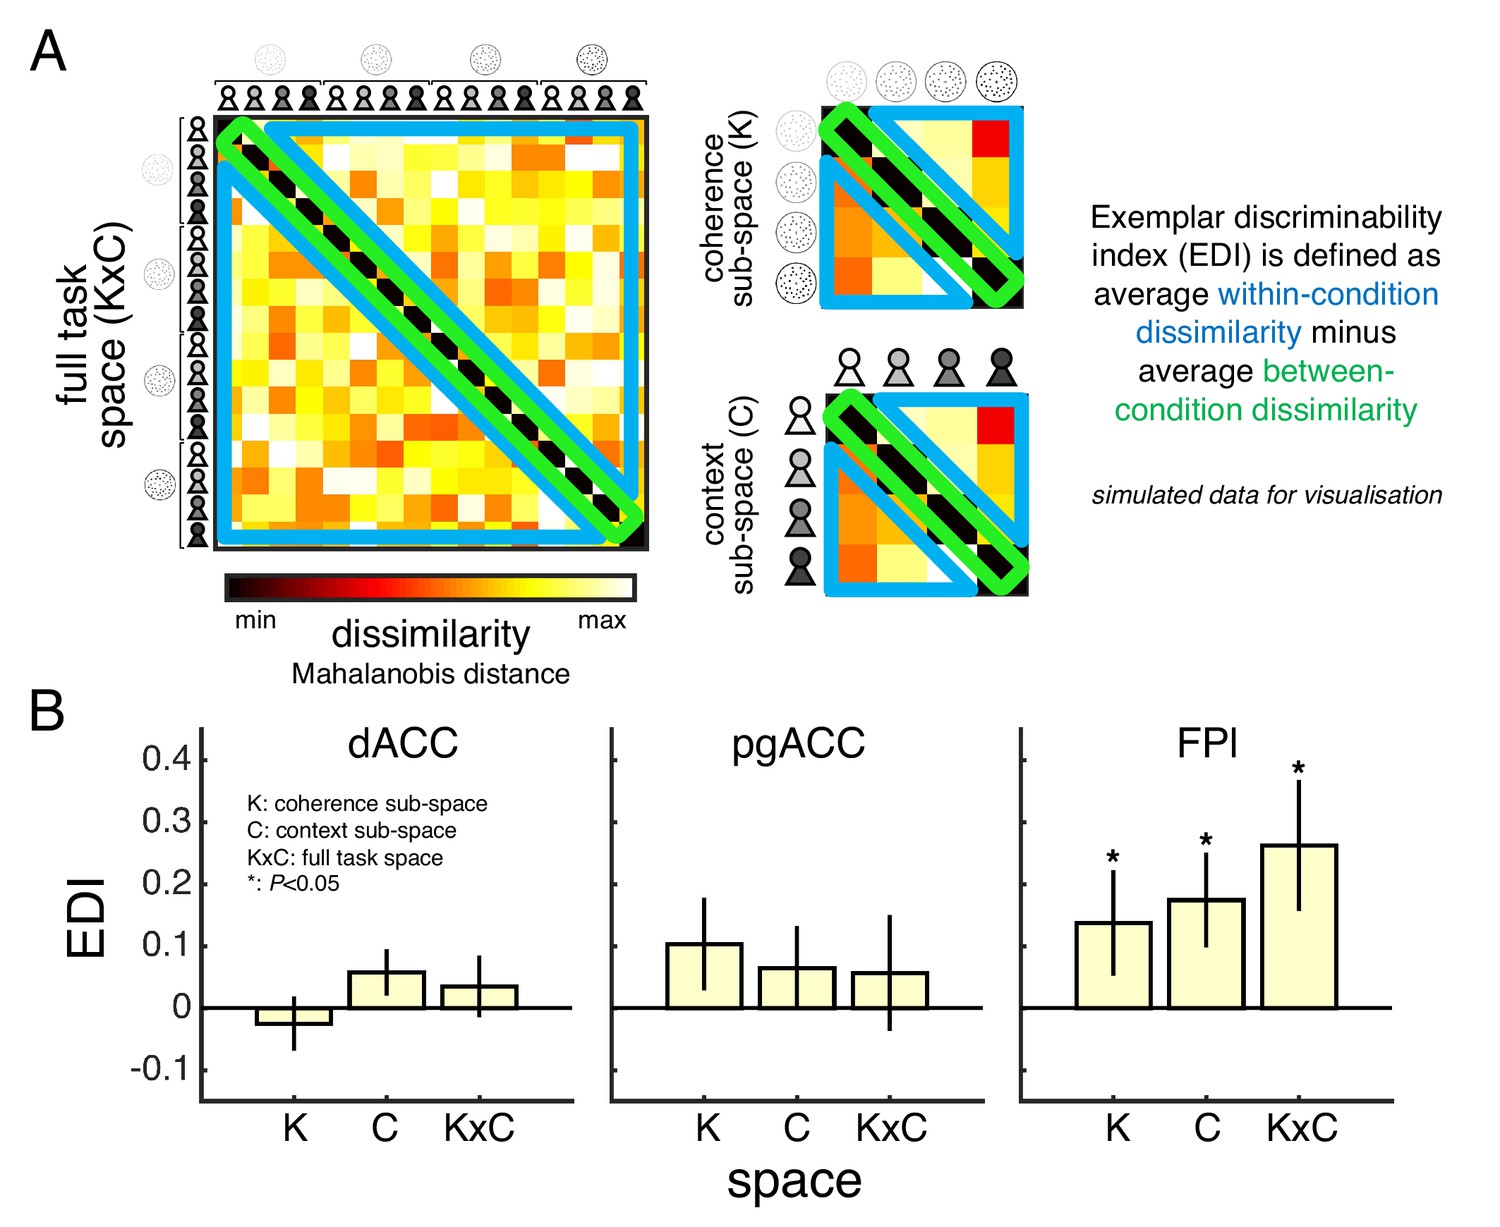
Task space representation in lateral frontal pole.
(A) A split-data representational dissimilarity matrix (sdRDM) is constructed by (1) computing the Mahalanobis distance between the voxel activity pattern in scan run i and the voxel activity pattern averaged across scan runs j ≠ i for every pair of conditions and (2) averaging the sdRDMs across scan runs. The exemplar discriminability index (EDI) is computed as the average dissimilarity across off-diagonal elements (blue) minus the average dissimilarity across diagonal elements (green). A positive EDI indicates that the voxel activity pattern within an ROI is more stable within conditions than between conditions and therefore that the ROI discriminates between the conditions. Simulated data are presented to aid visualisation. (B) ROI EDIs for the full task space (KxC) as well as the sub-spaces of coherence (K) and context (C). We tested significance (asterisk) by comparing EDIs across subjects to zero (p<0.05, one-tailed sign-rank test). Statistical results are summarised in Table 2. Data are represented as group mean ± SEM. See Appendix 3 for whole-brain EDI searchlight analysis. dACC: dorsal anterior cingulate cortex. pgACC: perigenual anterior cingulate cortex. FPl: lateral frontal pole.
Tables
Table 1
Encoding of motion coherence and social context in lateral frontal pole.
Table shows statistical results for the analysis of ROI responses to the context screen shown in Figure 3C. The model (GLM1) included separate condition regressors for trials where the context was signalled and trials where the context was hidden. The condition regressor for signalled-context trials was parametrically modulated by linear and quadratic terms for coherence (K and K2) and context (C and C2). In addition to the contrast estimates for these parametric modulators, the table also shows the contrast between signalled-context and hidden-context trials. Statistical testing was performing by comparing contrast estimates across subjects to zero using a one-sample t-test. dACC: dorsal anterior cingulate cortex. pgACC: perigenual anterior cingulate cortex. FPl: lateral frontal pole.
| ROI | Contrast | Mean | SEM | t | P |
|---|---|---|---|---|---|
| dACC | K | 0.0646 | 0.1748 | 0.3694 | 0.7147 |
| K2 | 0.0293 | 0.1492 | 0.1966 | 0.8456 | |
| C | -0.1930 | 0.1503 | -1.2840 | 0.2101 | |
| C2 | 0.3448 | 0.1736 | 1.9857 | 0.0573 | |
| Signalled vs. hidden | 0.6045 | 0.3685 | 1.6402 | 0.1126 | |
| pgACC | K | 0.4427 | 0.1616 | 2.7389 | 0.0108 |
| K2 | 0.0008 | 0.1839 | 0.0043 | 0.9966 | |
| C | 0.2469 | 0.1994 | 1.2384 | 0.2262 | |
| C2 | -0.0878 | 0.2127 | -0.4126 | 0.6831 | |
| Signalled vs. hidden | 0.8477 | 0.4412 | 1.9213 | 0.0653 | |
| FPl | K | 0.6132 | 0.1496 | 4.0981 | 0.0003 |
| K2 | -0.1349 | 0.2314 | -0.5830 | 0.5647 | |
| C | -0.1172 | 0.2118 | -0.5535 | 0.5845 | |
| C2 | 0.9070 | 0.1941 | 4.6741 | 0.0001 | |
| Signalled vs. hidden | 1.2872 | 0.5155 | 2.4967 | 0.0189 |
Table 2
Task space representation in lateral frontal pole.
Table shows statistical results for the analysis of ROI task space representations shown in Figure 6B. Condition-specific multivariate patterns were obtained by modelling the neural response to the context screen separately for each condition of our factorial design (GLM3; only signalled-context trials). ROI EDIs were then computed separately for the full task space (KxC) as well as the sub-spaces of coherence (K) and context (C). Statistical testing was performed by comparing EDIs across subjects to zero using a one-tailed sign-rank test. dACC: dorsal anterior cingulate cortex. pgACC: perigenual anterior cingulate cortex. FPl: lateral frontal pole.
| ROI | Space | Mean | SEM | P |
|---|---|---|---|---|
| dACC | K | -0.0249 | 0.0436 | 0.7772 |
| C | 0.0577 | 0.0379 | 0.1073 | |
| KxC | 0.0353 | 0.0499 | 0.1397 | |
| pgACC | K | 0.1033 | 0.0749 | 0.1073 |
| C | 0.0646 | 0.0678 | 0.2029 | |
| KxC | 0.0567 | 0.0939 | 0.2437 | |
| FPl | K | 0.1378 | 0.0854 | 0.0334 |
| C | 0.1746 | 0.0768 | 0.0258 | |
| KxC | 0.2624 | 0.1062 | 0.0063 |
Additional files
Download links
A two-part list of links to download the article, or parts of the article, in various formats.
Downloads (link to download the article as PDF)
Open citations (links to open the citations from this article in various online reference manager services)
Cite this article (links to download the citations from this article in formats compatible with various reference manager tools)
Private–public mappings in human prefrontal cortex
eLife 9:e56477.
https://doi.org/10.7554/eLife.56477


