Microglial calcium signaling is attuned to neuronal activity in awake mice
- Department of Neurology, Mayo Clinic, United States
- Department of Neuroscience, Mayo Clinic, United States
- Department of Immunology, Mayo Clinic, United States
Figures
Figure 1

Spontaneous microglial calcium activity reported in the Lck-GCaMP6f and cytosolic GCaMP6s mouse.
(A) Imaging setup: in vivo two-photon imaging of microglial calcium activity in the awake, head-restrained animal. (B) Average intensity projection images and microglial ∆F/F calcium traces reported by Lck-GCaMP6f or cytosolic-GCaMP6s mice with a magnified cell. ∆F/F traces are from the soma and processes of a representative cell using manual segmentation. (C) Percentage of active microdomains reported by each sensor. (D) Maximum amplitude and signal area reported by each sensor (bar: mean ± SEM; dots: individual microdomains; 1-Way ANOVA with Sidak’s post-hoc comparison). (E) The Lck-GCaMP6f mouse reports microglial calcium activity that is widespread, coordinated, and low-level throughout the parenchyma (Eii), compared to periods of relative inactivity (Ei). Scale bar: 50 µm (B and E). *p<0.05, ****p<0.0001. N = 4 Lck-GCaMP6f mice, N = 8 Cyto-GCaMP6s mice.
-
Figure 1—source data 1
Microglial spontaneous calcium.
- https://cdn.elifesciences.org/articles/56502/elife-56502-fig1-data1-v2.xlsx
Figure 2 with 1 supplement
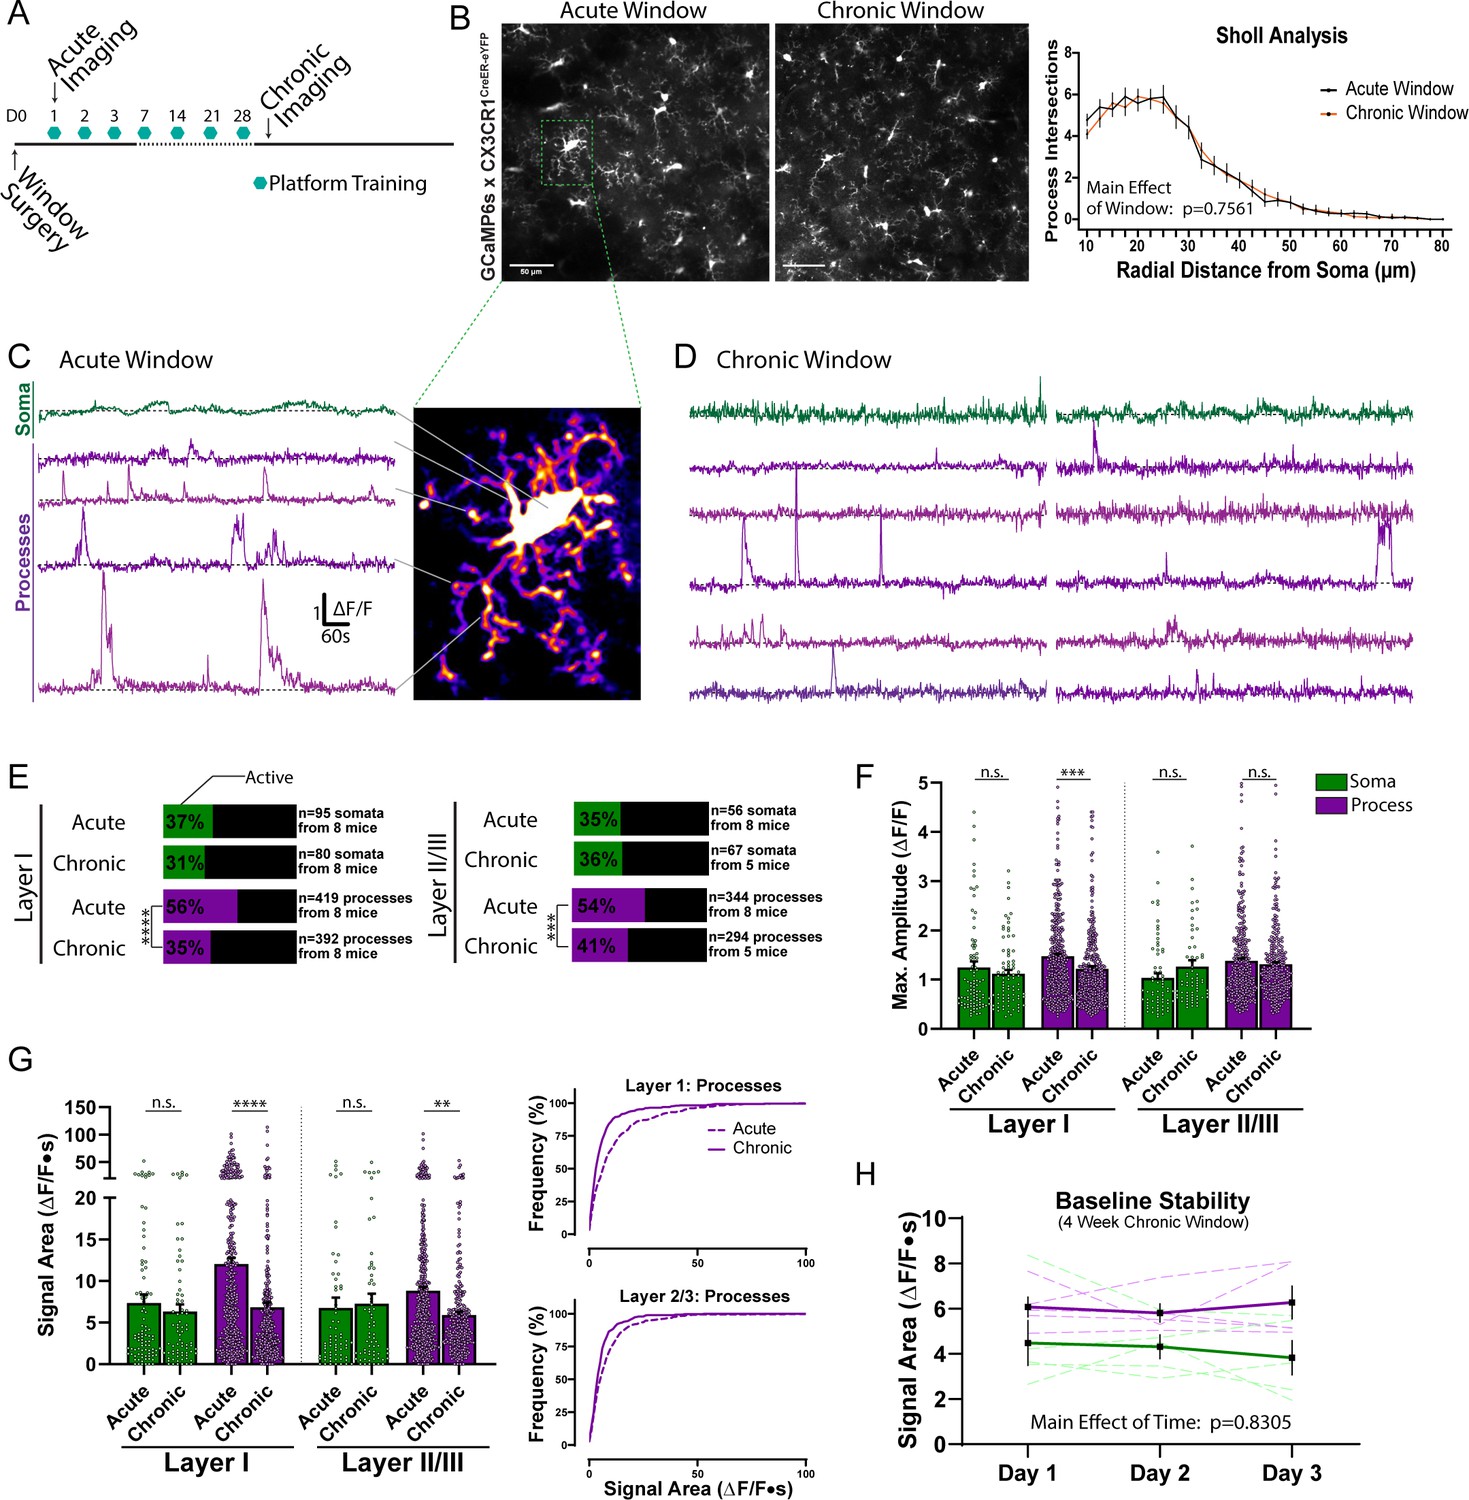
Spontaneous microglial calcium activity differs between acute and chronic window preparations.
(A) Timeline of acute and chronic window imaging and animal training. (B) eYFP average intensity images of microglia morphology in acute and chronic window preparations. Sholl analysis of microglial morphology (n = 50 microglia per group; two-way ANOVA). (C–D) Microglial ∆F/F calcium traces from the soma and processes of a representative cell in an acute window animal (C), or two representative cells in a chronic window animal (D), using manual segmentation. (E) Percent of active microdomains (Fisher’s exact test). (F) The amplitude recorded from microdomains (one-way ANOVA with Sidak’s post-hoc comparison). (G) The calcium signal area recorded from microdomains (one-way ANOVA with Sidak’s post-hoc comparison). Cumulative distribution curves for Layer I and Layer II/III process calcium signal areas. (H) Microglia soma and process calcium signal areas recorded over 3 successive days in chronic window animals. Scale bars: 50 µm (B). Grouped data represent the mean ± SEM; dots represent microdomains (F and G); dashed lines represent individual animals (H). The number of animals and microdomains surveyed is described in (E). **p<0.01, ***p<0.001, ****p<0.0001.
-
Figure 2—source data 1
Acute and chronic window spontaneous microglial calcium.
- https://cdn.elifesciences.org/articles/56502/elife-56502-fig2-data1-v2.xlsx
Figure 2—figure supplement 1

Variability in spontaneous microglial calcium activity in acute window preparations.
(A) A full field of view in an acute window animal with four outlined cells (i-iv, from Figure 2B). Each outlined cell (i–iv) is shown with higher magnification and representative examples of hand-segmented soma and process ROIs. The ∆F/F traces from many of the corresponding ROIs are shown by cell. (B) The distribution of microglia exhibiting different spontaneous calcium patterns. From N = 5 animals, 72 cells having four or more visible processes and a soma in the field of view were surveyed. Cells were primarily categorized as ‘inactive’ (24%; no soma or process activity in 15 min), having ‘process activity without somatic activity’ (48%), or having ‘somatic activity with or without process activity’ (27%). Within the latter two groups, we subdivided cells by the percentage of processes active (either less than a quarter of processes active, a quarter to half of processes active, half to three-quarters of processes active, or above three-quarters of processes active). Most microglia clustered within the lower end of the spontaneous activity spectrum (inactive to half of their processes active without somatic activity, 65%).
Figure 3 with 2 supplements
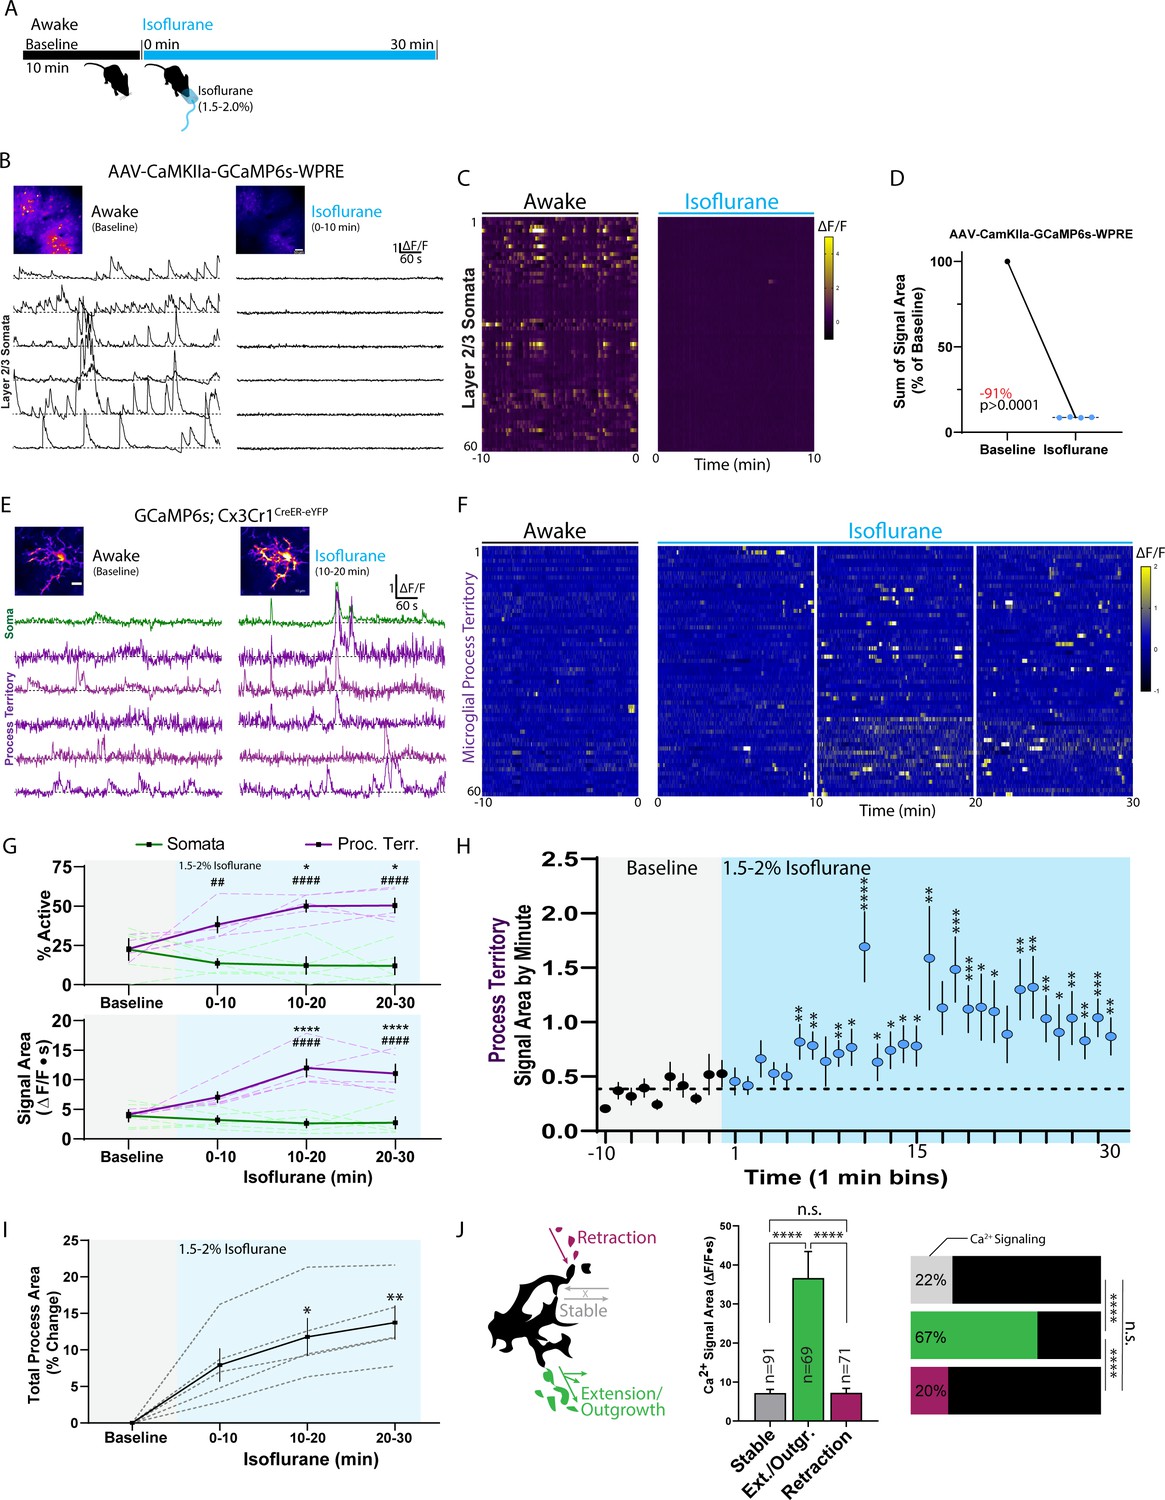
Isoflurane anesthesia increases microglial calcium activity.
(A) Timeline of experiment in a chronic window animal. (B–D) Control studies of excitatory neuronal calcium activity before and after isoflurane induction. (B) Representative ∆F/F traces of somatic calcium activity from layer II/III CaMKIIa neurons in one animal. (C) A heatmap of CaMKIIa somatic calcium activity from 60 representative somatic ROIs in one animal under awake and isoflurane conditions. (D) Baseline-normalized neuronal calcium activity under isoflurane (Paired t-test; dots: one animal) showing an average 91% drop in calcium signaling in the first 10 min of isoflurane maintenance (1.5–2%). (E–H) Microglial calcium responses to isoflurane from a cohort of chronic window GCaMP6s;Cx3Cr1CreER-eYFP mice (see also: Figure 3—Video 1). (E) Representative ∆F/F traces under awake and isoflurane conditions from the depicted microglial cell using threshold-based segmentation. (F) A heat map of microglial calcium activity from 60 threshold-segmented process territories surveyed across multiple microglia in a single field of view from a representative animal. (G) Microdomains active and their signal areas from baseline through anesthesia (two-way ANOVA; *Dunnett’s post-hoc vs. baseline; #somata vs. processes) using the threshold-segmentation approach for quantification. Dashed lines represent the averaged data from each of five animals, while solid lines represent the mean ± SEM from the N = 5 animals. (H) Microglial process territory calcium activity was binned by minute across all territories studied (311 to 379 territories detected in different imaging periods). The mean minute-by-minute signal area during the baseline period (0.385 ∆F/F∙s, dashed line) was compared to minute-by-minute calcium signal areas during isoflurane exposure (one-sample t-test comparison to the baseline average), indicating significant calcium changes in microglial processes are detectable 6 min after exposure . (I) After masking the soma, uniform thresholding of the average intensity image by period shows increasing total process area during isoflurane exposure (dashed lines: individual animal; solid lines: group mean ± SEM; one-way ANOVA with Dunnett’s post-hoc vs. baseline). (J) Microglial process calcium activity under isoflurane was studied by motility/morphology characteristics. As displayed in the cartoon, microglial motility/morphology was categorized as processes that retracted under isoflurane, processes that remained stable, or processes that extended, showing new areas of outgrowth. Exact criteria and methodology are provided in the methods and displayed further in Figure 3—figure supplement 1. After subdividing processes based on motility characteristics, the percentage of processes exhibiting calcium activity is displayed (horizontal bars, Fisher’s exact test) along with the signal magnitude (one-way ANOVA with Tukey’s post-hoc test; the number of sampled regions fitting each criterion is provided near the bar; mean ± SEM). Scale bars: 50 µm (B), 10 µm (E). N = 4 AAV-CaMKIIa-GCaMP6s mice (A–C), N = 5 GCaMP6s;Cx3Cr1CreER-eYFP mice (D–G). *p<0.05, **, ##p<0.01, ***p<0.001, ****, ####p<0.0001.
-
Figure 3—source data 1
Microglial calcium activity during isoflurane.
- https://cdn.elifesciences.org/articles/56502/elife-56502-fig3-data1-v2.xlsx
Figure 3—figure supplement 1
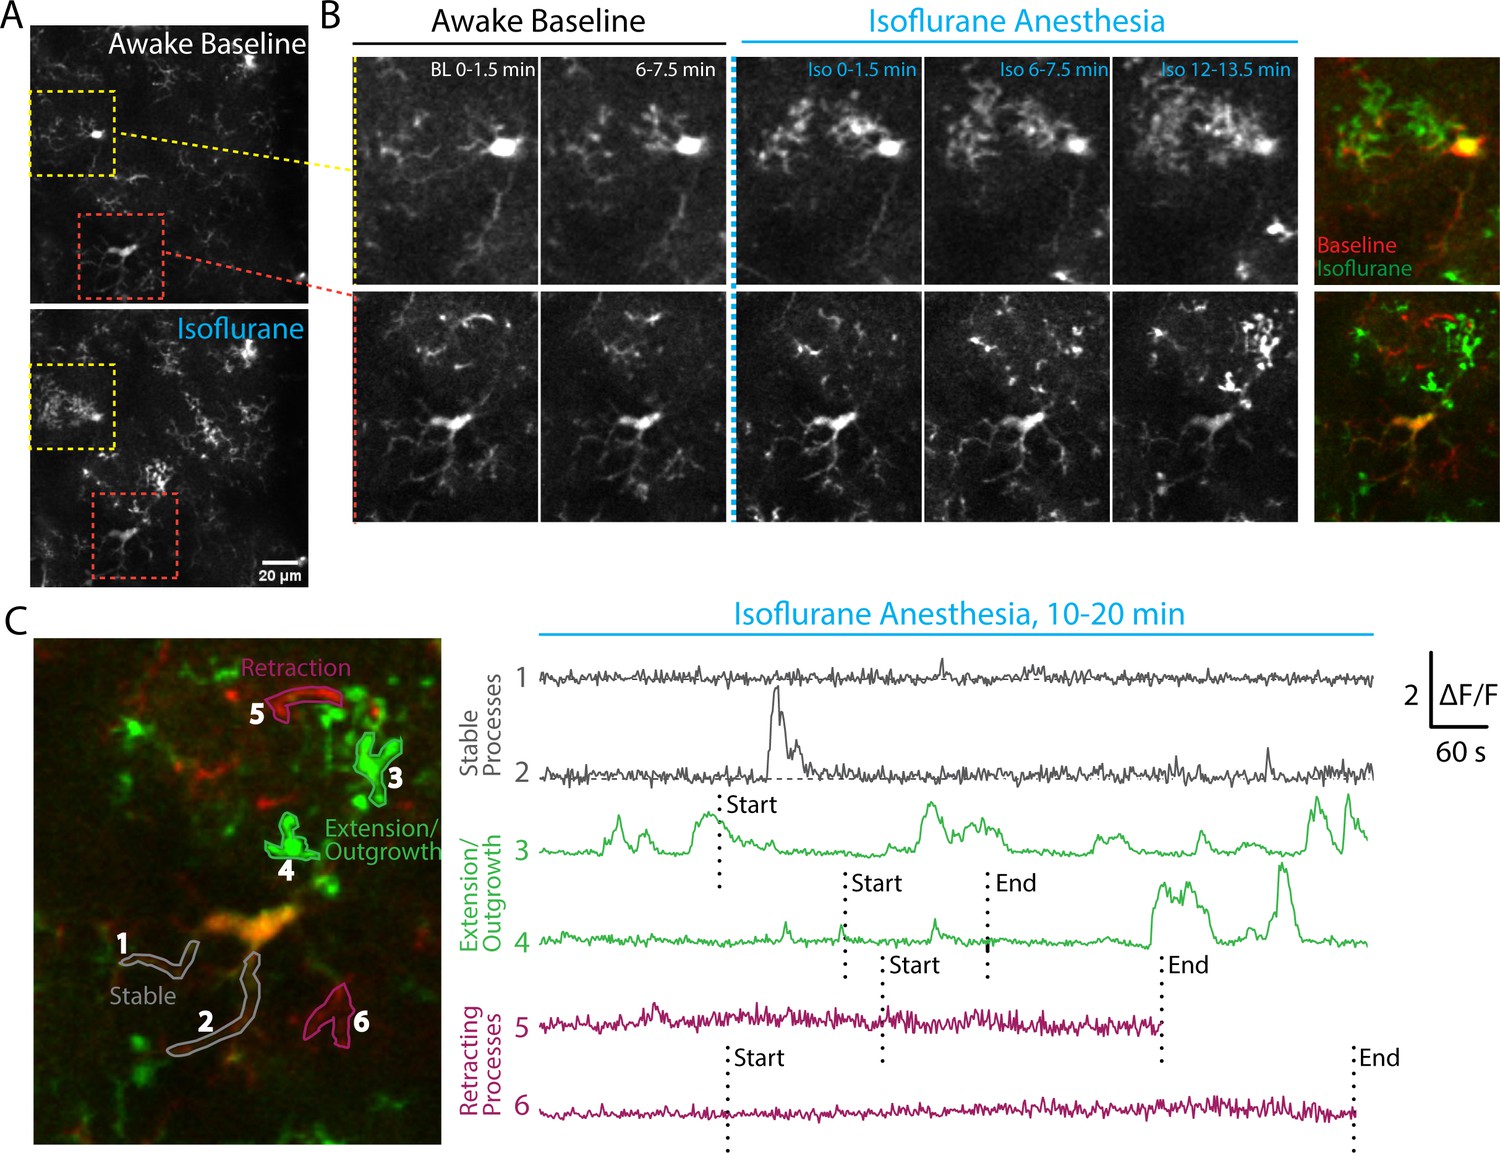
Isoflurane anesthesia results in process extension/outgrowth with high calcium activity.
(A) A field of view with multiple microglia under awake baseline and isoflurane conditions. (B) Higher magnification changes in microglial morphology for two representative cells from (A). An average intensity projection from a 90 s period was used to generate each image from baseline through isoflurane periods. A two-color overlay image shows changes in morphology between the two periods. (C) Examples of ∆F/F calcium traces from processes displaying each of the different motility characteristics (stability, extension/outgrowth, or retraction). Determining the motility characteristics was aided by creating average time series images in B, and using two-color overlay plots to highlight new process extension/outgrowth (green), retracting processes (red), or stable processes (orange/yellow color from two-channel overlay). All motility characteristics suggested by the two-color overlay image were visually confirmed or rejected before inclusion (see Materials and methods for further details). For extending and retracting processes, the time of extension/retraction start and end is overlaid on the ∆F/F calcium trace.
Figure 3—video 1
Microglial calcium changes in the awake mouse and during 30 min isoflurane administration.
Figure 4
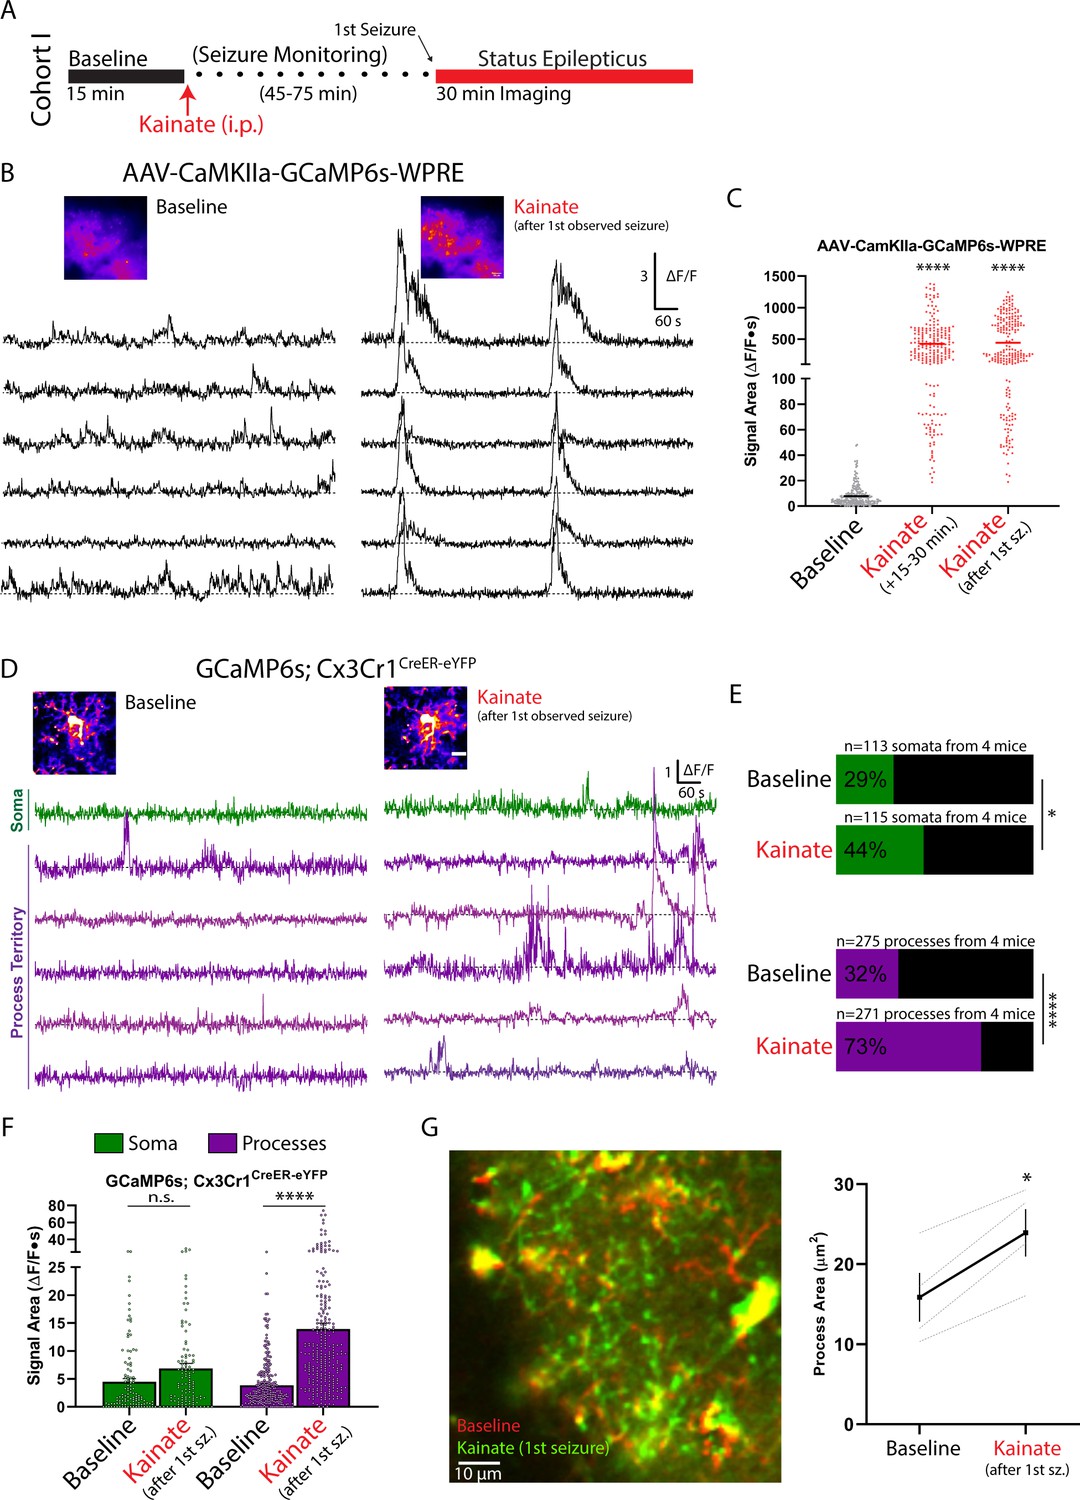
Increased microglial process calcium activity immediately following the observation of kainate-induced seizures.
(A) Outline of the experimental timeline. Mice experienced a first seizure 45–75 min after kainate injection, which marked the beginning of imaging during periods labelled as ‘kainate.’ (B–C) CaMKIIa excitatory neuronal calcium activity (AAV.CaMKIIa.GCaMP6s.WPRE transfection) in the somatosensory cortex before and after kainate administration. (B) Representative ∆F/F traces at baseline, and after the first observed generalized seizure (45–75 min after kainate). (C) Signal areas derived from CaMKIIa somata in layer II/III (1-Way ANOVA with Dunnett’s post-hoc comparison to baseline). (D-G) Microglial calcium activity (GCaMP6s;Cx3Cr1CreER-eYFP) in the awake animal at baseline and after the first kainate-induced generalized seizure. (D) Representative ∆F/F traces from a microglial cell using threshold-based ROI detection. (E) The percentage of active microdomains under each condition (Fisher’s exact test). (F) Summary of calcium signal area values at baseline and after the first generalized seizure (two-way ANOVA with post-hoc comparison between kainate and baseline), using the threshold-segmentation approach for quantification. (G) Two-color, average intensity images of microglial morphology at baseline and after kainate-induced seizures, suggesting overall process extension. Changes in process area are quantified between conditions (paired t-test). Scale bars: 50 µm (B), 10 µm (D). Grouped data represent the mean ± SEM; dots represent individual neuronal somata (C) or individual microdomains (F); dashed lines represent individual animals (G). N = 3 mice for neuronal calcium studies (B, C), N = 4 mice for microglial calcium studies (D–F); the number of microdomains surveyed is provided in (D). *p<0.05, ****p<0.0001.
-
Figure 4—source data 1
Microglial calcium activity during kainate status epilepticus.
- https://cdn.elifesciences.org/articles/56502/elife-56502-fig4-data1-v2.xlsx
Figure 5 with 4 supplements
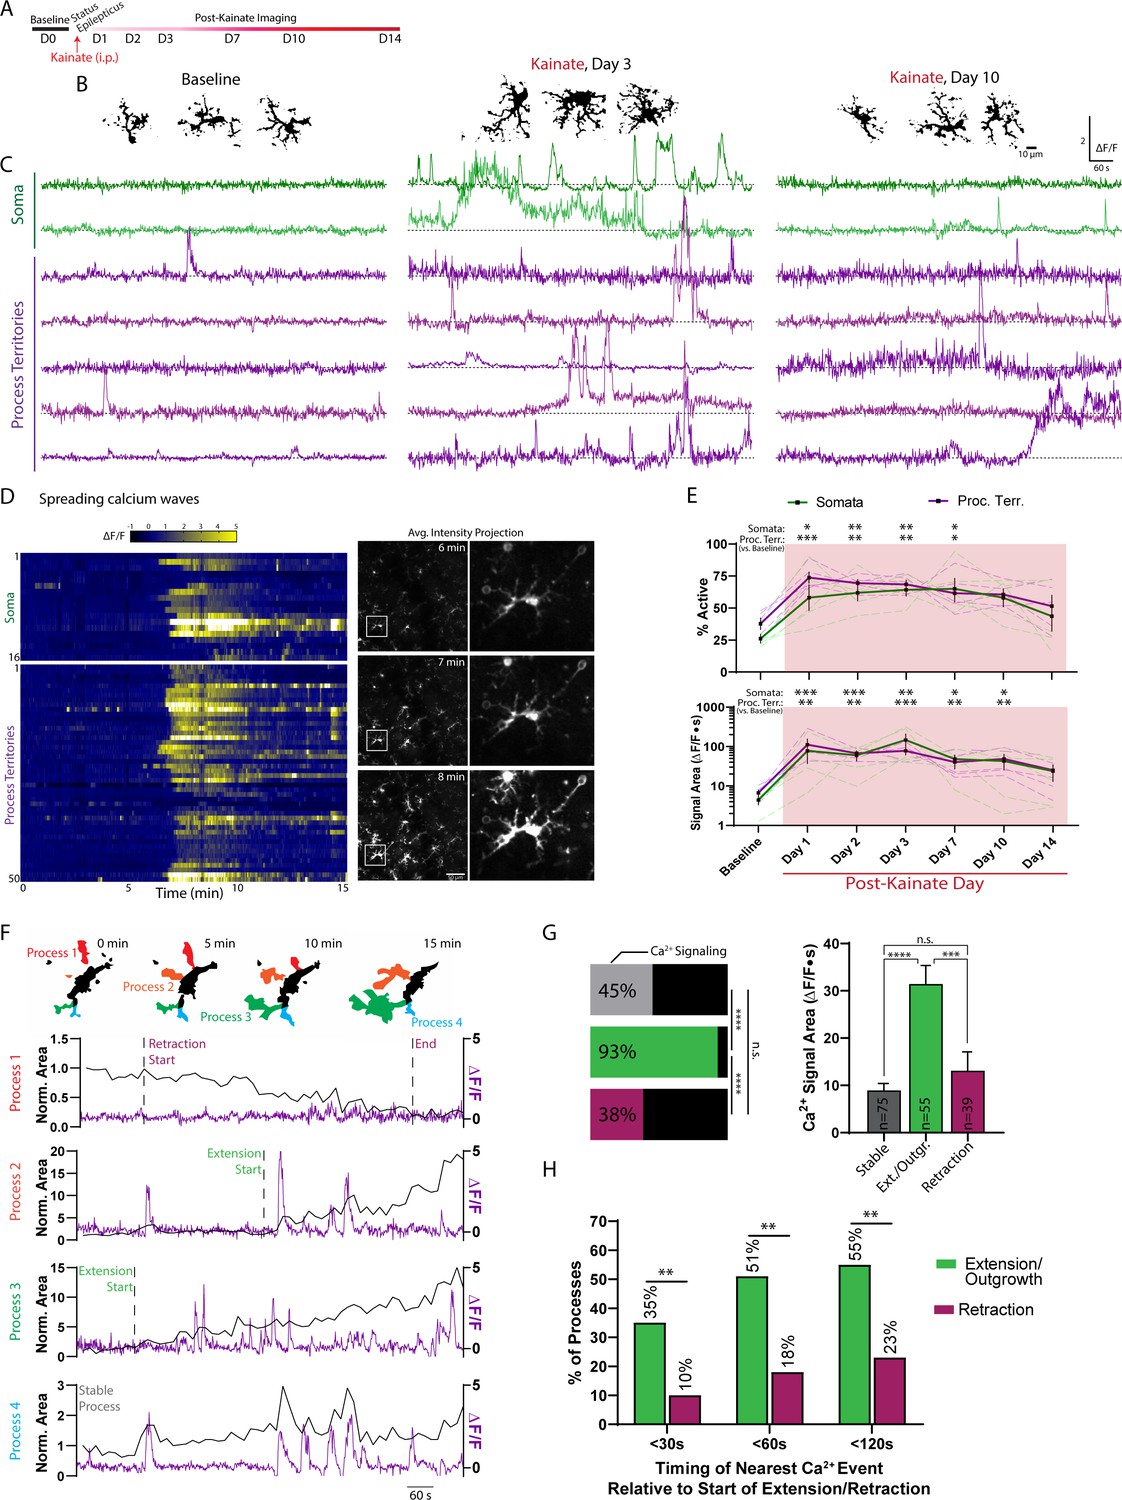
Kainate administration leads to longitudinal modulation of microglial calcium signaling.
(A) Timeline of experiment. (B) Representative images of microglia morphology at baseline and following kainate status epilepticus. See also: Figure 5—figure supplement 1. (C) ∆F/F traces of microglial somatic and process calcium activity, using the threshold-based approach to detect microglial process territories. (D) Heat map of a microglial spreading calcium wave one day after kainate status epilepticus. Each row represents activity from a soma or one of 50 threshold-segmented process territories surveyed across this single field of view and animal. See also: Figure 5—Video 1. Corresponding images of microglia across the whole field of view during the peak of wave activity, with a highlighted cell magnified. (E) Microdomains active and their signal areas (two-way ANOVA with Dunnett’s post-hoc vs. baseline). (F) Representative changes in microglial process area (black line; 15 s avg. intensity images) correlated with ∆F/F calcium activity (purple line). Changes in process area were used to denote the start and end of retraction or extension. See also: Figure 5—figure supplement 2. (G) Based upon these criteria, extending processes were more likely to have associated calcium activity than processes undergoing retraction or remaining stable (horizontal bars, Fisher’s exact test). Additionally, the calcium signals observed in extending processes were larger in magnitude (one-way ANOVA with Tukey’s post-hoc test; the number of sampled regions fitting each criterion is provided in the bar; mean ± SEM). See also: Figure 5—Video 2. (H) The percentage of processes exhibiting a calcium transient within a certain time window relative to the start of process extension or retraction. This analysis considers the closest temporally aligned calcium event preceding and/or following the start of extension/retraction (see methods for further details; survey of 55 extending processes and 39 retracting processes; Fisher’s exact test). Scale bar: 50 µm (D). N = 5 GCaMP6s;Cx3Cr1CreER-eYFP mice. Grouped data represent mean ± SEM; dashed lines represent individual animals (E). *p<0.05, **p<0.01, ***p<0.001.
-
Figure 5—source data 1
Longitudinal changes in microglial calcium activity following kainate status epilepticus.
- https://cdn.elifesciences.org/articles/56502/elife-56502-fig5-data1-v2.xlsx
Figure 5—figure supplement 1
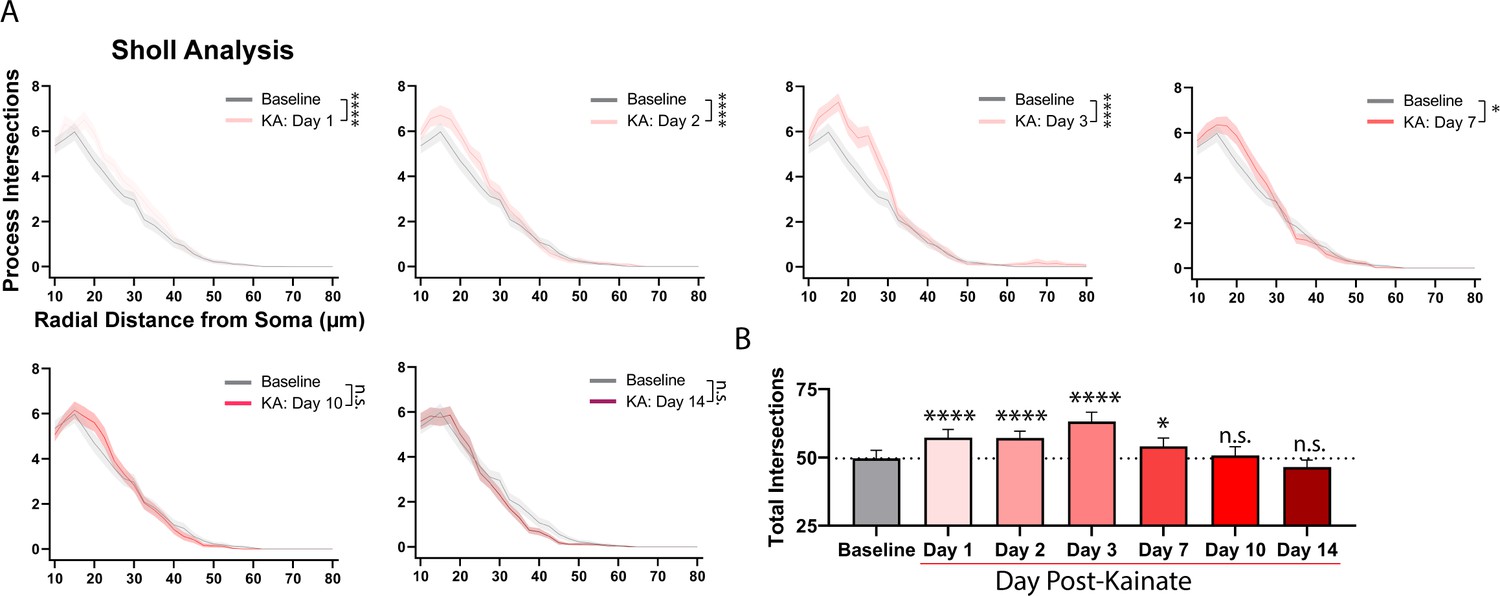
Full Sholl analysis quantification of morphology changes, related to panel 5B.
(A) Sholl analysis profiles of microglial morphology 1, 2, 3, 7, 10, and 14 days following kainate status epilepticus plotted against the baseline period (two-way ANOVA). (B) Summary of longitudinal changes in morphology created by summing the total number of branch point intersections determined by the Sholl analyses in (A). Data represent the mean ± SEM. 50 microglia surveyed from N = 5 mice at each time point. *p<0.05, ****p<0.0001; p-values represent the main effect of KA on morphology from two-way ANOVA analyses of Sholl distributions for each time period studied.
Figure 5—figure supplement 2

One day after kainate status epilepticus, process extension is closely coordinated with microglial calcium activity.
(A) A field of view showing microglial dynamics 1 day after kainate status epilepticus (red: beginning of video; green: end of video). (B–D) Example images of (B) a stable process, (C) extending processes, and (D) retracting processes from the full field of view in (A). Roman numerals in (A) correspond to cells in (B–D). ∆F/F calcium traces from the highlighted process (white arrow) along with the observed start and end of an extension or retraction event (vertical dotted lines). The relative timing of the nearest calcium event to the start of extension/retraction was used to create the dataset in Figure 5H. Note: stable processes would not have a start or end to motility and are therefore not included in any temporal analysis.
Figure 5—video 1
Spreading microglial calcium waves recorded 1 day after kainate status epilepticus.
Figure 5—video 2
Microglial process extension co-occurring with increased calcium activity.
Figure 6 with 2 supplements
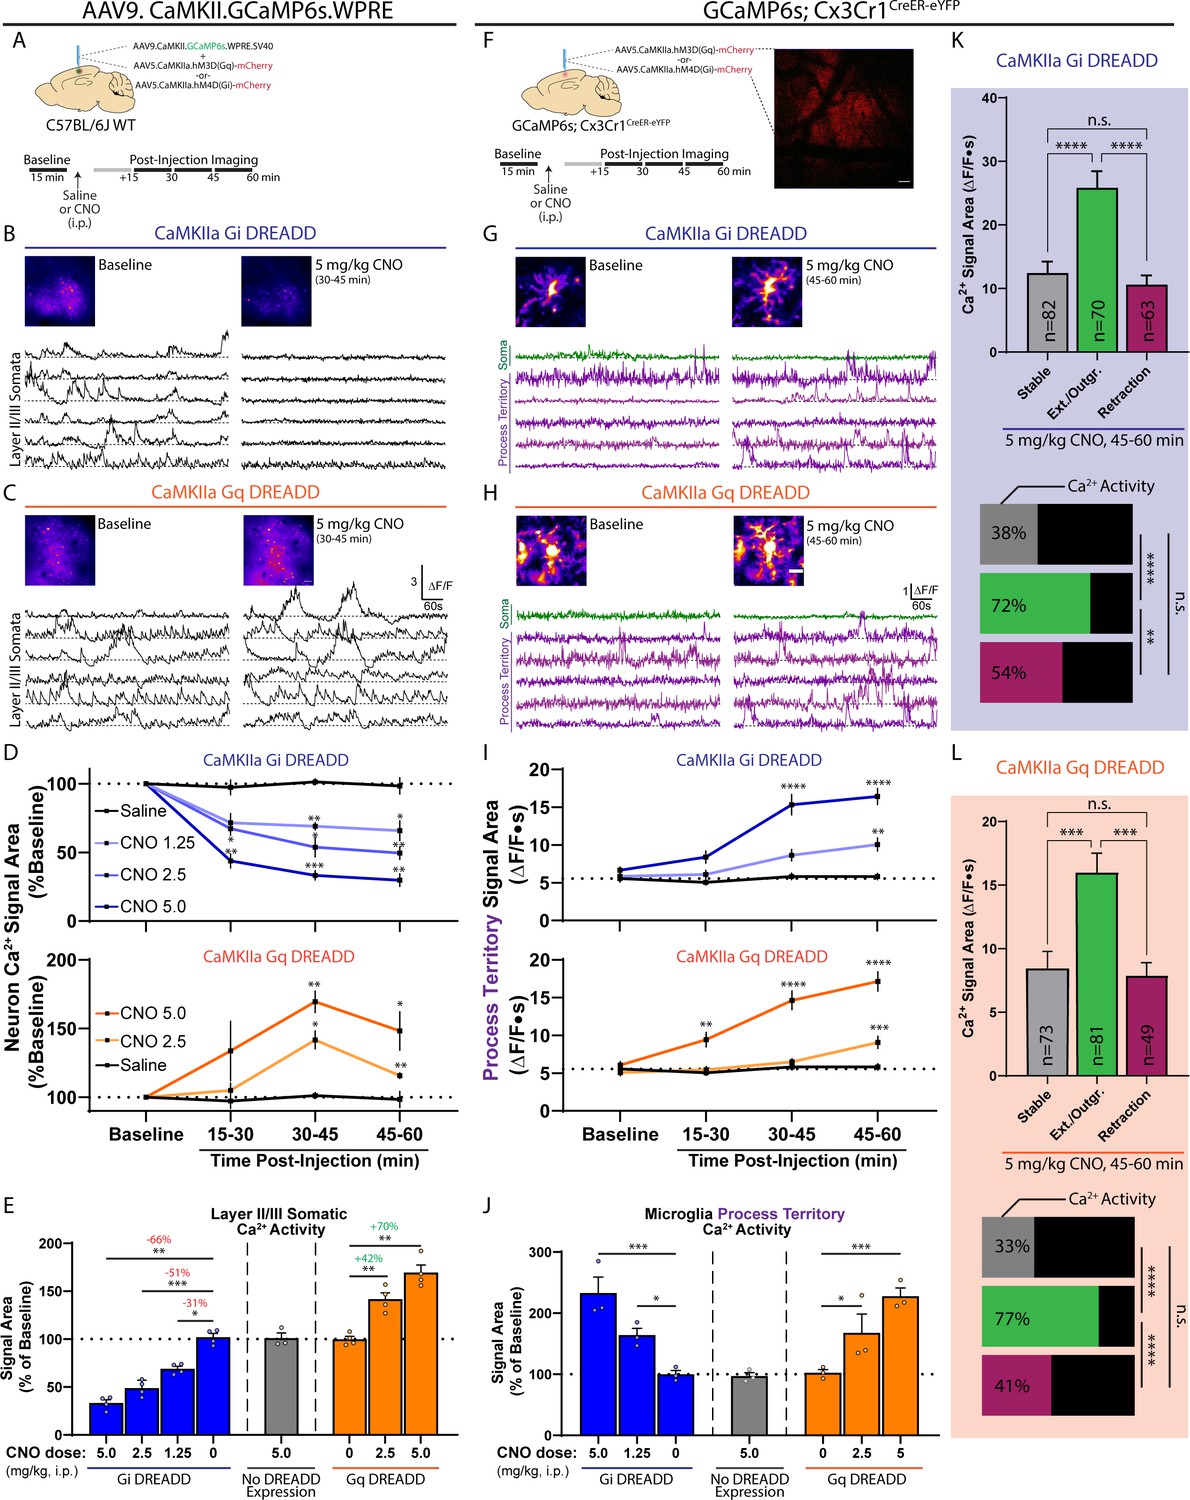
DREADD-based modulation of excitatory neuronal activity is sufficient to induce microglial calcium signaling.
(A) AAVs injected into the somatosensory cortex of WT mice in order to study DREADD-based changes in neuronal calcium activity (top). Experiment outline (bottom). (B–C) Representative ∆F/F traces of layer 2/3 CaMKIIa neuronal calcium activity at baseline and after CNO injection in the Gi (B) and Gq (C) systems. (D) Saline or CNO dose-dependent effects on neuronal calcium activity in the Gi and Gq systems over 15 min imaging periods (one-way ANOVA with Dunnett’s post-hoc comparison to saline). (E) Summary of DREADD-based effects on neuronal calcium activity (at the time of peak effect: 30–45 min post injection; two-way ANOVA with Dunnett’s post-hoc comparison to baseline). (F) Method to study DREADD-based changes in neuronal activity on microglial calcium signaling. mCherry expression served as a positive control for successful DREADD transfection. (G–H) Representative ∆F/F traces of microglial soma and process territory calcium activity at baseline and after CNO injection in the Gi (G) and Gq (H) systems. The threshold-based ROI approach was used to detect process regions. (I) Microglial process territory calcium activity in the Gi and Gq systems over 15 min imaging periods (one-way ANOVA with Dunnett’s post-hoc vs. saline). (J) Summary of DREADD-based effects on microglial process territory calcium activity (at the time of peak effect: 45–60 min post injection; two-way ANOVA with Dunnett’s post-hoc comparison to baseline). (K) The mean ± SEM calcium signal area is plotted for microglial process territories that remained stable, demonstrated new process outgrowth, or exhibited retraction 45–60 min after 5 mg/kg CNO injection in the Gi DREADD system (one-way ANOVA with Tukey’s post-hoc test; process sample size given in the bar). The percentage of processes exhibiting calcium activity by motility/structural characteristic is displayed in the horizontal bars (Fisher’s exact test). (L) The same analyses as performed in (K) for the Gq DREADD system (see Figure 6—figure supplement 1 for more detail). Scale bars: 50 µm (B, C, and F), 10 µm (G-H). (A-E) N = 8 WT mice, N = 4/8 receiving AAV-CaMKIIa-hM4D(Gi) and N = 4/8 receiving AAV-CaMKIIa-hM3D(Gq). (F-J) N = 6 GCaMP6s;Cx3Cr1CreER-eYFP mice, half receiving Gq or Gi DREADD. Grouped data represent mean ± SEM; dots represent individual animals (E, J). *p<0.05, **p<0.01, ***p<0.001, ****p<0.0001. See also: Figure 6—Video 1.
-
Figure 6—source data 1
Microglial calcium activity during Gi and Gq DREADD activation in CaMKIIa neurons.
- https://cdn.elifesciences.org/articles/56502/elife-56502-fig6-data1-v2.xlsx
Figure 6—figure supplement 1
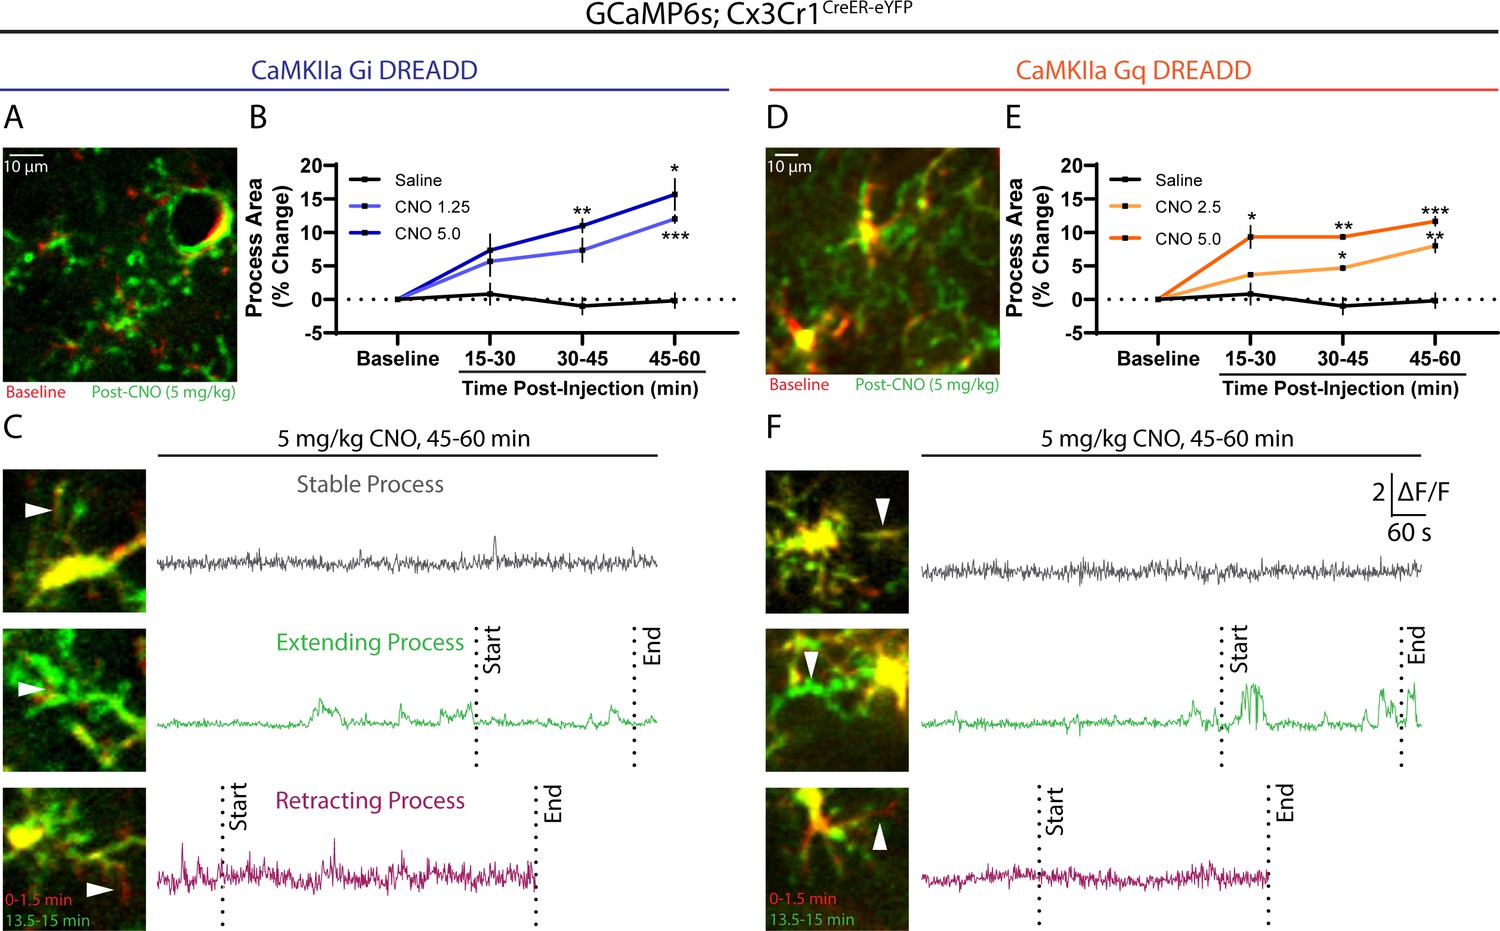
CaMKIIa Gi and Gq activation results in microglial process extension and coordinated process calcium activity.
(A) A field of view with multiple microglia under awake baseline (red) and 45-60 min following Gi DREADD activation (green). (B) Quantification of the microglial process area across imaging periods (mean and SEM). (C) Examples of stable, extending, or retracting processes and their calcium activity 45-60 min after CNO injection. For extending and retracting processes, the time of extension/retraction start and end is overlaid on the ∆F/F calcium trace. (D) A field of view with multiple microglia under awake baseline (red) and 45-60 min following Gq DREADD activation (green). (E) Quantification of the microglial process area across imaging periods (mean and SEM). (F) Examples of stable, extending, or retracting processes and their calcium activity 45-60 min after CNO injection. For extending and retracting processes, the time of extension/retraction start and end is overlaid on the ∆F/F calcium trace. *p<0.05, **p<0.01, ***p<0.001; one-way ANOVA with Dunnett's post-hoc comparison to baseline.
Figure 6—video 1
Microglial calcium activity at baseline and following CNO administration in Gi and Gq systems.
Figure 7
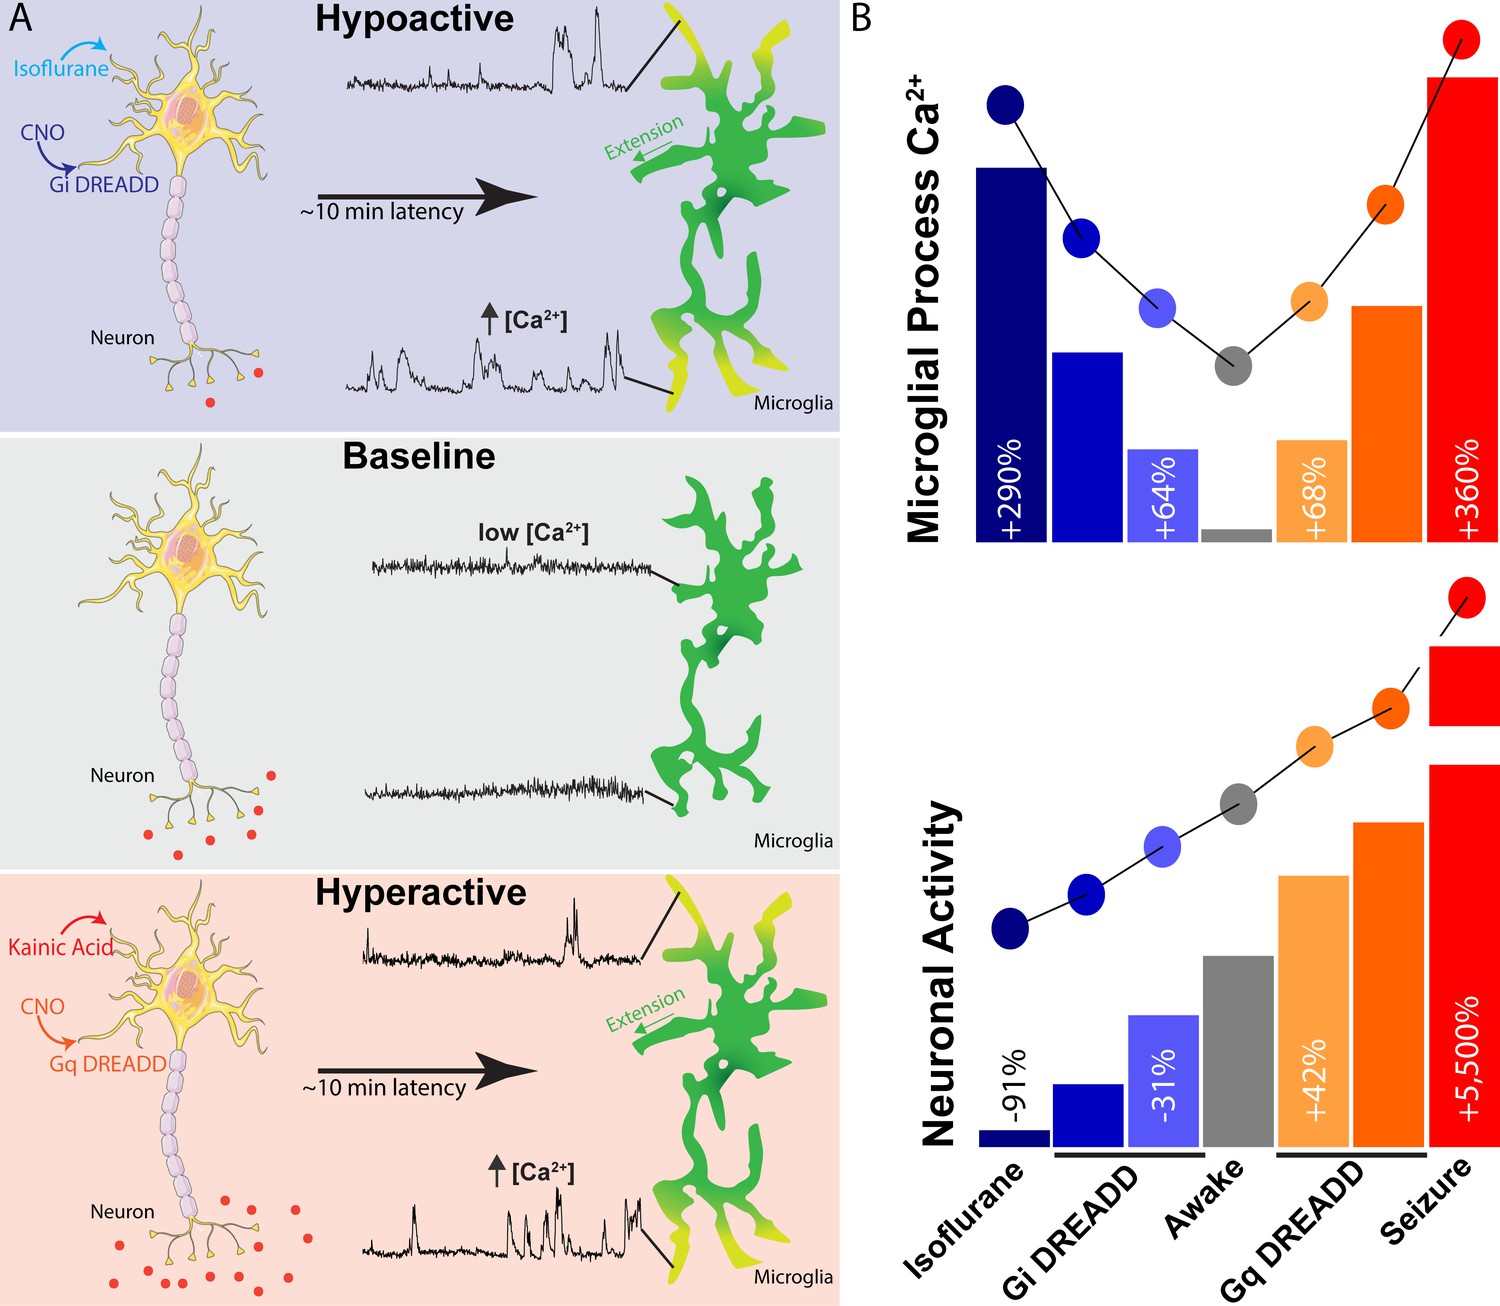
Summary of findings and observed relationship between neuronal activity and microglial calcium signaling.
(A) During ‘baseline’ levels of neuronal activity in the awake mouse (middle panel), microglia demonstrate the lowest level of process calcium activity. However, shifts towards neuronal hypoactivity (isoflurane or Gi DREADD activation, top panel) or hyperactivity (kainate or Gq DREADD activation, bottom panel), result in microglial process extension and increased process calcium signaling after a multi-minute latency. (B) A near-linear range of neuronal activity (recorded as cortical layer II/III somatic calcium activity; bottom) results in a U-shaped curve of microglial process calcium increases (top panel). These data represent the average signal areas recorded across experiments.
Author response image 1
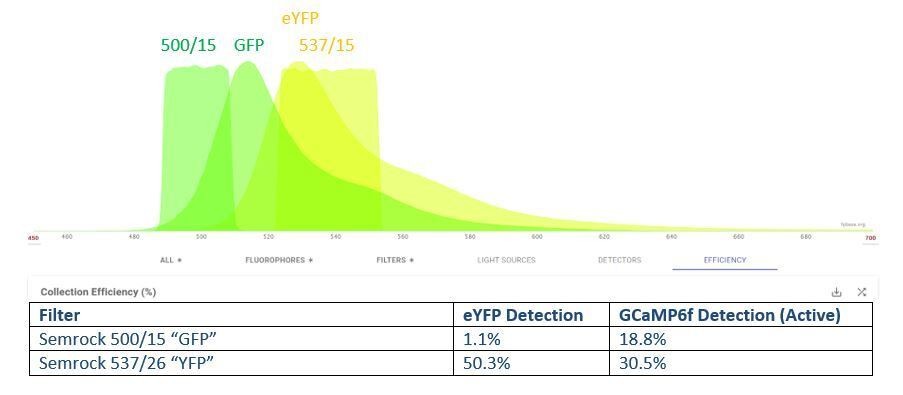
Estimated collection efficiency of GCaMP6 and eYFP with a “GFP/YFP” filter set.
Our initial approach to split these close spectra resulted in stronger GCaMP fluorescence in the YFP channel than the GFP channel and resulted in significant signal attenuation. Note that GCaMP6s was not an available fluorophore option, so GCaMP6f bound to calcium was used instead.
Author response image 2
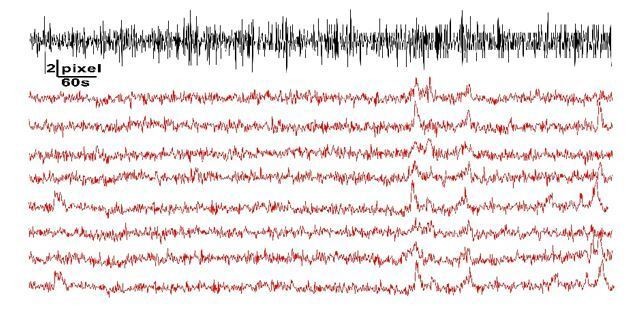
Exploring movements and potential erroneous calcium detection.
Adapted from Figure 1E, we do not see that frame-by-frame shifts (black line, pixel displacement detected by registration plugin) correlates with increases in calcium activity.
Author response image 3
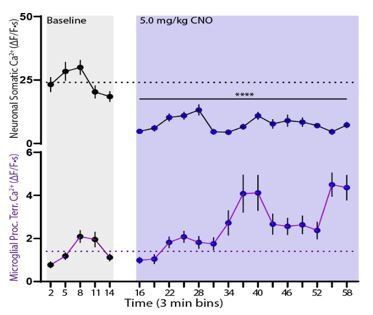
Minute-by-Minute relationship between microglial calcium activity and neuronal activity changes.
An example of breaking down neuronal calcium activity (top) into 3 min bins correlated with changes in microglial calcium activity. Neuronal calcium changes are significant as soon as 15 min after injection. Significant microglial changes are first detected 33 min after injection, suggesting a ~15 min latency between the two. These significant changes are sustained for the remainder of the recording.
Author response image 4
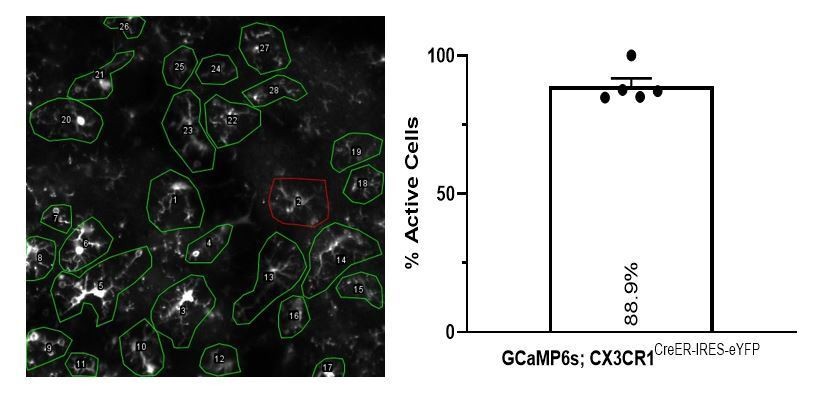
Longitudinal survey of active microglia in the kainate cohort.
(Left) The survey method was used to observe any clear calcium event within any part of a cell (green outline) or confirm no observable event in the 15-minute recording (red outline). This example image can also be watched as Figure 5—video 1: Spreading Calcium Wave. In recordings from another day, the inactive cell (#2, red outline) did show somatic calcium activity, suggesting the cell did have GCaMP expression when studied longitudinally. (Right) Percentage of microglia exhibiting calcium activity within one 300 x 300 µm region surveyed over six days (performed across N=5 mice).
Tables
Key resources table
| Reagent type (species) or resource | Designation | Source or reference | Identifiers | Additional information |
|---|---|---|---|---|
| Strain, strain background (M. musculus; male and female) | C57BL/6J | Jackson labs | #016962 | |
| Strain, strain background (M. musculus; male and female) | CX3CR1CreER-IRES-eYFP | Jackson labs | #021160 | |
| Strain, strain background (M. musculus; male and female) | GCaMP6s (cytosolic) | Jackson labs | #024106 | |
| Strain, strain background (M. musculus; male and female) | Lck-GCaMP6f | Jackson labs | #029626 | |
| Transfected construct (M. musculus) | pENN.AAV.CaMKII.GCaMP6f.WPRE.SV40 | Addgene | Cat #: 105537-AAV9; RRID:Addgene_100834 | |
| Transfected construct (M. musculus) | pAAV.CaMKIIa.hM3D(Gq)-mCherry | Addgene | Cat #: 50476-AAV5; RRID:Addgene_50476 | |
| Transfected construct (M. musculus) | pAAV.CaMKIIa.hM4D(Gi)-mCherry | Addgene | Cat #: 50477-AAV5; RRID:Addgene_50477 | |
| Chemical compound, drug | Clozapine N-Oxide | Cayman | Cat #: 16882 | |
| Chemical compound, drug | Isoflurane | Terrell | Cat #: 66794-019-10 | |
| Chemical compound, drug | Kainic acid | Tocris | Cat #: 0222 | |
| Chemical compound, drug | Tamoxifen chow | Envigo | Cat #: TD.130856 | |
| Software, algorithm | Excel | Microsoft | ||
| Software, algorithm | ImageJ | NIH | Java 1.8.0_172 | |
| Software, algorithm | Prism | GraphPad | Version 8 | |
| Other | 5.2 mm Headplate | Neurotar | Model 2 | |
| Other | Closed-loop temperature controller | Physitemp | TCAT-2DF | Used during isoflurane imaging |
| Other | VivoScope Galvo Multiphoton | Scientifica | ||
| Other | Mai-Tai DeepSee | Spectra-Physics | MAI TAI HP DS | 2-P laser |
| Other | Mobile HomeCage | Neurotar | Cat #: NTR000289-01 | Air table for in vivo imaging |
| Other | UMP3 Ultra Micro Pump | WPI | Cat #: UMP3-4 | Used in AAV delivery |
Additional files
Download links
A two-part list of links to download the article, or parts of the article, in various formats.
Downloads (link to download the article as PDF)
Open citations (links to open the citations from this article in various online reference manager services)
Cite this article (links to download the citations from this article in formats compatible with various reference manager tools)
Microglial calcium signaling is attuned to neuronal activity in awake mice
eLife 9:e56502.
https://doi.org/10.7554/eLife.56502


