Inherent regulatory asymmetry emanating from network architecture in a prevalent autoregulatory motif
- Program in Systems Biology, University of Massachusetts Medical School, United States
- Department of Microbiology and Physiological Systems, University of Massachusetts Medical School, United States
- Max Planck Institute for the Physics of Complex Systems, Germany
Figures
Figure 1
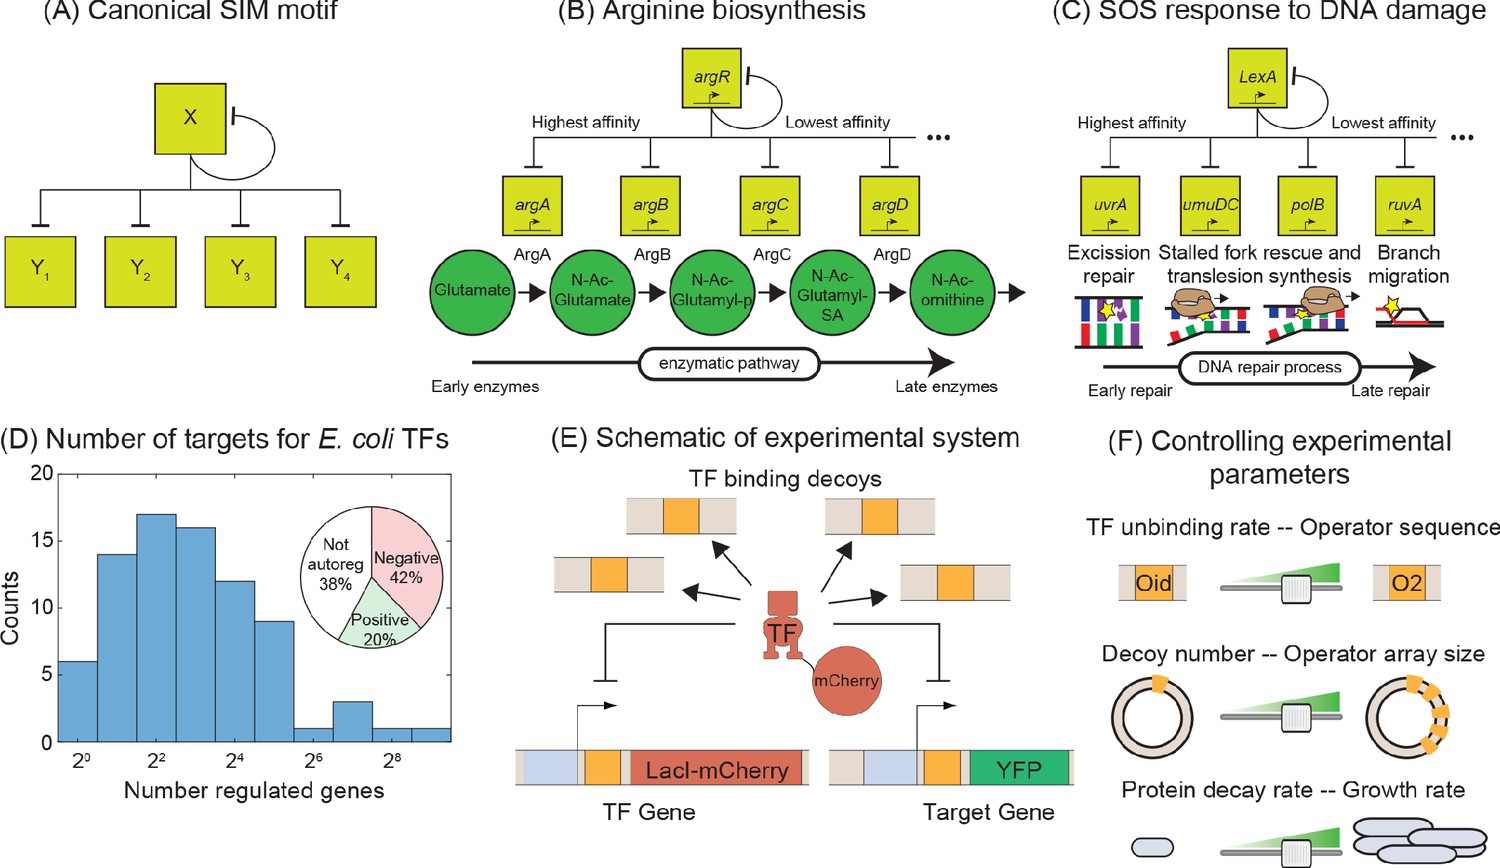
Synthetic approach to exploring the negative SIM motif.
(A) Schematic of a canonical SIM motif: A single TF regulates itself and several other genes. (B and C) Examples of SIM motifs in E. coli. (B) ArgR is a transcriptional regulator of arginine biosynthesis. It auto-regulates itself and genes involved in different steps of arginine biosynthesis with precision in expression starting from the first enzyme of the pathway down to the last. This precise ordering is thought to originate from a corresponding ordering in TF-binding affinities of the target genes. (C) LexA is the master regulator of SOS pathway and is actively degraded in response to DNA damage. LexA auto-represses itself and represses a set of other genes involved in DNA repair. In this case, the early response genes have low affinity for the repressor while the late acting genes have high affinity, enabling temporal ordering of the response. (D) Histogram showing the number of known regulated genes for every TF in E. coli. Inset shows different modes of regulation of the TF genes. 62% of the TF genes are autoregulated with 42% negatively autoregulated and 20% positively auotregulated. (E) Schematic of the experimental model of a SIM motif used in this study. Here, LacI-mCherry is the model TF and YFP is the protein product of the target gene. Decoys sites are used to control the network size by simulating the demand of other target genes in the SIM motif. (F) Representation of the tunable parameter space detailed in this study. We can systematically tune the TF unbinding rate, number of decoys and protein degradation rate in the experimental system and adjust these parameters accordingly in simulations.
Figure 2
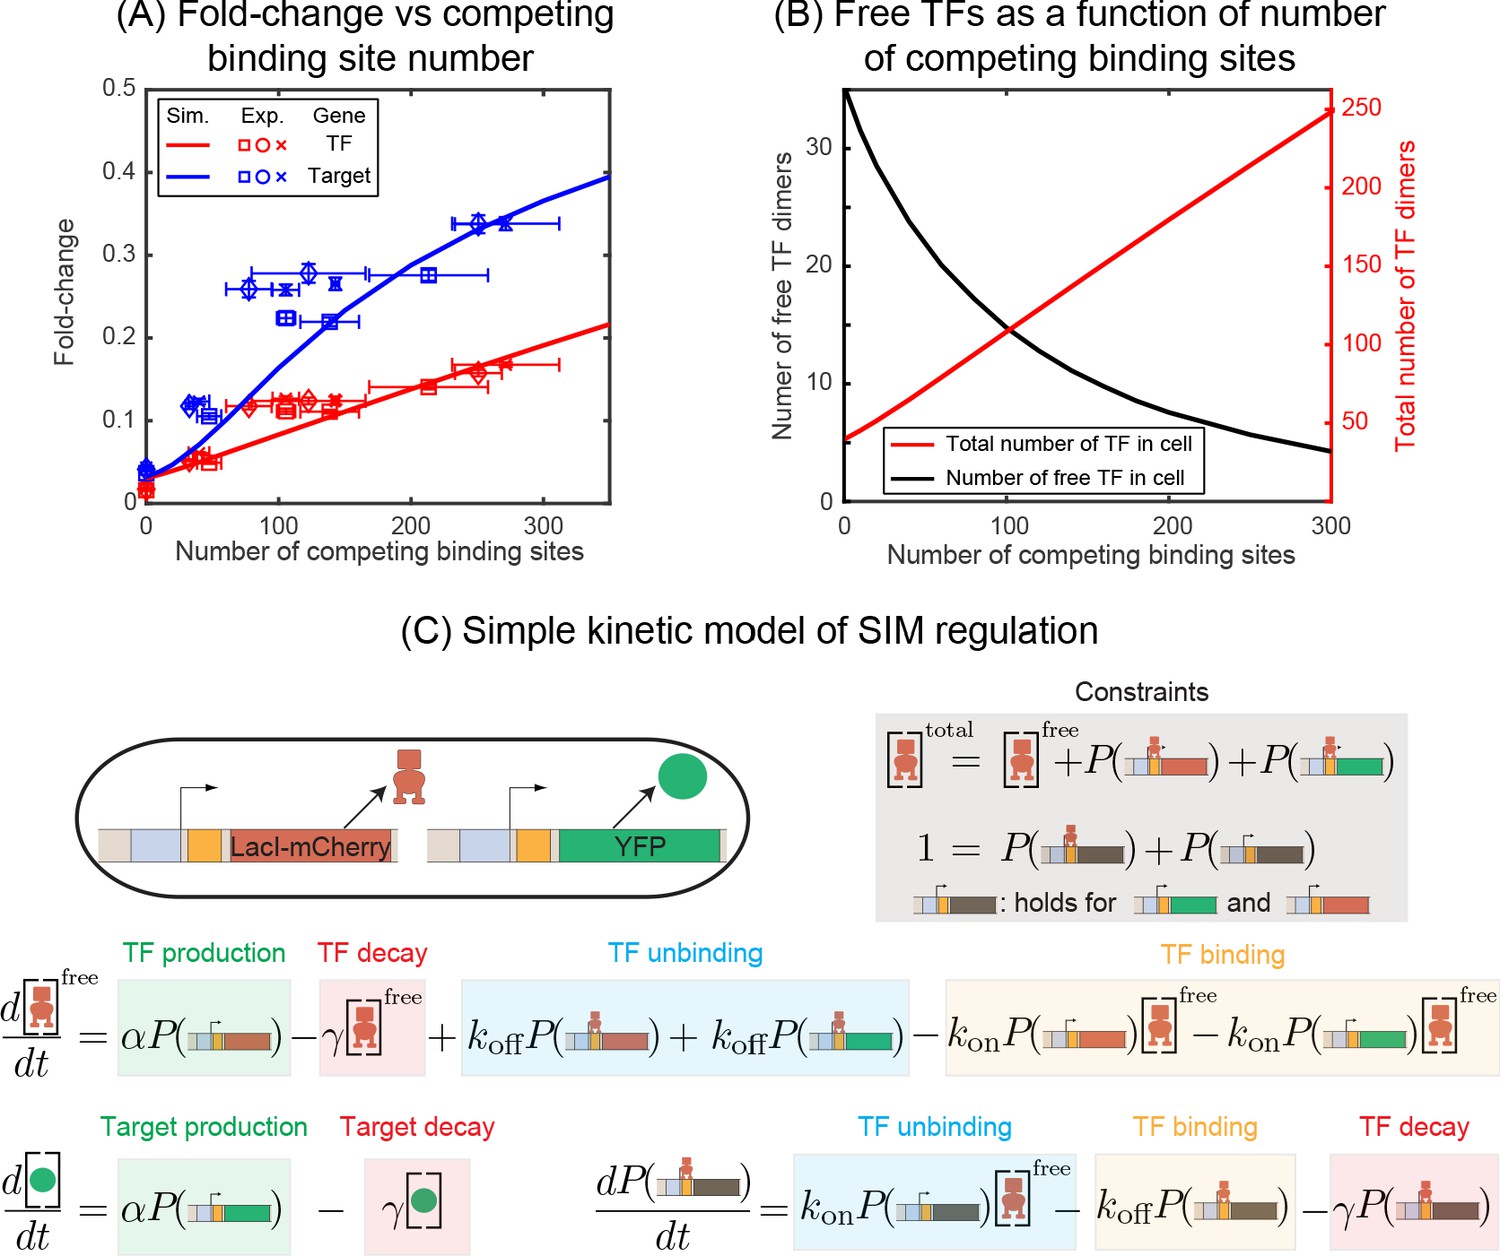
Fold-change in target and TF genes with network size.
(A) Fold-change in the expression level of both the autoregulated gene (red) and the TF's target gene (blue) as a function of the number of competing binding sites present. Simulation data is shown as solid curves. Different symbols represent independent biological replicates. Each data point in y-axis is the bootstrapped mean of individual decoy strains and the error bars represent the standard deviation of bootstrapped mean. Each data point in x-axis is the mean of three technical replicates and the error bar is the corresponding standard deviation. (B) Increasing the number of competing binding sites increases the expression of both the TF (red line) and target genes by lowering the overall number of free TFs (black line). (C) Simple kinetic model describing the SIM motif using mass action equilibrium kinetics. For compactness of the figure, the reactions involving the decoy binding sites, dimerization/dedimerization of TF monomers, and transcription steps are not shown. Full reactions of the model are described in Appendix 6.
Figure 3
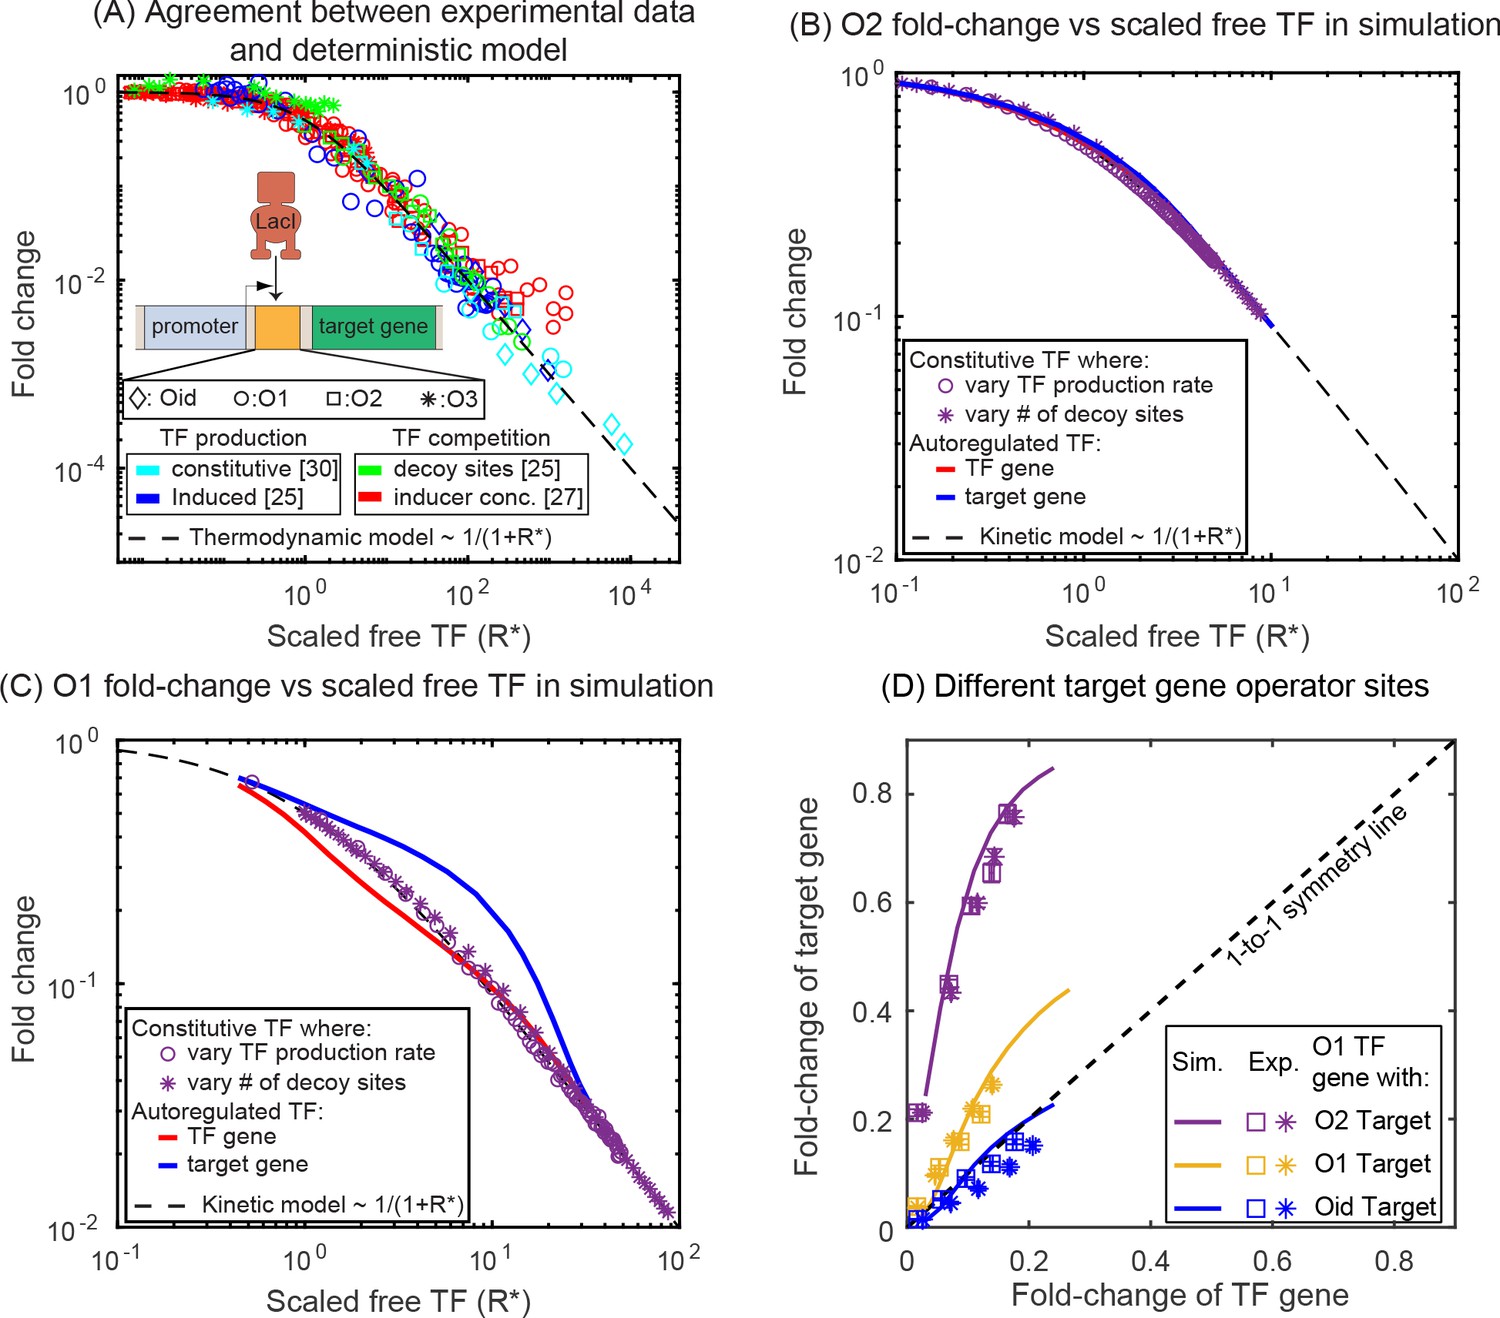
Comparison of SIM motif fold-change data to deterministic model predictions.
(A) Fold-change vs scaled free TF in the thermodynamic model for a collection of simple repression data (open circles) where free TF is controlled through a diverse range of mechanisms. The data collapse to the deterministic model predictions (dashed curve). (B–C) Fold-change vs scaled free TF in simulations using the actual free TF obtained from simulation. The data for a constitutive expressed TF where free TF is varied by changing TF production rate (purple circles) or number of decoy sites (purple stars) collapses to the deterministic solution, however, the regulation of genes in the SIM motif (target: red line, TF gene: blue line) both diverge from the deterministic solution in opposing ways, giving rise not only to asymmetry but also a disagreement with deterministic modeling for both genes. (D) Fold-change in the target gene versus fold-change in the TF gene. Each data point is the bootstrapped mean of fold-change in TF and target expression across hundreds of cells with a given number of competing binding sites and error bars represent the standard deviation of the bootstrapped mean. Different symbols represent independent biological replicates. In all cases, the TF gene is regulated by an O1 binding sites, whereas the target is regulated by (in order of weakest binding to strongest binding): O2 (purple), O1 (yellow) or Oid (blue). Simulation data is shown as solid curves.
-
Figure 3—source data 1
Summary of results for fold-change in TF and target gene.
The fold-change values listed here correspond to the values plotted in Figure 3D. Data presented here is a bootstrapped mean of fold-change in TF and target expression across hundreds of cells with a given number of competing binding sites and error bars represent the standard deviation of the bootstrapped mean.
- https://cdn.elifesciences.org/articles/56517/elife-56517-fig3-data1-v2.xlsx
Figure 4
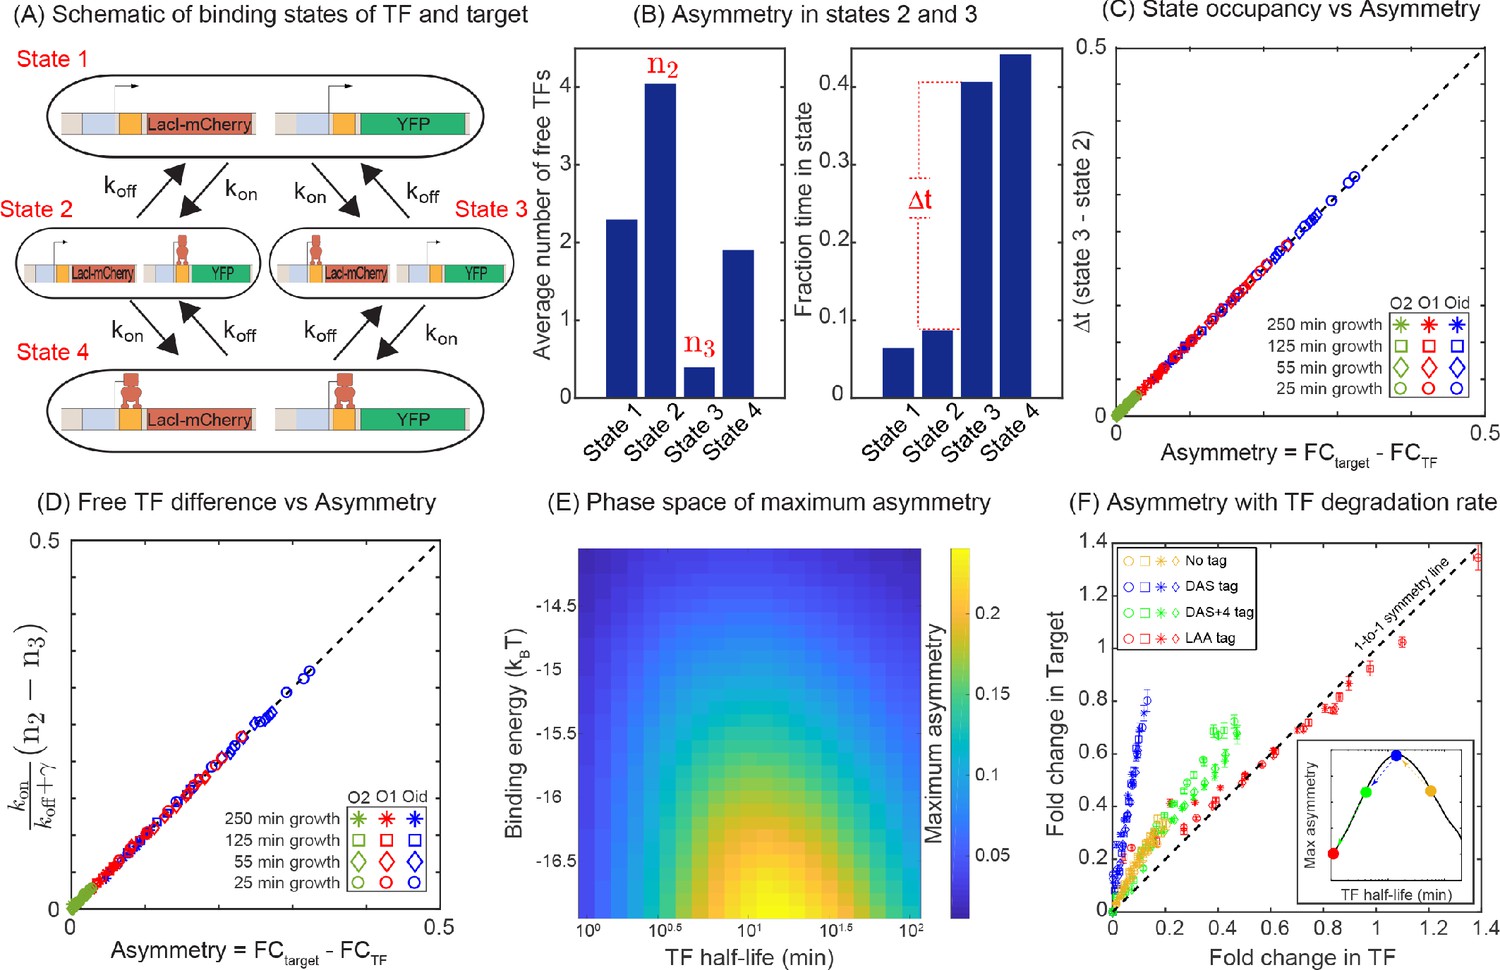
Mechanism of regulatory asymmetry.
(A) Schematic of the TF-operator occupancy with their corresponding transition rates. The for transition from state 1 to state 2 or state 3 will be identical and hence cannot account for the asymmetry. State 2 and state 3 on the other hand, will encounter a difference in the free TF concentration and hence the for transition from one of these states to state 4 will be different; thus, accounting for the asymmetry in expression between the TF and the target. (B) Plot showing the average number of free TFs in different states and fraction of time cells spends in each of the given state in the simulation. (C) Plot showing asymmetry as a function of fractional time difference between state 2 and state 3. (D) Plot showing asymmetry as a function of difference in free TF concentration between state 3 and state 2. (E) Heat map showing the phase space of maximum asymmetry as a function of binding affinity for the TF and its half-life. (F) Tuning the TF degradation rate influences the extent of asymmetry observed in the SIM module. Yellow points corresponds to the system with no degradation tags; Blue points corresponds to degradation by a ‘weak’ or ‘slow’ tag (DAS tag with a rate of 0.00063 per min per enzyme); Green points corresponds to a slightly faster tag (DAS + 4 with a rate of 0.0011 per min per enzyme ); Red points corresponds to a very fast tag (LAA tag with a rate of 0.21 per min per enzyme ). Different symbols represent independent biological replicates.
-
Figure 4—source data 1
Summary of results for strains expressing TFs with different degradation rates.
The fold-change values listed here correspond to the values plotted in Figure 4F. Fold-change is calculated for TF and target genes in each individual cell and binned according to the fold-change in TF gene. Mean values presented here is the bootstrapped mean of all cells that fall within a given bin. Standard deviation corresponds to the error in the bootstrapped mean of a given bin.
- https://cdn.elifesciences.org/articles/56517/elife-56517-fig4-data1-v2.xlsx
Figure 5
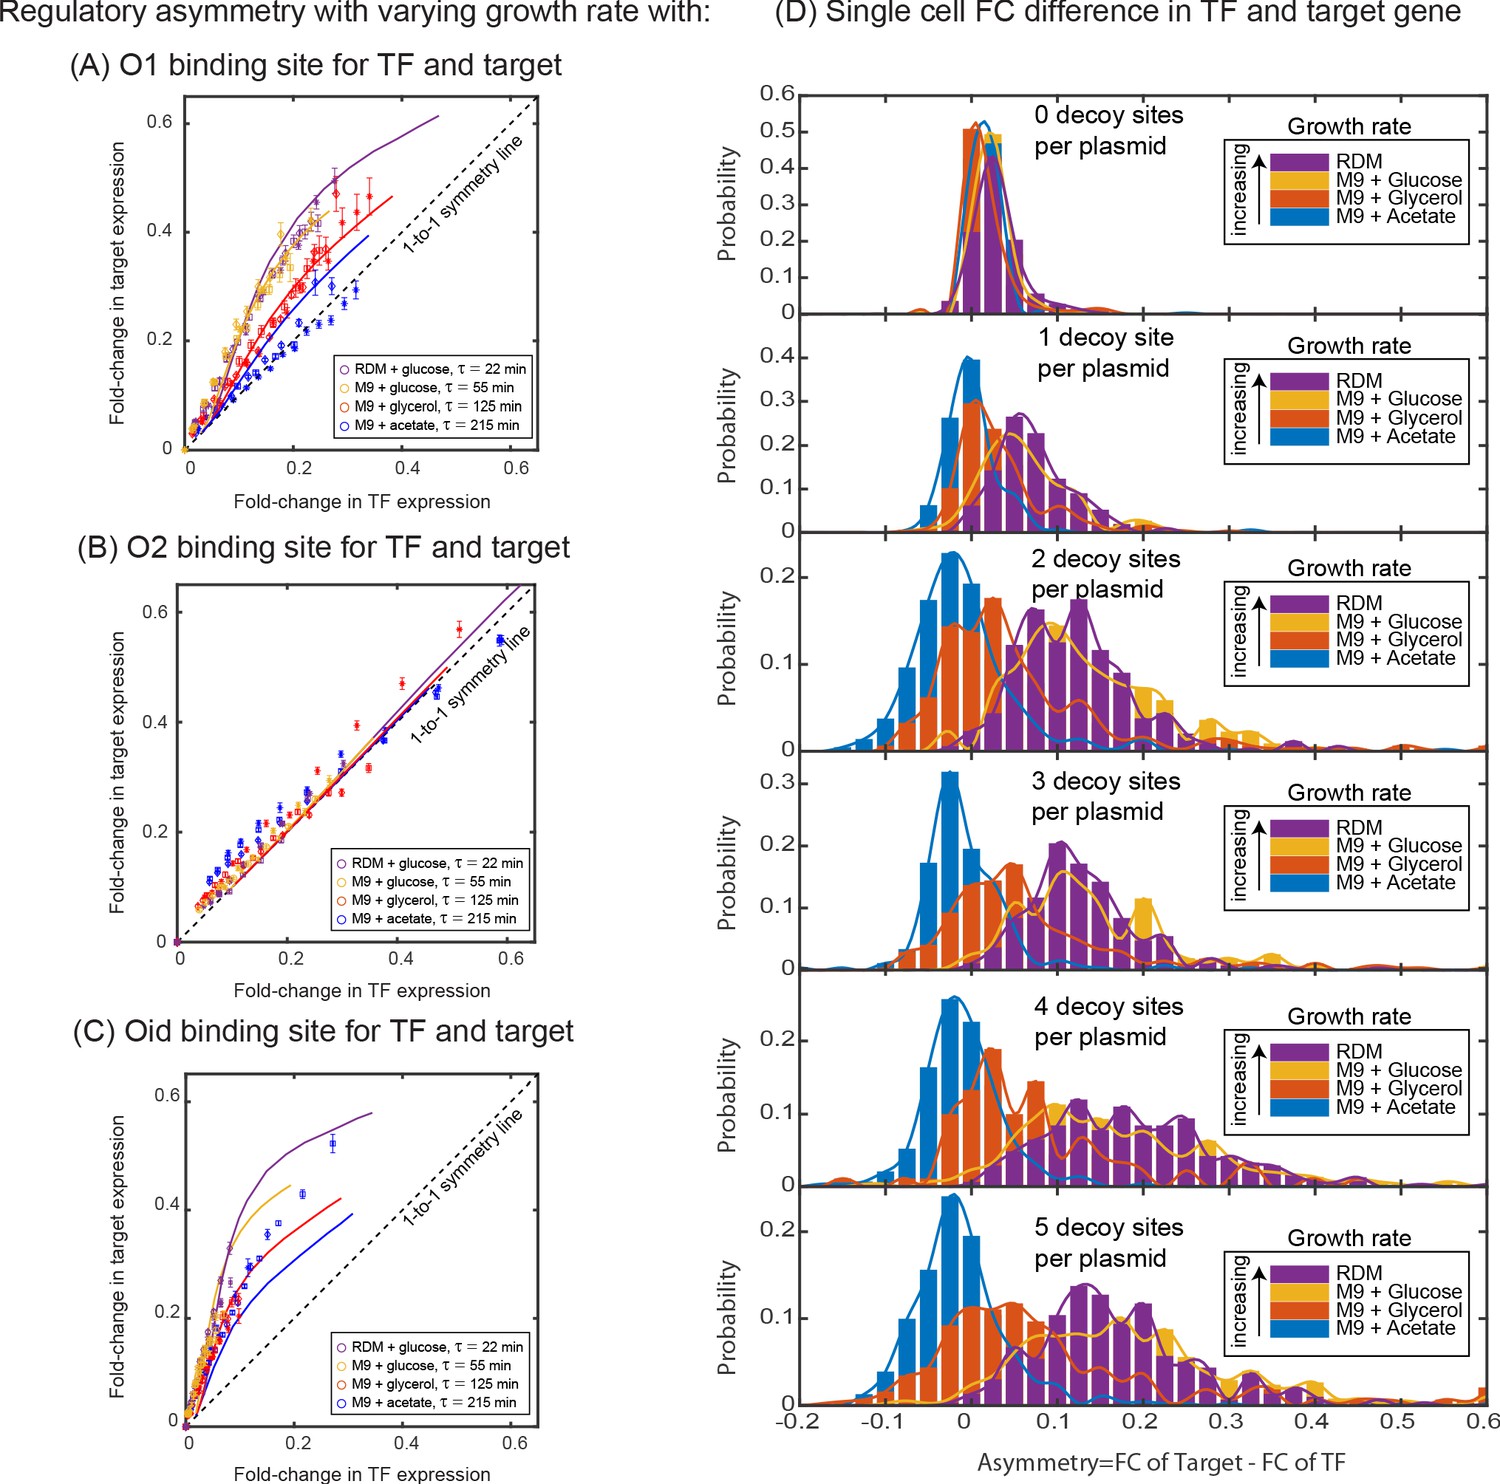
Dependence of regulatory asymmetry on growth rate.
Measurement of asymmetry in different media as a function of TF binding energy: O1 (A), O2 (B), Oid (C). The division time (τ) is varied between 22 min up to 215 min. (A) For O1, the asymmetry decreases with slower division rates and agrees well with the simulation predictions. (B) For the weak O2 site, no asymmetry is seen at any growth rate. (C) For the strongest site, Oid asymmetry is present at every growth rate although the magnitude of asymmetry still orders roughly by growth rate. Different symbols represent independent biological replicates and simulation data are shown as solid curves. (D) Histograms of single-cell asymmetry in expression of the TF and target gene regulated by O1 binding site in these four growth rates. Solid lines represent the interpolated distributions for better visualization of the histograms. Panels from top to bottom represent increasing the level of competition for the TF.
-
Figure 5—source data 1
Summary of results for strains grown under different physiological conditions.
The fold-change values listed here correspond to the values plotted in Figure 5A-C. Fold-change is calculated for TF and target genes in each individual cell and binned according to the fold-change in TF gene. Mean values presented here is the bootstrapped mean of all cells that fall within a given bin. Standard deviation corresponds to the error in the bootstrapped mean of a given bin.
- https://cdn.elifesciences.org/articles/56517/elife-56517-fig5-data1-v2.xlsx
Appendix 1—figure 1
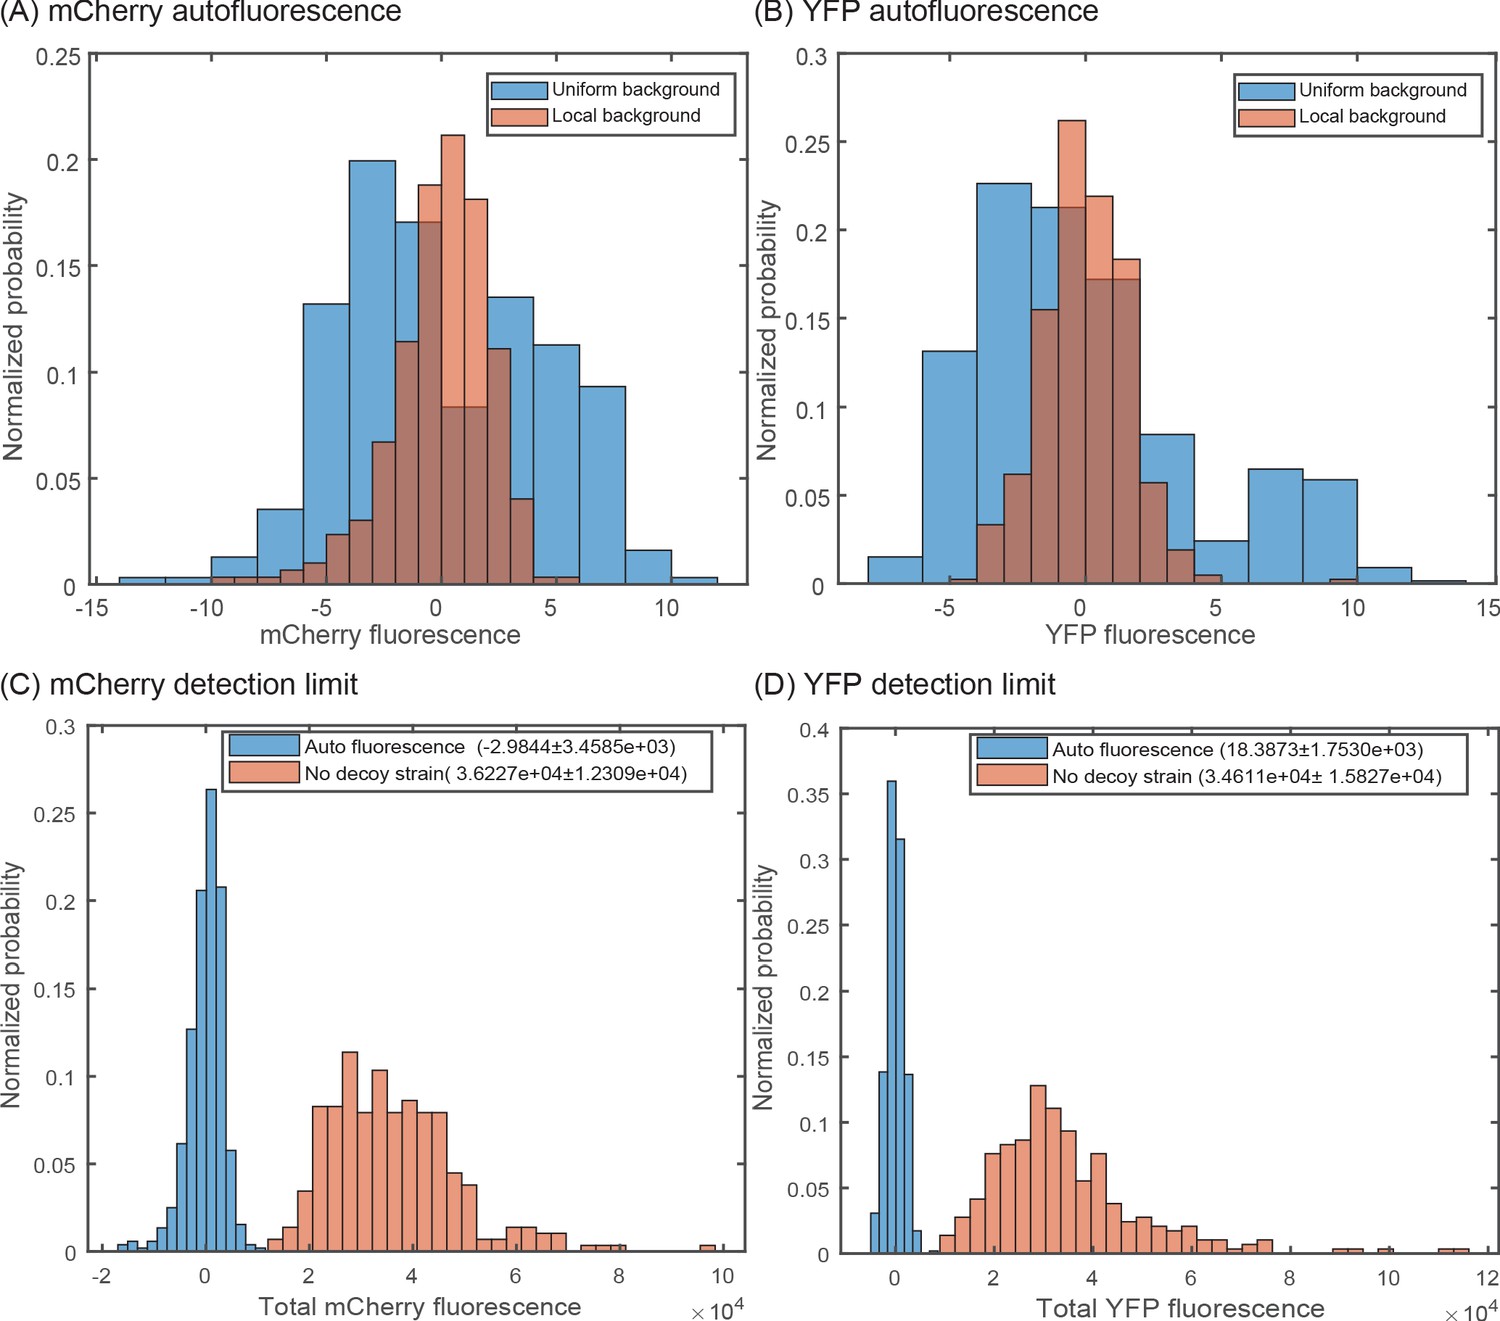
Accounting for local variation in background fluorescence.
Histogram of single-cell autofluorescence levels of (A) mCherry or (B) YFP fluorescence in a strain without the YFP and mCherry casettes. The blue bars are calculated as the fluorescence level subtracted from the average across the entire sample (nine different fields of view). The red bars are calculated by first removing the local background fluorescence from cells at each position before subtracting the remaining signal from the average. The wide distribution seen in the blue bars is owed largely to local differences in background fluorescence and is removed by accounting for position-to-position variability. (C,D) Histogram showing the minimal detection limit (in a no decoy strain) for mCherry (C) and YFP (D) compared to an autofluorescence strain.
Appendix 2—figure 1
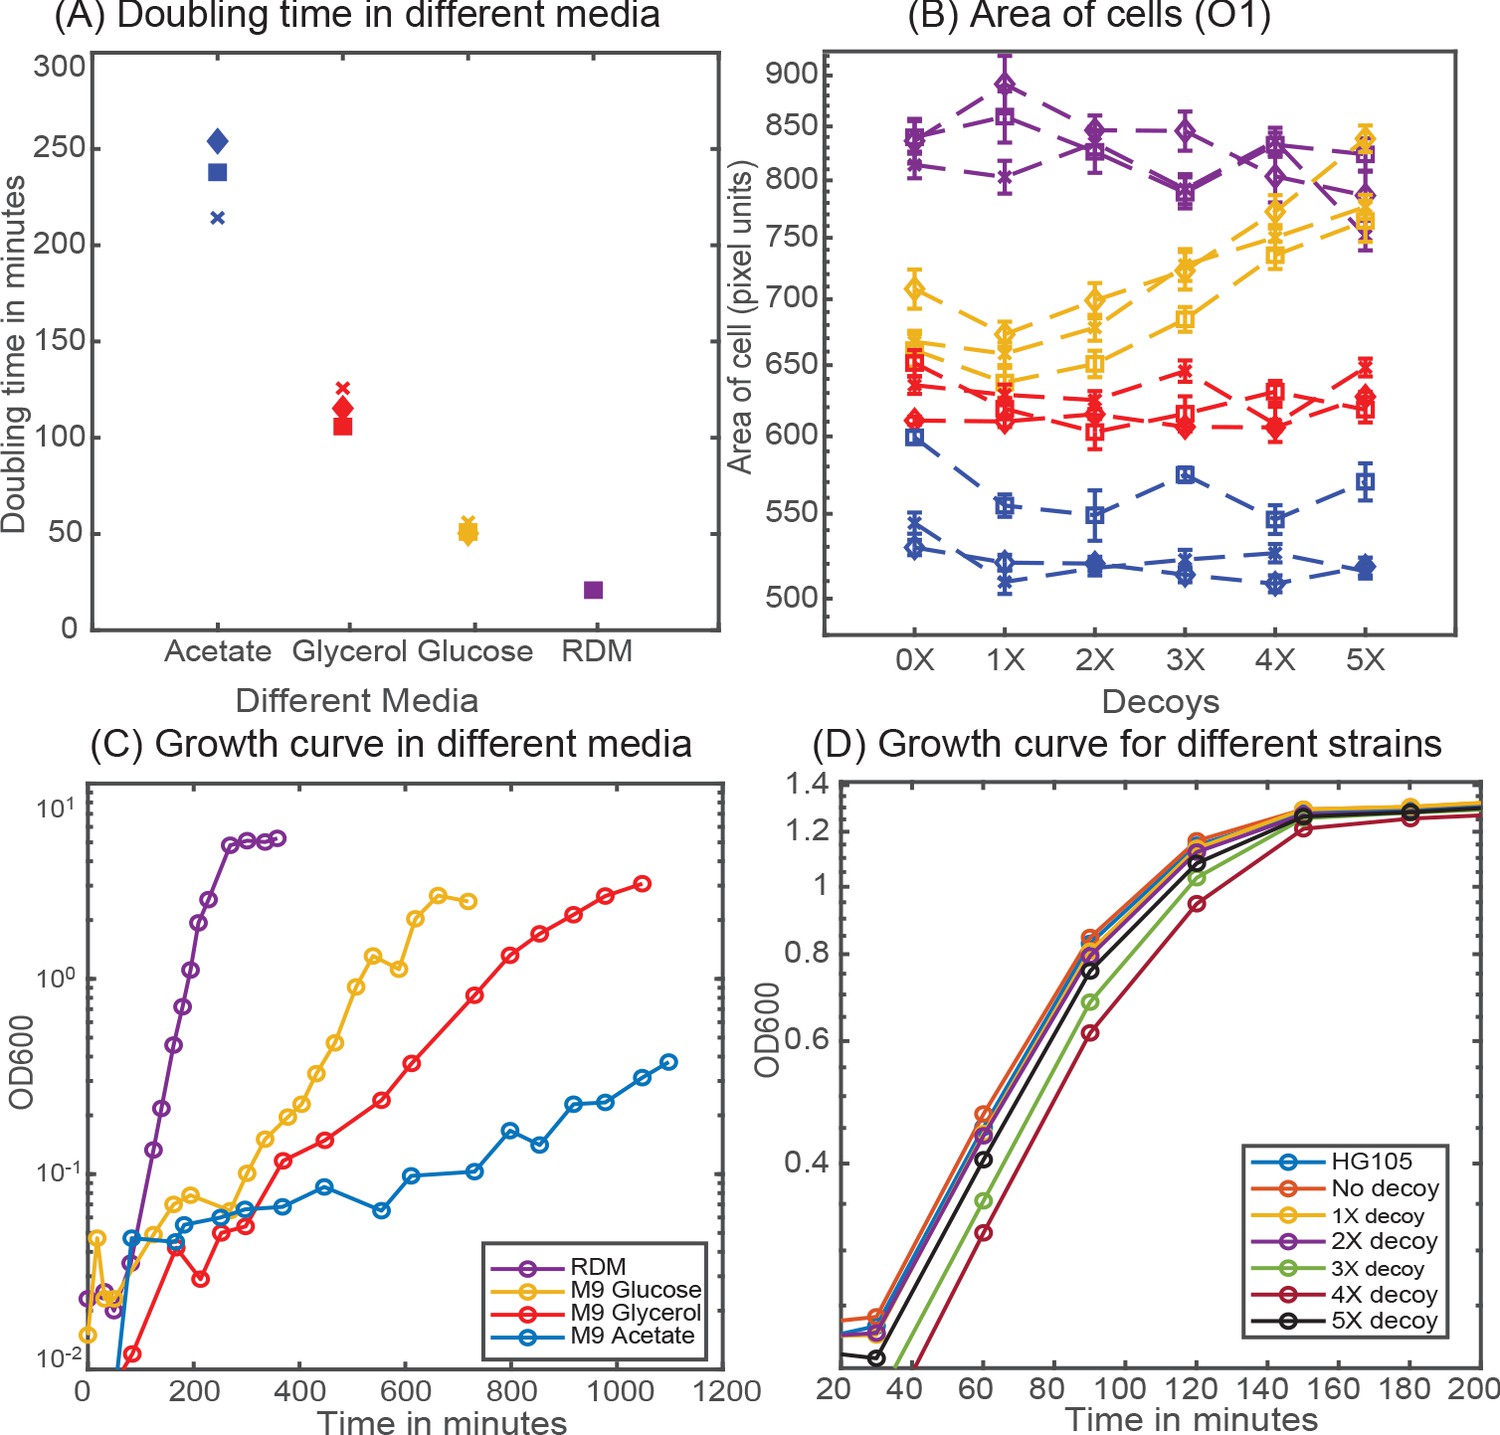
Cellular physiology in different media.
(A) Doubling time of HG105 in different media used in this study. (B) Consistent with the literature there is a scaling of cell area in different media in accordance with their growth rate. Strains with 4X and 5X decoys growing in glucose minimal media have a drastically different cell area. (C) Plot showing the growth curves for the strain HG105 grown in M9-minimal media with glucose, glycerol and acetate or in rich-defined media. (D) Plot showing the growth curves in rich-defined media for strains carrying in different decoy plasmid. Cells are grown in TECAN machine (maintained at 37°C) in a 96-well plate with constant shaking and measurements are made every 30 min.
Appendix 3—figure 1

Quantification of plasmid copy number.
(A) Copy number of decoy array plasmids measured in M9-Glucose minimal media. (B) Number of molecules obtained per qPCR reaction remains constant across different decoy strains (1X, 2X, 3X, 4X, 5X). (C) Number of Colony Forming Units (CFU) per mL used to normalize the number of molecules to account for the copy number of plasmids per cell.
Appendix 4—figure 1
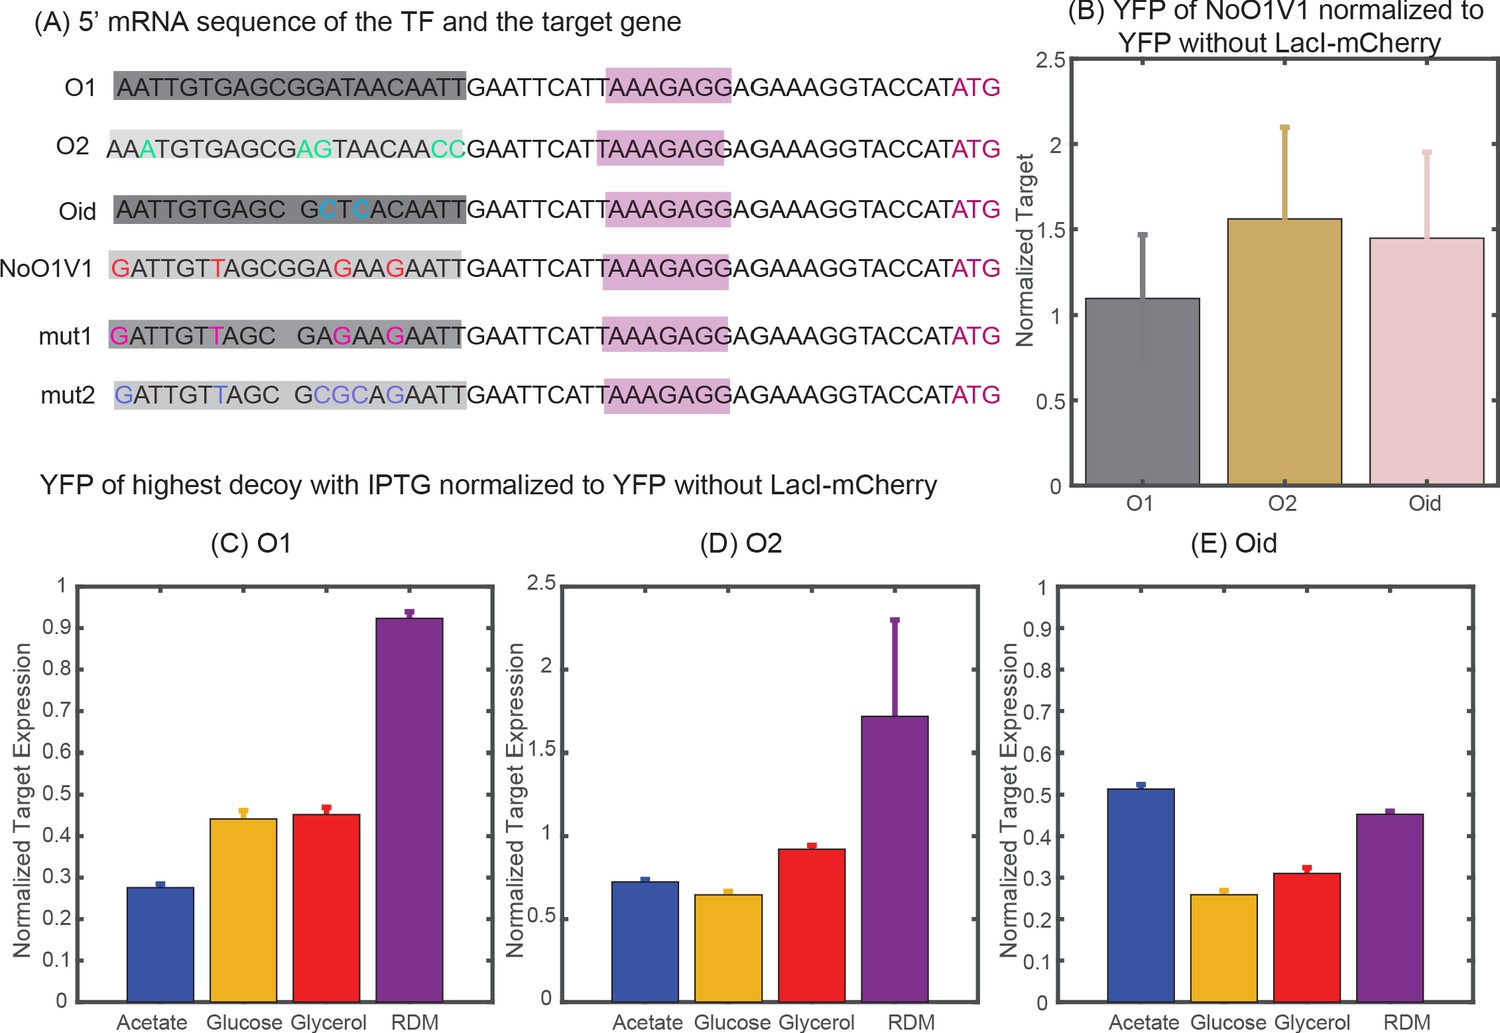
Determining constitutive expression of YFP and mCherry.
(A) 5′ mRNA sequence of the TF and the target genes. The binding site for the TF is carried in the mRNA sequence and is highlighted in shaded dark grey boxes with base changes for different binding sites coded in multicolor. mut1 and mut2 are the two variant binding sites that are designed with mutations similar to NoO1V1 but with Oid site length. However, such changes do not achieve constitutive unregulated expression similar to O2 or Oid. (B) Plot showing YFP expressed from NoO1V1 regulated promoter normalized to YFP expressed from promoter regulated with O1, O2 or Oid. (C-E) Plot showing the effect of 2.5 mM IPTG in relieving YFP expression form O1 (C), O2 (D) or Oid. (E) Regulated promoter and with 5X decoy plasmids. As indicated in the plot IPTG is not sufficient to restore complete expression of YFP in different media and hence cannot be used as a measure of constitutive expression.
Appendix 5—figure 1
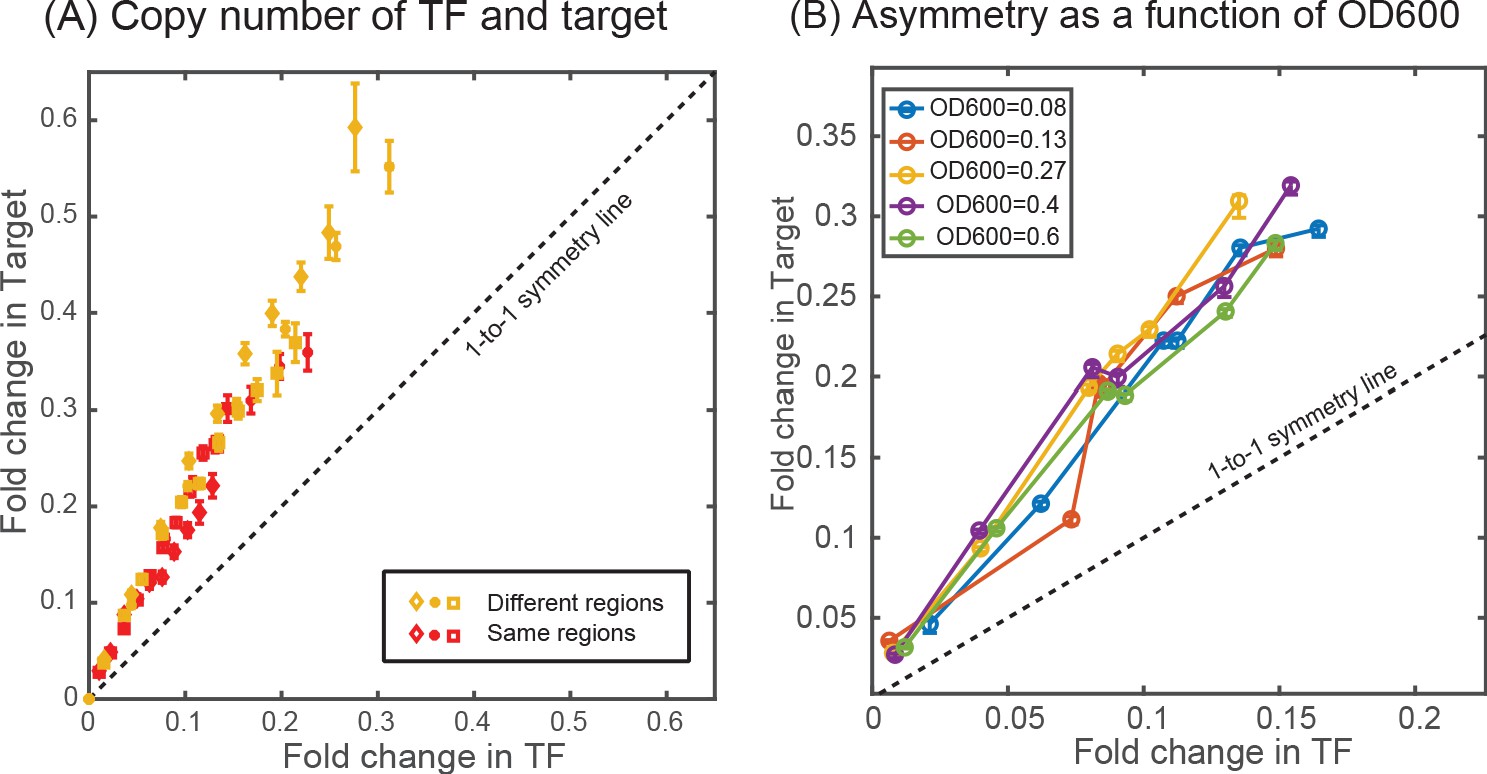
Effect of copy number difference on asymmetry.
Comparison of asymmetry in strain where the TF and the target genes are located either at two different regions of the chromosome (ybcN for TF and galK for target, shown in yellow data points) or when it is present together in the chromosome (at the gspI locus, shown in red data points). (B) Plot showing the measurement of asymmetry in glucose-minimal media at different optical density (OD600) in the exponential phase.
Appendix 6—figure 1
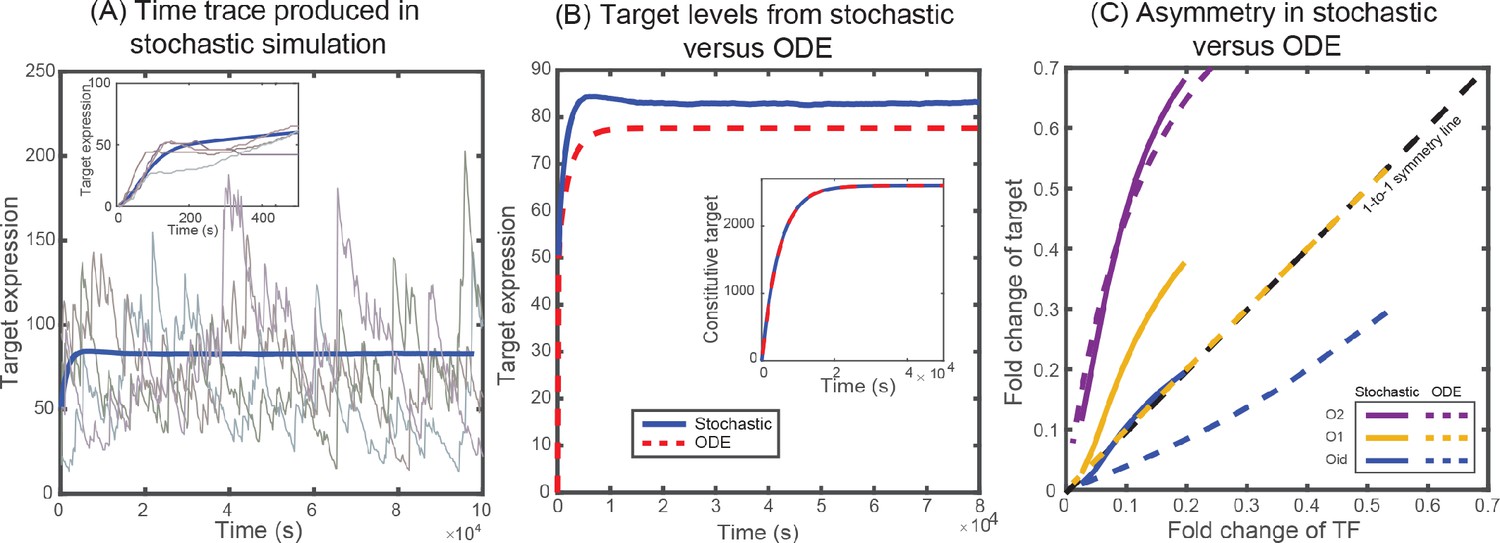
Solutions from stochastic simulation and from deterministic ODEs.
(A) Representative time traces of target expression in individual cells (grey shades) from stochastic simulations. Blue solid line represents the mean behavior averaged over 5 × 10⁴ iterations. Inset shows the transient behavior. (B) Plot showing the average target expression in the negative SIM motif from stochastic simulations (solid line) and from solving deterministic ODEs (dashed line). Inset shows that when regulation is removed the average levels are identical for stochastic and deterministic models. (C) Plot showing the asymmetry between TF and target expression from using either stochastic simulation (solid lines) or solving deterministic ODEs (dashed lines). The TF is always regulated by O1 binding site, whereas the target is regulated by O1 (yellow), O2 (purple) or Oid (blue) binding sites. The black dashed line represents line of no asymmetry.
Appendix 6—figure 2
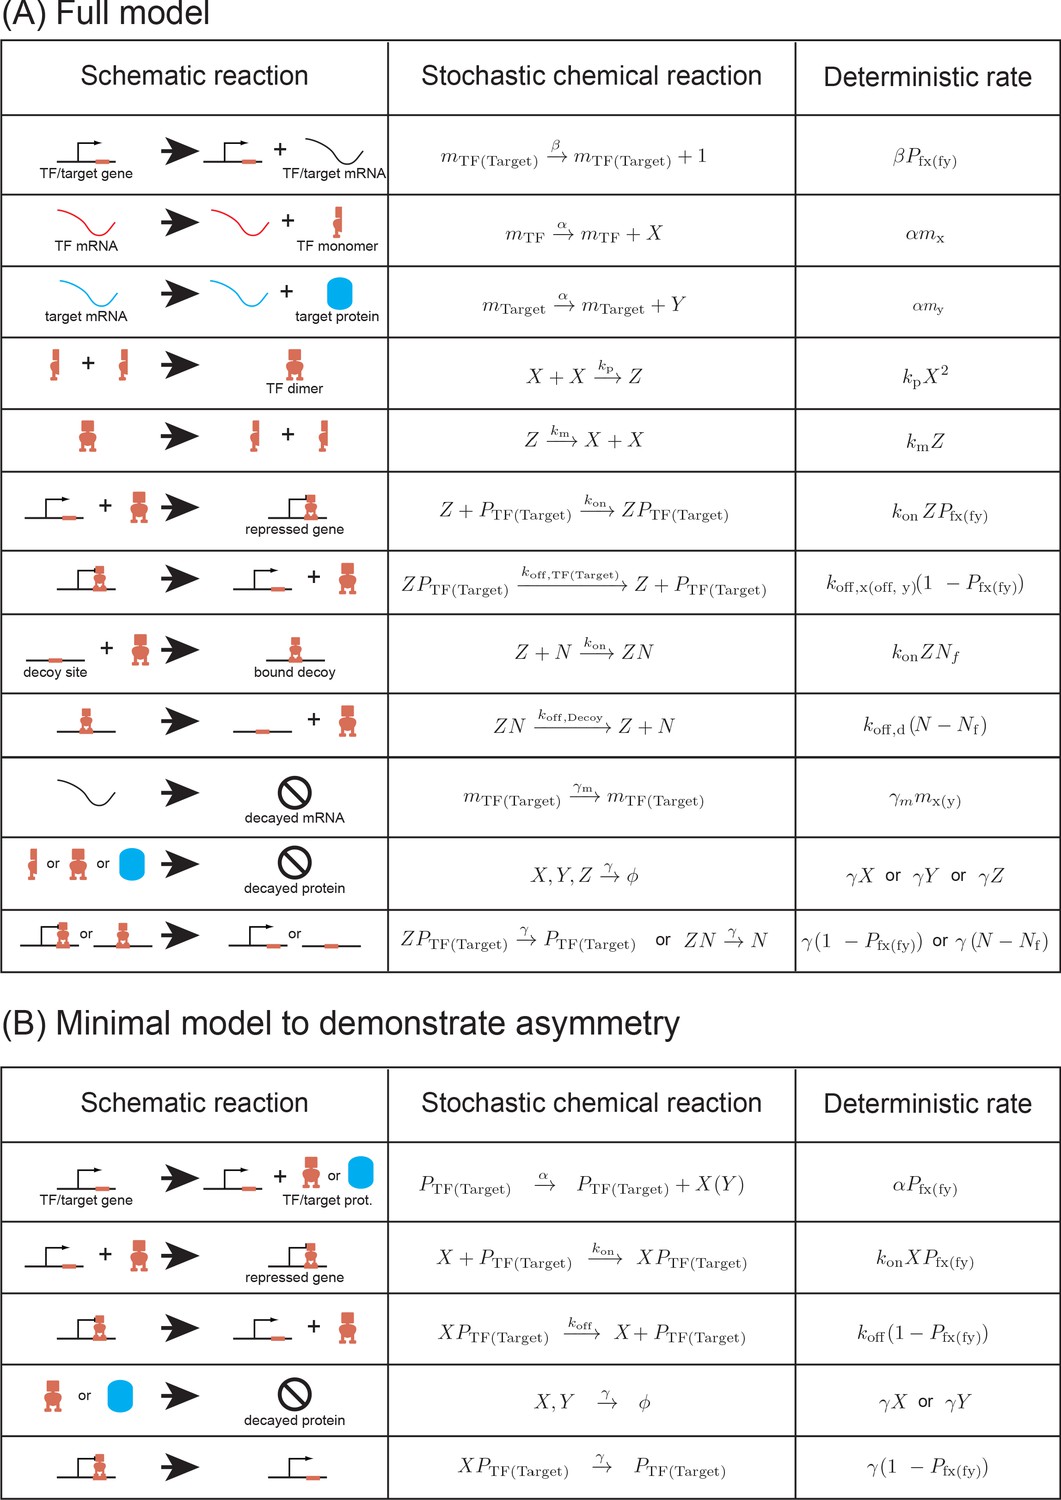
List of reactions used in the (A) stochastic model and (B) in the minimal model.
Appendix 7—figure 1
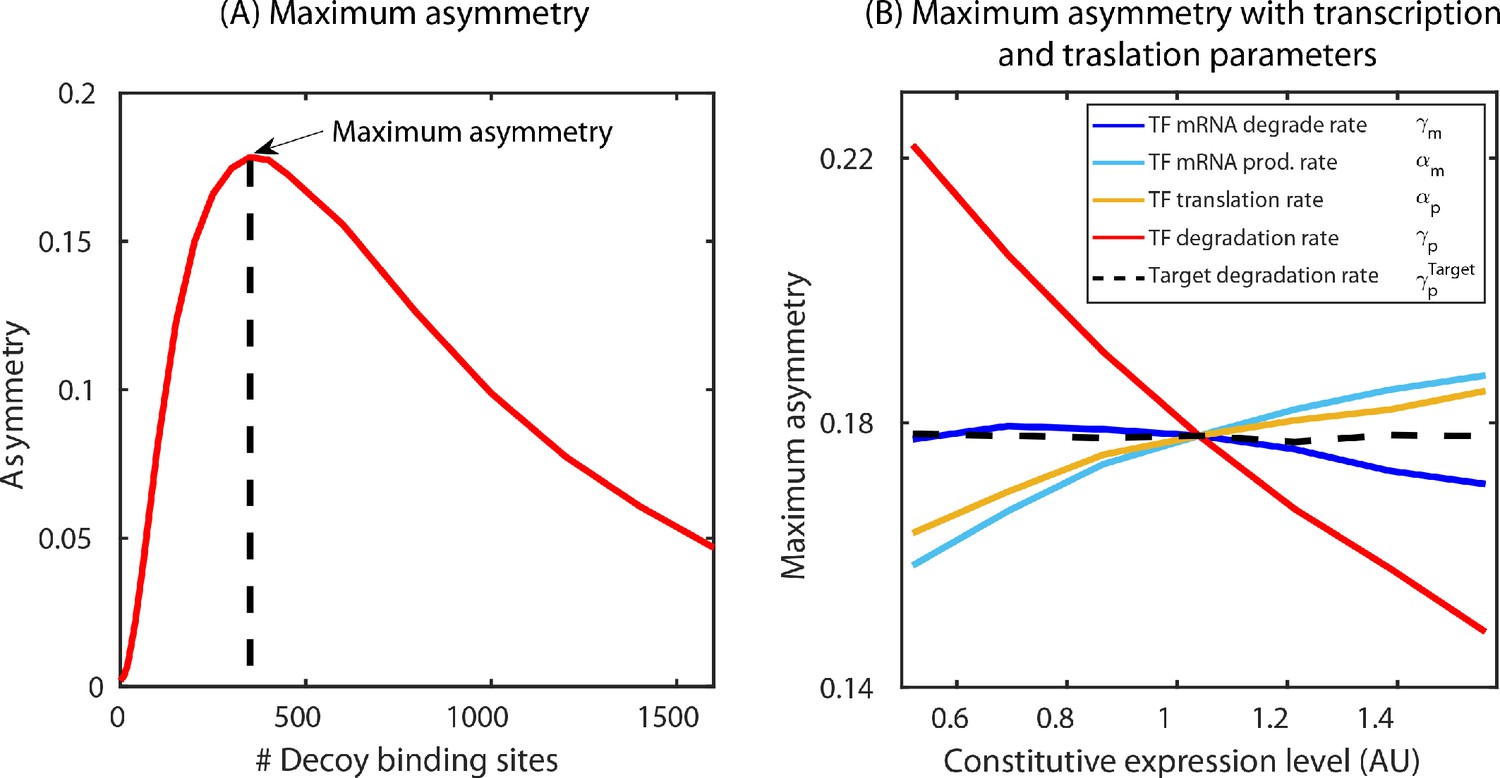
Determination of maximum asymmetry.
(A) Maximum asymmetry in simulation is computed by plotting the asymmetry, difference in fold-change between target and TF, versus number of decoy binding sites in SIM motif. The peak of this asymmetry corresponds to the maximum asymmetry. (B) Exploring the model parameters of the TF (mRNA production and degradation; protein production and degradation) that could influence the asymmetry between the TF and the target. Tuning the protein degradation rate (red line) has the maximum influence on the asymmetry between the TF and its target gene.
Appendix 10—figure 1
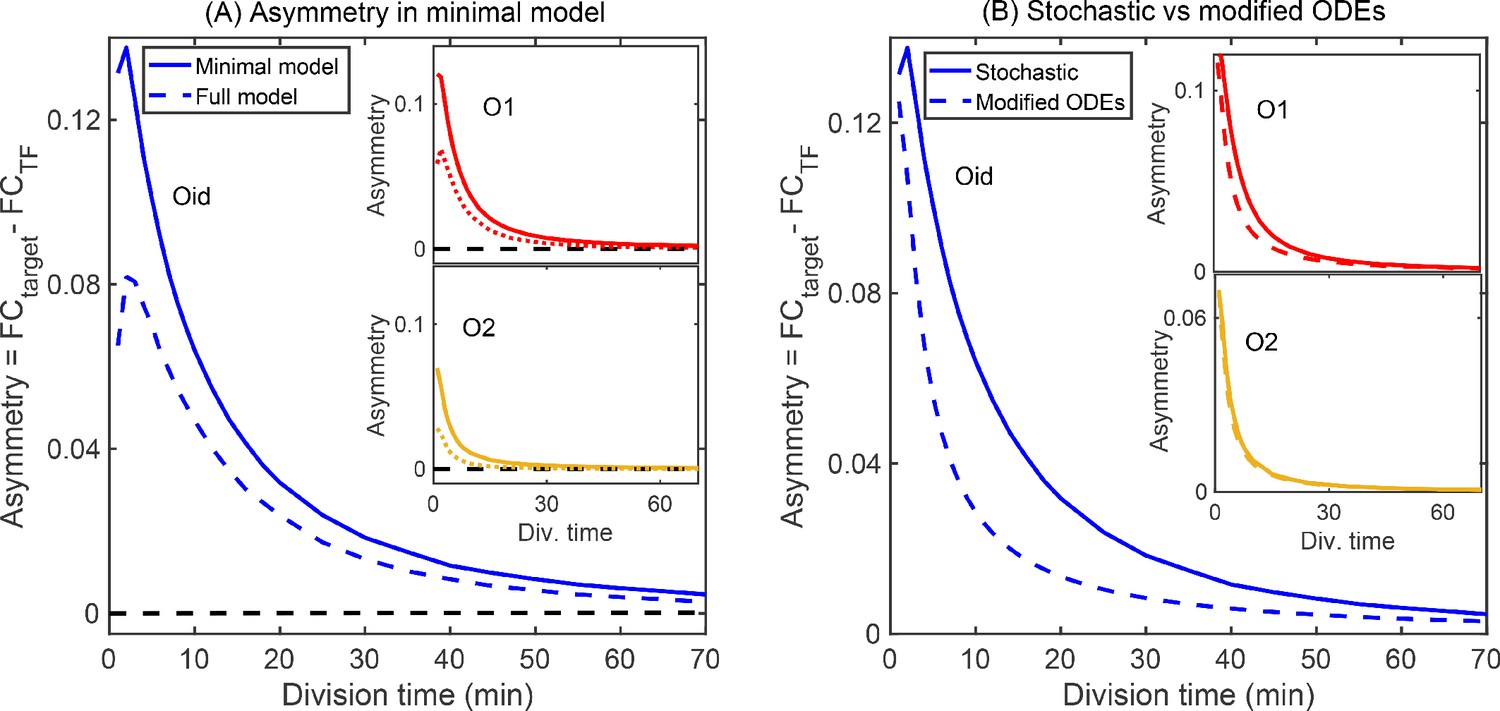
Minimal model of autoregulation.
(A) Asymmetry predicted from a minimal model without intermediate transcription steps and decoy binding sites using stochastic simulations (solid lines in blue, red and yellow for Oid, O1 and O2 binding sites, respectively). The asymmetry follows similar trend as predicted in the complete stochastic model (shown as dashed lines). Stronger binding site (Oid, shown in solid blue line) shows higher asymmetry than a weak binding site (O2, shown in solid yellow line). Also, asymmetry decreases as the growth rate is increased. Black dashed line corresponds to the deterministic counterpart of the stochastic reaction systems. Again, we do not find any asymmetry in TF and target regulation from the deterministic solution. (B) Modified ODEs with the inclusion of four states each having a different TF concentration predict asymmetry (dashed lines for different binding sites; Oid [blue], O1 [red], and O2 [yellow]). However, the quantitative values disagrees from the stochastic simulations of minimal model shown as solid lines.
Appendix 11—figure 1
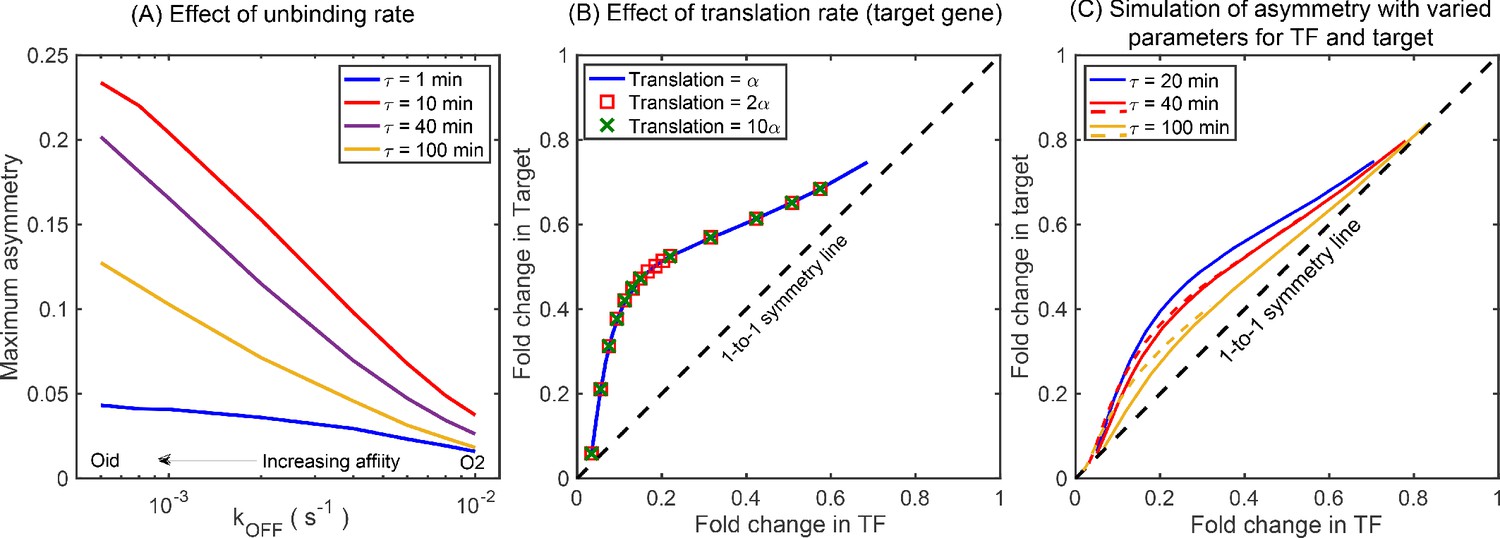
Simulations showing the effects of rate parameters on asymmetry.
(A) Effect of TF unbinding rate () on asymmetry. Irrespective of the , the maximum asymmetry decreases monotonically. (B) Asymmetry is not affected by difference in translation rate between the TF gene and the target gene. Blue solid curve represents asymmetry obtained from simulations where the translation rate of TF gene and the target gene is exactly same. The data points are generated with a translation rate of target gene twice (red square) and ten times (green cross) that of the TF gene and fall exactly on the blue curve showing no deviation. (C) Asymmetry for different growth rate (τ) with varying transcription rate, translation rate, and mRNA stability. Stochastic simulation performed using the kinetic parameters listed in Bremer and Dennis, 2008 for τ being 20 (blue line), 40 (red line), and 100 (yellow line) minutes. Dashed lines show the asymmetry for τ = 40 min and 100 min for the rate parameters same as τ = 20 min. The qualitative ordering and features of the asymmetry curve is not impacted by the changes in the kinetic parameters such as transcription rate, translation rate, and mRNA stability due to change in growth rates.
Appendix 12—figure 1
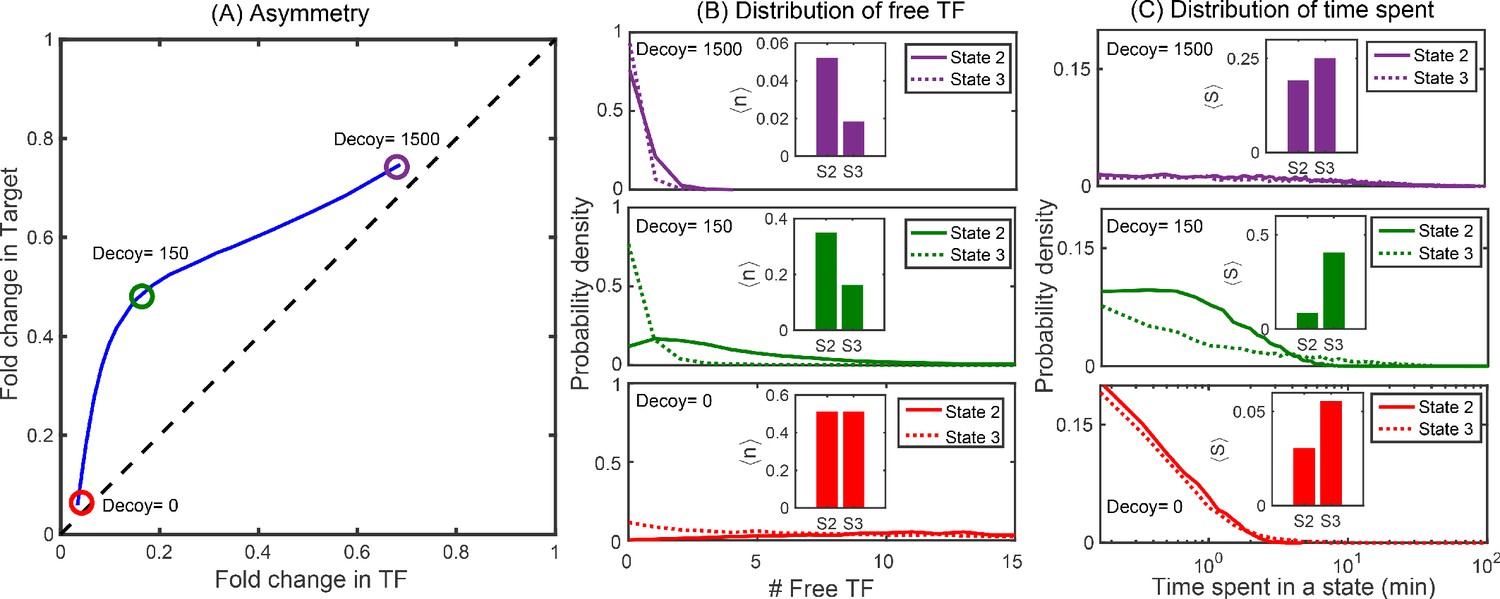
Distributions of free TFs and time spent in different promoter states.
(A) Typical asymmetry plot obtained from simulations for Oid binding site with division time τ = 25 min. (B-C) Distribution of free TFs and time spent in state 2 (S2) and state 3 (S3) for varying level of asymmetry corresponding to different decoy number as shown in panel (A). The plots in red, green and purple correspond to no decoys (low asymmetry), 150 decoy (maximum asymmetry) and 1500 decoy (low asymmetry). Insets in (B) are steady state fractional average of free TFs in state 2 and state 3 obtained from stochastic simulations using equation , where is the probability of having m target protein and n free TF in the promoter state (i,j); see Appendix 9. Insets in (C) are TF-occupancy in state 2 and state 3 defined as .
Tables
Key resources table
| Reagent type (species) or resource | Designation | Source or reference | Identifiers | Additional information |
|---|---|---|---|---|
| Gene (E. coli) | ybcN<>25XX+11-lacI-mcherry | GeneBank | MT726947 | TF gene; XX can be O1, O2 or Oid operator |
| Gene(E. coli) | galK<>3*5XX+11-yfp | GeneBank | MT726948 | Target gene; XX can be O1,O2 or Oid operator |
| Strain, strain background (E. coli) | E. coli MG1655 | Lab stock | CGSC#6300 | Wild type |
| Strain, strain background (E. coli) | HG105 | Garcia and Phillips, 2011 | E. coli MG1655 with lac operon deleted | |
| Strain, strain background (E. coli) | HG105 | This study | E. coli HG105 with gene deleted | |
| Other | M9 minimal media | BDDiagnostics | DF0485-17 | Commercial media |
| Other | Rich defined media | Teknova | #M2105 | Commercial media |
| Software,algorithm | Matlab code | Schnitzcells Rosenfeld et al., 2005 | ||
| Other | C code for simulations | GitHub link This study |
Table 1
Primers used in this study are listed below.
Primers for the chromosomal integration of TF and the target are the same as described in Brewster et al., 2014. Primers to mutate the binding sites from O1 to Oid, O2 or NoO1V1 is listed below with the binding sites in blue. Primers to introduce the degradation tags to LacI mCherry fusion protein is listed below with tag sequence in red.
| Mutagenesis primer | |
|---|---|
| CCGGCTCGTATAATGTGTGGGAATTCATTAAAGAG | |
| CTCTTTAATGAATTCCCACACATTATACGAGCCGG | |
| GAATTCATTAAAGAGGAGAAAGGTAC | |
| CCACACATTATACGAGCC | |
| GAATTCATTAAAGAGGAGAAAGGTACC | |
| CCACACATTATACGAGCCGGAAG | |
| Primers to introduce tags | |
| GCTAAGCTTAATTAGCTGAGTCTAGAGGC | |
| GCTTTGTACAGCTCATCCATGC | |
| CTAAGCTTAATTAGCTGAGTCTAGAGGC | |
| GCTTTGTACAGCTCATCCATGCAGCTCATCCATGC | |
| TAAGCTTAATTAGCTGAGTCTAGAGGC | |
| GCTTTGTACAGCTCATCCATGC | |
| qPCR primers | |
| GCATTTATCAGGGTTATTGTCTCAT | |
| GGGAAATGTGCGCGGAAC | |
Table 2
Kinetic rates used in the simulations.
| Rates | Symbols | Value | Reference |
|---|---|---|---|
| Growth rate | 25 min (RDM) | Measured experimentally | |
| 55 min (Glucose) | |||
| 125 min (Glycerol) | |||
| 225 min (Acetate) | |||
| Binding of TF | 0.0015 | Obtained from fit | |
| Unbinding of TF | 0.00042 (Oid) | Equation 1 | |
| 0.00149 (O1) | |||
| 0.0167 (O2) | |||
| mRNA degradation | 0.033 | Obtained from fit | |
| mRNA production | β | 0.1 | Obtained from fit |
| Translation rate | α | 0.03–0.2 | Obtained from fit |
| Dimerization | Stamatakis and Zygourakis, 2011 | ||
| Monomerization | Stamatakis and Zygourakis, 2011 |
Appendix 10—table 1
Change in free TF and target protein number for the reactions describing the minimal model.
| Reaction | Increase in free TF | Decrease in free TF |
|---|---|---|
| Production in active state | - | |
| Degradation of free TF | - | |
| Binding | ||
| Unbinding | ||
| Degradation of TF from gene | ||
| Increase in target | Decrease in target | |
| Production in active state | - | |
| Degradation of target | - | |
| Binding | ||
| Unbinding | ||
| Degradation of TF from gene |
Additional files
-
Source data 1
Simulation data.
Data generated through simulations for Figure 2A-B , Figure 3B-D, Figure 4B-F and Figure 5A-C.
- https://cdn.elifesciences.org/articles/56517/elife-56517-data1-v2.xlsx
-
Transparent reporting form
- https://cdn.elifesciences.org/articles/56517/elife-56517-transrepform-v2.pdf
Download links
A two-part list of links to download the article, or parts of the article, in various formats.
Downloads (link to download the article as PDF)
Open citations (links to open the citations from this article in various online reference manager services)
Cite this article (links to download the citations from this article in formats compatible with various reference manager tools)
Inherent regulatory asymmetry emanating from network architecture in a prevalent autoregulatory motif
eLife 9:e56517.
https://doi.org/10.7554/eLife.56517


