Changes in ferrous iron and glutathione promote ferroptosis and frailty in aging Caenorhabditis elegans
- Melbourne Dementia Research Centre, Florey Institute of Neuroscience and Mental Health and University of Melbourne, Australia
- Australian Synchrotron, ANSTO, Australia
- Department of Mathematics and Statistics, La Trobe University, Australia
- Bioinformatics Division, Walter and Eliza Hall Institute of Medical Research, Australia
- Melbourne School of Population and Global Health, and School of Mathematics and Statistics, University of Melbourne, Australia
- Department of Mathematics and Statistics, University of Melbourne, Australia
- Helmholtz Zentrum München, Institute of Metabolism and Cell Death, Germany
- Department of Pathology and Bosch Institute, University of Sydney, Australia
Figures
Figure 1
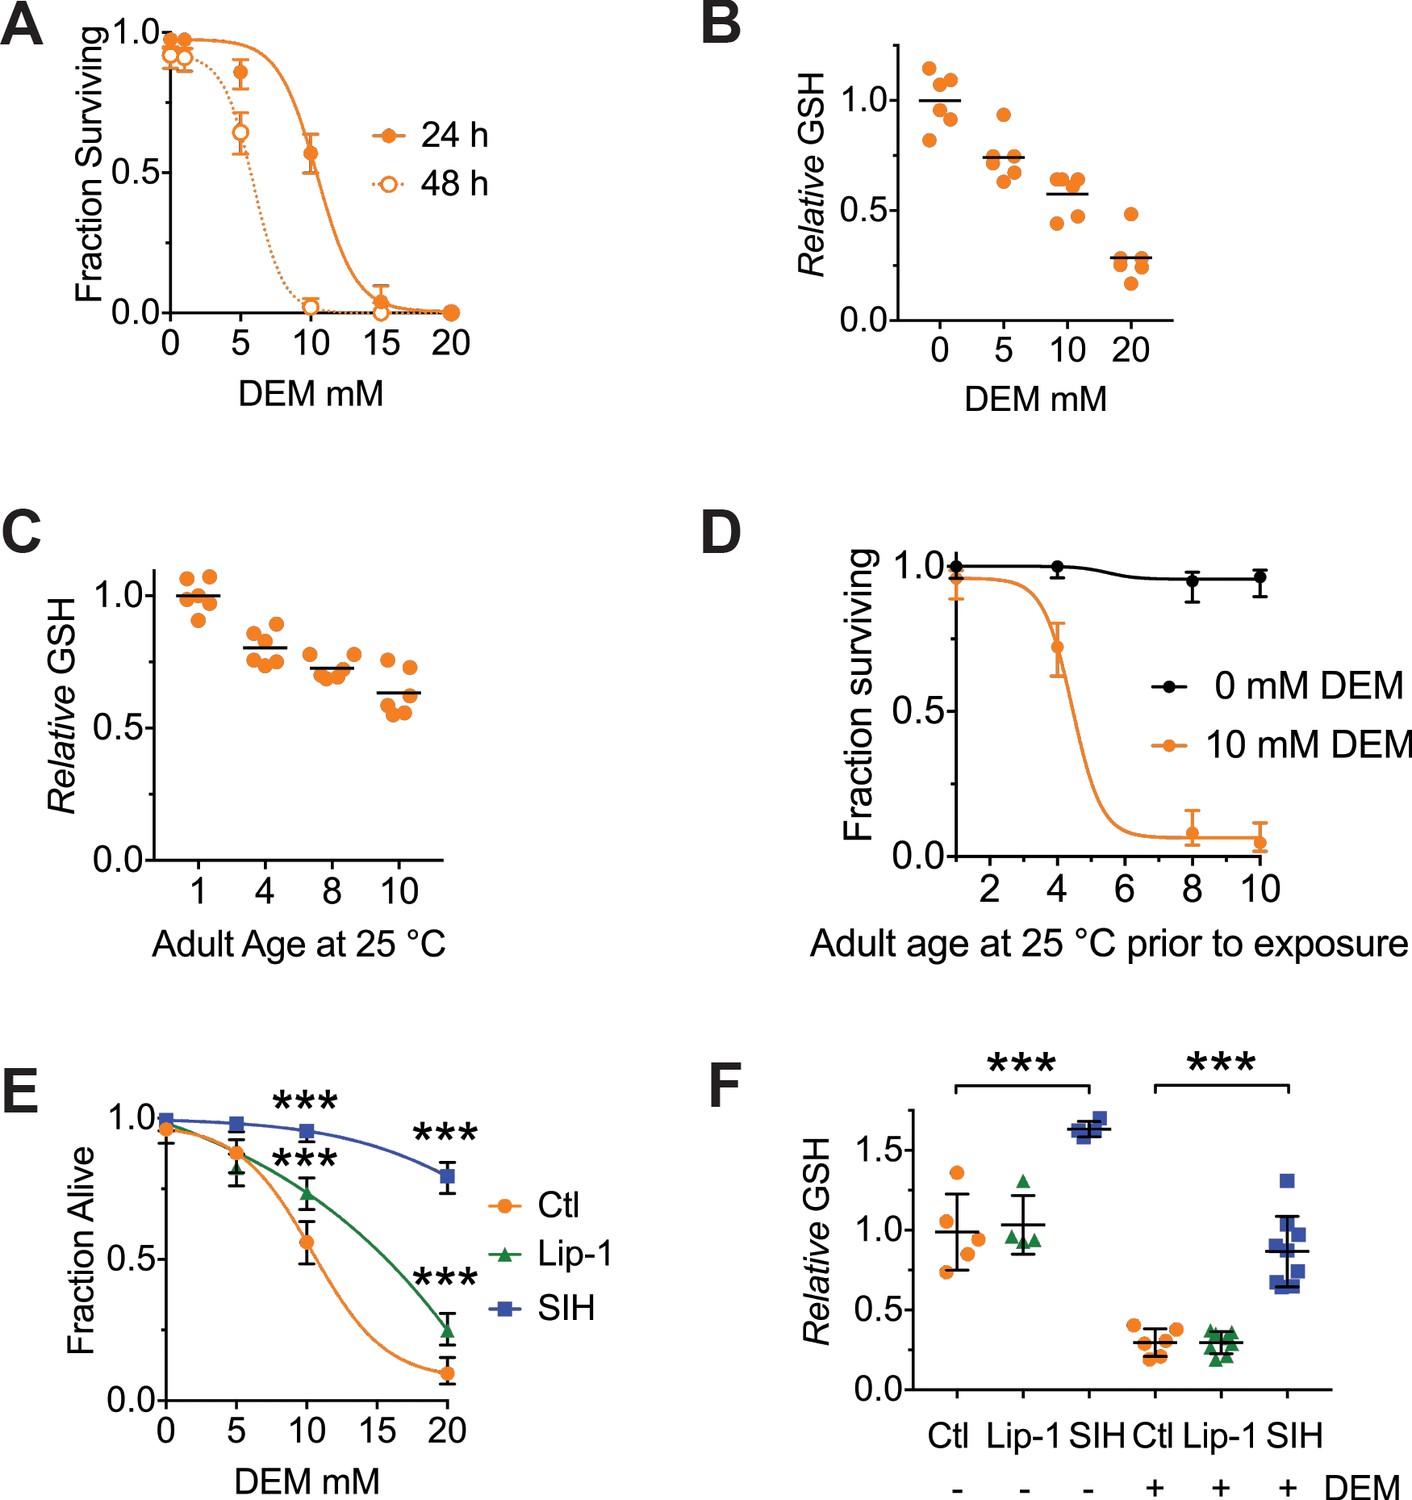
Both Lip-1 and SIH protect against toxicity from glutathione depletion.
Treatment with DEM represents an acute stress that reduces glutathione levels and causes death, with older animals being more susceptible.
Note, the age of adults is determined by the number of days following the last larval molt and therefore reflects the number of days of adulthood. (A) Survival curves of adults following either 24- or 48 hr exposure to increasing doses of DEM. Treatment begun on Day 4 of adulthood. Shown are proportions ± 95% confidence intervals (Newcombe, 1998), with a sigmoidal curve fitted. (B) Total glutathione (GSH) decrease following 6 hr of DEM exposure. Day 4 adults used, with results normalized to the GSH levels in worms not exposed to DEM. Plotted are six independent replicates, with each estimated derived from 50 adults per measure). Linear regression R2 = 0.98, p=0.01 (C) Total GSH levels decrease with increased adult age in C. elegans. Each point is derived from six independent replicates of 50 adults, with black lines marking the mean value. Results are normalized to the GSH levels in Day one worms (ANOVA: F (3, 20)=32.96, p<0.0001; see Supplementary file 1 for pairwise comparisons). (D) Aged C. elegans adults become progressively more sensitive to GSH depletion by DEM. Shown are proportions ± 95% confidence intervals, with a sigmoidal curve fitted. (E) Both Lip and SIH treatment protect against lethality from DEM-derived glutathione depletion. Day 4 adults, with values representing pooled data from four independent experiments ± 95% confidence intervals, each with a fitted sigmoidal curve. Ctl denotes vehicle control (0.5% v/v DMSO). Pairwise comparisons at 10 and 20 mM DEM were performed using Fisher’s exact test; *** denotes p<0.001. (F) Total glutathione levels are preserved following SIH pretreatment from L4, but not by Lip-1. Day 4 adults were exposed to DEM (10 mM) for 6 hr, and total glutathione (GSH) assayed. Ctl denotes vehicle control (0.5% v/v DMSO). Each point is derived from 4 to 9 independent replicates of 50 adults, with black lines marking the mean value ± SD. (ANOVA: F (5, 30)=50.97, p<0.0001; see Supplementary file 1 for pairwise comparisons). *** denotes p<0.001.
-
Figure 1—source data 1
Data for DEM and GSH comparisons.
- https://cdn.elifesciences.org/articles/56580/elife-56580-fig1-data1-v1.xlsx
Figure 2 with 3 supplements
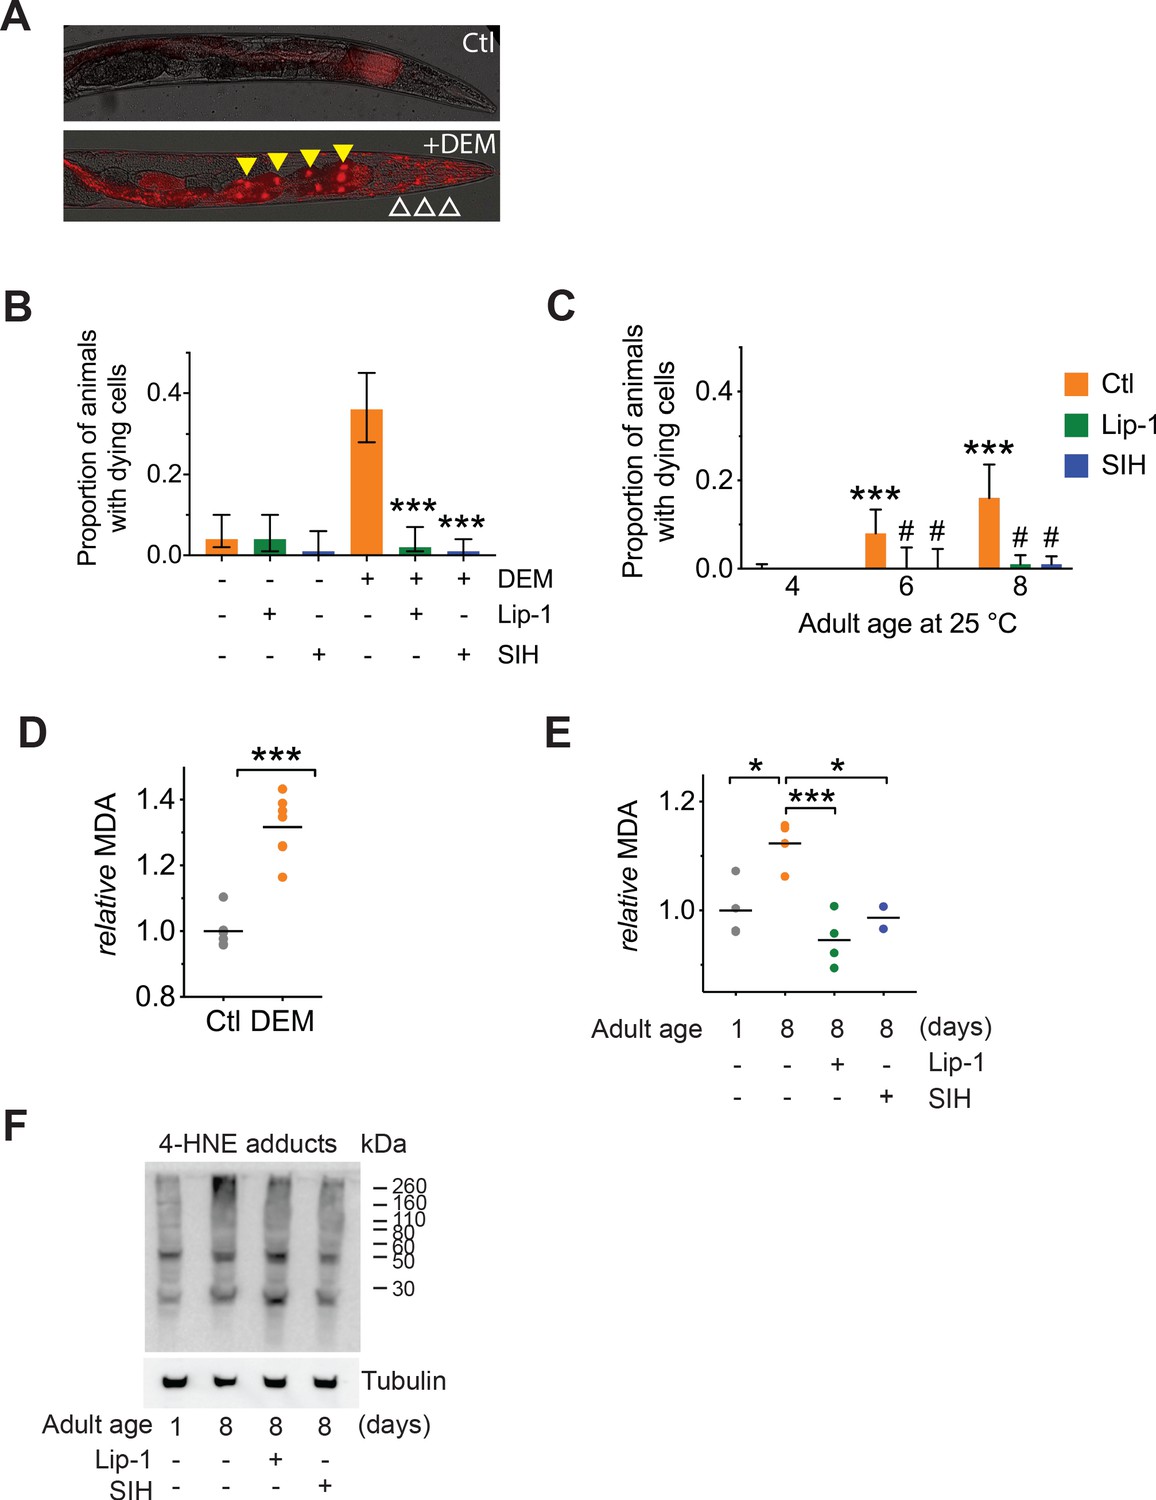
|Both Lip-1 and SIH inhibit cell death and protect against lipid peroxidation.
Measures of lipid peroxidation and cell death show an increase with age and reduction by both Lip-1 and SIH treatment.
In all panels, vehicle control (0.5% v/v DMSO, Ctl)-treated worms are shown in orange, Lip-1-treated (200 µM Lip-1) are green and SIH-treated (250 µM SIH) are blue. (A) Representative propidium iodide fluorescence (red) overlay of bright field micrograph depicting dead intestinal cells (marked by nuclear signal, yellow triangles) within a live Day 4 adult treated with DEM. Smaller fluorescent puncta were also observed, consistent with neuronal cell nuclei (white unfilled triangles). Untreated Day 4 adult control animals (Ctl) showed no cell death. (B) Proportion of live animals at Day 4 (±95% confidence intervals) of adulthood showing dead cell fluorescence (propidium iodide)±exposure to 10 mM DEM for 24 hr. Cohorts of animals included: co-treatment with a vehicle control (-DEM, Ctl, n = 102; +DEM Ctl n = 117), Lip-1 (-DEM, Lip-1, n = 84; +DEM Ctl n = 106) or SIH (-DEM, Ctl, n = 89; +DEM Ctl n = 129). Lip-1 and SIH both markedly reduced the proportion of animals with dead cells after DEM treatment (z-test: Ctl vs Lip-1 Z = 6.37 ***p<0.001; Ctl vs SIH Z = 7.24, ***p<0.001). (C) Proportion of live animals at 4, 6 and 8 days of adulthood (±95% confidence intervals) showing propidium iodide nuclear fluorescence. Day 6 Ctl adults (n = 160) had a significantly higher proportion of animals with dead cells than Day 4 Ctl (n = 263; z-test: Z = 4.70 ***p<0.001). Similarly, Day 8 Ctl adults (n = 119) had significantly higher prevalence of animals with propidium iodide nuclear fluorescence than Day 4 Ctl (z-test: Z = 6.65 ***p<0.001). No significant difference was observed between Day 6 and Day 8 control populations. Within the Day 6 adult cohorts treatment with Lip-1 (n = 77) or SIH (n = 81) markedly reduced the prevalence of animals with propidium iodide nuclear fluorescence compared to vehicle control (z-test: Ctl vs Lip-1 Z = 2.57 # p<0.001; Ctl vs SIH Z = 2.64, # p<0.001). Within the Day 8 adult cohorts treatment with Lip-1 (n = 234) or SIH (n = 308) markedly reduced the prevalence of animals with propidium iodide nuclear fluorescence compared to vehicle control (Ctl, n = 119; z-test: Ctl vs Lip-1 Z = 5.67 # p<0.001; Ctl vs SIH Z = 6.28, # p<0.001). (D) Levels of the lipid peroxidation end product malondialdehyde (MDA) increases in C. elegans following acute glutathione depletion by 20 mM DEM exposure for 6 hr. MDA levels are shown as values normalized against the mean of untreated Day 4 Adults (Ctl) for independent samples. (Ctl vs +DEM, unpaired 2-tailed t-test ***p<0.001) (E) Malondialdehyde (MDA) increases in aged C. elegans (Day 1 vs Day 8 adults, ANOVA *p<0.05). Treatment with either Lip-1 (Day 8 vs Day 8 +Lip-1 adults, ANOVA ***p<0.001) or SIH (Day 8 vs Day 8 +SIH adults, ANOVA *p<0.05) reduces levels of MDA. Data represent independent samples with values normalized against the mean of untreated Day 1 adults. (F) Representative immunoblot against 4-HNE protein adducts comparing Day 1 and Day 8 control adults and aged adults treated with Lip-1 and SIH with corresponding tubulin blot below (representative of triplicate experiments). The relative intensity of the bands show an age-related increase that is ameliorated by Lip-1 and SIH.
-
Figure 2—source data 1
Data for cell death and lipid peroxidation.
- https://cdn.elifesciences.org/articles/56580/elife-56580-fig2-data1-v1.xlsx
Figure 2—figure supplement 1
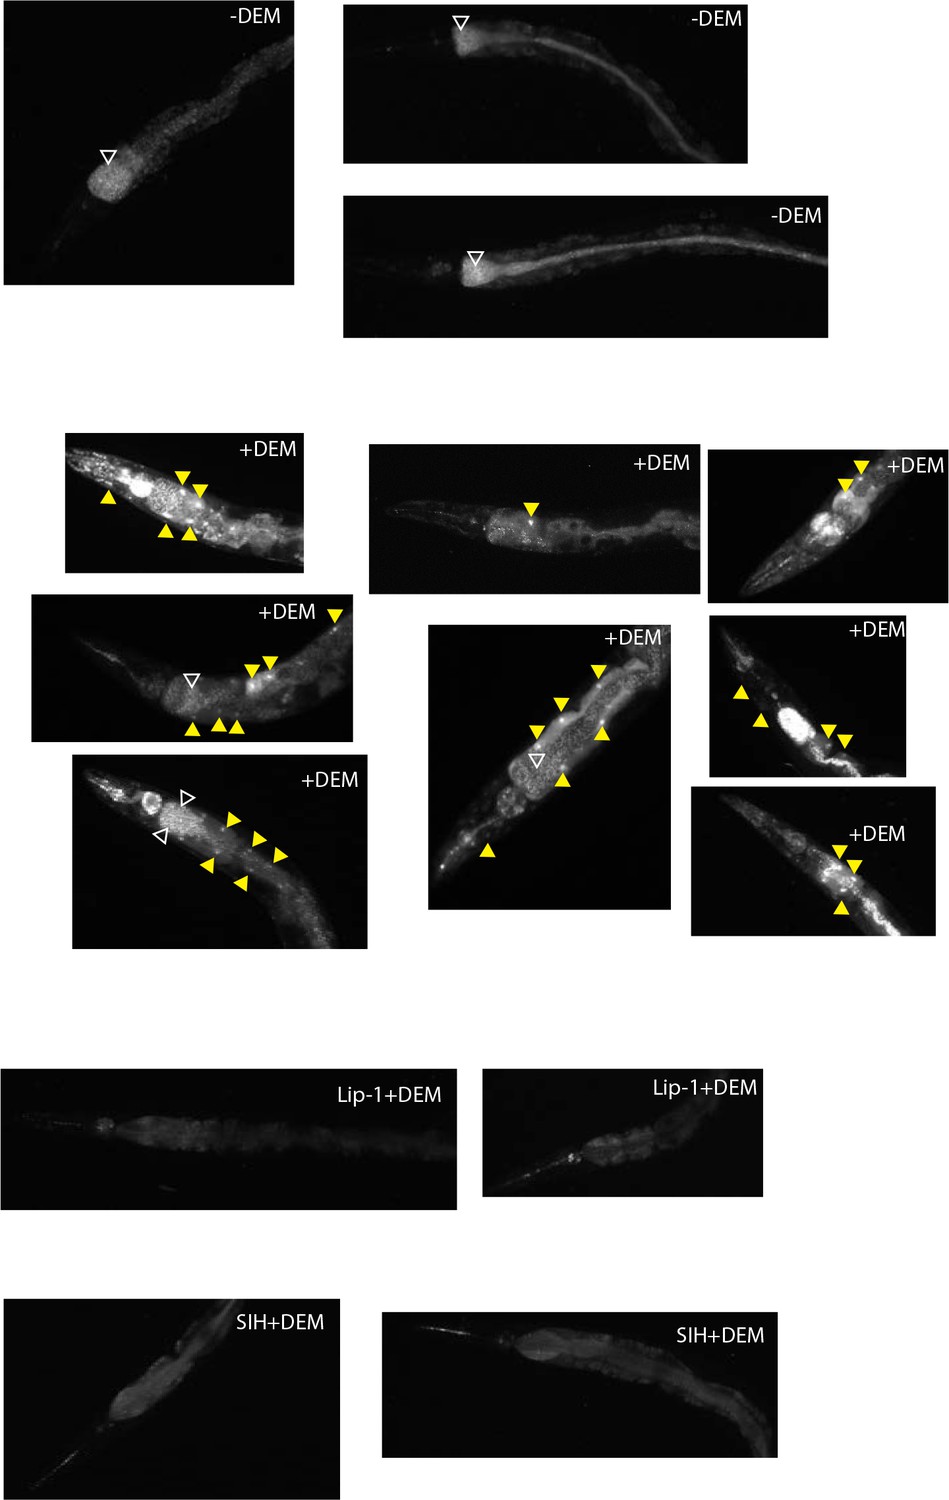
Propidium iodide staining: Cell death observed following treatment with DEM.
Representative images are shown in A for DEM-treated animals and B for aging animals. (A) Representative epifluorescence micrographs of dead cell fluorescence (propidium iodide) in animals ± exposure to 10 mM DEM for 24 hr. In animals treated with DEM (+DEM) examples of animals with single through to numerous dying cells (yellow triangles) were observed. Untreated Day 4 adult control animals (-DEM) showed no cell death. Some fine puncta, consistent with labelling of dead bacteria was observed in the intestinal tract (white unfilled triangles). (B) Representative epifluorescence micrographs of dying cell fluorescence (propidium iodide) in aged animals ± treatment with Lip-1 or SIH. In Day 1 control (Ctl) animals no dying cells were observed. In comparison, in Day 6 and Day 8 Ctl animals with dying cells (ranging from a few to many cells) (yellow triangles) were observed. Representative images of age matched animals treated with Lip-1 or SIH without cell death.
Figure 2—figure supplement 2
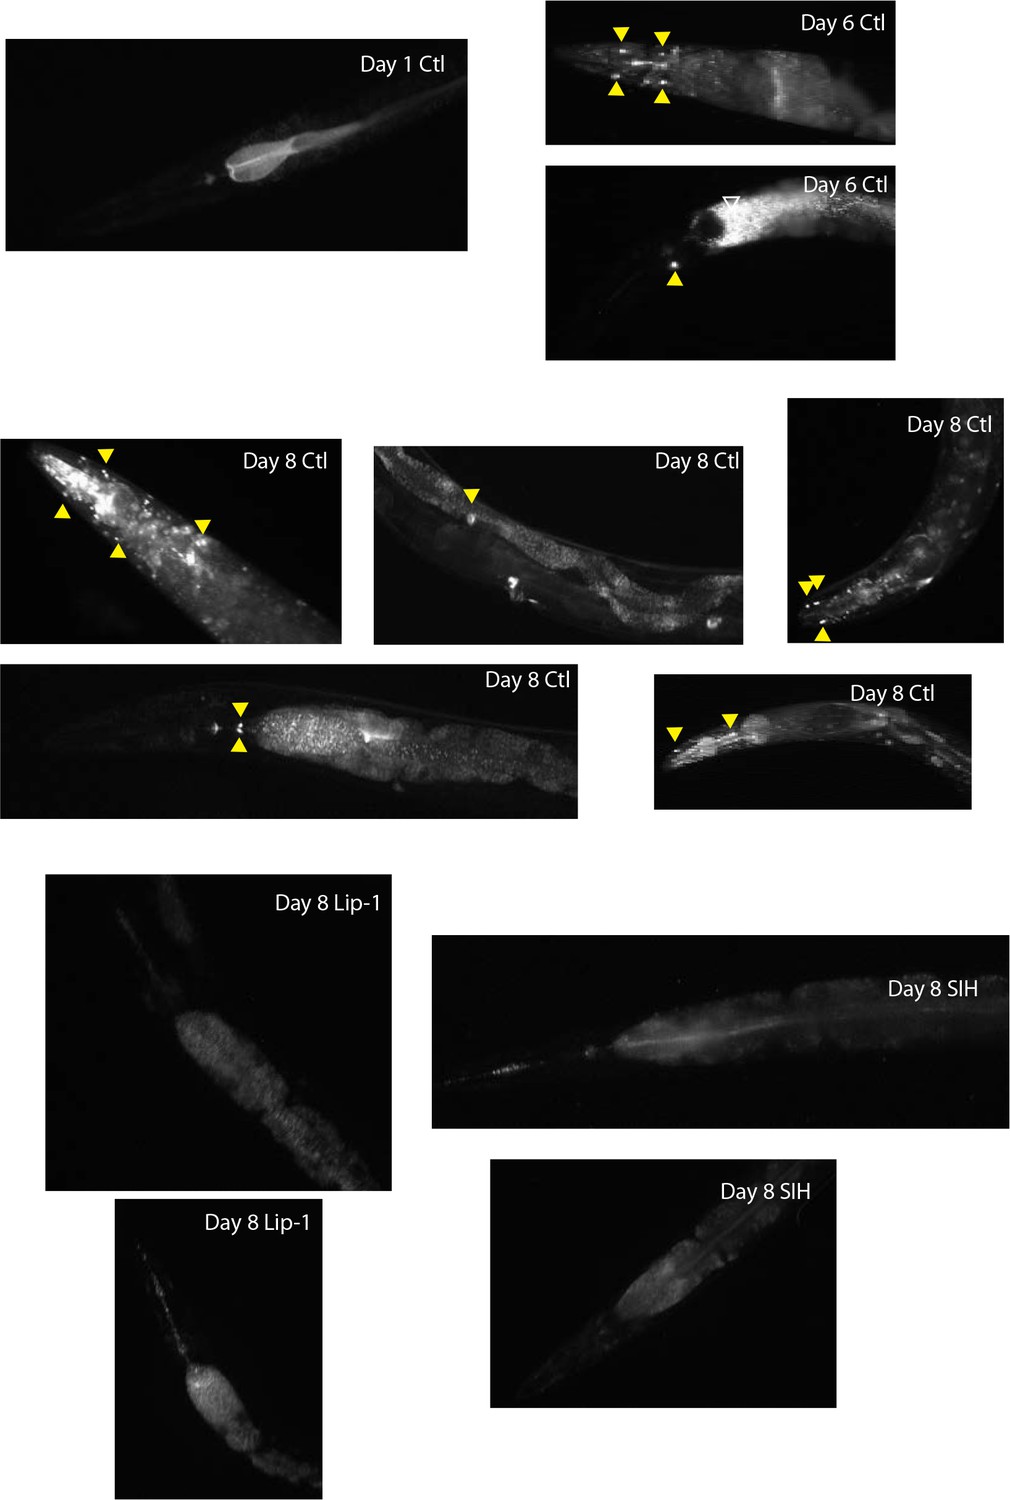
Propidium iodide staining: Cell death observed in aging nematodes.
Figure 2—figure supplement 3
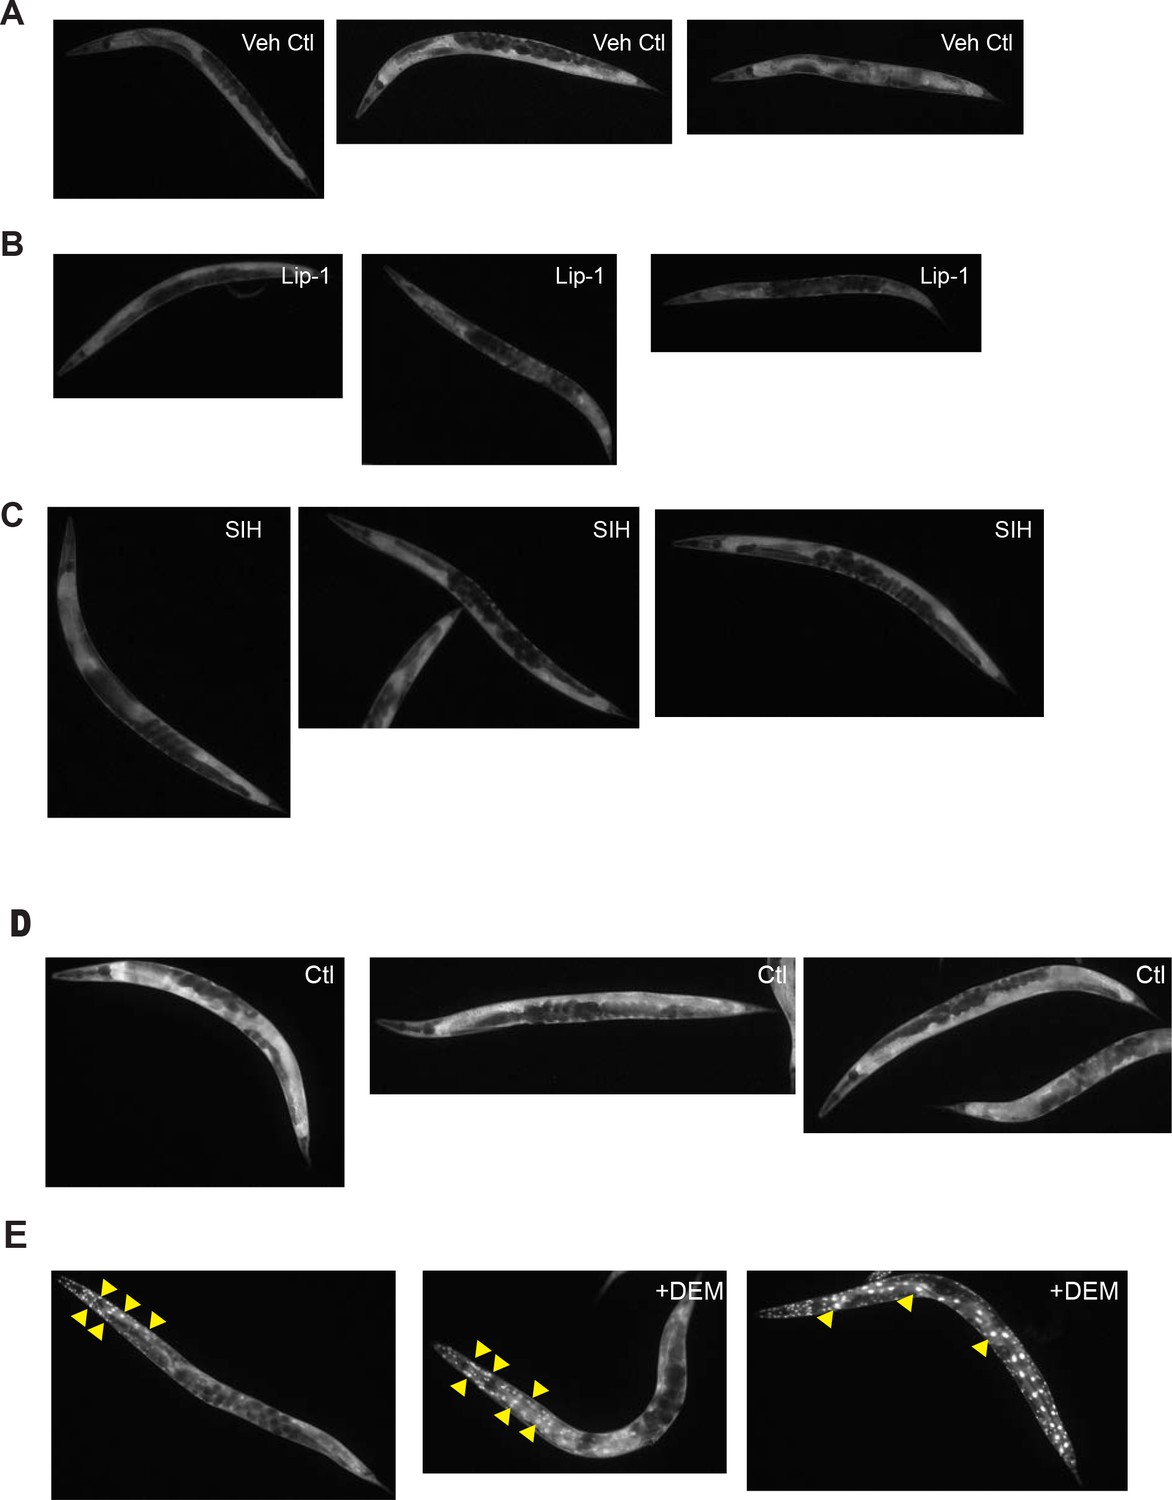
DAF-16 nuclear localization: The DAF-16 reporter strain TJ356 (zIs356 [Pdaf-16::daf-16a/b::gfp + rol-6(su1006)] was used to visualize nuclear localization of the DAF-16 transcription factor as an indicator of insulin-like signalling.
Images of control (Ctl), 200 µM Lip-1 and 250 µM SIH-treated animals are shown in A to C. DEM-treated (±10 mM DEM) animals are shown in D and E. Lip-1 and SIH do not cause nuclear translocation of DAF-16. Representative fluorescence micrographs of DAF-16::GFP localization in animals treated from L4 larval stage for 48 hr at 25°C. Shown are (A) 0.5% (v/v) DMSO vehicle control (Veh Ctl), (B) 200 µM Lip-1 (Lip-1) and (C) 250 µM SIH (SIH), which all show unaltered cytoplasmic localization of DAF-16. In contrast, glutathione depletion by DEM causes nuclear translocation of DAF-16. Representative fluorescence micrographs of DAF-16::GFP localization in animals (D) untreated (Ctl) or (E) animals exposed to 20 mM DEM for 6 hr at 25°C treated from L4 larval stage for 48 hr at 25°C.
Figure 3

Effects of Lip-1 and SIH on iron levels and distribution in C. elegans.
In all panels, vehicle control (0.5% v/v DMSO, Ctl) treated worms are shown in orange, Lip-1 treated (200 µM Lip-1) are green and SIH treated (250 µM SIH) are blue. (A) Representative X-ray fluorescence microscopy maps of tissue iron (Fe) reported as areal density (pg µm−2) for a first day adult (Day 1) and animals treated for four days (Day 4) and eight days (Day 8) with vehicle control (Ctl), Lip-1 or SIH at 25°C. Scale bar = 50 µm. (B) Plot of mean areal density for iron (pg µm−2) for all treatment cohorts aged at 25°C. The starting population (Day 1, vehicle control (0.5% v/v DMSO); Start)) is shown in grey. The control cohort (orange) shows an age related increase in total iron (as previously observed [James et al., 2015). The Lip-1 group (green) has similar iron levels across each age, whereas the SIH cohort (blue) has markedly less total iron (ANOVA: F(6,148)=171.3, p<0.0001; see Supplementary file 2 for sample summary and pair-wise comparisons). Each data point represents a value from a single C. elegans adult, with mean ± SD, ***p<0.001. (C) Plot of total body iron (pg) for treated C. elegans cohorts aged at 25°C. Each data point represents a value from a single C. elegans adult, with mean ± SD. All treatments have increased total iron across age with SIH-treated (blue) worms retaining significantly less iron than control (red) and Lip-1 (green) treated worms at Day 4 (ANOVA: F(6,148)=97.3, ***p<0.0001; see Supplementary file 2 for sample summary and pair-wise comparisons) (D) Native, size-exclusion chromatography of iron-macromolecular complexes from 10 day old adults treated with vehicle control (Ctl, shown in orange) or SIH-treated cohorts (shown in blue). The means ± SD, from three independent biological replicates, are plotted. The three major peaks include unaltered high molecular weight complexes (HMW,>1 MDa,~2.2 mL retention volume), ferritin bound iron (~2.7 mL retention volume; previously identified as FTN-2 [James et al., 2015]; area under the peak decreased by ~53% relative to Ctl) and low molecular weight iron complexes (LMW,<30 kDa,~3.9 mL retention volume, decreased ~47% relative to Ctl).
-
Figure 3—source data 1
Data for XFM and mass spectrometry comparisons.
- https://cdn.elifesciences.org/articles/56580/elife-56580-fig3-data1-v1.xlsx
Figure 4 with 2 supplements
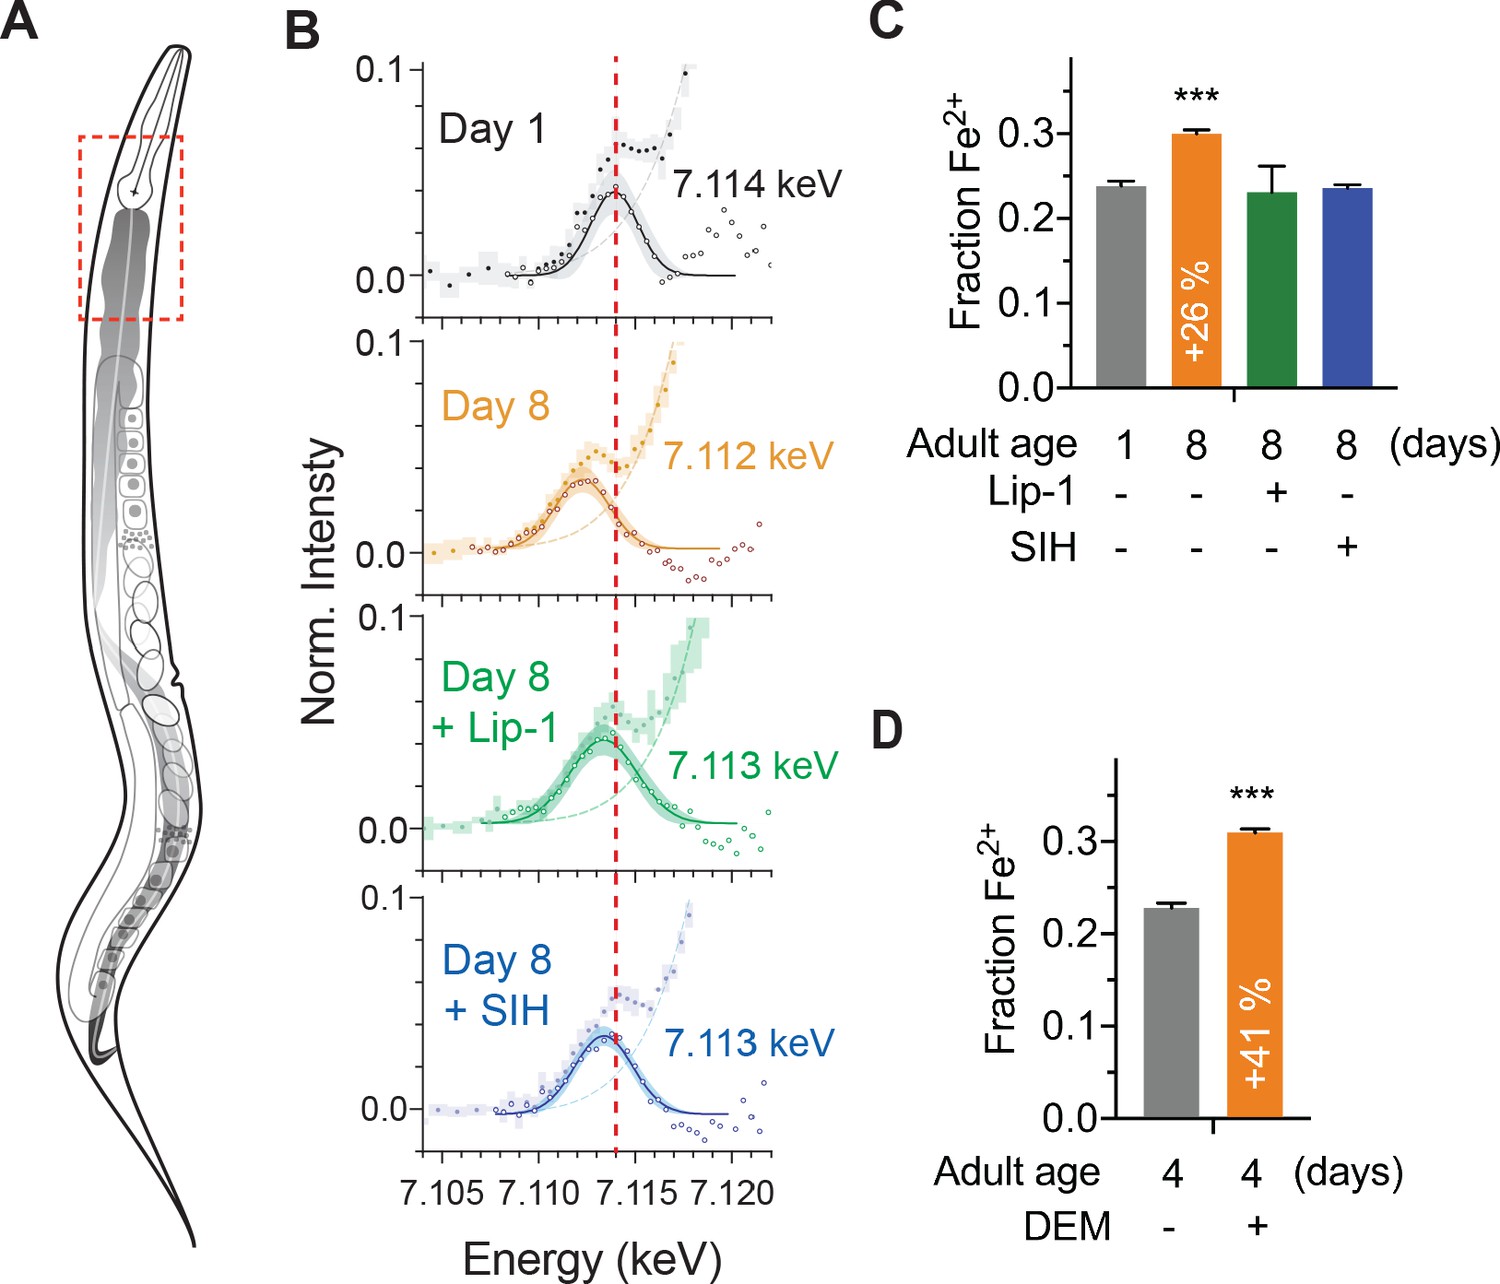
Effects of aging, glutathione depletion, SIH and Lip-1 on pro-ferroptotic Fe2+ levels.
𝜑XANES evaluation of the Fe2+ fraction in vivo within intact animals. (A) Schematic highlighting the anatomy of an adult hermaphrodite C. elegans with the intestine shaded in grey. Dashed box is indicative of the region of animals selected for 𝜑XANES. (B) Fe2+ synchrotron microscopy. 𝜑XANES imaging allowed extraction of the normalised Fe K-edge XANES spectra (coloured circles) from the anterior intestine of Day 1 (n = 6) and Day 8 control (n = 4), SIH treated (n = 4) and Lip-1 treated (n = 5) worms. Averaged spectra for each group are shown along with 95% confidence intervals (shading). The pre-edge region, following subtraction of the rising edge (dashed line), highlights changes in the intensity and position of the 1 s → 3d transition. The extracted data (empty circles) and fitted Gaussian (solid lines; shading represents the 95% CI) are superimposed to determine the centroid values for the pre-edge peak, from which the Fe2+ fraction is derived. Changes in the first derivative of the Fe K-edge XANES (Figure 4—figure supplement 2) reflect variation in the intensity of the 1 s → 4 s and 1 s → 4 p transitions. The relative intensity of these features was used to estimate the proportion of Fe2+ iron in the specimens. For reference, the red line through all spectra denotes the centroid of the Day 1 adults at 7.114 keV. (C) The proportional change in fractional Fe2+ contribution for spectrum in the aged (Day 1 versus Day 8 adults) and treated (Lip-1 and SIH, from panel B) specimens is indicated, along with 95% confidence interval. Changes in the first derivative of the Fe K-edge XANES (Figure 4—figure supplement 2) was used to infer variation in the intensity of the 1 s → 4 s and 1 s → 4 p transitions and the relative intensity of these features was then used to estimate the proportion of Fe2+ iron. (D) The proportional change in fractional Fe2+ contribution for Day 4 adults treated with (n = 4) and without acute glutathione depletion via DEM (n = 4) is indicated, along with 95% confidence interval.
-
Figure 4—source data 1
Data for XANES comparisons.
- https://cdn.elifesciences.org/articles/56580/elife-56580-fig4-data1-v1.xlsx
Figure 4—figure supplement 1

XFM maps of Fe and regions-of-interests for φ-XANES analysis (dashed boxes).
Figure 4—figure supplement 2
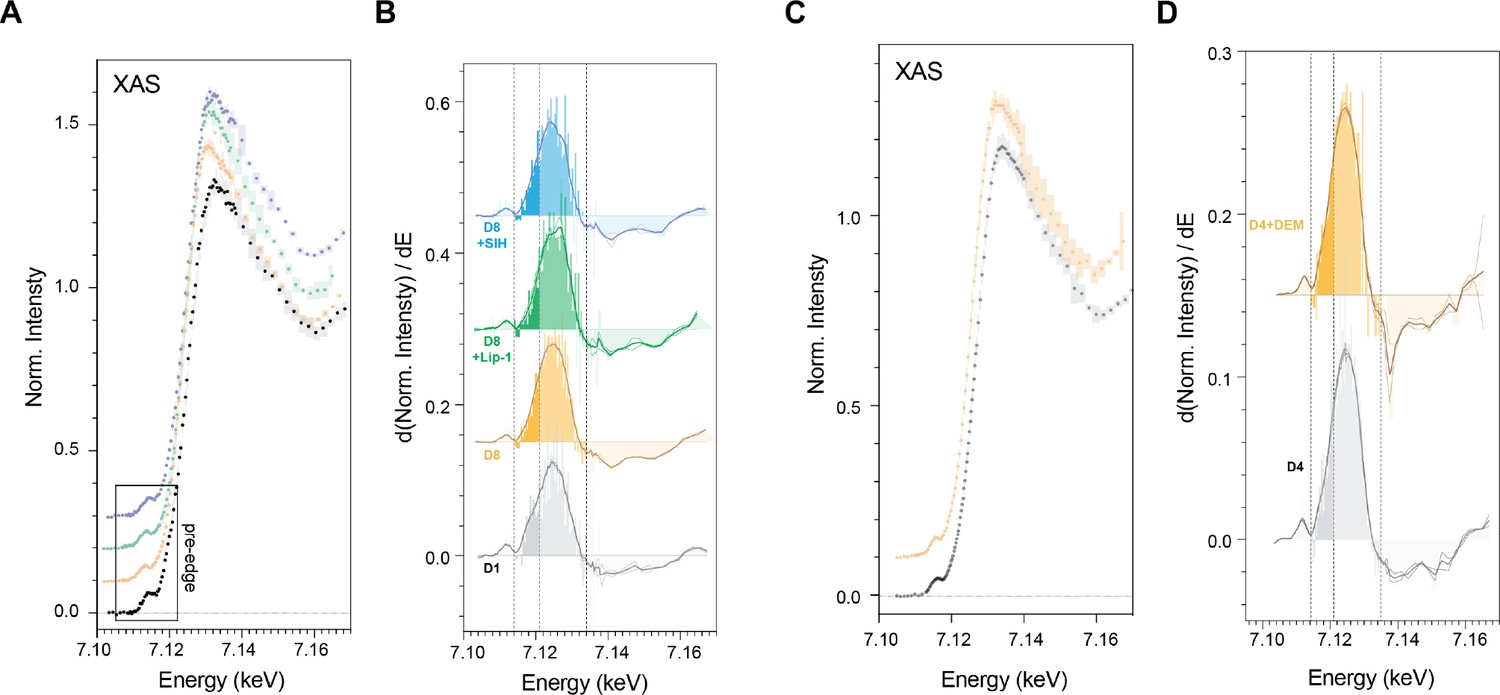
Summary of pooled spectra for young (n = 6), aged (n = 4) TJ1060 animals and aged animals with SIH (n = 4) or Lip-1 treatment (n = 5) (i.e.the mean for all pixels in all ROIs within each group) from scanning the iron K-edge, including features present in the pre-edge (~7.112 keV) and rising edge (~7.124 keV) are shown in A, with their corresponding first-derivatives (B).
Similarly, pooled spectra and first derivatives from 4-day-old adult wild types treated with (n = 4) and without (n = 4) DEM is shown in Fig C-D Changes in the first derivative of the Fe K-edge XANES reflect variation in the intensity of the 1 s → 4 s and 1 s → 4 p transitions. (A) Iron K-edge φXANES spectra (circles) determined by integrating 105 XFM micrographs acquired at energies spanning the iron absorption edge (7000–7455 eV). Shaded region represents 95 % CI; spectra offset for clarity. Shown are spectra for Day 1 adults, Day 8 adults, Day 8+Lip and Day 8+SIH groups. (B) The corresponding first derivative for spectra shown in A; spectra offset in the vertical for clarity. Darker shading (7.114–7.121 keV) marks the area under the curve attributed the 1 s → 4 s transition. The lighter shading (7.121–7.132 keV) marks the are under the curve attributed to the 1 s → 4 p transition. (C) Pooled spectra for Day 4 adults treated with and without DEM, and (D) their matching first derivatives, as described above.
Figure 5 with 2 supplements
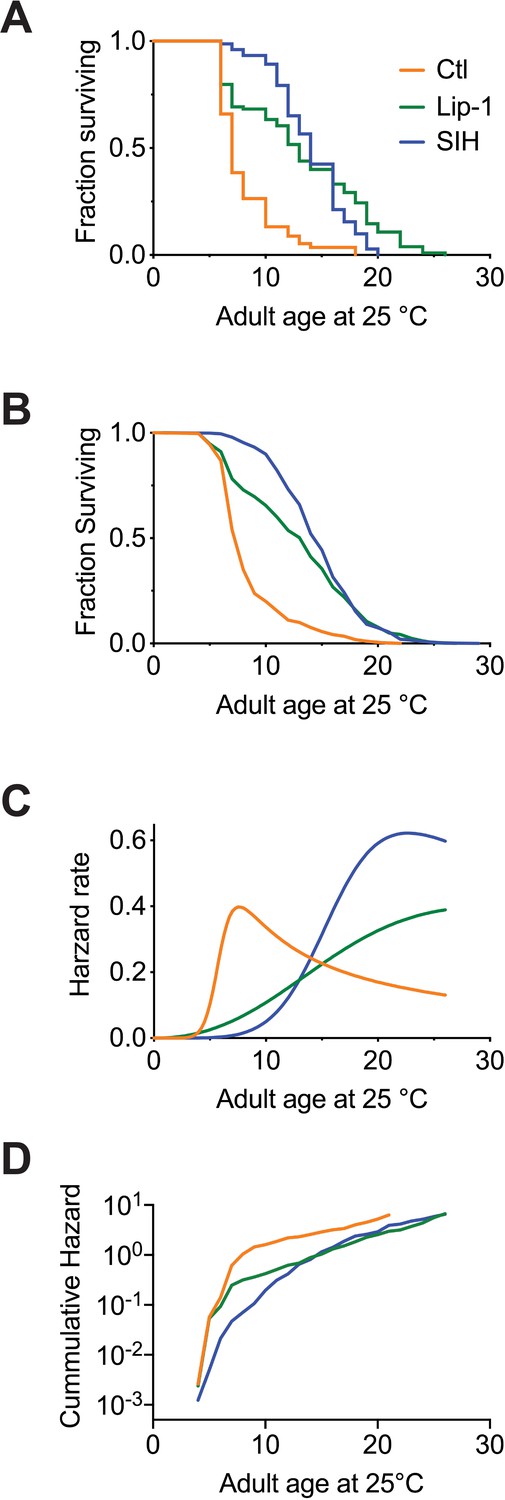
Inhibiting ferroptosis extends Caenorhabditis elegans lifespan.
Treatment with both Lip-1 and SIH extend lifespan. (A) Representative Kaplan-Meier survival curve from C. elegans treated with vehicle control (Ctl, median survival 7 days, death events n = 88); Lip-1 (median survival 13 days, Log-rank test p<0.001, n = 103) and SIH (median survival 14 days, p<0.001, n = 71) at 25°C. (B) Survival curve derived from pooled data from all eight replicate experiments (Ctl n = 709, Lip-1 n = 809, and SIH n = 720; see Supplementary file 4) at 25°C. (C) Plot of hazard (mortality) rate against age at 25°C, derived from meta-analysis of pooled data (presented in B). Both SIH and Lip-1 alter mortality rates relative to control populations and are also distinct from each other. (see Supplementary file 5).
-
Figure 5—source data 1
Data for survival comparisons.
- https://cdn.elifesciences.org/articles/56580/elife-56580-fig5-data1-v1.xlsx
Figure 5—figure supplement 1
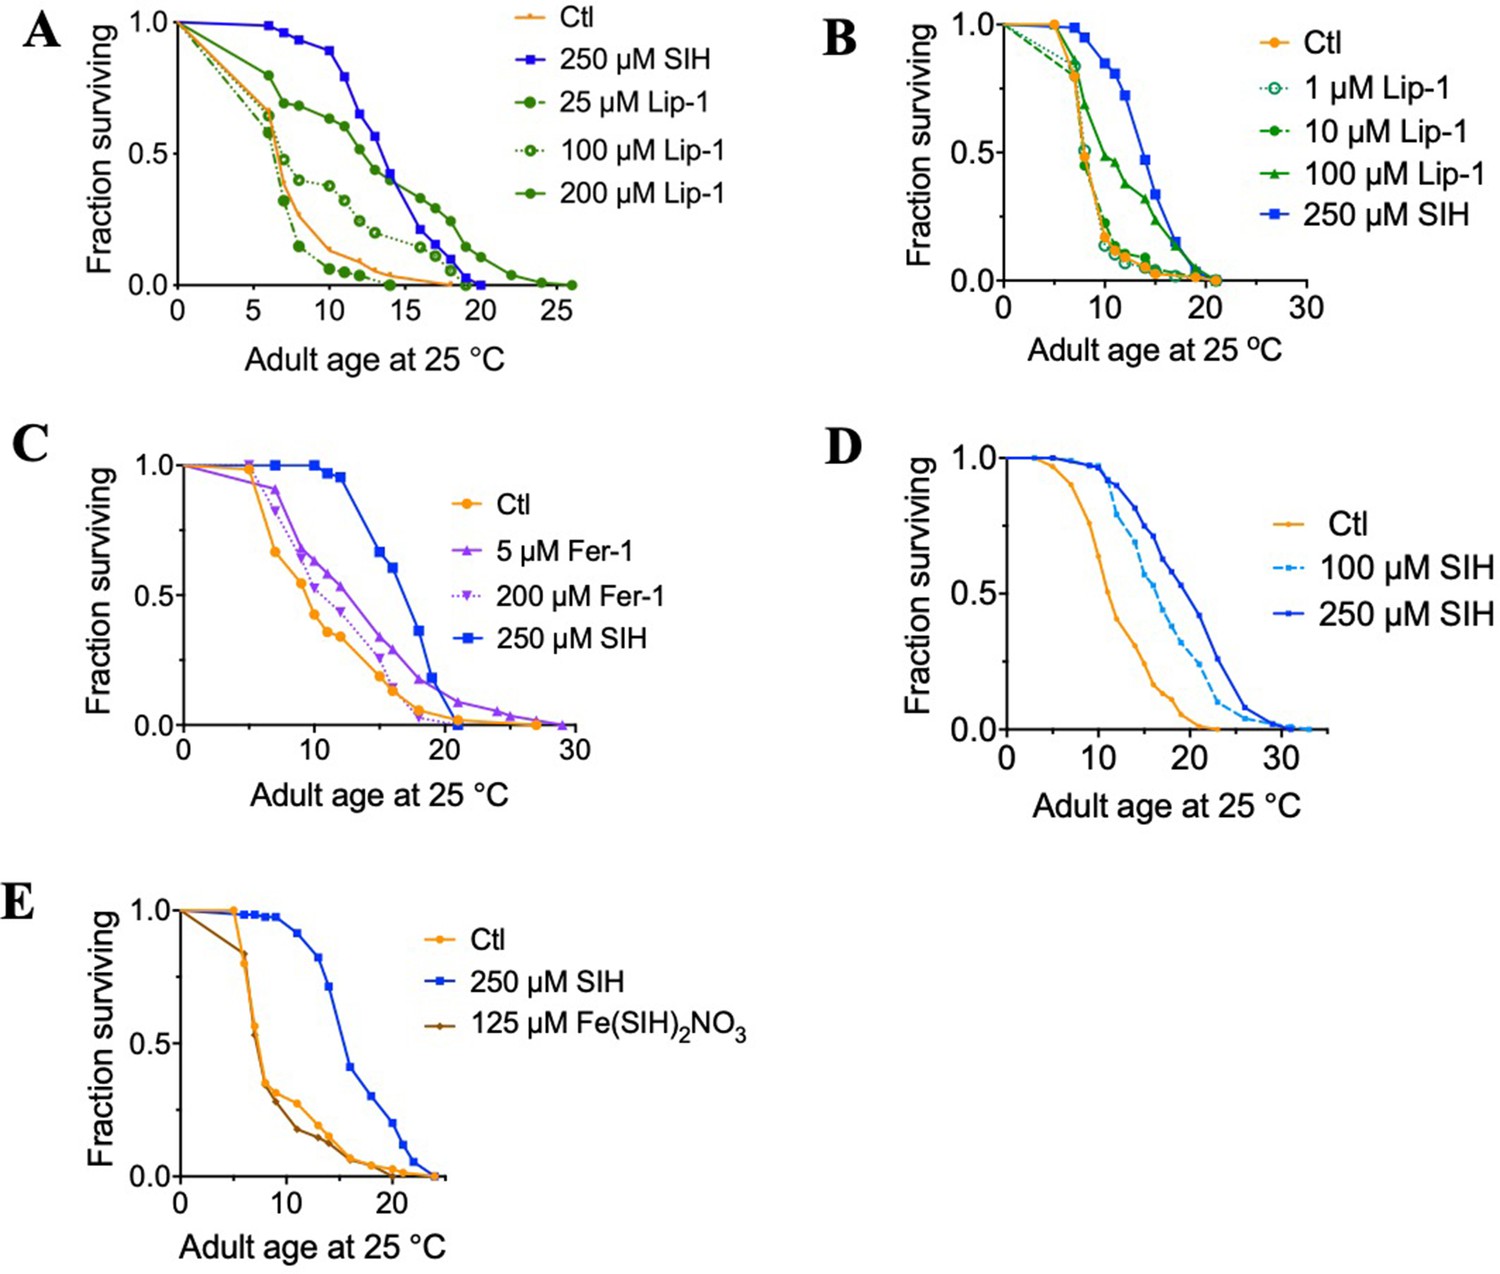
Dose response of SIH, Liproxstatin-1 and Ferrostatin-1.
(A) Median survival (Log-rank (Mantel-Cox) test: Control = 6 days; 25 μM Lip-1 = 6 days (p=0.07 ns); 100 μM Lip-1 = 6 days (p=0.006); 200 μM Lip-1 = 12 days (p<0.0001); 250 μM SIH = 13 days (p<0.0001) (B) Median survival (Log-rank (Mantel-Cox) test: Control = 7 days; 1 μM Lip-1 = 9 days (p=0.90 ns); 10 μM Lip-1 = 7 days (p=0.78 ns); 100 μM Lip-1 = 9 days (p<0.0001); 250 μM SIH = 13 days (p<0.0001) (C) Median survival (Log-rank (Mantel-Cox) test: Control = 10 days; 5 μM Fer-1 = 15 days (p=0.0047); 200 μM Fer-1 = 12 days (p=0.35 ns); 250 μM SIH = 18 days (p<0.0001) (D) Median survival (Log-rank (Mantel-Cox) test: Control = 12 days; 100 μM SIH = 17 days (p<0.0001); 250 μM SIH = 21 days (p<0.0001) (E) Median survival (Log-rank (Mantel-Cox) test: Control = 8 days; 125 μM Fe(SIH)2NO3, equimolar SIH = 8 days (p=0.51 ns); 250 μM SIH = 16 days (p<0.0001).
Figure 5—figure supplement 2
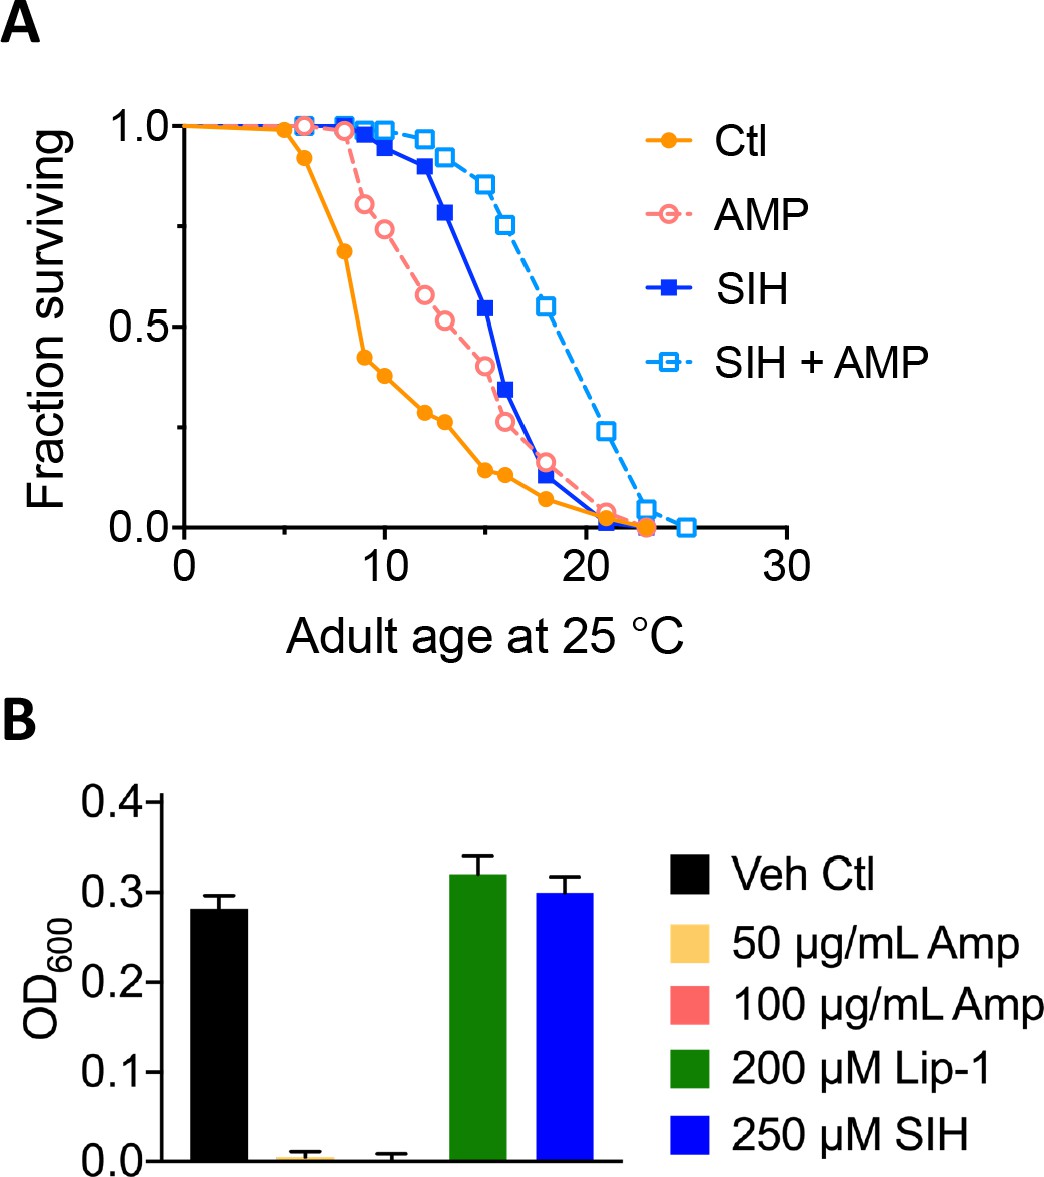
Antibiotic test.
To determine whether the increased lifespan seen with SIH treatment could be explained solely by an antibiotic effect of iron reduction, nematodes were treated with ampicillin, with and without SIH co-administration. Even in the presence of ampicillin, SIH increased median lifespan by 6 days, similar to its benefits in the absence of ampicillin (median increase of 7 days), as shown in A. Bacterial Growth Assay: The effects of test compounds on growth of the OP50 E. coli feed was assayed using optical density at 600 nm (OD600). Using standard microtitre plates, replicate wells of 200 µL of sterile Luria broth were inoculated with 2 µL of an overnight OP50 culture in addition to the stated final concentrations of ampicillin (Amp), Lip-1 and SIH. OD600 measures were taken after 12 hr in an EnSpire (PerkinElmer) spectrophotometric plate reader preset to 37°C, with 30 s of 200 rpm orbital shaking every 10 min. Data were averaged across duplicate experiments, each with eight replicate wells per treatment where a baseline of Luria broth without an inoculate was subtracted. Results, shown in B, indicated that ampicillin at either 50 or 100 µg/mL completely suppressed bacterial growth. In contrast, neither Lip-1 nor SIH suppressed bacterial growth. (A) Administration of the antibiotic ampicillin and SIH; AMP = 50 mg / ml ampicillin. Median survival - Log-rank (Mantel-Cox) test: Control (Ctl) = 9 days; AMP = 15 days (p<0.0001); 250 mM SIH = 16 days (p<0.0001); 250 mM SIH + AMP = 21 days (p<0.0001). (B) Effects of compounds on growth of OP50 E. coli. Ampicillin at either 50 or 100 µg/mL completely suppressed bacterial growth. Lip-1 and SIH did not suppress growth.
Figure 6 with 1 supplement
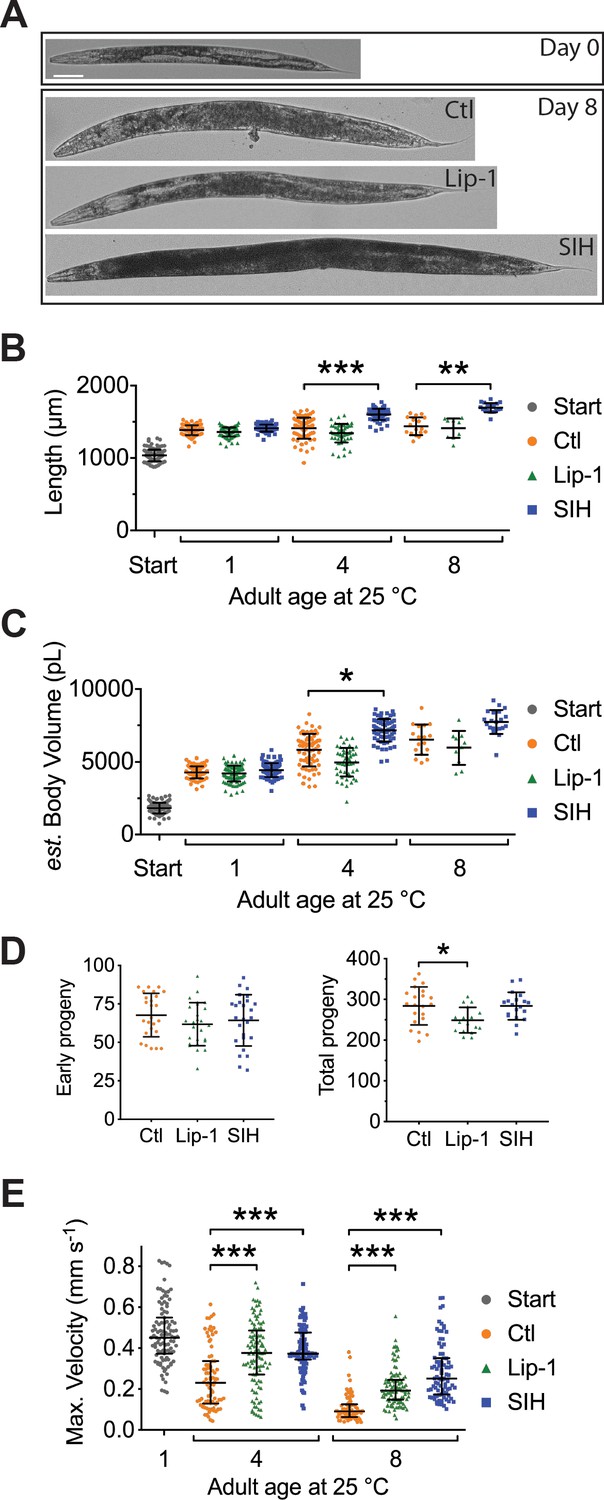
Lip-1 and SIH block frailty in C. elegans.
In all panels, vehicle control (0.5% v/v DMSO, Ctl)-treated worms are shown in orange, Lip-1-treated (200 µM Lip-1) are green and SIH-treated (250 µM SIH) are blue.
Significant differences between treatments are highlighted where * indicates p<0.05, ** indicates p<0.01 and *** indicates p<0.001. (A) Micrograph of an adult C. elegans on the first day of treatment (Day 0) and animals treated with Ctl, Lip-1 or SIH for eight days at 25°C (Day 8). Scale bar = 50 µm. (B) Estimates of adult body length (in µm), showing SIH- treated animals (blue) have longer average body length compared to age matched control (orange)or Lip-1 (green) treated populations (Kruskal-Wallis ANOVA: H(10) = 432.6, p<0.0001; see Supplementary file 6 for sample summary and pair-wise comparisons). Start (grey) represents the beginning population of L4/young adults grown from egg at 25°C for 48 hr prior to transfer to treatment plates. Each point represents an individual worm, with mean and error bars representing standard deviation (SD) (C) Estimated adult body volume (in pL), showing increased body volume with adult age for all groups (Kruskal-Wallis ANOVA: H(10) = 489, p<0.0001; see Supplementary file 6 for sample summary and pair-wise comparisons), with SIH treated animals having even greater body volume. Each point represents an individual worm, with mean ± SD. (D) Early fertility (first 24 hr) and total reproductive output are unaltered when vehicle control (Ctl)-treated cohorts are compared to Lip-1 or SIH-treated animals at 25°C. Each data point represents an estimate from a single C. elegans adult, with mean ± SD. Sample size: early fertility Ctl n = 25, Lip-1 n = 26, SIH n = 26; total Ctl n = 21, Lip-1 n = 17, SIH n = 19 (ANOVA: Early fertility F(2,74)=0.996, p=0.37; Total fertility F(2,57) = 4.89, p=0.011). (E) Estimates of maximum velocity achieved by aged and treated cohorts of C. elegans. Treatment with either Lip-1 or SIH attenuates the age-related decline in maximum velocity (Kruskal-Wallis ANOVA: H(7) = 298.5, p<0.0001; see Supplementary file 6 for sample summary and pair-wise comparisons). Each data point represents an estimate from a single C. elegans adult, with median ±interquartile range. Equivalent analyses of mean velocity and total distance travelled (and how these data correlate) are shown in Figure 6—figure supplement 1 and Supplementary file 6).
-
Figure 6—source data 1
Data for fertility, size and movement.
- https://cdn.elifesciences.org/articles/56580/elife-56580-fig6-data1-v1.xlsx
Figure 6—figure supplement 1

Movement analysis.
Movement parameters measured included maximum velocity (shown in Figure 6E), mean velocity and total distance travelled. The latter two datasets are represented in Figure 6-figure supplement A and B. Pooling all groups and ages reveals that all movement parameters (maximum velocity, mean velocity and distance travelled in 30 s) are all positively correlated, as shown in (C). (A) Estimates of mean velocity (mm s−1) achieved by aged and treated cohorts of C. elegans. (Grey = starting population, red = control, green = Lip-1-treated, blue = SIH-treated) Treatment with either Lip-1 or SIH attenuates the age-related decline in mean velocity (Kruskal-Wallis ANOVA: H(7) = 339.2, p<0.0001), see Supplementary file 6 for summary data and pair-wise comparisons). (B) Estimates of total distance travelled (in 30 s) by aged and treated cohorts of C. elegans. (Grey = starting population, red = control, green = Lip-1-treated, blue = SIH-treated) Treatment with either Lip-1 or SIH attenuates the age-related decline in distance travelled (Kruskal-Wallis ANOVA: H(7) = 340.6, p<0.0001)see Supplementary file 6 for summary data and pair-wise comparisons). C: Correlation of estimated movement parameters.
Figure 7
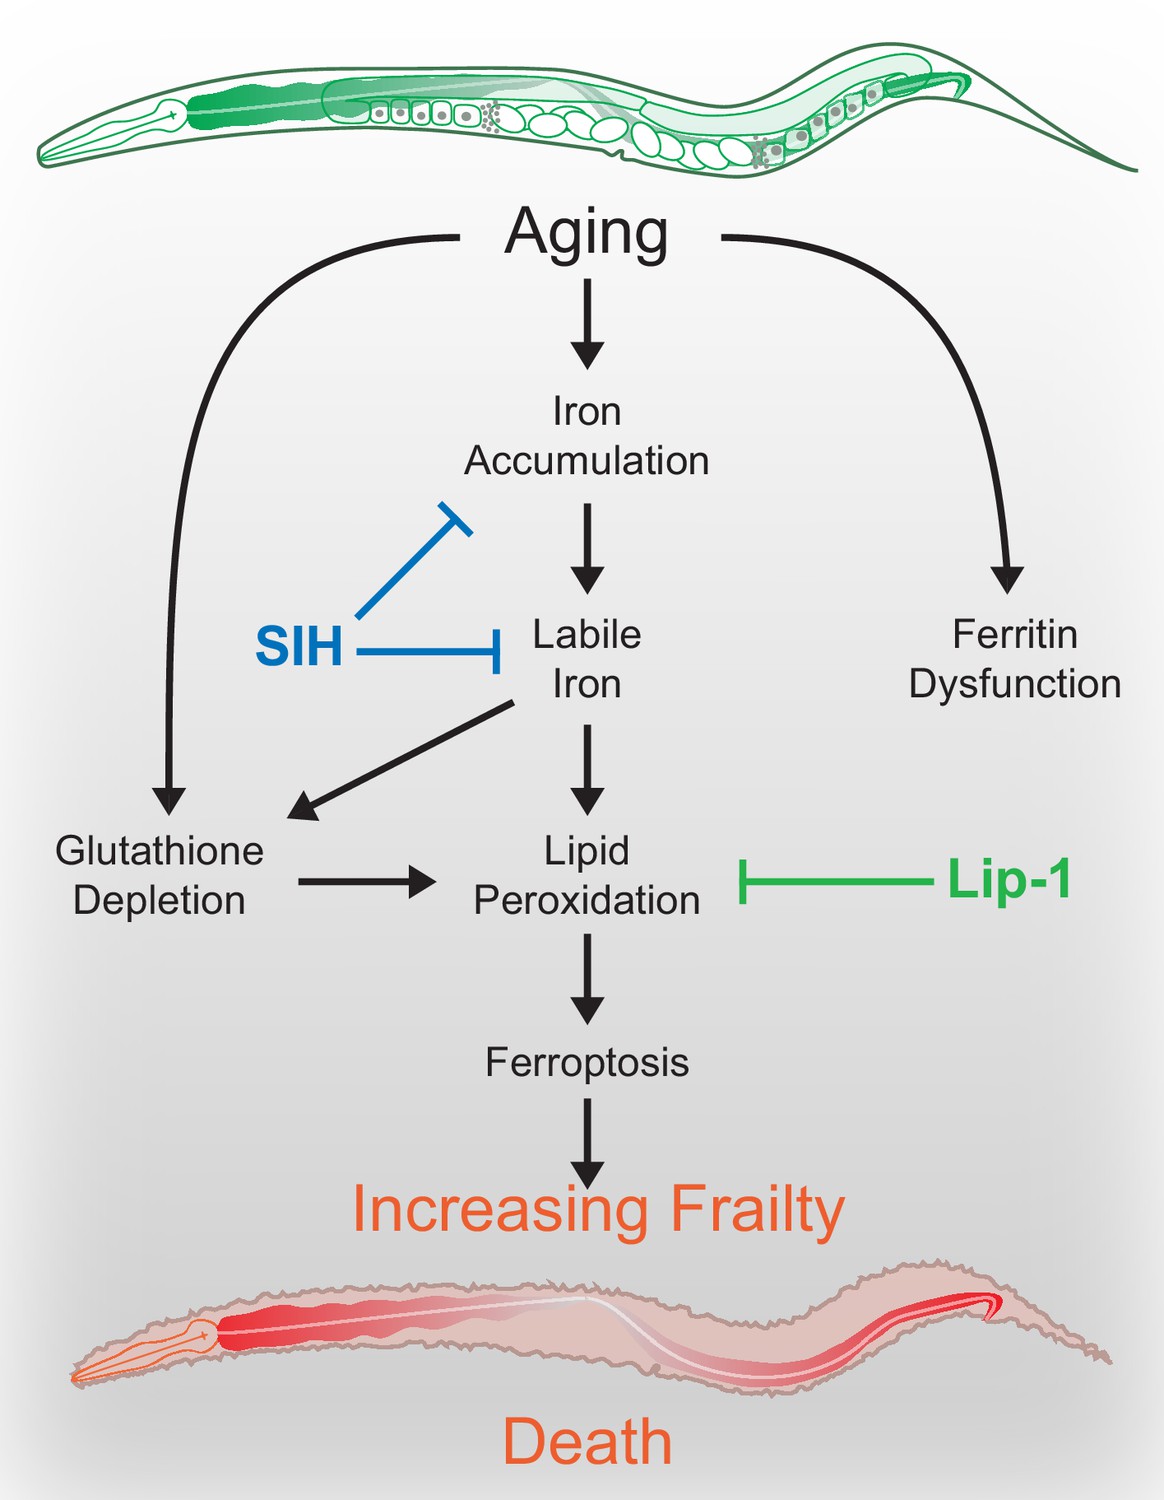
Schematic overview.
During normal aging iron unnecessarily accumulates. The safe storage of surplus iron in ferritin begins to fail in late life, causing a corresponding elevation of reactive, ‘labile’ iron. In combination with falling glutathione levels there is increased risk of ferroptotic cell death, via lipid peroxidation signals. These cell death events increase frailty and ultimately shorten organism lifespan. These pharmacological interventions potentially represent targets to improve late life vigour and fitness.
Chemical structure 1
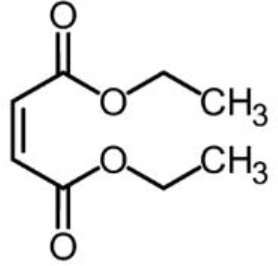
Diethyl maleate (DEM) obtained from Sigma-Aldrich.
Chemical structure 2
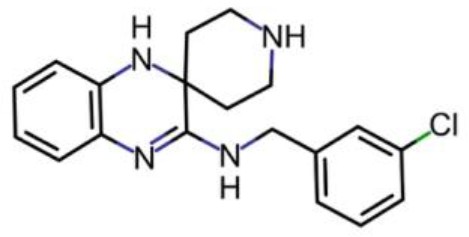
Liproxstatin (Lip-1; N-[(3-chlorophenyl) methyl]-spiro[piperidine-4,2'(1'H)-quinoxalin]−3'-amine) obtained from the laboratory of Marcus Conrad (initially) and subsequently ApexBio Tech LLC.
Chemical structure 3
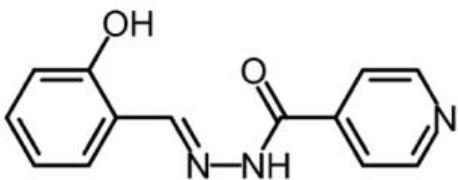
Salicylaldehyde isonicotinoyl hydrazone (SIH) obtained from the laboratory of Des Richardson (University of Sydney).
Author response image 1
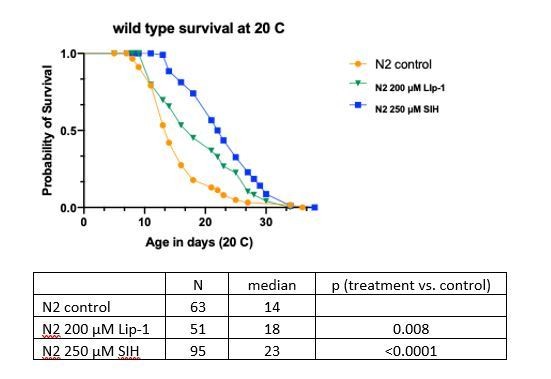
Wild type survival at 20 °C.
Tables
Key resources table
| Reagent type (species) or resource | Designation | Source or reference | Identifiers | Additional information |
|---|---|---|---|---|
| Strain, strain background (Caenorhabditis elegans, hermaphrodite) | Wild type | Caenorhabditis Genetics Center (CGC) | N2 | |
| Strain, strain background (Caenorhabditis elegans, hermaphrodite) | spe-9(hc88); rrf-3(b26) | Caenorhabditis Genetics Center (CGC) | TJ1060 | temperature sensitive-sterile strain |
| Strain, strain background (Caenorhabditis elegans, hermaphrodite) | zIs356 [Pdaf-16::daf-16a/b::gfp + rol-6(su1006)] | Caenorhabditis Genetics Center (CGC) | TJ356 | DAF-16 reporter strain |
| Antibody | 4-HNE protein adduct antibody (goat polyclonal) | Millipore | Cat.#: AB5605 | (1:2000 dilution) |
| Antibody | anti-Tubulin antibody (mouse monoclonal) | Sigma-Aldrich | Cat.#: T6074 | (1:10,000 dilution) |
| Commercial assay or kit | Thiobarbituric acid reactive substances (TBARS) assay kit | Caymen Chemical | Cat.#: 10009055 | |
| Commercial assay or kit | BCA Protein assay kit | Pierce | Cat.#: 23225 | |
| Chemical compound, drug | Diethyl maleate | Sigma-Aldrich | DEM Cat.#: D97703-100G | |
| Chemical compound, drug | Liproxstatin | Marcus Conrad (Helmholtz Zentrum München; initially) and subsequently ApexBio Tech LLC | Lip-1 | N-[(3-chlorophenyl) methyl]-spiro[piperidine-4,2'(1'H)-quinoxalin]−3'-amine) |
| Chemical compound, drug | Salicylaldehyde isonicotinoyl hydrazone | Des Richardson (University of Sydney) | SIH | |
| Software, algorithm | GeoPIXE 7.3, Dynamic Analysis | CSIRO | Ryan, 2000. Quantitative trace element imaging using PIXE and the nuclear microprobe. Int J Imag Syst Tech 11, 219–230. | |
| Software, algorithm | ImageJ WormSizer plugin | Moore, B.T., Jordan, J.M., and Baugh, L.R. (2013). WormSizer: high-throughput analysis of nematode size and shape. PLoS One 8, e57142. | ||
| Software, algorithm | Prism v7.0a, GraphPad Software | www.graphpad.com | ||
| Software, algorithm | R package flexsurv | rdocumentation.org/packages/flexsurv | ||
| Software, algorithm | Image J, wrMTrck plugin | Nussbaum-Krammer, C.I., Neto, M.F., Brielmann, R.M., Pedersen, J.S., and Morimoto, R.I. (2015). J Vis Exp, 52321 | ||
| Other | propidium iodide | Life Technologies | P3566 | 0.25 mg/mL solution |
Additional files
-
Supplementary file 1
Statistical analysis for Figure 1.
- https://cdn.elifesciences.org/articles/56580/elife-56580-supp1-v1.docx
-
Supplementary file 2
Statistical analysis for Figure 3.
- https://cdn.elifesciences.org/articles/56580/elife-56580-supp2-v1.docx
-
Supplementary file 3
Statistical analysis for Figure 4 and Figure 4—figure supplement 2.
- https://cdn.elifesciences.org/articles/56580/elife-56580-supp3-v1.docx
-
Supplementary file 4
Statistical analysis for Figure 5.
- https://cdn.elifesciences.org/articles/56580/elife-56580-supp4-v1.docx
-
Supplementary file 5
Details for temporal scaling analysis associated with Figure 5.
- https://cdn.elifesciences.org/articles/56580/elife-56580-supp5-v1.docx
-
Supplementary file 6
Statistical analysis for Figure 6.
- https://cdn.elifesciences.org/articles/56580/elife-56580-supp6-v1.docx
-
Supplementary file 7
The figures showing the ROIs associated with each iron map (ROI; white = overlapped/fractional, green = whole/minimally overlapped, red = excluded from analysis).
Shown are the masks used to identify and analyse the iron elemental maps of TJ1060 populations at different adult ages ± Lip-1 or SIH at 25°C. (A) Masks for 1 day old adults (starting population) (B) Masks for 4 day old Control adults (C) Masks for 4 day old SIH-treated adults (D) Masks for 4 day old Lip-1 treated adults E: Masks for 8 day old Control adults (F) Masks for 8 day old 250 µM SIH-treated adults (G) Masks for 8 day old 200 µM Lip-1-treated adults.
- https://cdn.elifesciences.org/articles/56580/elife-56580-supp7-v1.pdf
-
Transparent reporting form
- https://cdn.elifesciences.org/articles/56580/elife-56580-transrepform-v1.docx
Download links
A two-part list of links to download the article, or parts of the article, in various formats.
Downloads (link to download the article as PDF)
Open citations (links to open the citations from this article in various online reference manager services)
Cite this article (links to download the citations from this article in formats compatible with various reference manager tools)
Changes in ferrous iron and glutathione promote ferroptosis and frailty in aging Caenorhabditis elegans
eLife 9:e56580.
https://doi.org/10.7554/eLife.56580


