Hyperalignment: Modeling shared information encoded in idiosyncratic cortical topographies
- Center for Cognitive Neuroscience, Dartmouth College, United States
- Vicarious AI, United States
- Princeton Neuroscience Institute, United States
Figures
Figure 1
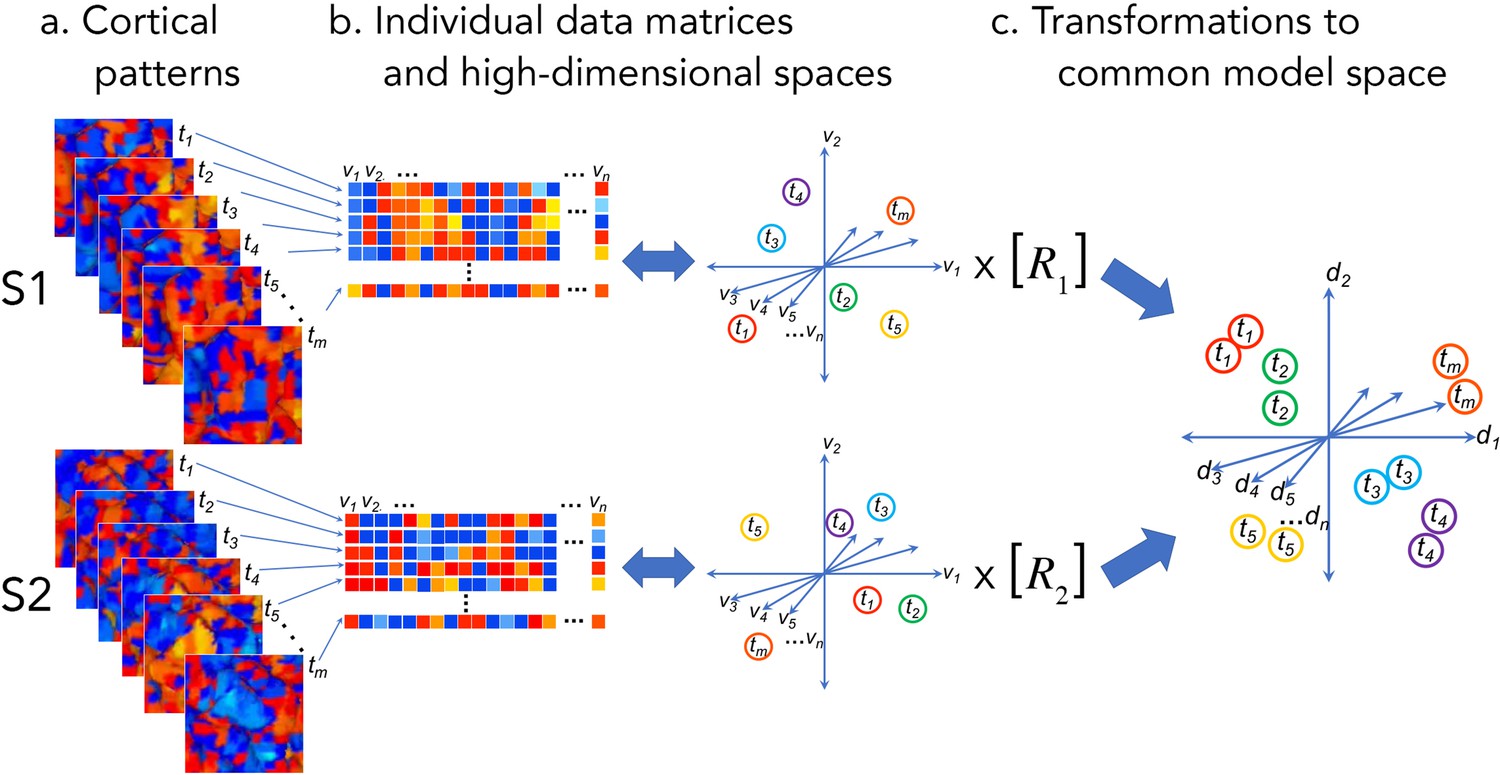
Cortical patterns as vectors in individual and common high-dimensional information spaces.
Cortical functional patterns (a) are analyzed as data matrices of vectors in high-dimensional cortical feature spaces (b). Hyperalignment transforms individual information spaces based on cortical loci into a common model space in which pattern vectors for the same brain state (corresponding to a given stimulus, condition, or task) are aligned across brains (c). With fMRI data, cortical patterns are typically responses at different time points or connectivities to different targets (t), brain loci are voxels or cortical vertices (v), transformations are matrices (R), and common model coordinate axes are dimensions (d).
Figure 2
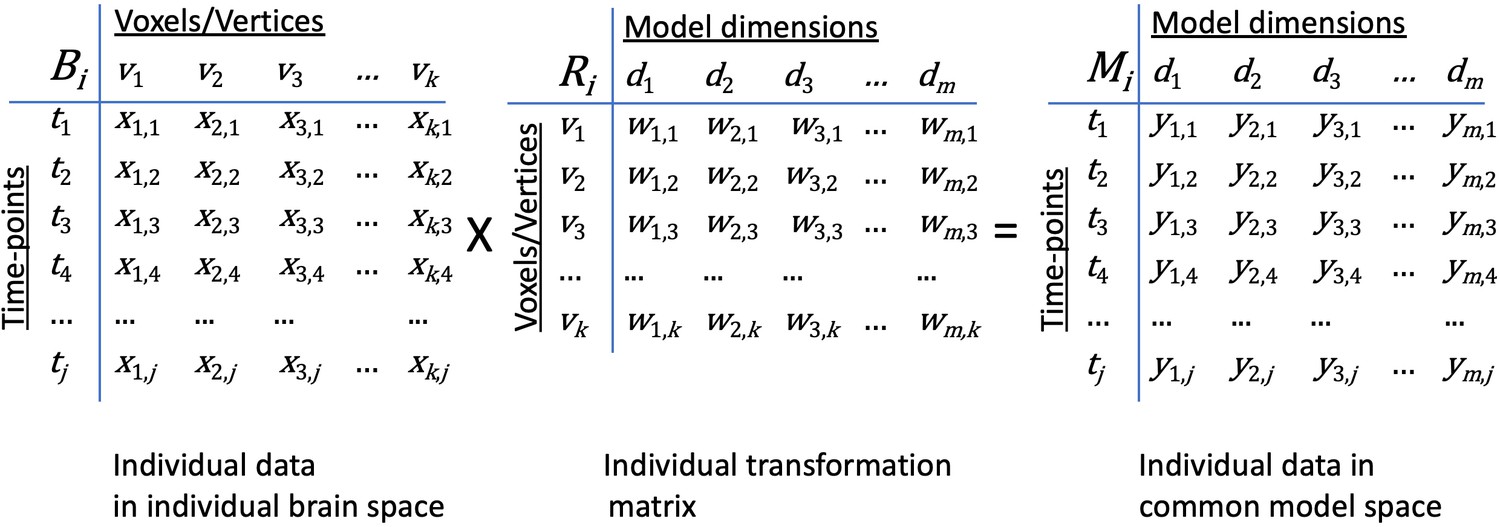
Transformation of data in individual brain coordinate space into common information space coordinates.
An individual brain data matrix in cortical space (Bi) consists of j rows of patterns (t) with k columns of cortical loci (v). Patterns can be neural activity for time-points, stimuli, or conditions; patterns of connectivity with targets; or other measures that vary across cortical loci. The transformation matrix for that individual (Ri) consists of k rows of cortical loci (v) with m columns of model dimensions (d). Multiplying these matrices transforms the individual brain data matrix, Bi, into the model space coordinates (Mi) with rows of activity or connectivity patterns, t, in model dimension coordinates, d). Elements in brain data matrices (x in Bi) are measures of local neural activity or connectivity of that locus with a connectivity target. Elements in transformation matrices (w in Ri) are weights. Data in the model space matrix (y in Mi) are weighted sums of measures from cortical loci (x in Bi).
Figure 3
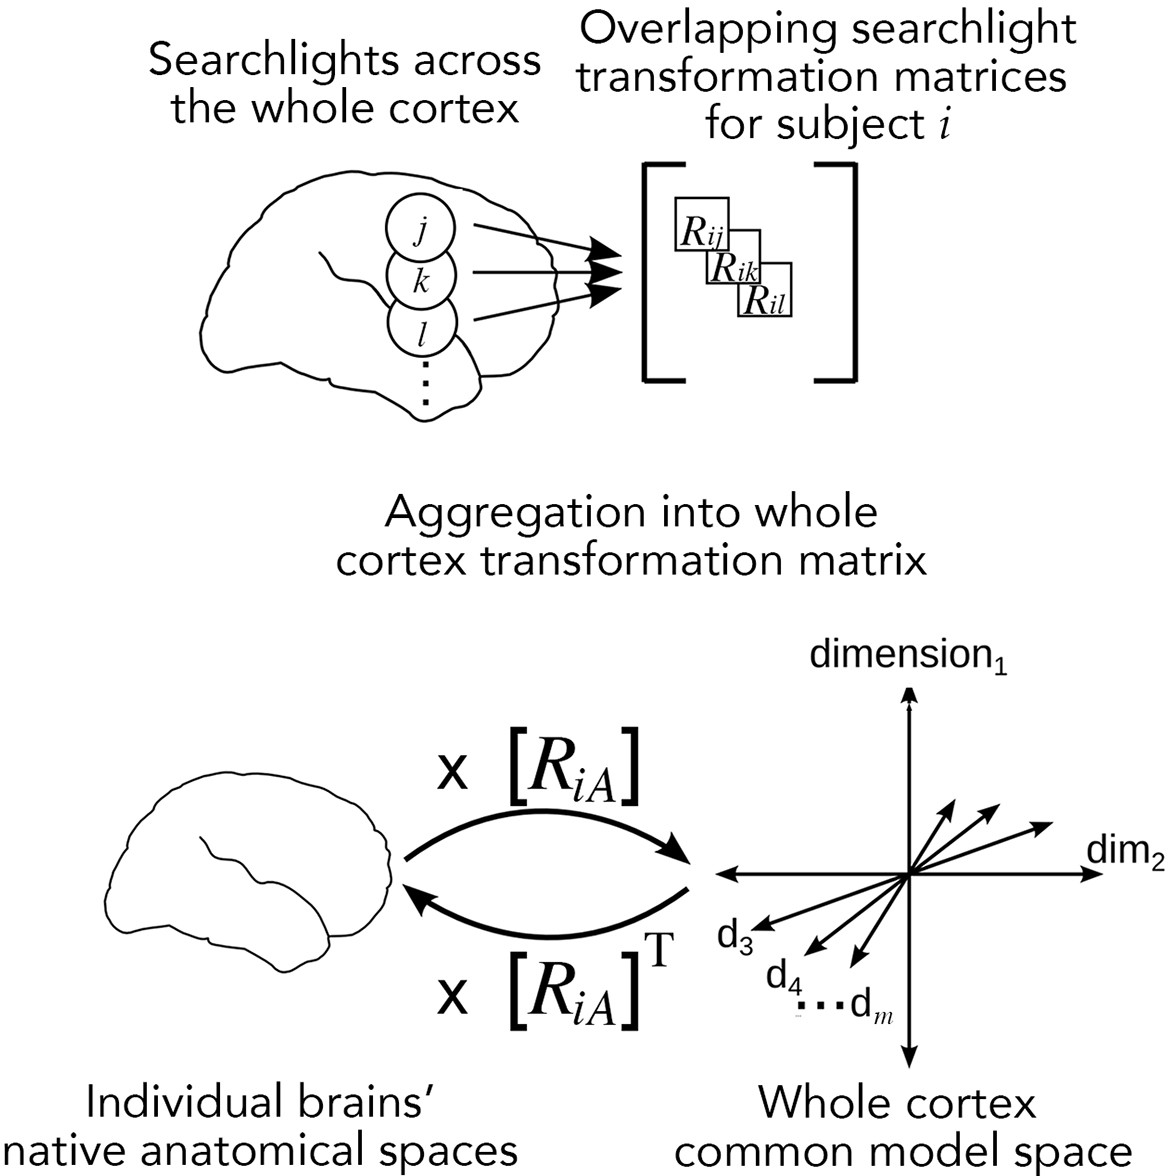
Searchlight hyperalignment for building a common model and transformation matrices for the whole cortex.
Overlapping transformation matrices (Rij, Rik, …) are calculated for overlapping searchlights in each subject and aggregated into a single whole-cortex transformation matrix, RiA. The transpose of the transformation matrix, RiAT, allows pattern vectors from the common model space to be projected into an individual brain’s topographies. The aggregation step results in a whole-cortex transformation that is mostly orthogonal locally (Guntupalli et al., 2016) but globally nonorthogonal.
Figure 4
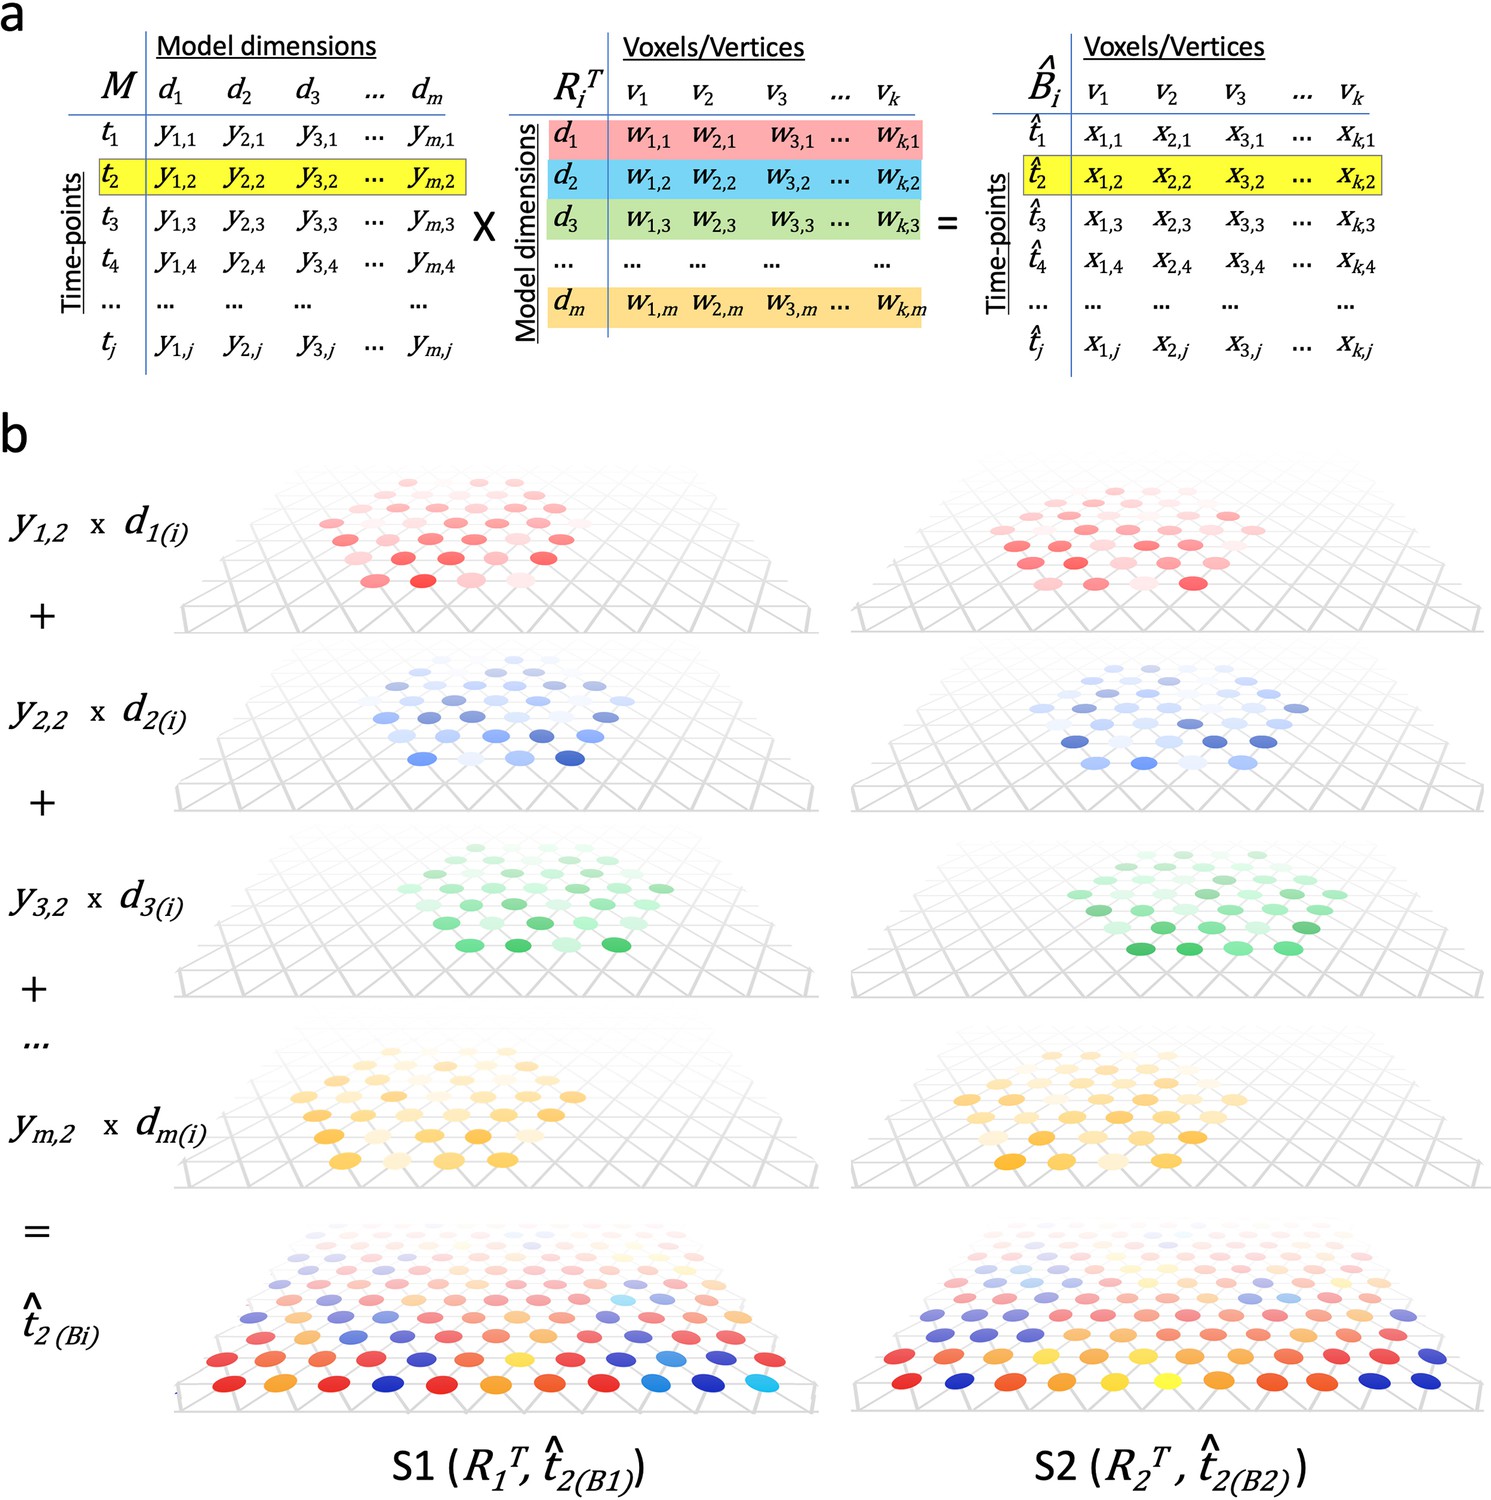
Modeling individual cortical patterns using model topographic basis functions.
(a) Matrix multiplication for modeling cortical patterns in individual brains (t2(Bi)) by multiplying a pattern vector (t2) in the model space (M) and the transpose of individual-specific transformation matrices (RiT). (b) Illustration of topographic basis functions in two subjects, S1 and S2, for model dimensions (d1, d2, d3, …, dm), which are comprised of weights (w’s in RiT) across vertices in overlapping but non-coextensive patches of cortex. This image is illustrative and not based on experimental data. Two hypothetical subjects’ basis functions are illustrated to emphasize that these functions are individual-specific and support the same shared information from M in variable topographic patterns in individual brains. Transformation matrix weights (w) are illustrated as colored circles of varying intensity at vertices of a stylized triangular cortical mesh. The pattern of weights for each basis function varies across brains. These topographic basis functions are combined as a weighted sum, using the weights from a pattern vector (e.g., t2) in the model data matrix (y1,2, y2,2, y3,2, …, ym,2 in M) to model or predict a topographic pattern (t̂2(Bi)) in an individual subject’s cortex. The same weights in the model pattern vector predict different patterns of response in each individual brain. The predicted topographic patterns (t̂2(Bi)) are illustrated as values at each vertex of a triangular cortical mesh using a typical color scale with negative values in shades of blue and positive values in shades of red, orange, and yellow.
Figure 5

Enhancement of between-subject multivariate pattern classification (bsMVPC) and intersubject correlation (ISC) of representational geometry with hyperalignment.
(a) Accuracy of bsMVPC of movie time segments from anatomically-aligned and hyperaligned data (reproduced from Figure 2, Guntupalli et al., 2016). Chance performance is less than 0.1%. (b) ISC of representational geometry for movie time points (reproduced from Figure 3, Guntupalli et al., 2016). Representational geometry for a movie is calculated as the matrix of pairwise similarities between responses to different time-points (>1300 time-points; >800,000 pairs).
Figure 6
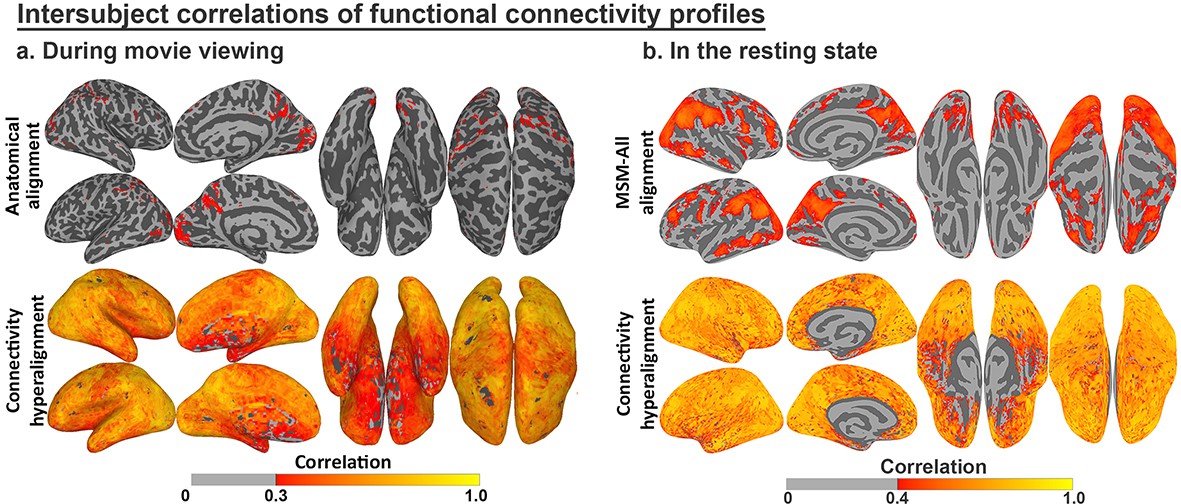
Enhancement of intersubject correlation (ISC) of functional connectivity profiles after connectivity hyperalignment.
(a) ISC of connectivity profiles measured during movie viewing (reproduced from Figure 3, Guntupalli et al., 2018). (b) ISC of connectivity profiles measured in the resting state (reproduced from Figure 4, Guntupalli et al., 2018).
Figure 7
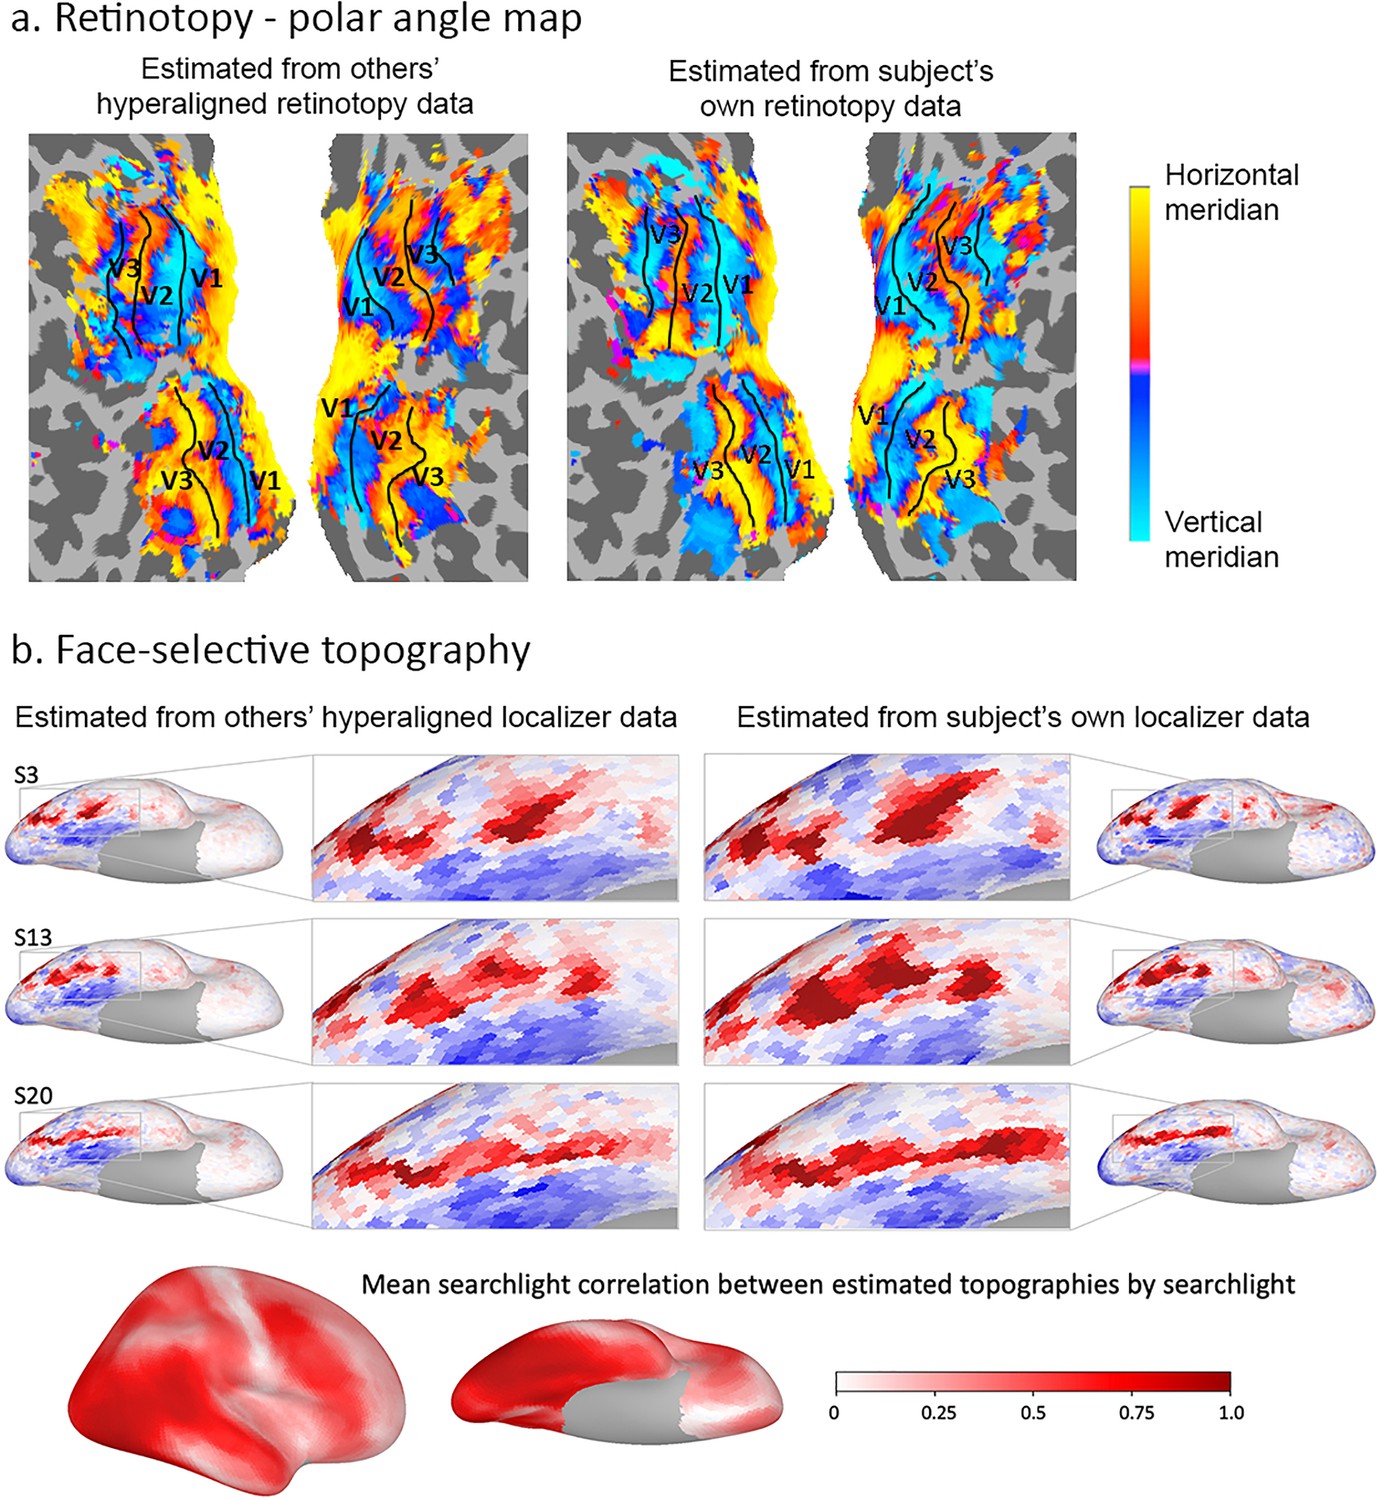
Estimation of functional topographies in individual brains based on data from other brains that are projected into an individual’s cortical space using transformation matrices calculated with hyperalignment based on data gathered while subjects watched a movie.
(a) Retinotopic map of polar angle based on other subjects’ retinotopy localizer fMRI data projected into a subject’s visual cortex (left) and based on that subject’s own retinotopy localizer fMRI data (adapted from Figure 7, Guntupalli et al., 2016). (b) Face-selective topography based on other subjects’ face-selectivity localizer fMRI data projected into three subjects’ cortical anatomy using hyperalignment and based on their own localizer data (from Jiahui et al., 2019). Ventral views of the right hemisphere with enlarged images of occipital and posterior temporal cortices. Local correlations in searchlights between estimates based on others subjects’ data and estimates based on own data exceeded 0.80 in posterior ventral temporal, lateral occipital, and posterior superior temporal cortices and strong correlations extend into anterior ventral temporal, anterior superior temporal sulcal and lateral prefrontal cortices (lower image). Subject numbers match those in Supplementary Figure 2 in Jiahui et al., 2019.
Figure 8
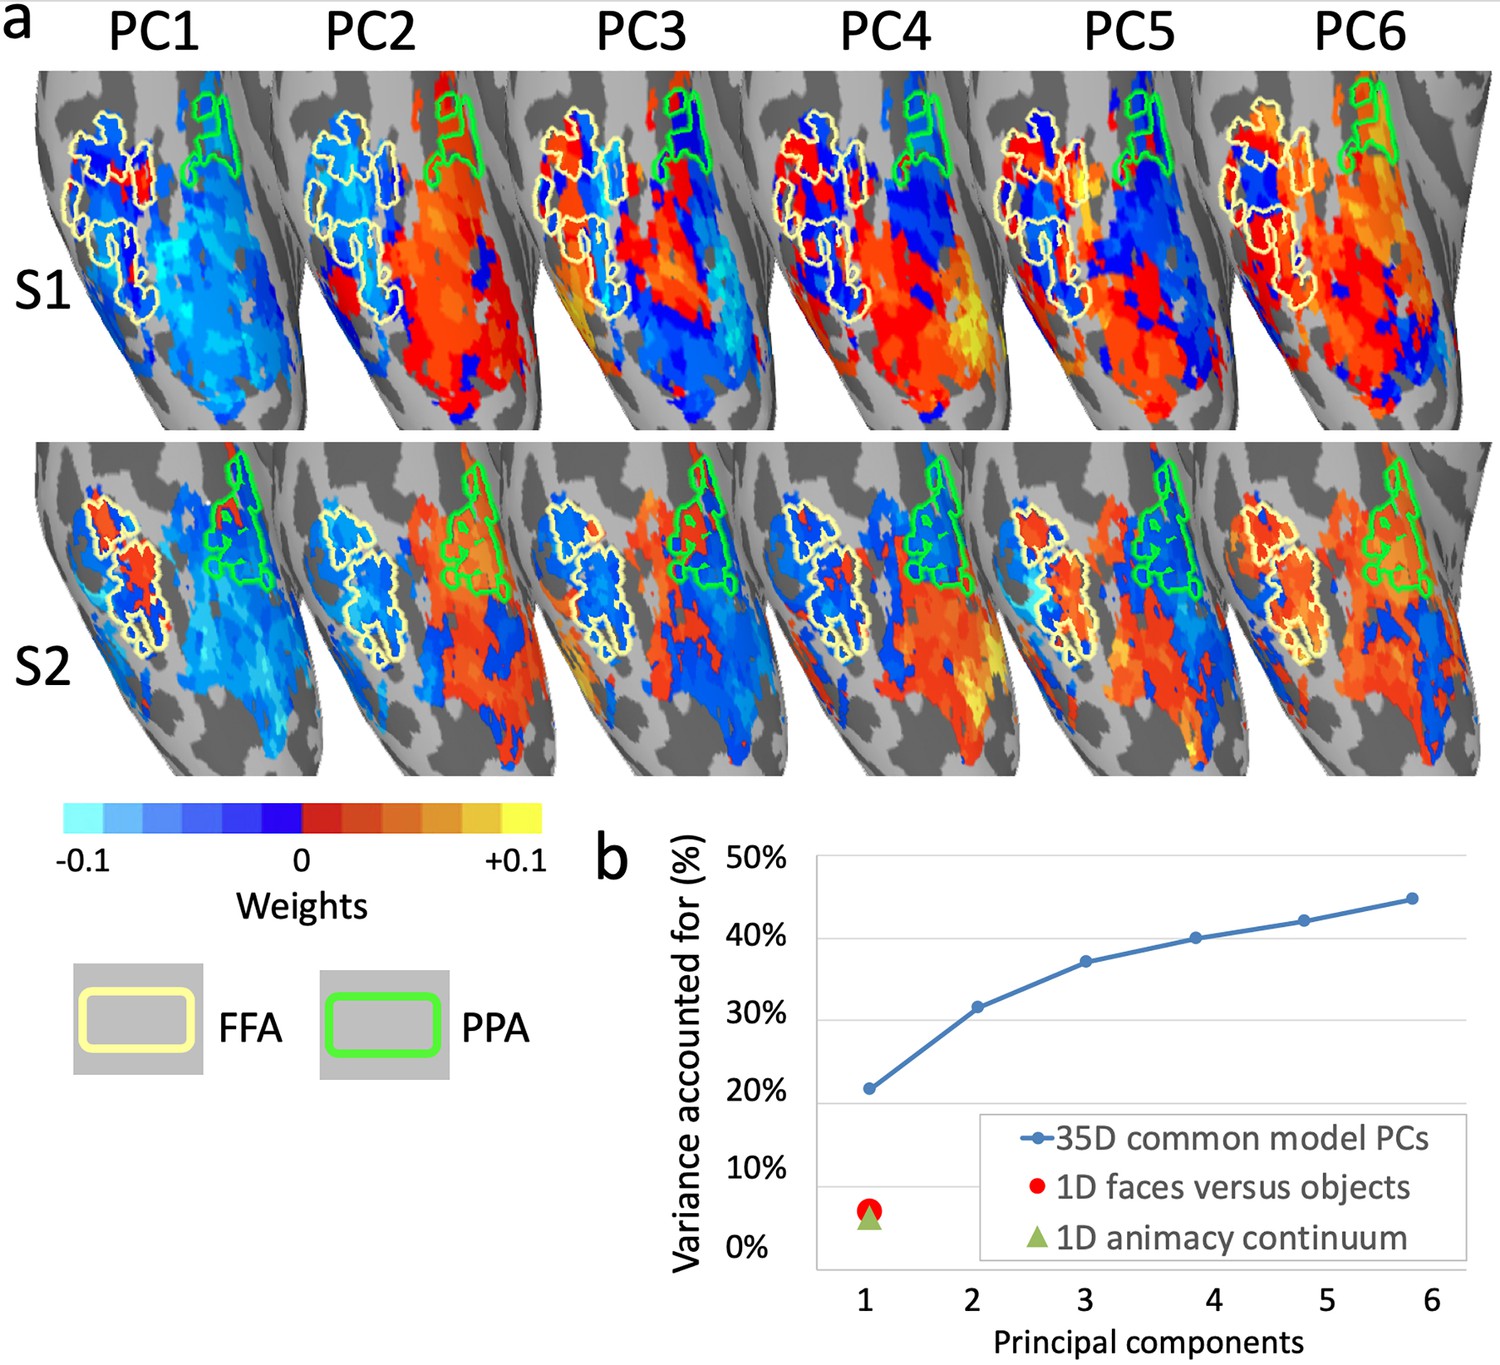
Topographic basis functions and comparison to one-dimensional models of functional topography.
(a) Topographic basis functions for two subjects, S1 and S2, for the top six principal components (PCs) in a common model of ventral temporal cortex and the linear discriminant, a weighted sum of PCs, for the contrast faces versus objects (from Haxby et al., 2011; only the right hemisphere cortex is shown here). The locations of the fusiform face area (FFA) and parahippocampal place area (PPA) are indicated with yellow and green outlines, respectively. (b) Cumulative variance accounted for by the top six PCs in a 35-dimensional common model compared to the variance accounted for by one-dimensional linear discriminants for face selectivity (responses to faces versus houses) and for the animacy continuum (responses to primates versus insects).
Figure 9
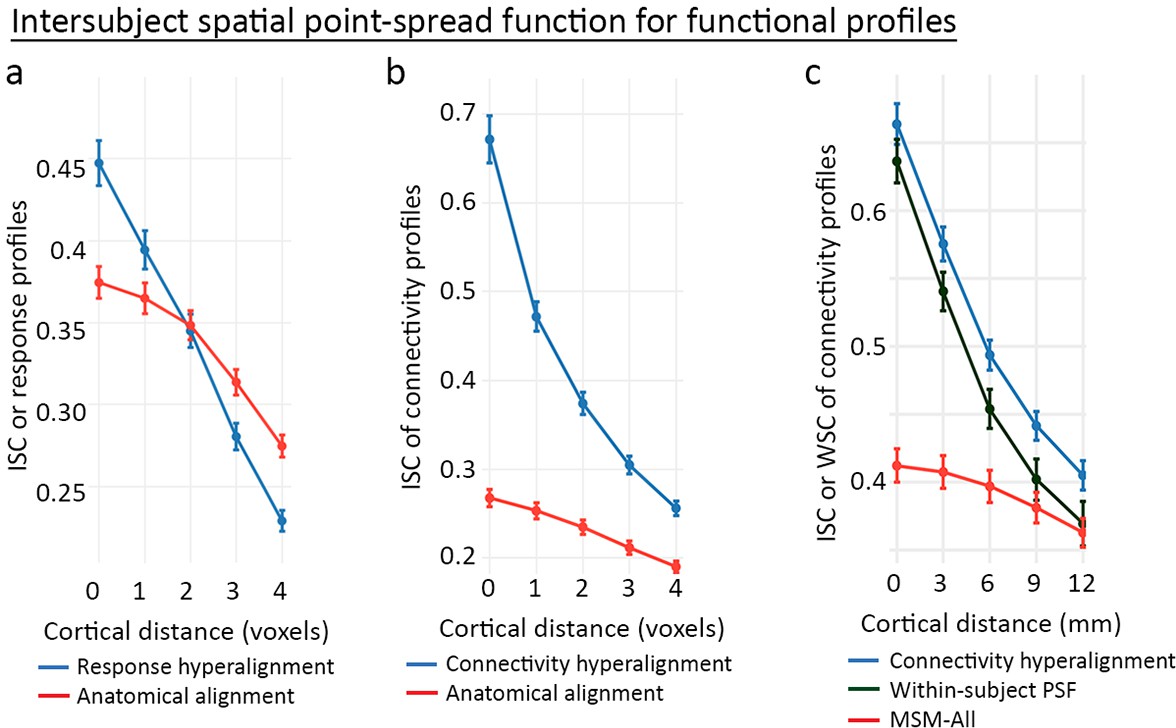
Spatial point-spread functions (PSFs) for intersubject correlations of time-series response profiles and connectivity profiles.
A greater negative slope indicates more spatially fine-grained functional selectivity. (a) Spatial PSFs for movie data response profiles (reproduced from Figure 5, Guntupalli et al., 2016). (b) Spatial PSFs for movie data connectivity profiles and c. resting state fMRI connectivity profiles with comparison to within-subject PSFs based on within-subject correlations between independent resting state sessions. Error bars are standard errors (SE) across participants, in which the value for each participant is the mean across searchlight ROIs (20 ROIs in a and 24 ROIs in b and c). MSM-All alignment is multimodal surface matching (Robinson et al., 2014). (Reproduced from Figure 5, Guntupalli et al., 2018).
Figure 10
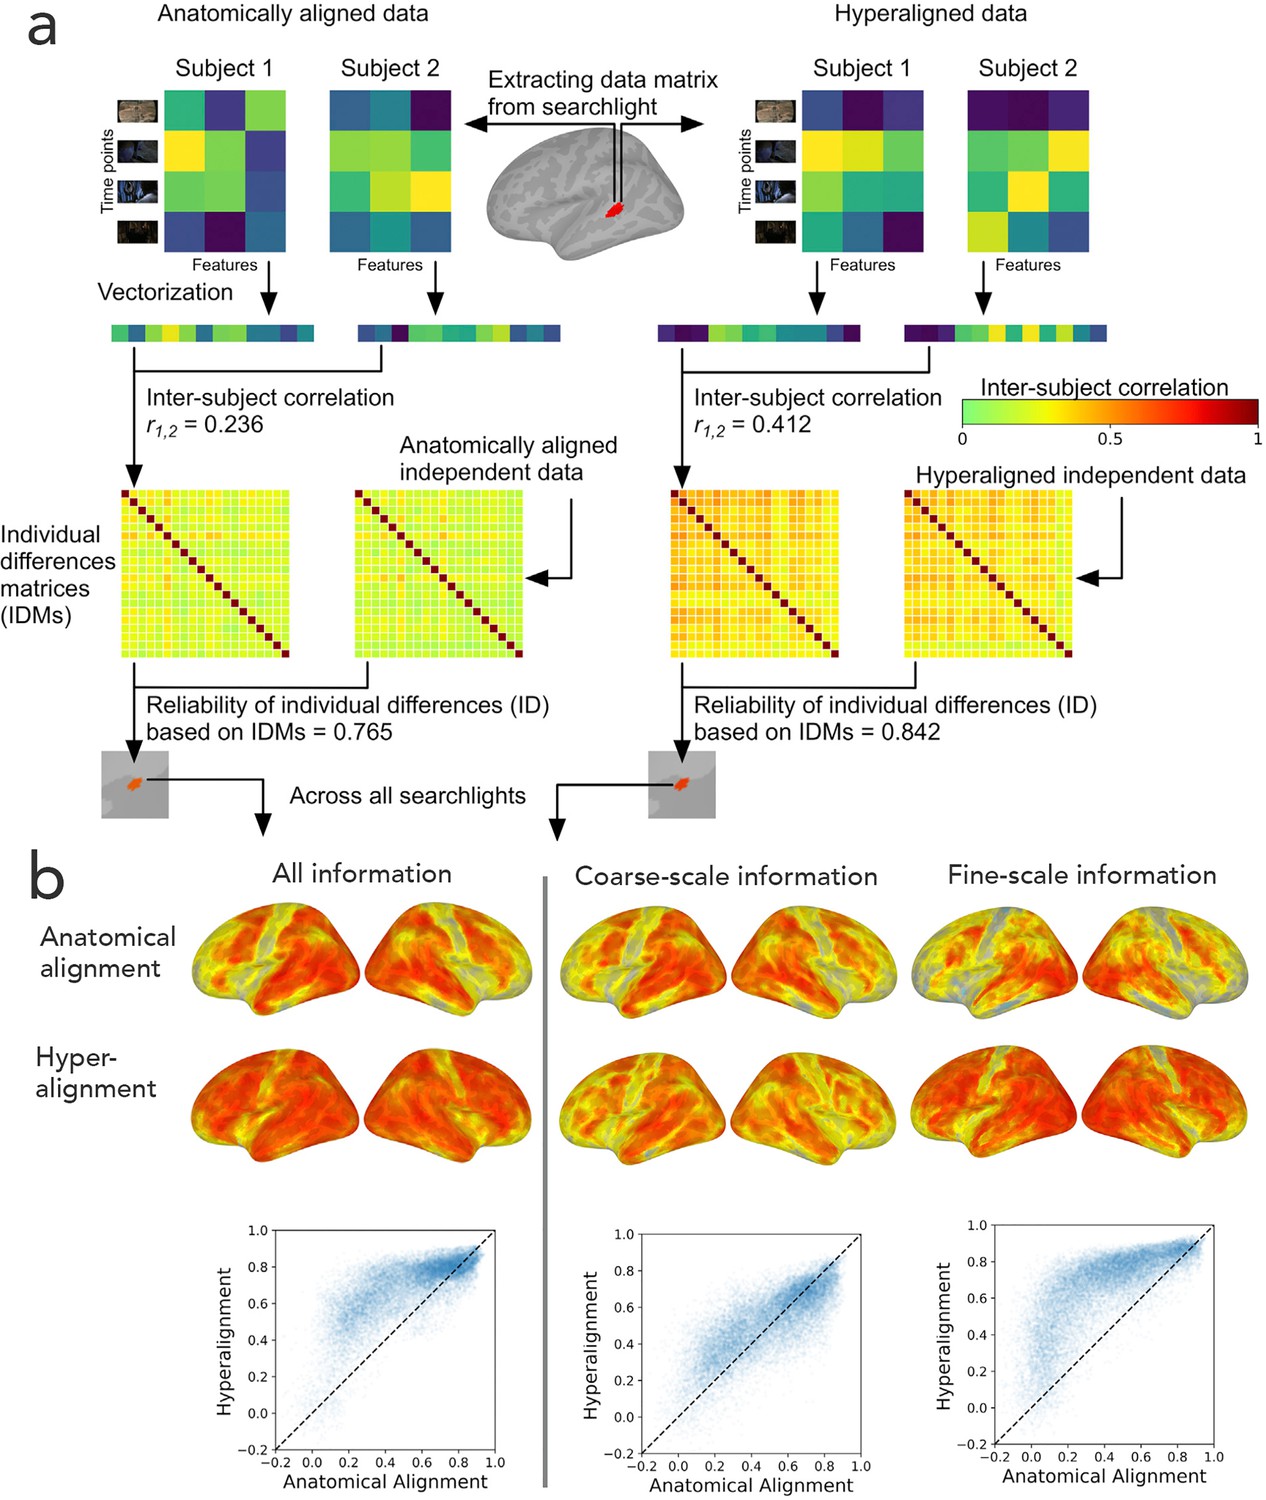
Reliability of individual differences in the information encoded in cortical topographies.
(a) Response or functional connectivity data across vertices in a searchlight are vectorized for each individual, and the correlation between individuals is used as an index of similarity. Correlations between all pairs of individual brains are assembled in individual differences matrices (IDMs). Correlations between IDMs constructed from independent data sets are indices of the reliability of individual differences. After hyperalignment, individuals’ data are more similar, but the residual differences are more reliable than those calculated from anatomically aligned data, as shown for one searchlight in a and for 82% of searchlights as shown on the left in (b). The increase in reliability is due primarily to information encoded in fine-scale patterns, as shown on the right in b. Adapted from Figure 1 and 3, Feilong et al., 2018).
Tables
Table 1
Summary of improvement in indices of performance after response hyperalignment (RHA) and connectivity hyperalignment (CHA), relative to anatomical alignment (AA).
ISC: Intersubject correlation; bsMVPC: between subject multivariate pattern classification; >: small advantage; >>>: large advantage.
| Performance measure | Relative performance after different alignments |
|---|---|
| ISC of searchlight representational geometry | RHA > CHA >>> AA |
| bsMVPC of movie time segments | RHA > CHA >>> AA |
| ISC of vertex connectivity profiles | CHA > RHA >>> AA |
Download links
A two-part list of links to download the article, or parts of the article, in various formats.
Downloads (link to download the article as PDF)
Open citations (links to open the citations from this article in various online reference manager services)
Cite this article (links to download the citations from this article in formats compatible with various reference manager tools)
Hyperalignment: Modeling shared information encoded in idiosyncratic cortical topographies
eLife 9:e56601.
https://doi.org/10.7554/eLife.56601


