Experience, circuit dynamics, and forebrain recruitment in larval zebrafish prey capture
- Helen Wills Neuroscience Institute and Graduate Program, University of California Berkeley, United States
- CNRS-UMR, France
- Department of Molecular and Cell Biology, University of California Berkeley, United States
- INSERM UMRS, France
- Institut du Cerveau et de la Moelle épinière (ICM), Hôpital de la Pitié-Salpêtrière, France
- Department of Psychology, University of California, Berkeley, United States
- Bioscience Division, Lawrence Berkeley National Laboratory, United States
Figures
Figure 1 with 3 supplements

Larval zebrafish improve hunting performance with experience of live prey in both free- swimming and virtual environments.
(A–B) Experience of live prey increases frequency of paramecia captures in a freely swimming environment. (A) Behavioral paradigm: Fish fed paramecia (‘prey-experienced’) or flakes (‘prey-naïve’) at 5 and 6 dpf were given paramecia at seven dpf (top, timeline). Prey capture performance was assessed by imaging single fish and paramecia (white specks in lower left image) to count pursuits aborted without a capture attempt, failed capture attempts, and successful captures (summary behavior scheme, lower, right). (B) Summary of performance. Raw data (one symbol per fish) and a boxplot of group statistics show that experienced fish have higher frequencies of total pursuits (successful or not, p = 0.003), and successful captures (p = 0.001), but statistically indistinguishable probabilities of transitioning from pursuit to a capture attempt (p = 0.28), or of transitioning from capture attempt to successful capture (p = 0.12). Statistical comparisons used a permutation test (see Materials and methods) with N = 51 each experienced and naïve fish. (C–E) Experience of live prey increases frequencies of prey- capture initiation in semi-immobilized fish. (C) Setup: semi-immobilized fish face a screen on which small moving dots are projected. Tail flicks and eye angle are imaged from above at 250 fps. Alpha is the angle between the point at 8/10ths of tail length from swim bladder, and midline. In green we show an example tail track during presentation of moving dot. (D) Prey-experienced fish (N = 23) have significantly (p = 0.03) greater discriminability index (d’) than prey-naïve fish (N = 25), two-way ANOVA interaction between experience of live prey vs. lack thereof and contrast (see Materials and methods for calculation of d’). (E) At highest contrast, eye convergence rate in prey-experienced fish was significantly (p = 0.005) greater than in prey-naïve fish (# of times fish converged eyes / # of high contrast stimuli at highest contrast). Note high variability in response rate within groups, with experience improving virtual prey capture performance unevenly across fish, similar to Trivedi and Bollmann, 2013; Semmelhack et al., 2014. See also movies Figure 1—video 1 and Figure 1—video 2. Data tables for panels B, D and E in Figure 1—source data 1.
Figure 1—figure supplement 1
Lack of impact of other factors on prey-capture performance.
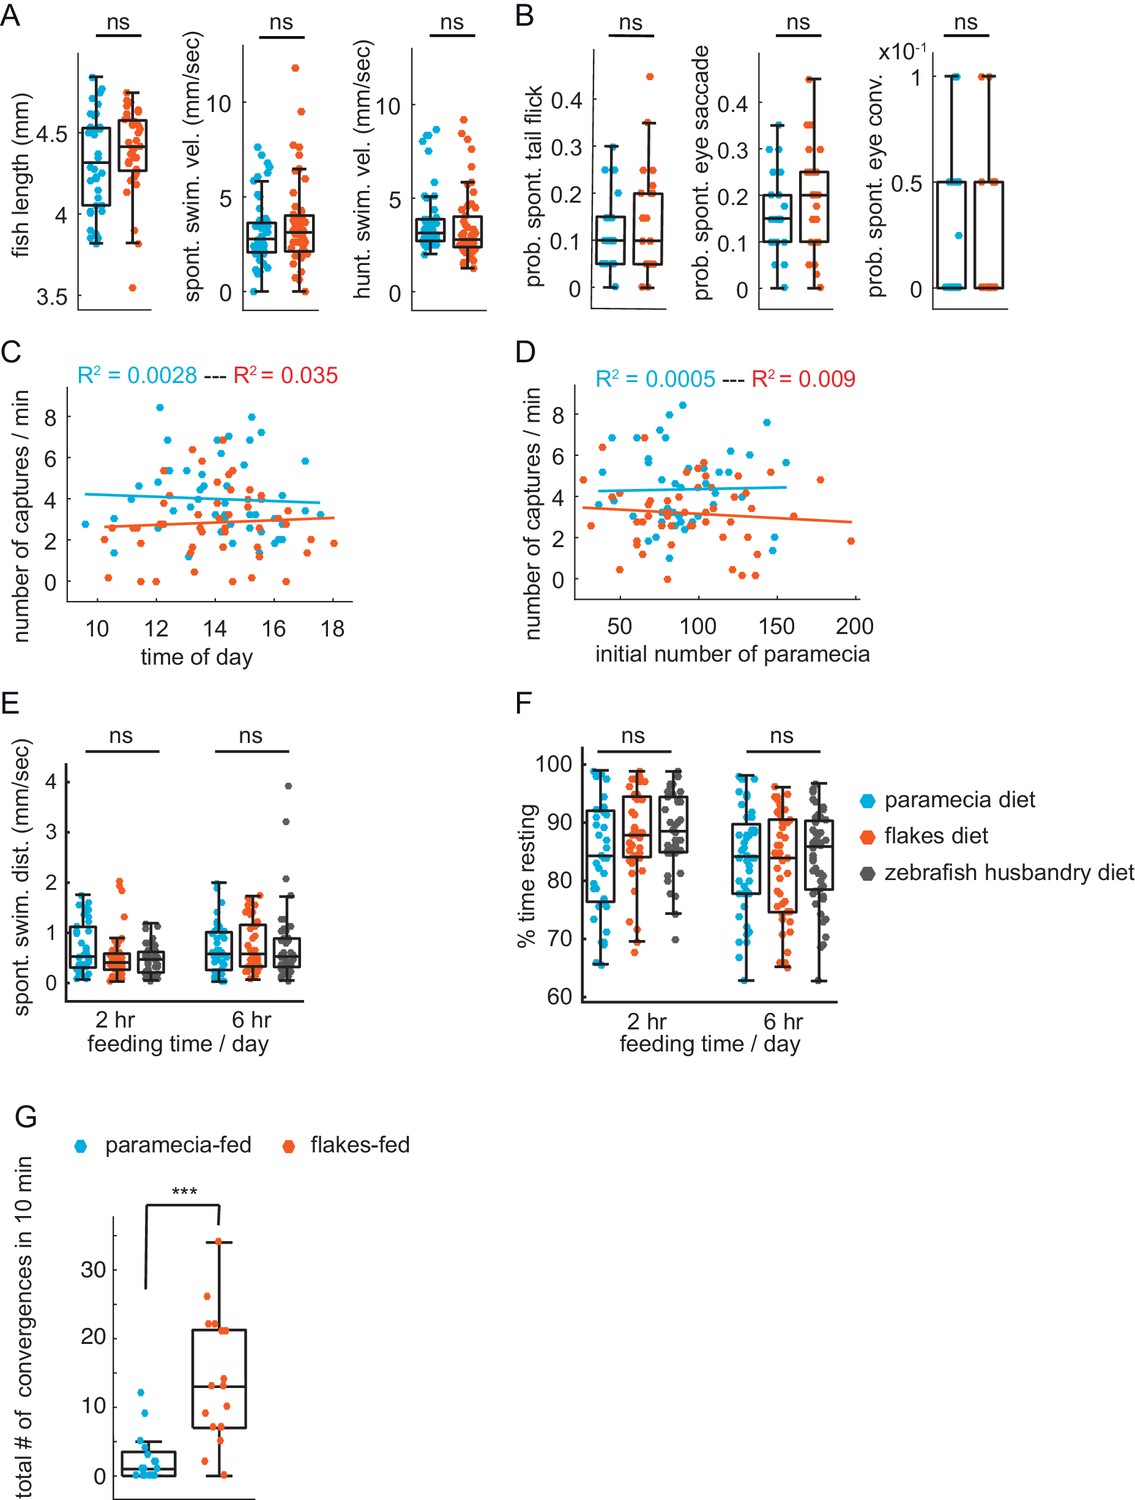
(A) No difference in health or swim behavior due to differences in diets: statistically indistinguishable fish length (p = 0.28), spontaneous swim velocity (p = 0.30), and swim velocity in presence of prey (p = 0.39). (B) Virtual prey capture. No difference between prey-experienced and prey-naïve fish in spontaneous tail flicks, eye saccades or eye convergences in absence of virtual prey stimulus (p = 0.48, p = 0.29, p = 0.76, respectively). (C, D) No effect on prey capture performance of time of day (C) or initial number of paramecia (D). (E, F) No effect of diet on swimming. Spontaneous swimming velocity (E) and percent of time spent resting (F) are similar in fish fed paramecia, flakes or pureed brine shrimp + dry food (husbandry diet) for 2 hours or 6 hr/day (one-way ANOVA test for (E) spontaneous swimming velocity 2 hr, Fstat = 2.95, p = 0.06; spontaneous swimming velocity 6 hr, Fstat = 0.19, p = 0.83; one-way ANOVA test for (F) % time resting 2 hr, Fstat = 2.95, p = 0.06; % time resting 6 hr, Fstat = 0.29, p = 0.75). (G) Fish previously fed with paramecia (N = 16) and fish previously fed with flakes (N = 17) on day 5 and 6 dpf are exposed to flakes on day 7 dpf for 10 min. Flakes-fed fish show a significantly higher amount of eye convergence during the recorded period than paramecia-fed fish, p < 0.0001. A permutation test was used for all pairwise comparisons if not specified otherwise (see Materials and methods, Behavioral data analysis and statistics).
-
Figure 1—figure supplement 1—source data 1
- https://cdn.elifesciences.org/articles/56619/elife-56619-fig1-figsupp1-data1-v2.csv
Figure 1—video 1
Free-swimming prey capture.
Movie showing successful captures, failed attempts, and pursuits that were aborted before a capture attempt.
Figure 1—video 2
Virtual prey capture.
Movie of prey capture-like responses to small moving dots on a screen: eye convergence and tail flick.
Figure 2 with 3 supplements
Wide-field brain imaging of prey capture initiation shows recruitment of visual and motor areas, as well as the telencephalon and habenula.
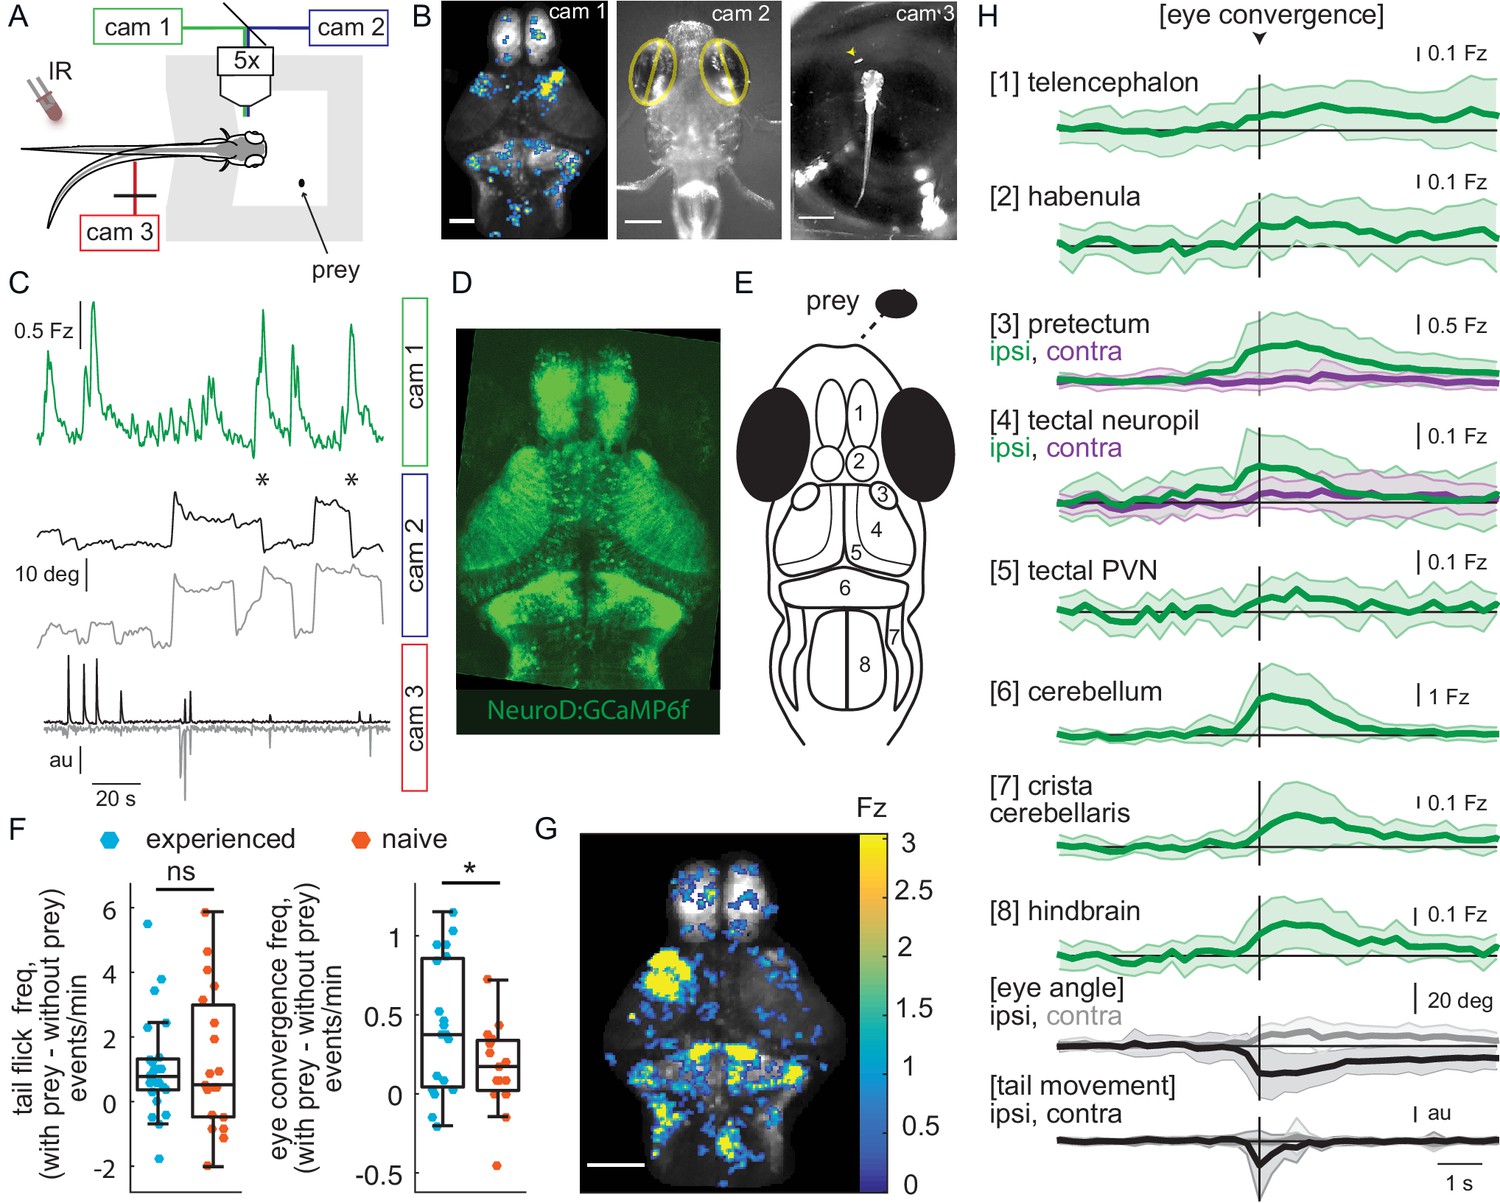
(A, B) Setup for imaging of neural activity in a single plane of the whole brain while the fish observes prey (A) and example frames captured by three cameras (B). Camera 1 (cam 1): neural activity in a single plane of the whole brain while the fish observes prey, scale bar = 200 μm. Camera 2 (cam 2): eye angle, scale bar = 200 μm. Camera 3 (cam 3): prey position and fish tail position, scale bar = 1 mm. Cameras were synchronized at 3.6 Hz. (C) Example 3 min traces from one fish for all three cameras illustrating data collected during eye convergences. Cam 1: Z-scored fluorescence in the right pretectum (smoothed with a Lowess filter, span = 7, for Fz calculation see Materials and methods, Calcium and behavior imaging data pre-processing). Cam2: Corresponding eye angles (left eye, gray; right eye, black; convergence events, stars; smoothed with a Lowess filter, span = 9). Cam 3: tail movement (left side, gray; right side, black, see Materials and methods). (D) Tg(NeuroD:GCaMP6f) 7 dpf fish brain, dorsal view as images by cam 1. (E) Schematic of anatomy in observation plane, numbered areas as defined in (H). (F) Prey-experienced and prey-naïve fish have statistically indistinguishable evoked (with prey – without prey) frequency of tail flicks (left, p = 0.74), but prey-experienced fish have a significantly higher eye convergence frequency (right, with prey – without prey, p = 0.04). (G, H) Neural activity in a prey-experienced fish around eye convergences with prey (N = 12 eye convergences). This fish showed no spontaneous eye convergences preceding addition of paramecium, suggesting that averaged activity was purely evoked by the paramecium. ‘Contra’ and ‘ipsi’ refer to the side with higher or lower pretectal transient amplitude peak time (see Materials and methods). (G) Spatial distribution of summed calcium activity over 4.2 s (five frames before to 10 frames after eye convergence), when the prey was to the right side of the fish (average of six convergences). Scale bar = 100 μm. Fz thresholded for visualization. (H) Time-course of calcium activity for each brain area in an example experienced fish (average of 12 convergences; convergence time is vertical black line) over a period of 10 seconds. We observe a significant increase in fluorescence for all brain areas except the ipsilateral side of the pretectum, comparing average fluorescence traces of baseline (frames −10 to −5 before eye convergence), to the five frames after eye convergence (black line in the figure). P-values are reported in Supplementary file 1. For eye angle and tail movement, black is contralateral, and gray is ipsilateral. See also Figure 2—figure supplement 1, and movies in Figure 2—video 1 and Figure 2—video 2. A permutation test was used for all pairwise comparisons if not specified otherwise (see Materials and methods, Behavioral data analysis and statistics). Data tables for panels F and H in Figure 2—source data 1.
Figure 2—figure supplement 1
GCaMP6f expression pattern and time traces.
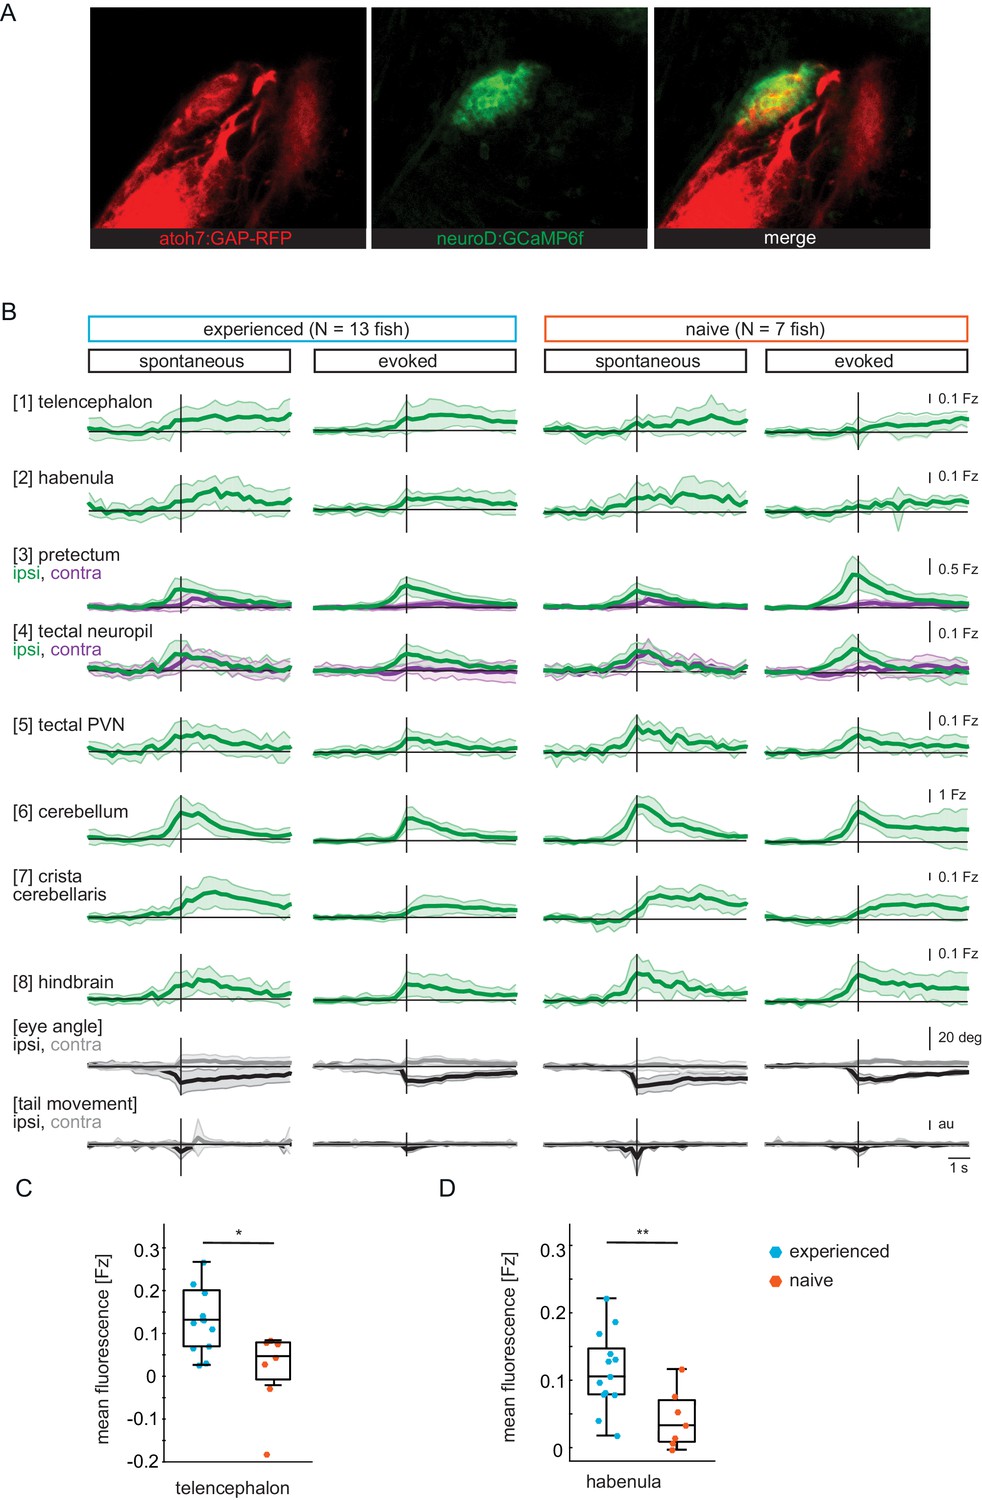
(A) Pretectum area of a seven dpf Tg(ath5:mRFP;NeuroD:GCaMP6f) fish. NeuroD-driven expression of GCaMP6f (green) includes pretectal neurons with cell bodies in close proximity to AF7, that expresses mRFP (red) under the ath5 promoter. (B) Composite GCaMP6f fluorescence time courses for prey-experienced (N = 13) and prey-naïve (N = 7) fish associated with eye convergence (vertical black line) for brain areas and behavioral measures shown in Figure 2H. Fish selected to have > 5 eye convergences in presence of prey (evoked). Activity in the contralateral tectal neuropil is higher than in the ipsilateral tectal neuropil in evoked but not spontaneous condition. Difference between amplitude at peak convergence between contralateral and ipsilateral is significant for prey-experienced (p = 0.049) and prey-naïve (p = 0.02) fish. ‘Contra’ and ‘ipsi’ refer to the side with higher or lower pretectal transient amplitude peak time (see Materials and methods). (C, D) Quantification of evoked (in presence of paramecia) forebrain activity in (B) for telencephalon (1) and habenula (2) over five frames (1.4 s) after eye convergence. We observe higher activity in prey-experienced fish than in prey-naïve fish in both the telencephalon (C) and the habenula (D) (p = 0.025 and p = 0.009), respectively (permutation test, see Materials and methods, Behavioral data analysis and statistics). Data tables for panels B, C and D in Figure 2—figure supplement 1—source data 1.
-
Figure 2—figure supplement 1—source data 1
- https://cdn.elifesciences.org/articles/56619/elife-56619-fig2-figsupp1-data1-v2.csv
Figure 2—video 1
Movie showing simultaneous whole-brain activity and behavior imaging.
Camera 1 (left): neural activity in response to a live prey, brain areas as described in Figure 2. Camera 2 (bottom right): eye detection. Camera 3 (top right): prey trajectory and tail movement.
Figure 2—video 2
Movie showing spatio-temporal pattern of brain activation associated with eye convergence.
Example fish showing average activity associated with eye convergences when the prey is on the left, followed by when the prey is on the right.
Figure 3 with 1 supplement

Experience does not affect prey-associated activity in visual areas.
(A) Left, schematic of prey location relative to the fish in polar coordinates (angle α, radius r). Right, example retinotopic map generated by fitting an encoding model for each pixel to predict fluorescence intensity based on prey location. Significantly correlated pixels are in the color of their preferred angle. Scale bar = 200 μm. (B) Average fluorescence from pixels whose preferred angles are in bin 1 (120° to 101°, top) or bin 2 (-104° to 126°, bottom). Left: Anatomical location of pixels. Bars below traces indicate time points when the prey was present in the preferred angle bin. (C) Example angular-radial receptive fields for three pixels in the pretectum. X-axis: angle, y-axis radius; Color represents encoding model weight for that pixel. For each receptive field, color scale is normalized to the maximum weight and centered around 0. Right: preferred angle is max of marginal. (D) Top: anatomical location of tectal neuropil major axes (left: green, right: purple). Middle and Bottom: Average preferred angle gradient along left and right axis, shaded area is standard deviation. Middle: Prey-experienced (N = 23, blue). Bottom: Prey-naïve (N = 19, red). (E) Average correlation values of visual area pixels in pretectum (left), tectal neuropil (middle), and tectal PVNs (right) were not significantly different between prey-experienced (N = 23) and prey-naïve fish (N = 17), p = 0.80 for pretectum; p = 0.42. (F) Average distribution of pixels’ preferred angles in each area (columns) in prey-experienced (blue, top row) and prey-naïve (red, bottom row) fish. There were no differences in average preferred angle distributions between the two groups of fish (two-sample Kolmogorov-Smirnov tests, p = 0.93 for pretectum, p = 0.94 for tectal neuropil and p = 0.95 for tectal PVNs.). See also Figure 3—figure supplement 1. A permutation test was used for all pairwise comparisons if not specified otherwise (see Materials and methods, Behavioral data analysis and statistics). Data tables for panels B, C, D, E, and F in Figure 3—source data 1.
Figure 3—figure supplement 1
Similar retinotopic maps and pretectal events in prey-experienced and prey-naïve fish.
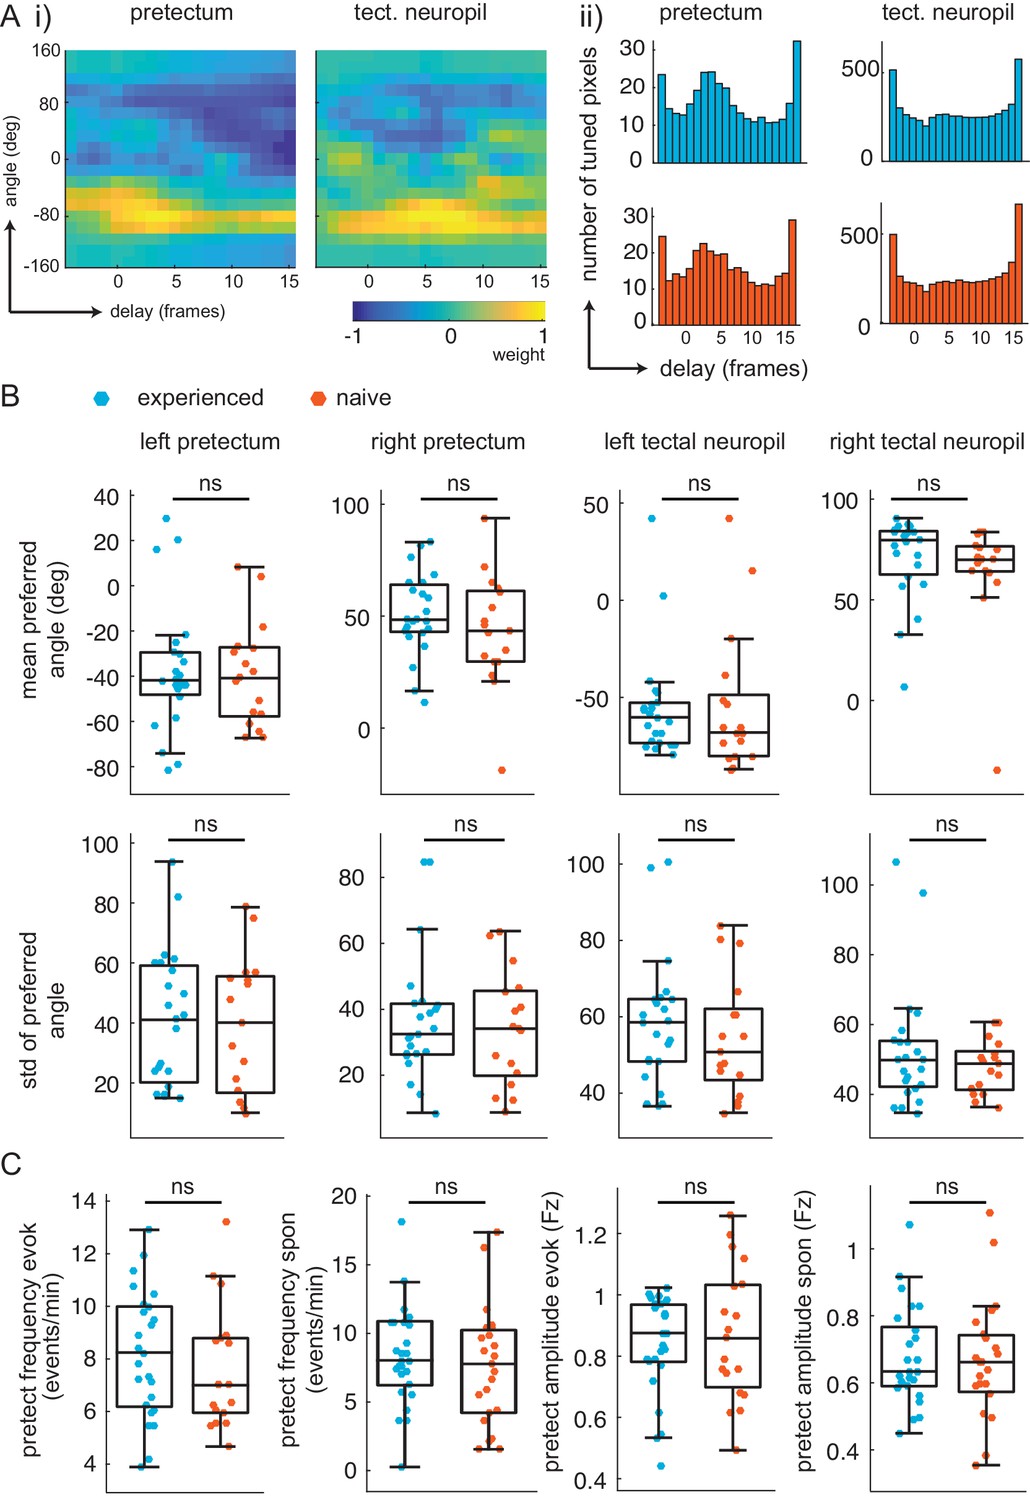
(A) Delay analysis. (i) Receptive fields for delay (x-axis, one frame is 0.28 s) and angle (y-axis) for example pixel in pretectum (left) and tectal neuropil (right). Notice weight is smeared in x-axis for tectal neuropil. (ii) distribution of preferred delay weight in the pretectum (left) and the tectal neuropil (right) for prey-experienced (top, blue, N = 23) and prey-naïve (bottom, red, N = 17) fish are very similar. (B) The mean and standard deviation of the preferred angle distributions were indistinguishable between prey-experienced and prey-naïve fish. (preferred angle p = 0.93 left pretectum, p = 0.31 right pretectum, p = 0.91 left tectal neuropil, p = 0.68 right tectal neuropil. Standard deviation p = 0.96 left pretectum, p = 0.34 right pretectum, p = 0.42 left tectal neuropil, p = 0.21 right tectal neuropil) (C) Average event frequency in left and right pretectums was not different between prey-experienced and prey-naïve fish in either evoked (p = 0.20, left) or spontaneous (p = 0.56, second from left) conditions. Average pretectum event amplitude was not different between prey-experienced and prey-naïve fish in evoked (p = 0.54, second from right) or spontaneous (p = 0.67, right) conditions. A permutation test was used for all pairwise comparisons if not specified otherwise (see Materials and methods, Behavioral data analysis and statistics). Data tables for all panels in Figure 3—figure supplement 1—source data 1.
-
Figure 3—figure supplement 1—source data 1
- https://cdn.elifesciences.org/articles/56619/elife-56619-fig3-figsupp1-data1-v2.csv
Figure 4 with 1 supplement
Experience does not affect directed information flow between visual areas.
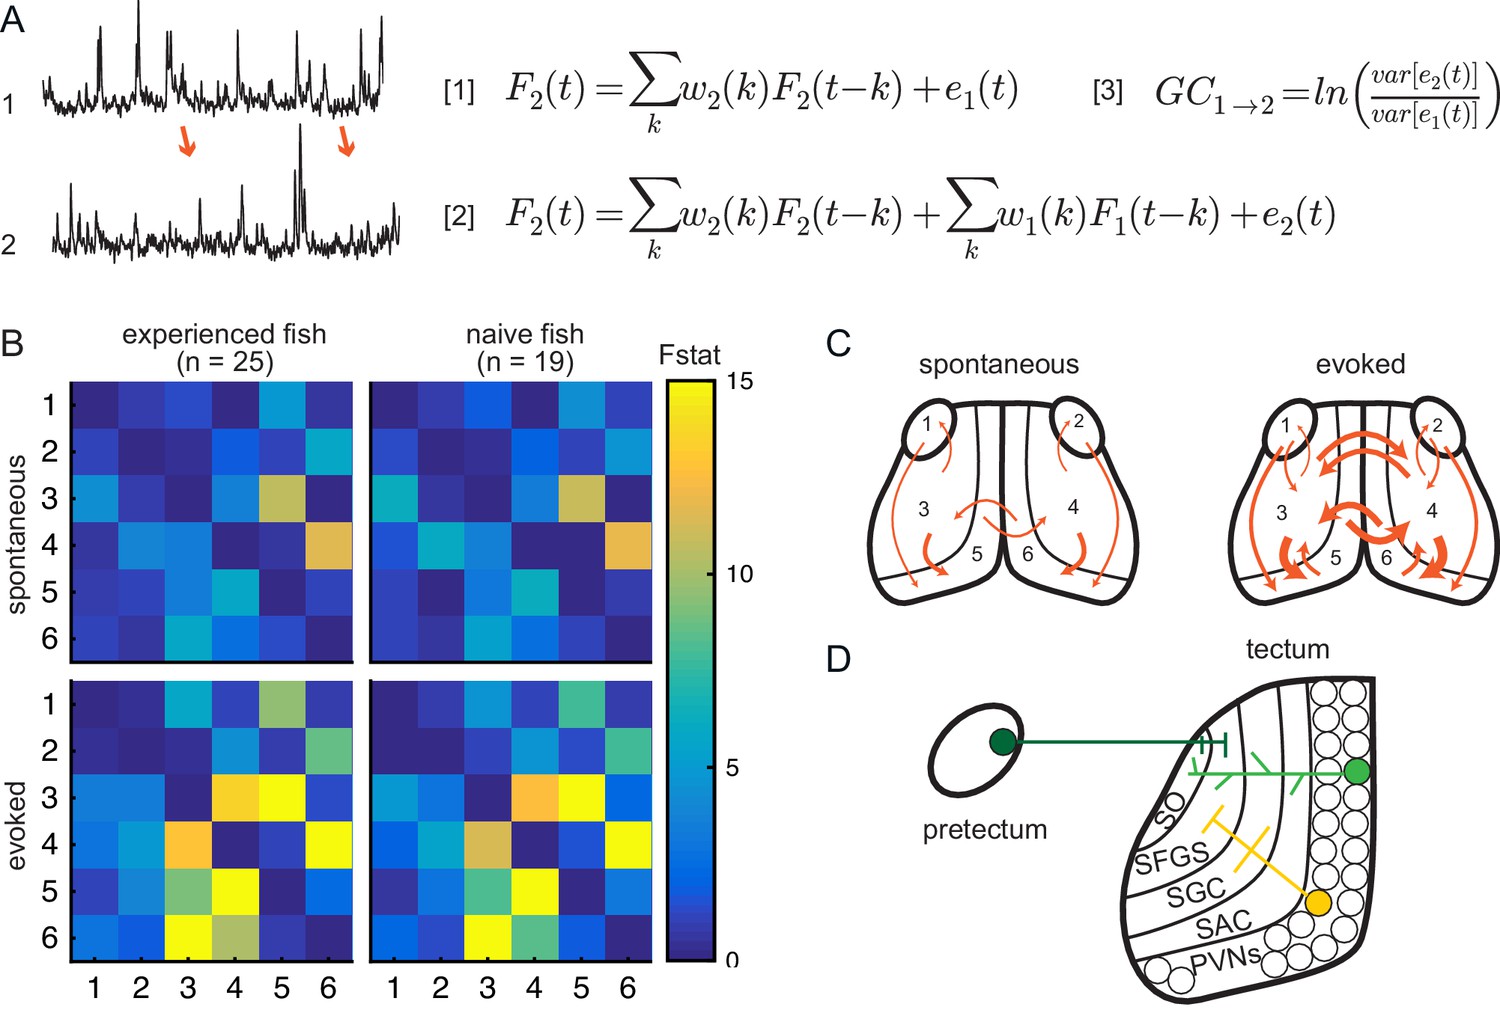
(A) Granger-causality equations (right) to model fluorescence time-series 2 (TS2) using information from TS1 (left). TS1 and TS2: fluorescence from region 4 and 3 respectively for one representative fish. F(t) is fluorescence for time point t; w1 and w2 are the weights calculated for each time point; e denotes prediction error. Figure 4 - equation 1 and Figure 4 - equation 2 are the autoregressive models for univariate and bivariate signals, respectively. Figure 4 - equation 3 is estimation of Granger-causality level. (B) Average causality level within visual areas in spontaneous (no prey, top row) and evoked (prey present, bottom row) conditions, in prey-experienced (left column) and prey-naïve (right column) fish. Each box represents the F-statistic which quantifies the statistical significance of the directed interaction from the region identified by the row to the region identified by the column. F-statistic values ranged from 0 to 23.7. Fstat values above 15 are yellow. Brain areas shown are: 1, left pretectum; 2, right pretectum; 3, left tectal neuropil; 4, right tectal neuropil; 5, left tectal PVN; 6, right tectal PVN. Significant causal interaction causality link for Fstat > 3.88. No significant difference between prey-experienced and prey-naïve fish in either spontaneous or evoked Granger-causality matrices (pairwise ts, corrected using the Benjamini-Hochberg False Discovery Rate (FDR), see Materials and methods, Behavioral data analysis and statistics; see Supplementary file 2 for p-values). (C) Schematics of functional links in visual areas in spontaneous (left) and evoked (right) conditions. Line width proportional to Granger-causality level (evoked and spontaneous maps indicate links with Fstat > 3.88). (D) Anatomy and known connections of the optic tectum. Dark green: input from pretectum to OT. Bright green: PVNs with dendritic arborization in tectal neuropil. Yellow: axonal projections from PVNs to different layers of OT. SO, stratum opticum; SFGS, stratum fibrosum et griseum superficiale; SGC, stratum griseum centrale; SAC, stratum album centrale. See also Figure 4—figure supplement 1. Data table for panel B in Figure 4—source data 1.
Figure 4—figure supplement 1
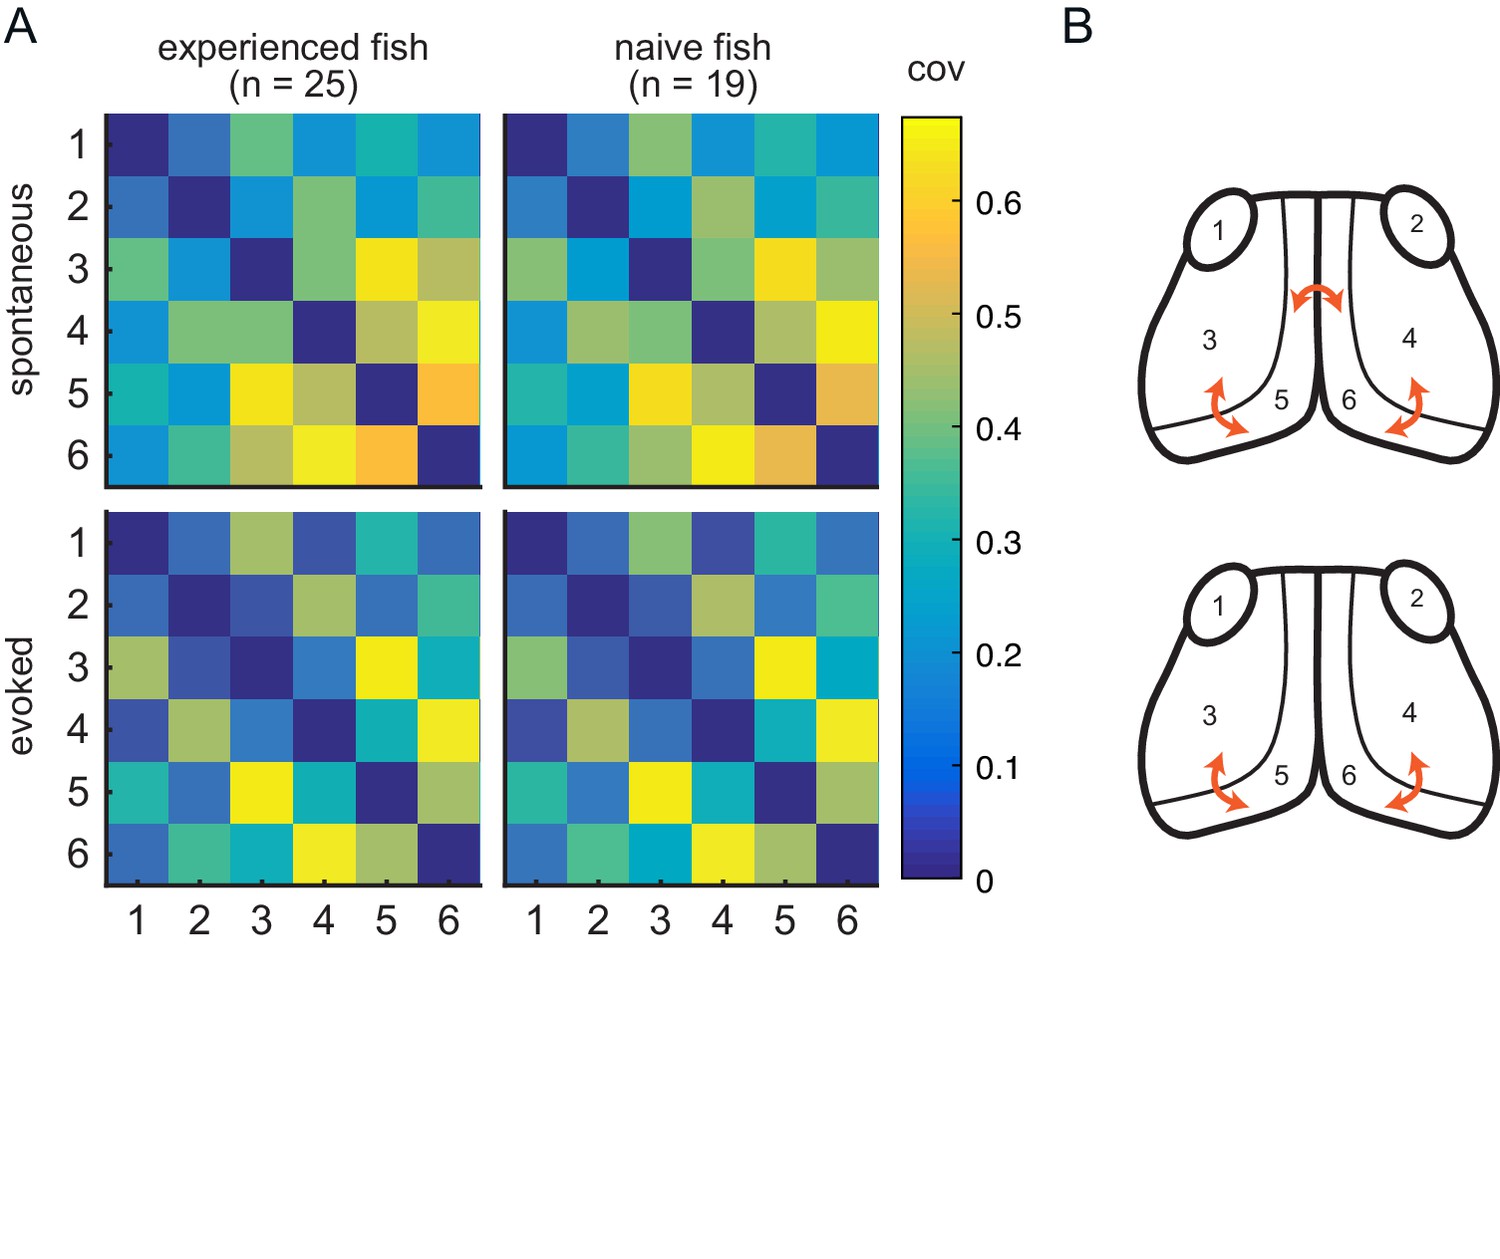
Experience does not affect circuit covariance in visual areas.
(A) Pairwise covariance (a non-directed measure of interaction) was calculated between the visual areas in spontaneous (top row) and evoked (bottom row) conditions and prey-experienced (left column) and prey-naïve (right column) fish. There were no statistical differences between prey-experienced and prey-naïve fish in the spontaneous or the evoked conditions (pairwise Ts, FDR corrected). (B) Links with linear correlation values higher than 0.5 for spontaneous (top) and evoked (bottom) conditions are represented by the orange arrows. Data table for panel A in Figure 4—figure supplement 1—source data 1.
-
Figure 4—figure supplement 1—source data 1
- https://cdn.elifesciences.org/articles/56619/elife-56619-fig4-figsupp1-data1-v2.csv
Figure 5 with 1 supplement
Granger-causality-based estimation of interactions between visual and motor areas correlates with prey capture initiation.
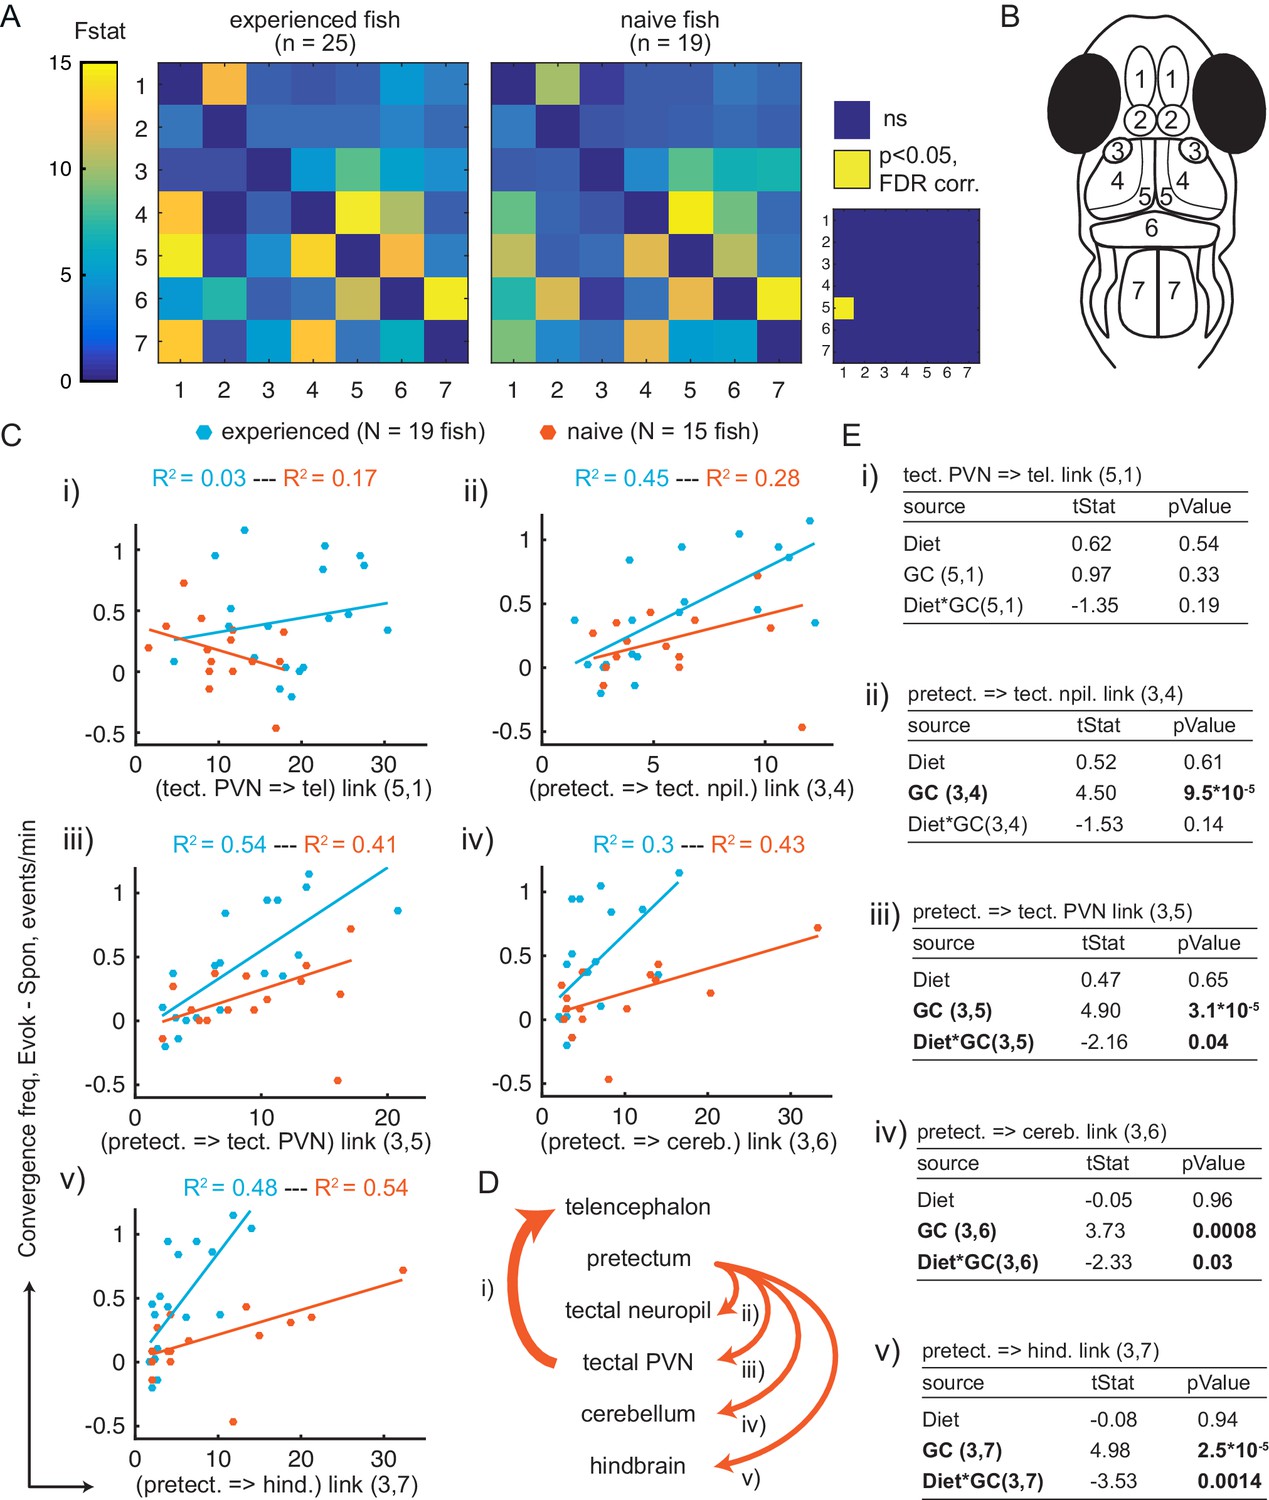
(A) Average Granger-causality between brain areas in prey-experienced (left) and prey-naïve (right) fish. Activity from left and right sides averaged as depicted in anatomical schematic (B). F-statistics ranged from 0 to 34.1. Inset: Pairwise statistical comparison of all links. Significant interactions represented in yellow (p < 0.05, pairwise Ts, FDR corrected, see Materials and methods, Behavioral data analysis and statistics; see Supplementary file 3 for p-values). (B) Brain areas shown in schematic are: 1: telencephalon, 2: habenula, 3: pretectum, 4: tectal neuropil, 5: tectal PVNs, 6: cerebellum, 7: hindbrain. (C–E) Granger-causality statistic is significantly correlated (p-values in E, ‘GC’ row in each table) with eye convergence frequency for interactions from pretectum to downstream areas (interactions shown to be significantly stronger in ‘strong’ hunters, see Figure 5—figure supplement 1), but not for interaction from tectal PVNs to telencephalon (interaction shown to be significantly stronger in prey-experienced fish in A). Interaction between experience of prey (‘Diet’) and Granger-causality strength was significant for pretectum to tectal PVN, pretectum to cerebellum, and pretectum to hindbrain (p-values in E, ‘Diet*GC’ row in each table). (C) Eye convergence frequency (evoked – spontaneous) as a function of Granger-causality strength for: (i) tectal neuropil→telencephalon (5,1), (ii) pretectum→tectal neuropil (3,4), (iii) pretectum→tectal PVN (3,5), (iv) pretectum→cerebellum (3,6), (v) pretectum→hindbrain (3,7). Statistics of linear regression model are in (E). (D) Schematic of links considered in (C). (E) Robust linear regression model: [Convergence Frequency ~1 + Diet + GC + Diet*GC], where ‘Convergence Frequency’ is (with prey – without prey), ‘GC’ is Granger-causality Fstat, ‘Diet’ is prey-experienced or prey-naïve fish (categorical variable), and ‘Diet*GC’ is interaction between experience of prey and Granger-causality statistic. N = 19 and N = 15 prey-experienced and prey-naïve fish respectively. Significant terms are bolded, GC for all links but link (5,1), and (GC*diet) interactions for links (3,5 , 3,6) and (3,7). Data table for panel A and C in Figure 5—source data 1.
Figure 5—figure supplement 1
Comparison of weak vs strong hunters.
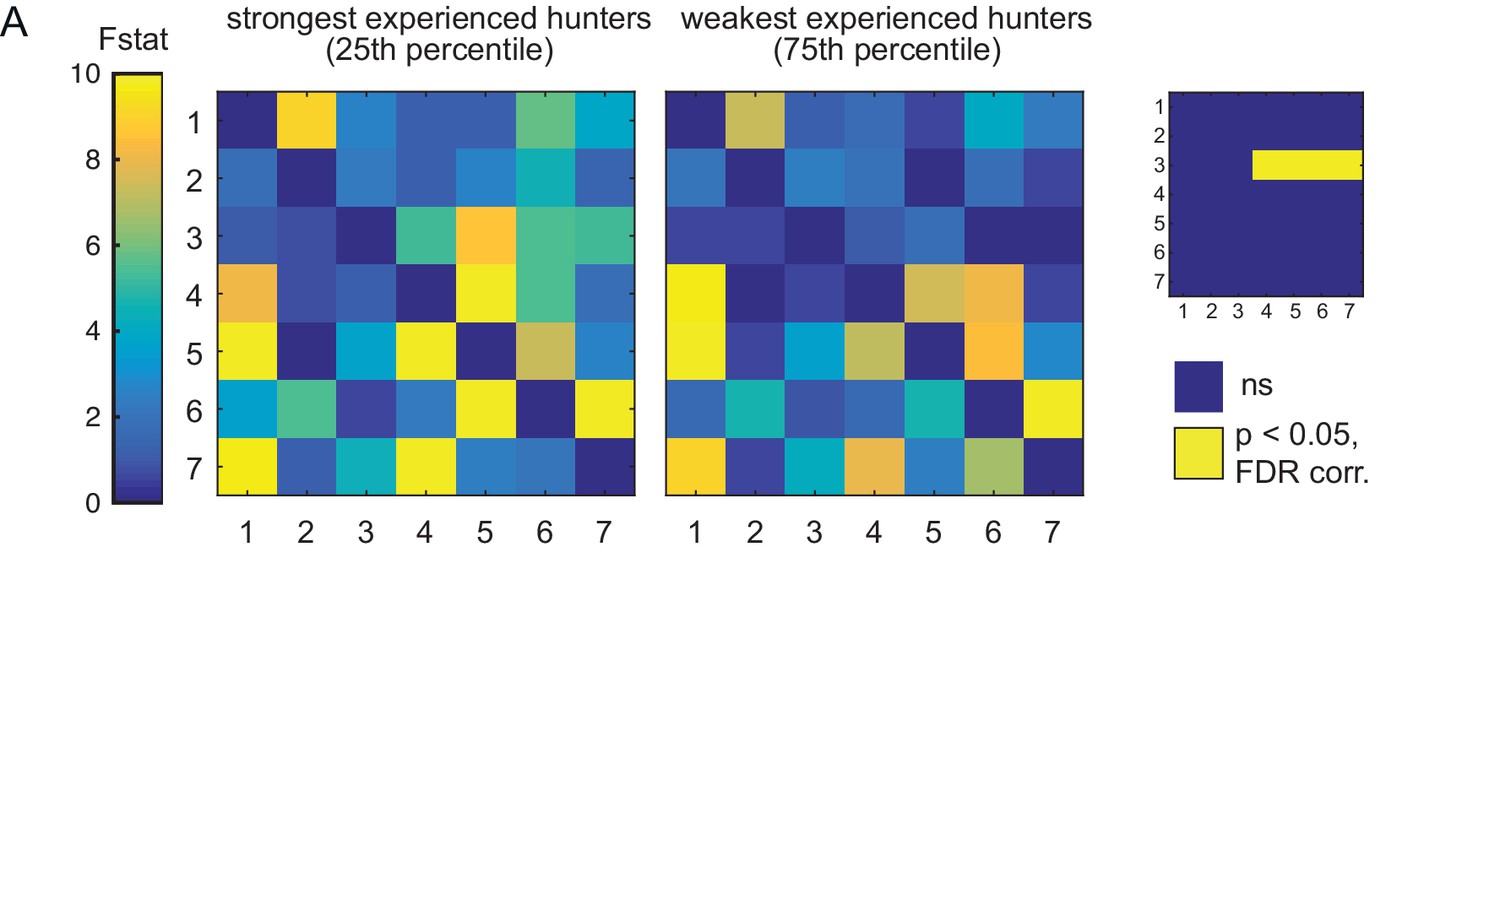
(A) Prey-experienced fish ranked by frequency of evoked eye convergence (with prey – without prey) into strongest quartile (N = 5, left) and weakest quartile (N = 5, right). Average Granger-causality matrices for same regions as Figure 5. Inset: Pairwise statistical comparison (Ts) of all links (see Supplementary file 3 for p-values). Data table for panel A in Figure 5—figure supplement 1—source data 1.
-
Figure 5—figure supplement 1—source data 1
- https://cdn.elifesciences.org/articles/56619/elife-56619-fig5-figsupp1-data1-v2.csv
Figure 6
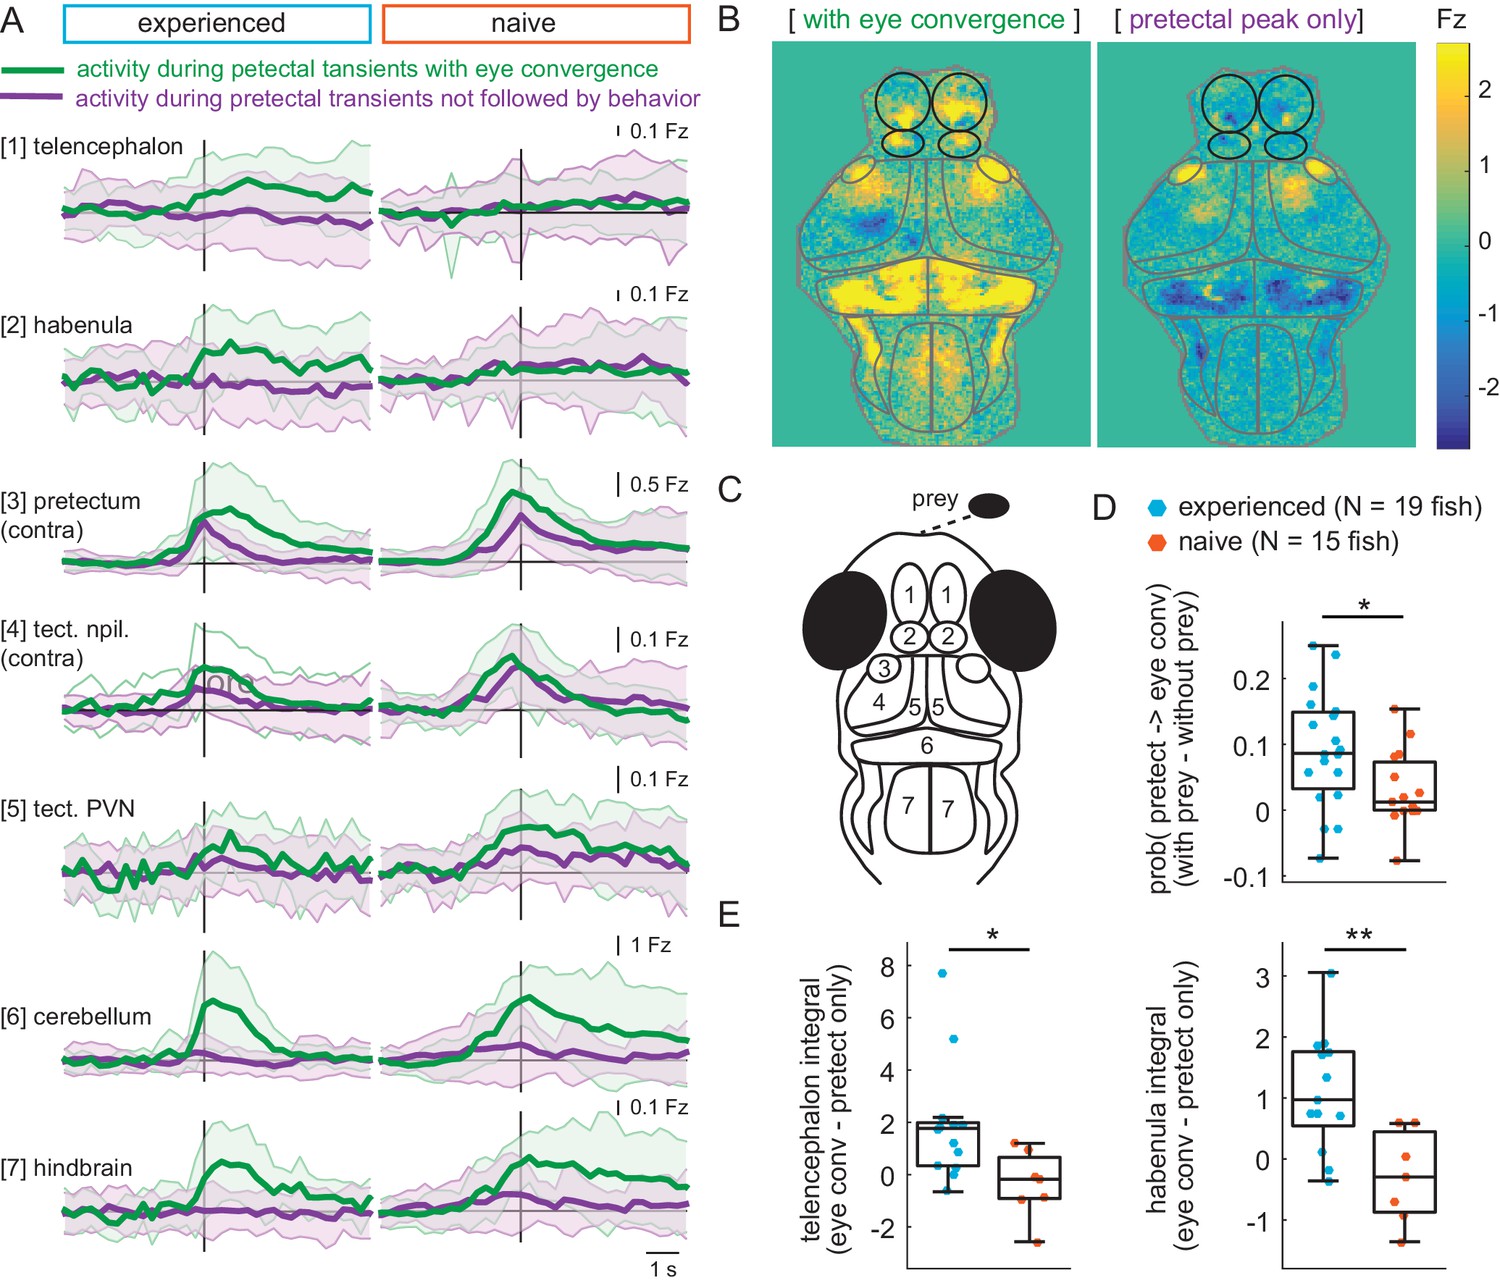
Experience of prey increases capture initiation-associated forebrain activity and lowers threshold for visual activity to trigger capture initiation.
(A) Time traces of activity in seven brain regions during either a pretectum transient followed by eye convergence (green) or a pretectum transient with no behavior (purple) in a representative prey-experienced fish (left, N = 12 convergences, N = 42 pretectum-only events) and prey-naïve fish (right, N = 15 convergences, N = 20 pretectum-only events). Black vertical line represents the pretectal activity peak to which transients are aligned. ‘Contra’ and ‘ipsi’ refer to the side with higher or lower pretectal transient amplitude peak time (see Materials and methods). (B) Average brain activity maps for another representative prey-experienced fish in presence of prey, showing summed calcium activity over 4.2 s (five frames before to 10 frames after event), during either pretectum transients associated with eye convergence (prey to left or right of the fish, N = 22) or pretectum transients not accompanied by behavior (N = 34). Brain areas are outlined in gray as in schematic C, and forebrain areas are additionally outlined in black. (A and B) show that forebrain areas appear active during pretectal transients associated with eye convergence, but not pretectal transients not accompanied by behavior. (C) Schematic of anatomical areas considered in A and B. (D) Prey-experienced fish (N = 19) have a higher probability of pretectum transients being associated with eye convergence than prey-naïve fish (N = 15), suggesting visual events are more likely to cause motor output with experience of live prey (* indicates p = 0.03). Raw values of evoked and spontaneous probabilities are not significantly different in experienced versus naïve fish (reported in Figure 6—source data 1). (E) Prey-experienced fish (blue) have significantly more telencephalon (left, p = 0.02) and habenula (right, p = 0.004) activity than prey-naïve fish (red) during pretectal transients associated with eye convergence relative to pretectal transients not accompanied by behavior. Box plot shows difference in fluorescence integral five frames before to five frames after events (pretectal transient with vs. without eye convergence). Fish with < 5 eye convergences were excluded, prey-experienced fish N = 13, prey-naïve fish N = 7. * and ** indicate p < 0.05 and p < 0.01 respectively. A permutation test was used for all pairwise comparisons if not specified otherwise (see Materials and methods, Behavioral data analysis and statistics). Data tables for panels A, D, E, and F are in Figure 6—source data 1.
Figure 7 with 2 supplements
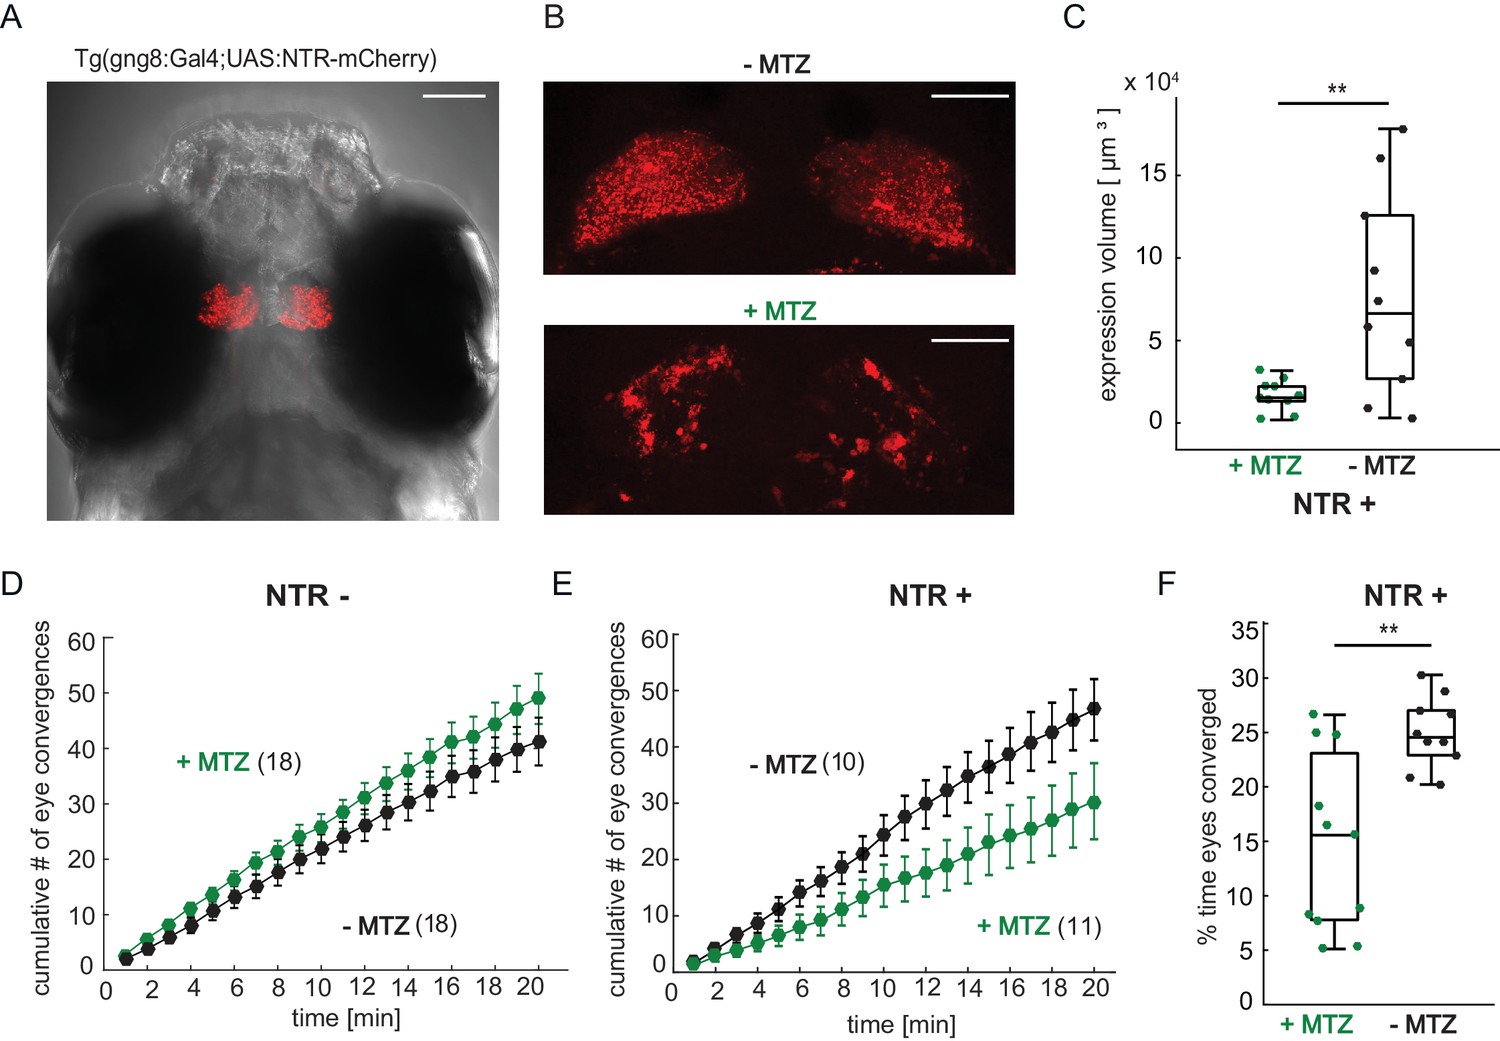
Chemical disruption of the habenula reduces hunting behavior in prey-experienced fish.
(A) Representative image of 7 dpf Tg(gng8:Gal4;UAS:NTR-mCherry) fish, dorsal view. NTR-mCherry is depicted in red, image is a maximum intensity projection of a Z-stack. Additional example images are shown in Figure 7—figure supplement 1A). Scale bar is 100 μm. (B) Representative images of NTR-mCherry expression (red) in the habenula in NTR+ fish after 19 hr in either 0.2% DMSO (-MTZ) (top) or 5 mM MTZ in 0.2% DMSO (+MTZ) (bottom). Images are maximum intensity projections of 5 µm/slice Z-stacks. Scale bar is 40 μm. Additional example images are shown in Figure 7—figure supplement 2A. (C) Volume of NTR-mCherry fluorescence is reduced in NTR-mCherry expressing fish treated with MTZ, p = 0.003, N = 10 animals per group. Differences in signal likely reflects variable transgene expression. Dependence of volume measurement on total fluorescence differs between +MTZ and -MTZ (Figure 7—figure supplement 1B). Symbols indicate individual fish. Box plot shows median, 25th and 75th percentiles. (D, E) Cumulative average number of eye convergences after addition of paramecia in seven dpf Tg(gng8:Gal4;UAS:NTR-mCherry) (NTR-) fish (D) and control siblings (NTR+) (E), pretreated for 19 hr with either 0.2% DMSO alone (-MTZ) or 0.2% DMSO containing 5 mM metronidazole (+MTZ) and tested for 20 min one hour after washout of the drug. Eye convergence rate is reduced in MTZ-treated enzyme expressing fish (NTR+/+MTZ) compared to untreated (NTR+/-MTZ) animals (two-way repeated measures ANOVA shows an effect of treatment with p = 0.033), while we observe no significant difference for NTR- animals (two-way repeated measures ANOVA, effect of treatment p = 0.24). (n) = number of fish in each group. Error bars show SEM. (F) Percent time of eyes converged over 20 min of recording period in NTR+ fish is significantly lower in NTR+/+MTZ fish than in NTR+/-MTZ (p = 0.004. Symbols indicate individual fish. Box plot shows median and 25th and 75th percentiles. A permutation test is used for all pairwise comparisons unless otherwise specified (see Materials and methods, Behavioral data analysis and statistics). Data tables for panels C, D, E, and F in Figure 7—source data 1.
Figure 7—figure supplement 1
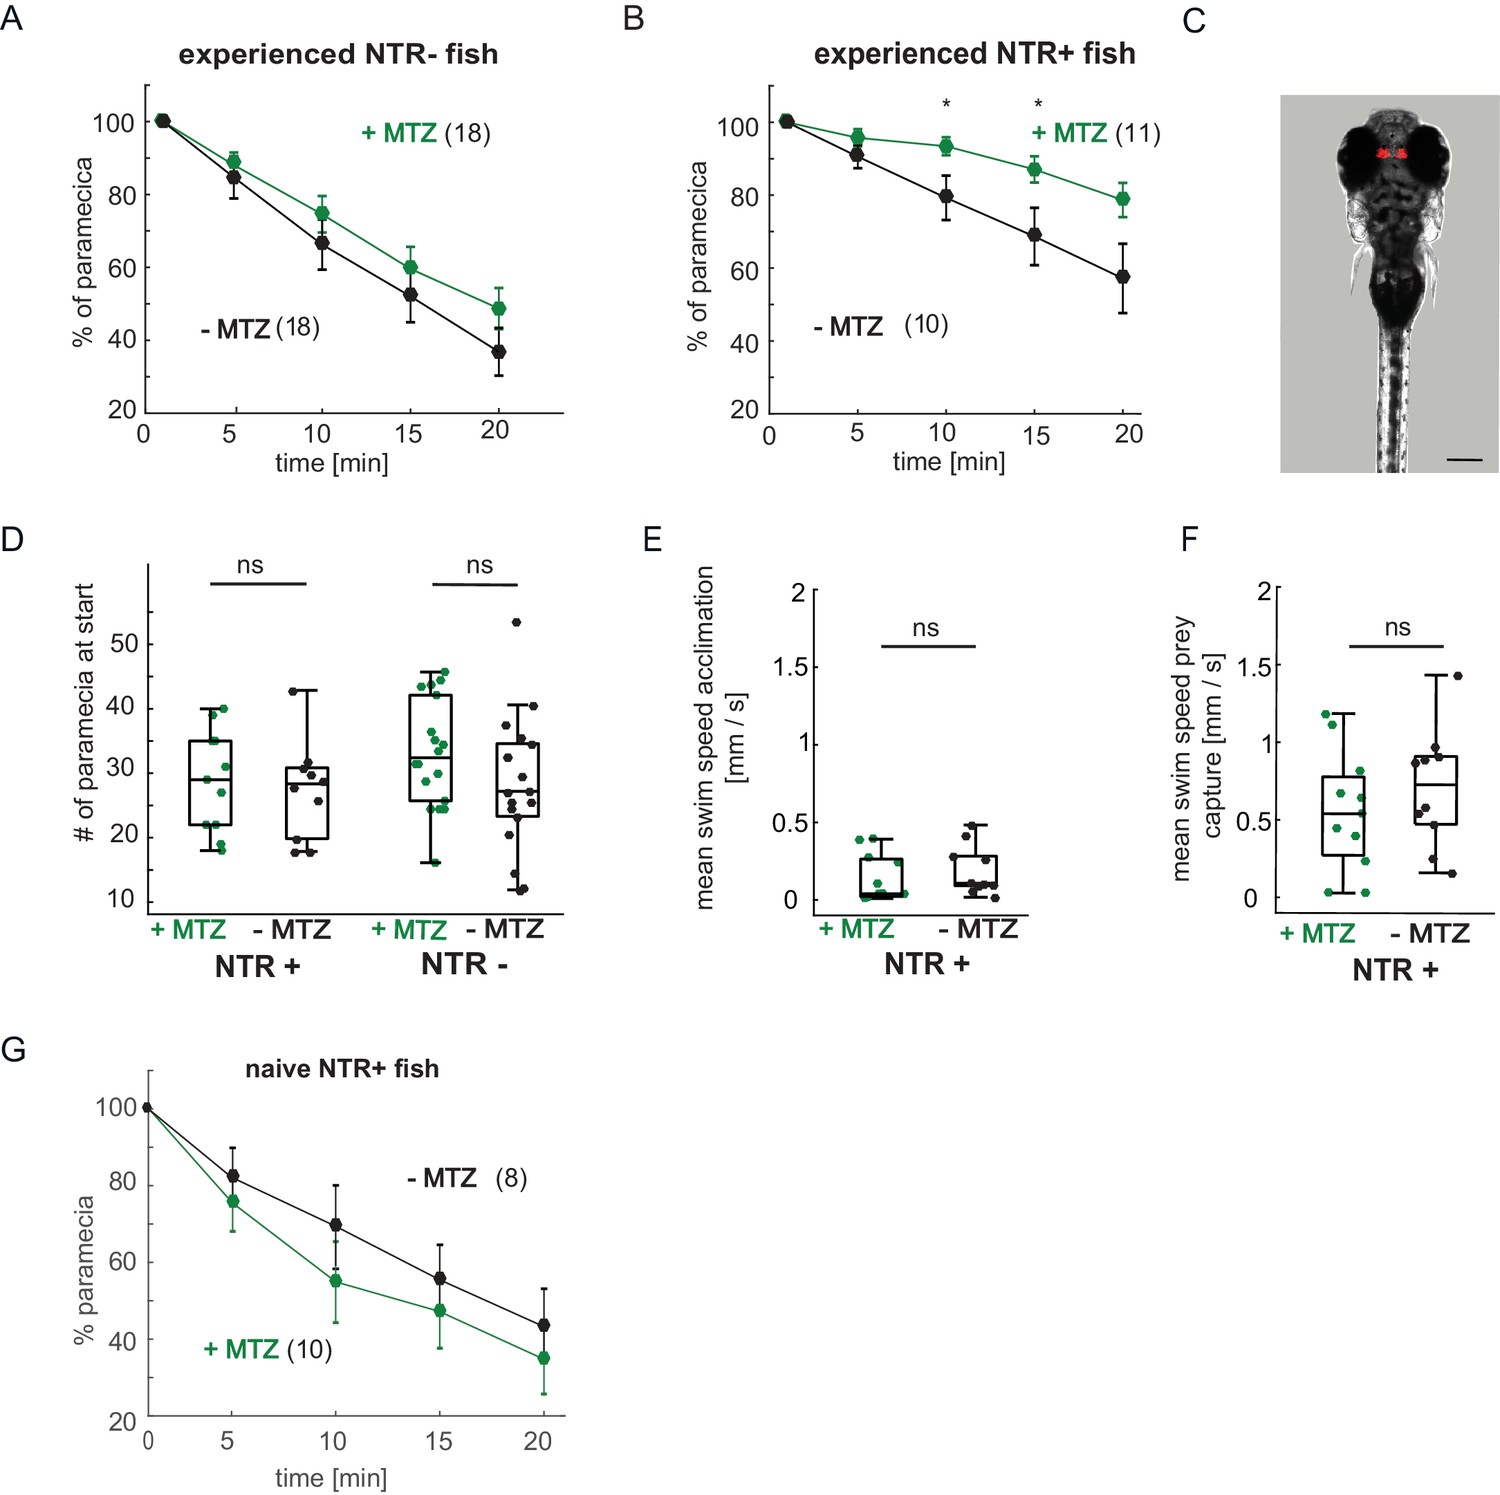
Expression pattern of Tg(gng8:Gal4;UAS:NTR-mCherry) fish, paramecia consumption and swim behavior.
(A–B) Paramecia consumption over 20 min. (A) NTR- fish showed no significant difference between +MTZ or -MTZ-treated groups (two-way repeated measures ANOVA, effect of treatmet p = 0.33). Error bars are SEM. (B) Nitroreductase expressing NTR+/+MTZ fish consume paramecia more slowly than NTR+/-MTZ fish (minute 10: p = 0.036; minute 15: p = 0.040; minute 20: p = 0.051; two-way repeated measures ANOVA, effect of treatment: p = 0.073). (C) Expression of NTR-mCherry in Tg(gng8:Gal4;UAS:NTR-mCherry) fish is specific to the habenula. Image is a maximum intensity projection of a Z-stack, NTR expression is shown in red. Scale bar is 200 µm. (D) The number of paramecia initially added to the wells was not significantly different between the +MTZ and -MTZ-treated groups, for either the NTR+ fish (p = 0.69, left side) or NTR- fish (p = 0.74, right side). Every dot represents one fish, boxplots show median and 25th and 75th percentiles. (E–F) No significant difference in average swim speed between +MTZ and -MTZ fish in NTR+ animals during the 10 min acclimation period before addition of paramecia (E) (p = 0.46) or during the 20 min prey capture period after addition of paramecia (F) (p = 0.29). Dots represent individual fish, boxplots show median and 25th and 75th percentiles. (G) Habenula ablation does not affect paramecia consumption in non-experienced fish. two-way repeated measures ANOVA shows no effect of treatment, p = 0.37. Error bars are SEM. A permutation test was used for all pairwise comparisons unless specified otherwise (see Materials and methods, Behavioral data analysis and statistics). Data tables for panels A, B, D, E, and F are in Figure 7—figure supplement 1—source data 1.
-
Figure 7—figure supplement 1—source data 1
- https://cdn.elifesciences.org/articles/56619/elife-56619-fig7-figsupp1-data1-v2.csv
Figure 7—figure supplement 2
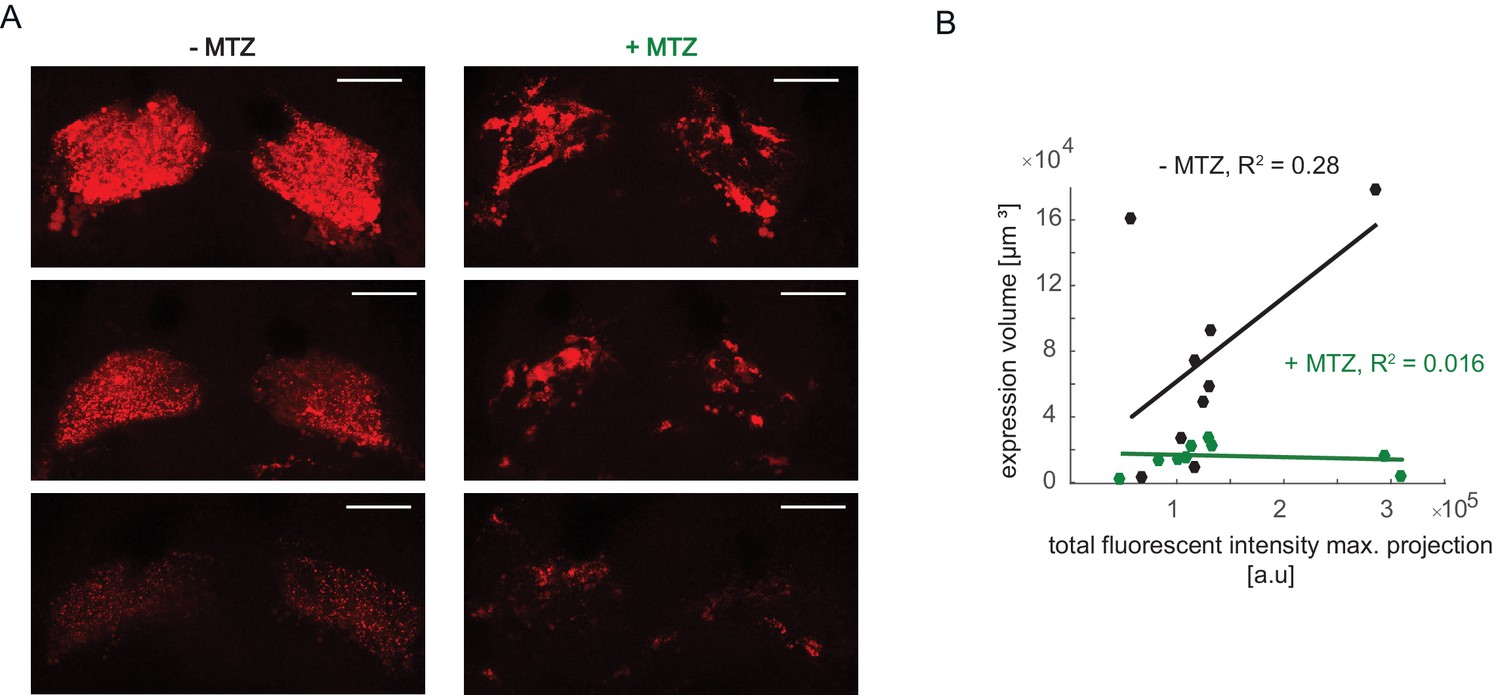
Differences in mCherry signal intensity and correlation with expression volume.
(A) Examples of mCherry pattern in healthy control habenulae of NTR+ fish treated with vehicle only (-MTZ) and metronidazole-treated (+MTZ). Although brightness levels vary, the -MTZ controls show a typical diffuse pattern, whereas the +MTZ-treated animals have a blotchy distribution. Scale bar represents 40 μm. (B) Relation between total fluorescent intensity in maximum projection of Z-stacks and calculated expression volume. Symbols represent individual fish, a permutation test was used for all pairwise comparisons unless specified otherwise (see Materials and methods, Behavioral data analysis and statistics). Data table for panel B is in (Figure 7—figure supplement 2—source data 1).
-
Figure 7—figure supplement 2—source data 1
- https://cdn.elifesciences.org/articles/56619/elife-56619-fig7-figsupp2-data1-v2.csv
Author response image 1
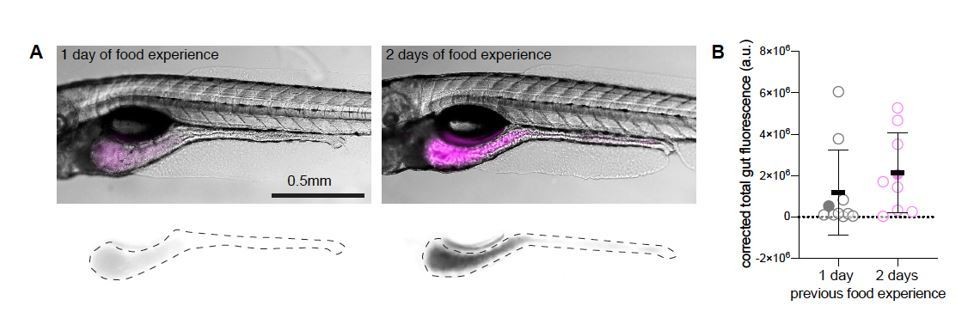
Dependence of rotifer ingestion on prior experience.
A) Example images of gut fluorescence signal (magenta) from animals fed live rotifers stained with TexasRed for 30 minutes on day 6 post fertilization (dpf). Left panel shows fish which was previously fed with live unstained rotifers at 5 dpf (1-day food experience). The right panel shows an experienced animal, fed at 4 and 5 dpf (2-day food experience). Bottom panels display TexasRed signal, dotted lines demarcate the gut area used to quantify fluorescence intensity. B) Gut fluorescence quantification of food ingested in a 30-minute time period, N= 10 animals per group. Symbols denote the fluorescence level in arbitrary units (a.u.), filled circles represent the fish shown in the example figures in A), error bars represent means ± SD. Experiment performed by Adna Dumitrescu in the lab of Claire Wyart.
Tables
Key resources table
| Reagent type (species) or resource | Designation | Source or reference | Identifiers | Additional information |
|---|---|---|---|---|
| fish line,Danio rerio | AB wild type zebrafish line | ZIRC | ZDB-GENO-960809–7 | |
| fish line,D. rerio | TL wild type zebrafish | ZIRC | ZDB-GENO-990623–2 | |
| fish line, D. rerio | TgBAC(gng8:GAL4FF);UAS:GFP | deCarvalho et al., 2013 | obtained from Halpern Lab | |
| fish line, D. rerio | Tg(UAS-E1B:NTR-mCherry) | Curado et al., 2007; Matsuoka et al., 2016 | obtained from Stainier Lab | |
| fish line, D. rerio | Tg(neurod1:GCaMP6F) | Rupprecht et al., 2016 | obtained from Wyart Lab | |
| fish line, D. rerio | Tg(atoh7:gap43-RFP) | Zolessi et al., 2006 | obtained from Wyart Lab | |
| chemical reagent | Metronidazole | Sigma-Aldrich | 1442009 USP | |
| organism, Paramecium caudatum | Paramecia | ZIRC | Paramecium starter culture | |
| reagent | Fish flakes | Hikari USA | First Bites Specialty fish food |
Additional files
-
Supplementary file 1
P-values for permutation test comparison of average fluorescence trace before and after eye convergence in experienced fish for different brain regions (Figure 2H).
- https://cdn.elifesciences.org/articles/56619/elife-56619-supp1-v2.docx
-
Supplementary file 2
P-values for comparisons of Granger-causality links in the visual areas (matrices presented in Figure 4).
For each link, differences between experienced and naïve fish are assessed. Threshold for significance after FDR-BH correction is p=0.0017 (see Materials and methods).
- https://cdn.elifesciences.org/articles/56619/elife-56619-supp2-v2.docx
-
Supplementary file 3
Statistical comparisons of visual area - motor area interactions in experienced versus naïve fish and strongest versus weakest hunters among experienced fish.
P-values for comparisons of directed (causal) interactions between visual and motor areas between experienced and naïve fish (matrices presented in Figure 5A), and strongest and weakest hunters among experienced fish (matrices presented in Figure 5—figure supplement 1A). Threshold for significance after FDR-BH correction is top: p=3.E-04, and bottom p=0.003. Links that are significantly different between groups are highlighted in yellow.
- https://cdn.elifesciences.org/articles/56619/elife-56619-supp3-v2.docx
-
Transparent reporting form
- https://cdn.elifesciences.org/articles/56619/elife-56619-transrepform-v2.docx
Download links
A two-part list of links to download the article, or parts of the article, in various formats.
Downloads (link to download the article as PDF)
Open citations (links to open the citations from this article in various online reference manager services)
Cite this article (links to download the citations from this article in formats compatible with various reference manager tools)
Experience, circuit dynamics, and forebrain recruitment in larval zebrafish prey capture
eLife 9:e56619.
https://doi.org/10.7554/eLife.56619


