Cortical bone maturation in mice requires SOCS3 suppression of gp130/STAT3 signalling in osteocytes
- St. Vincent’s Institute of Medical Research, Australia
- University of Melbourne, Department of Medicine at St. Vincent’s Hospital, Australia
- Department of Pediatrics, Teikyo University School of Medicine, Japan
- Department of Biochemistry and Molecular Biology, Bio21 Molecular Science and Biotechnology Institute, University of Melbourne, Australia
Figures
Figure 1 with 1 supplement
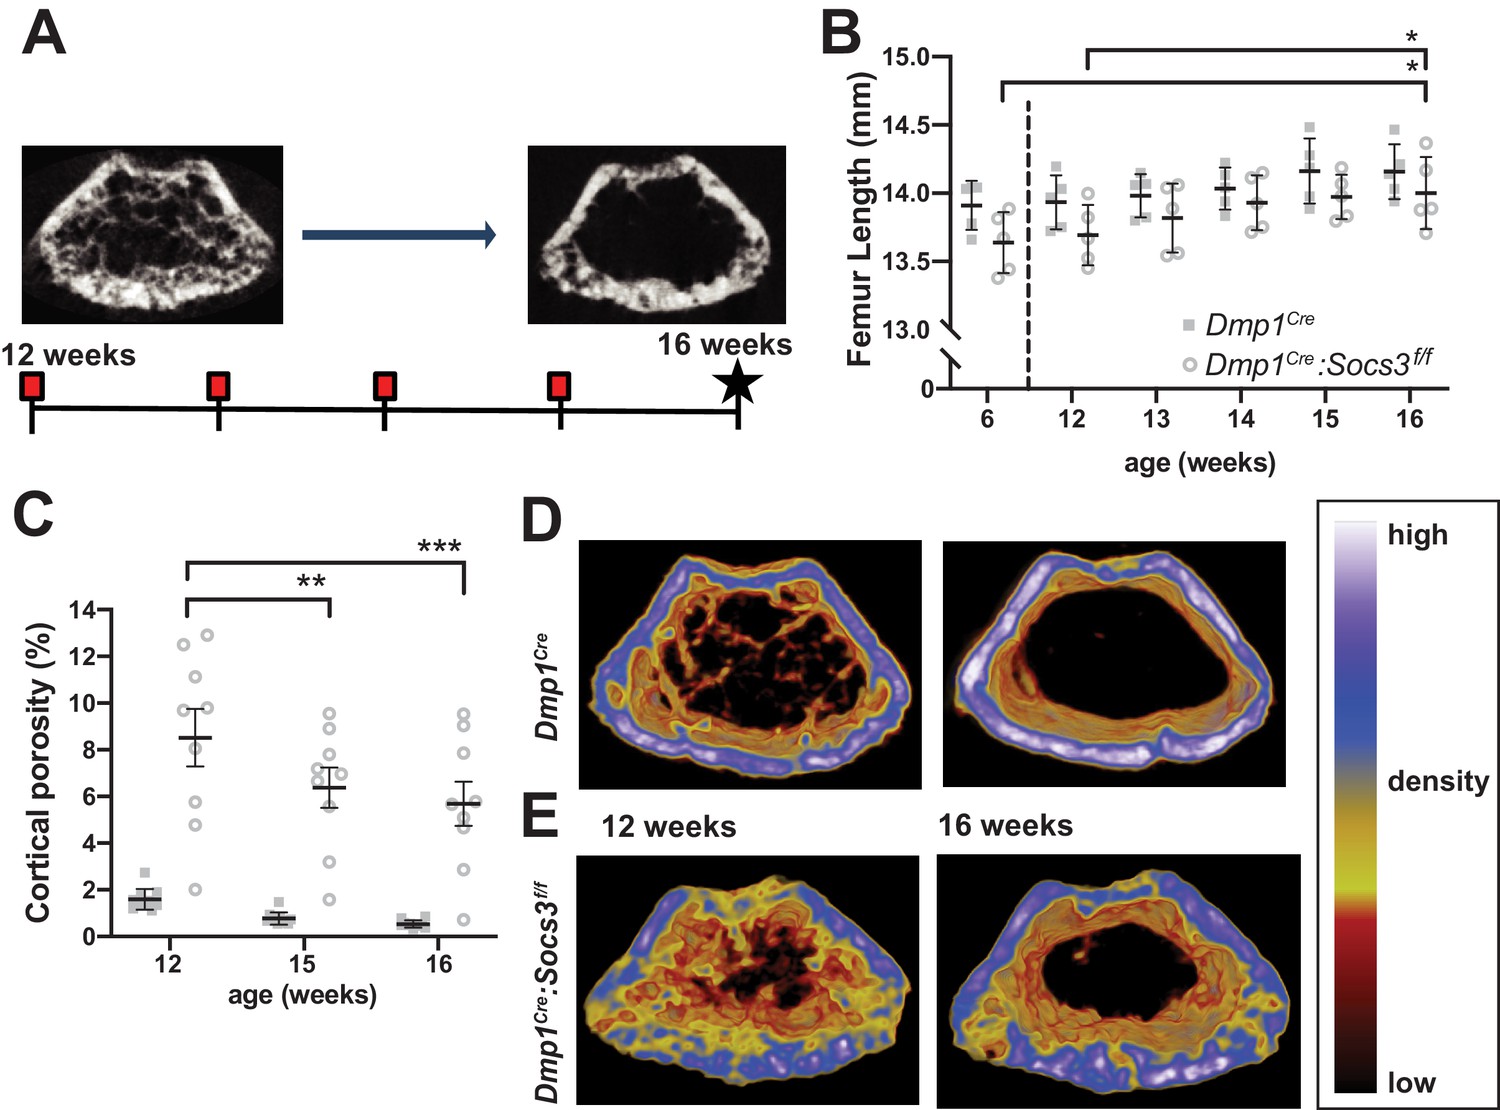
Transition to compact and highly mineralised bone is delayed in Dmp1Cre:Socs3f/f mice until longitudinal growth has ceased.
(A) Schematic for studying time course of corticalisation in female Dmp1Cre:Socs3f/f mice. (B) Femur length at 6, and 12 to 16 weeks of age in female Dmp1Cre:Socs3f/f and control mice; *p<0.05 for comparison shown, by repeated measures two-way ANOVA and Tukey’s post-hoc test; effect of age, p=0.0118; effect of genotype, p=0.1249 (not significant); age x genotype interaction, p=0.8443 (not significant); n = 5 mice/group. (C) Cortical porosity at 12, 15 and 16 weeks in female Dmp1Cre:Socs3f/f and control mice. **, p<0.01, ***p<0.001 for comparison shown (age-related change) by two-way ANOVA with repeated measures and Tukey post hoc test; effect of age, p<0.0001; effect of genotype, p<0.0001; age x genotype interaction, p=0.0429; no significant change in cortical porosity in control animals; n = 9 mice/group. (D) Representative micro-CT images with pseudo-colorization based on raw density of the micro-CT scans. These show the change in cortical morphology and increase in density within the metaphyseal region between 12 and 16 weeks: still images at the beginning and end of the sequence. Videos show transitions between all 5 images Video 1; Video 2.
-
Figure 1—source data 1
Raw data for cortical porosity measurements.
- https://cdn.elifesciences.org/articles/56666/elife-56666-fig1-data1-v1.xlsx
Figure 1—figure supplement 1

Cortical porosity of the femoral diaphysis of Dmp1Cre and Dmp1Cre:Socs3f/f mice at 12 weeks of age.
Data are mean ± SEM; n = 11 mice per group; p value derived by Welch’s t-test.
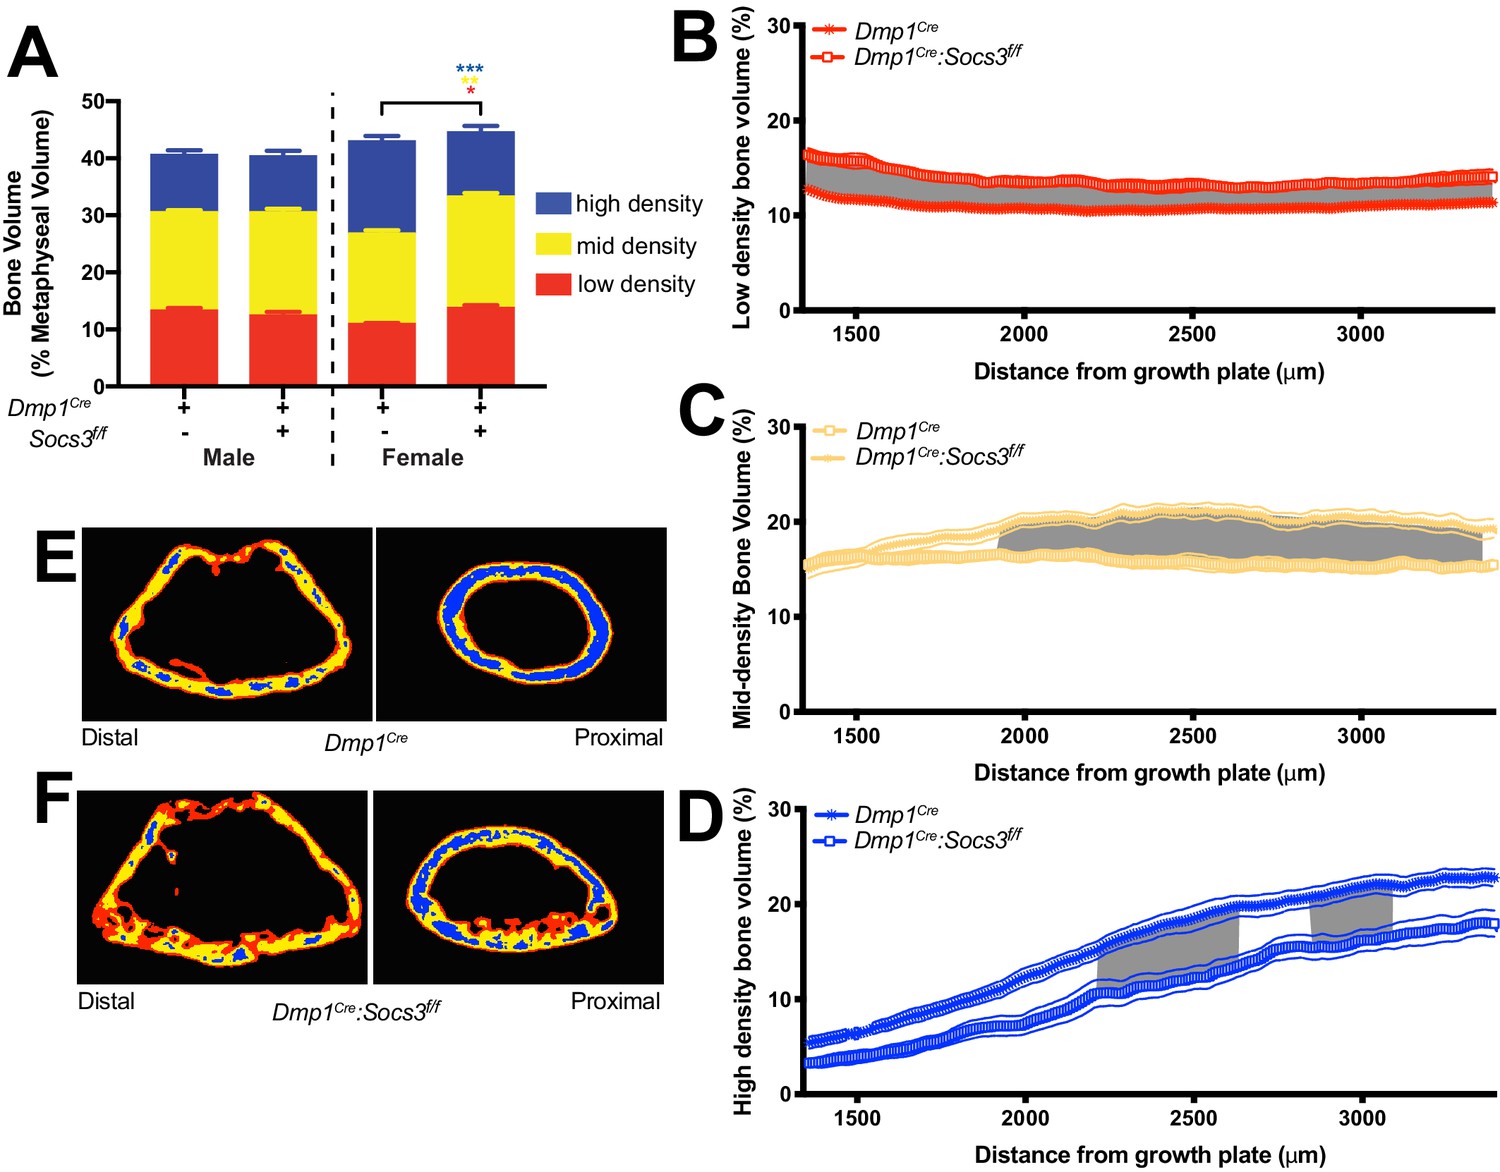
Figure 2
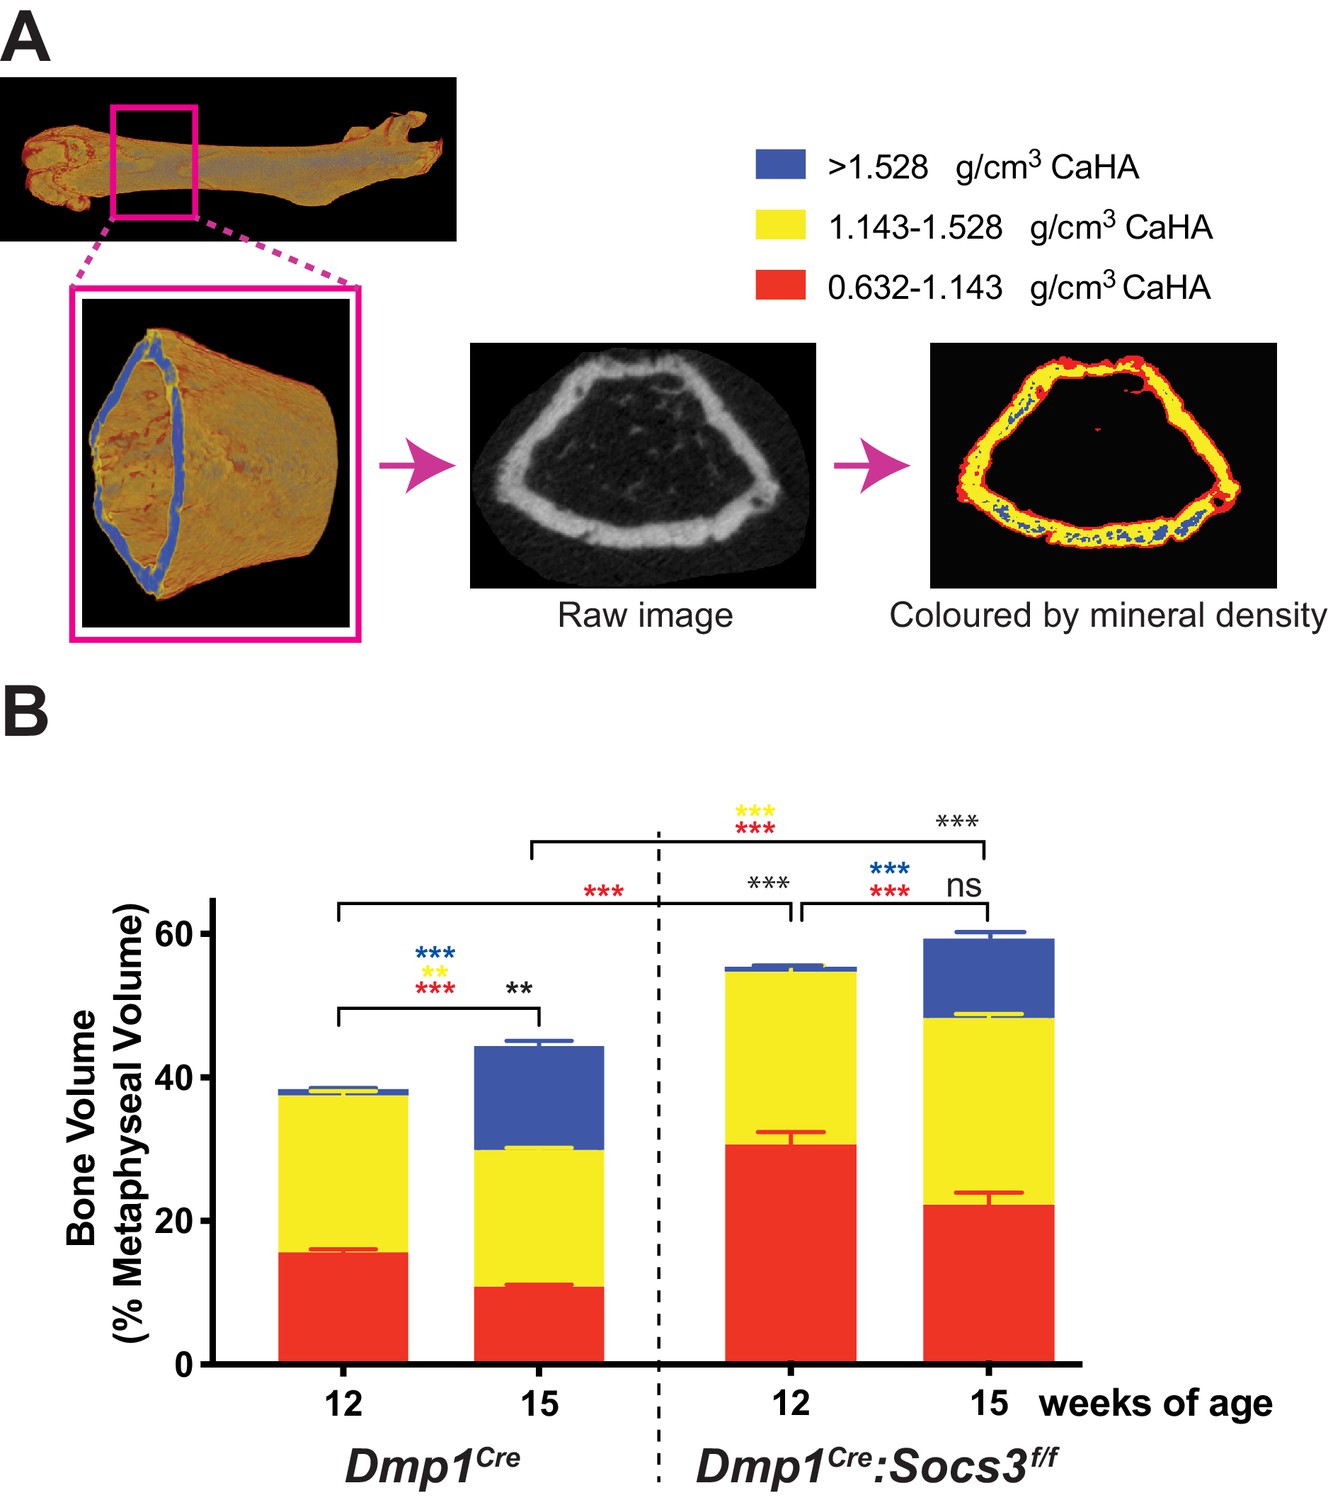
Transition to more highly mineralised bone during maturation of the metaphysis in female control (Dmp1Cre) and Dmp1Cre:Socs3f/f femora.
(A) Diagram showing region measured, and Otsu thresholding of a raw micro-CT image. (B) Bone volume, as a percentage of total metaphyseal volume, segregated by low, mid and high density volumes, at 12 and 15 weeks in Dmp1Cre and Dmp1Cre:Socs3f/f mice; black asterisks denote significant changes in total bone volume, as indicated by square brackets. Changes in low-, mid- and high-density bone are indicated by coloured asterisks; error bars shown are SEM for the low-, mid- and high-density bone volumes. **, p<0.01; ***, p<0.001 for comparisons shown, determined by repeated measures two-way ANOVA with Šidák post-hoc test; n = 9–11 mice per group.
-
Figure 2—source data 1
Raw data for bone density measurements at all three densities.
- https://cdn.elifesciences.org/articles/56666/elife-56666-fig2-data1-v1.xlsx
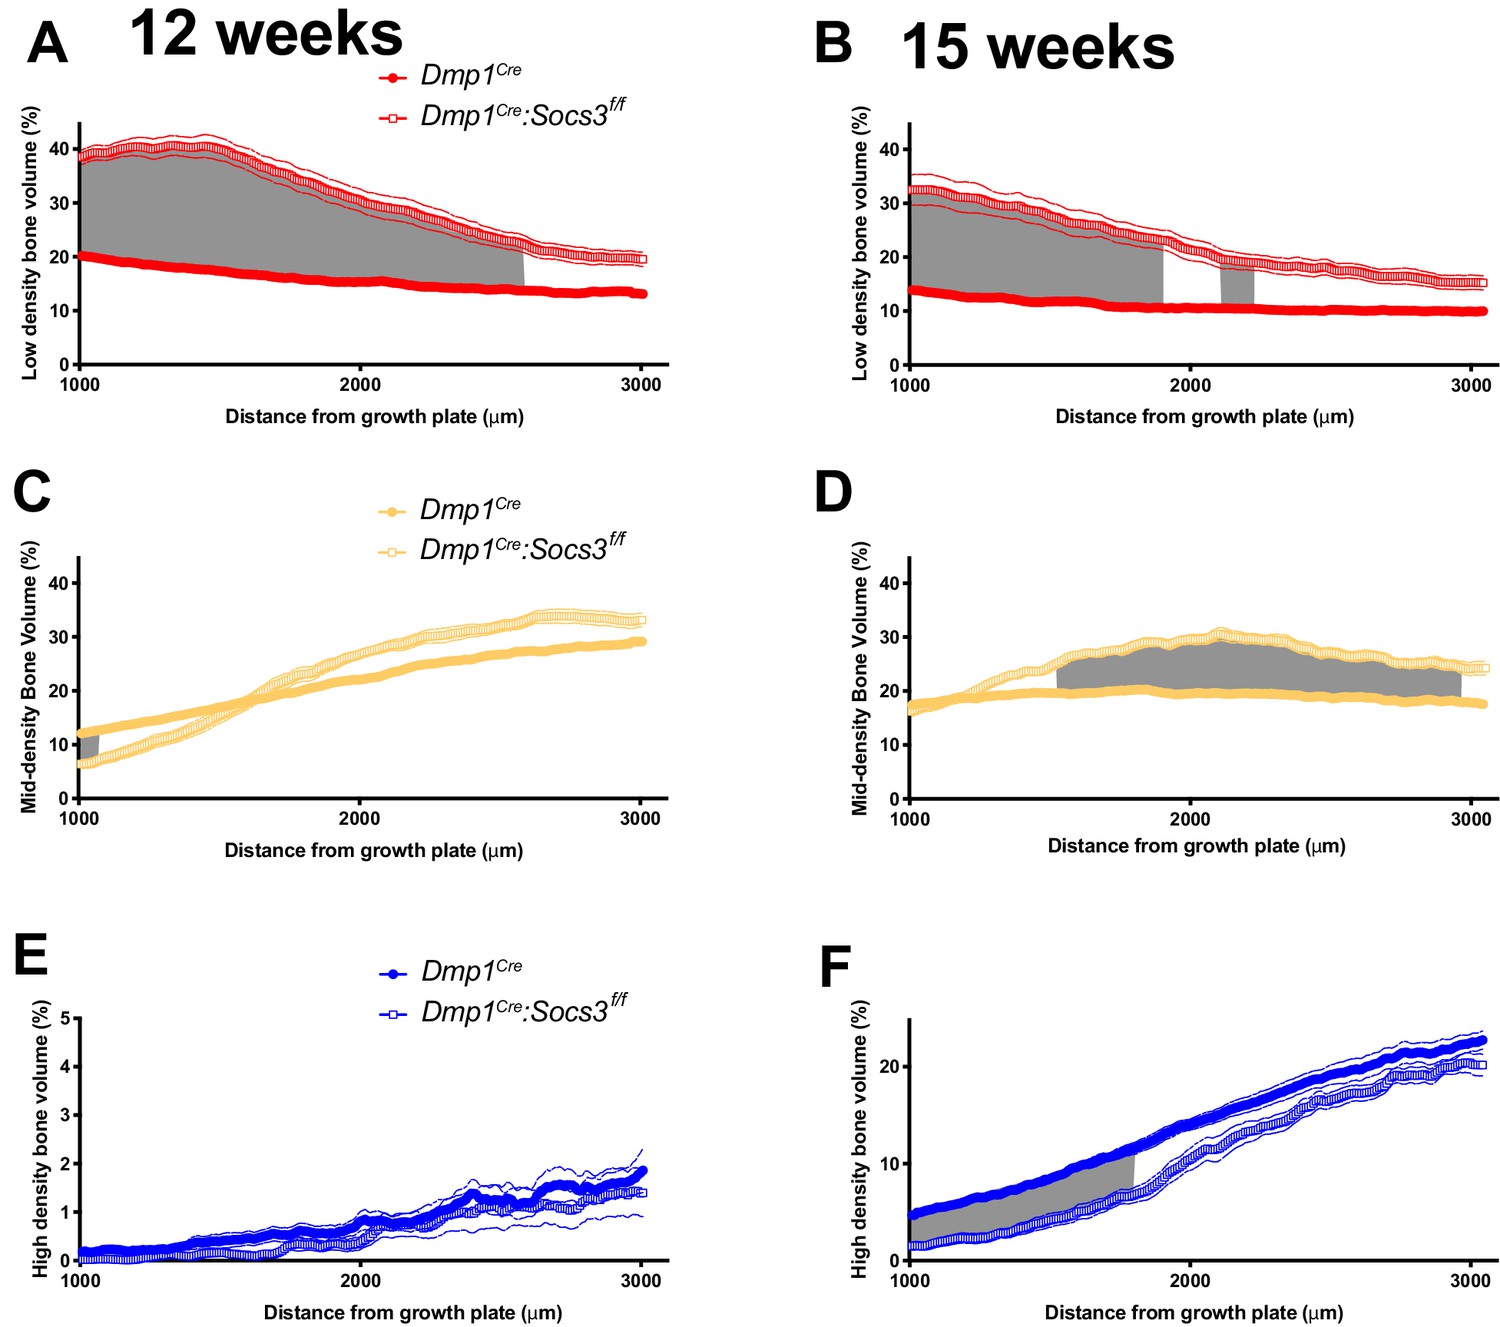
Figure 3 with 3 supplements
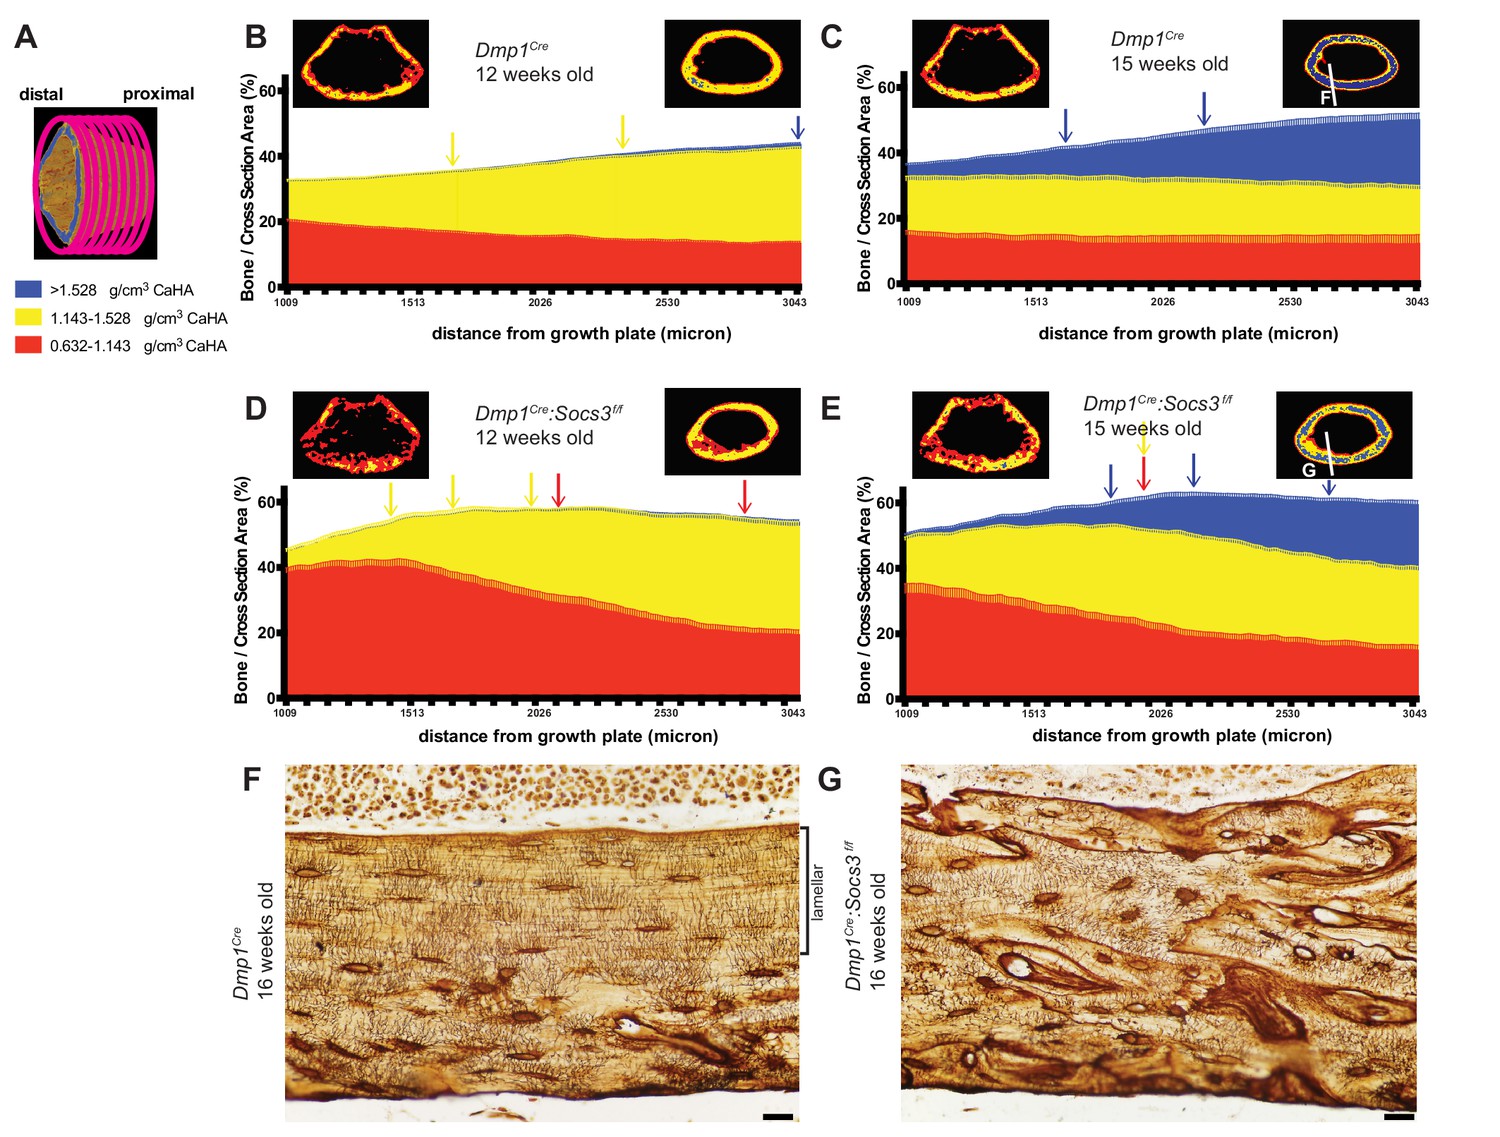
Bone becomes more mineralized with age, and with increasing distance from the growth plate in Dmp1Cre mice; this is delayed in Dmp1Cre: Socs3f/f mice.
(A) The metaphyseal region was analysed in consecutive 9 micron slices. (B–E) Bone volume at low-, mid-, and high-density mineral levels in each slice from the distal to proximal end of the metaphyseal region at 12 weeks (B,D) and 15 weeks (C,E) of age in Dmp1Cre (B,C) and Dmp1Cre:Socs3f/f mice (D,E). Values are mean+ SEM, n = 9–11 mice per group; arrows denote where data becomes significantly different to the furthest slice from the arrow; colours denote the density level of bone that has changed. Pseudo-colourised images based on the Otsu thresholds show a representative sample for the top and bottom slice for each graph. Differences between genotypes are shown in Figure 3—figure supplement 2. (F,G) Ploton silver stain for osteocyte canaliculi and cement lines at the base of the metaphyseal region cut through the femur as indicated in the inset images of C and E for Dmp1Cre (F) and Dmp1Cre:Socs3f/f mice (G). Scale bar = 20 micron.
-
Figure 3—source data 1
Bone volume at low-, mid-, and high-density mineral levels in each slice from the distal to proximal end of the metaphyseal region at 12 weeks and 15 weeks in Dmp1Cre and Dmp1Cre:Socs3f/f mice.
- https://cdn.elifesciences.org/articles/56666/elife-56666-fig3-data1-v1.xls
Figure 3—figure supplement 1
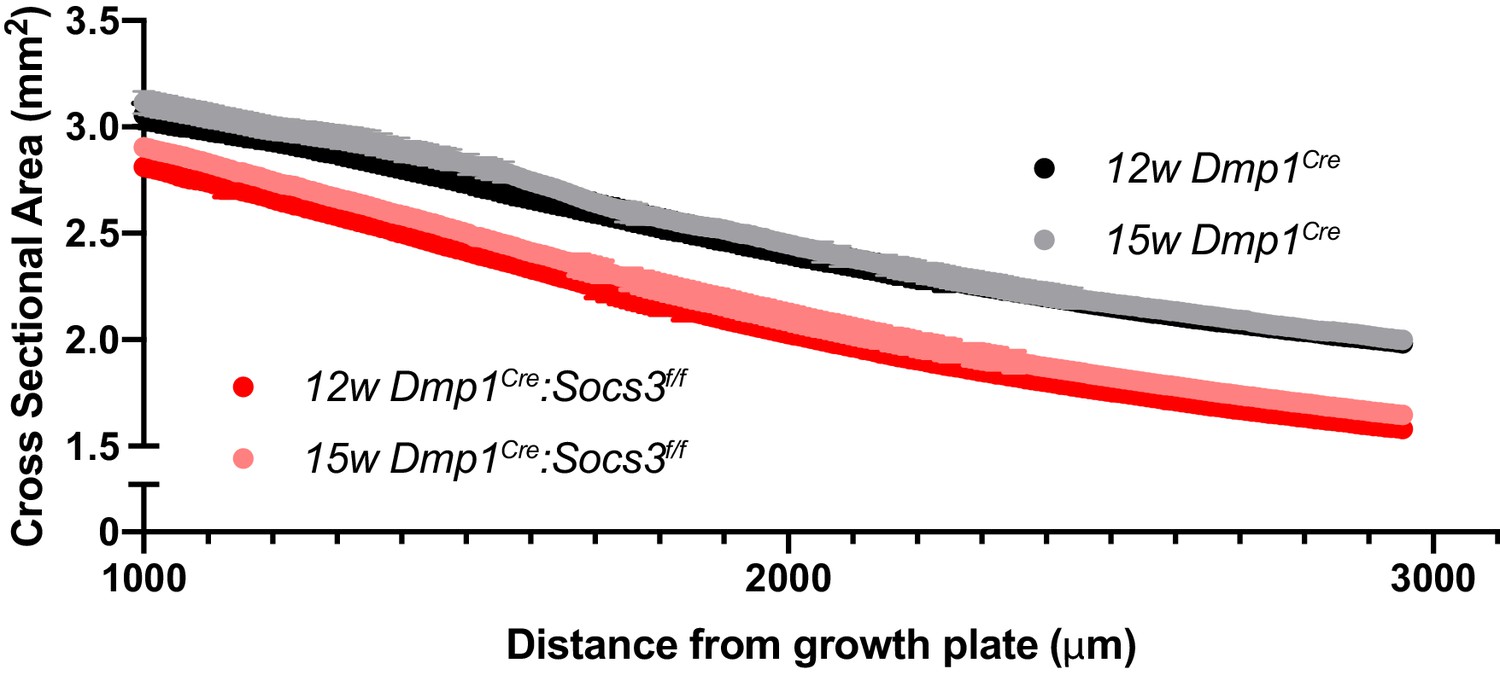
Total bone area of the metaphyseal slices in Dmp1Cre and Dmp1Cre:Socs3f/f mice at 12 and 15 weeks of age (B,D,F).
Data are mean ± SEM; n = 9–11 mice per group.
Figure 3—figure supplement 2
Comparison of high density, (A,B), mid-density (C,D) and low density (E,F) bone between Dmp1Cre and Dmp1Cre:Socs3f/f mice at 12 (A,C,E) and 15 weeks of age (B,D,F).
Data are mean with SEM shown by dashed lines, taken slice by slice through the metaphysis (see Figure 3A for schematic). Gray region indicates significant difference between genotypes by repeated measures two-way ANOVA with Šidák post-hoc test.
Figure 3—figure supplement 3
Direct comparison of archived scans from Dmp1Cre and Dmp1Cre:Socs3f/f mice at 26 weeks of age.
(A) Bone volume, as a percentage of total metaphyseal volume, segregated by low, mid and high density volumes; changes in low-, mid- and high-density bone are indicated by coloured asterisks; error bars shown are SEM for the low-, mid- and high-density bone volumes. **, p<0.01; ***, p<0.001 for comparisons shown, determined by repeated measures two-way ANOVA with Šidák post-hoc test; n = 9 per group. (B–D) Comparison of high density (B), mid-density (C) and low-density (D) bone between female Dmp1Cre and Dmp1Cre:Socs3f/f mice at 26 weeks of age. Data are mean with SEM shown by dashed lines, taken slice by slice through the metaphysis (see Figure 3A for schematic); n = 9 mice per group. Gray region indicates significant difference between genotypes by repeated measures two-way ANOVA with Šidák post-hoc test.( E,F) Pseudo-colourised images showing a representative sample for the distal and proximal slices for each female genotype.
Figure 4
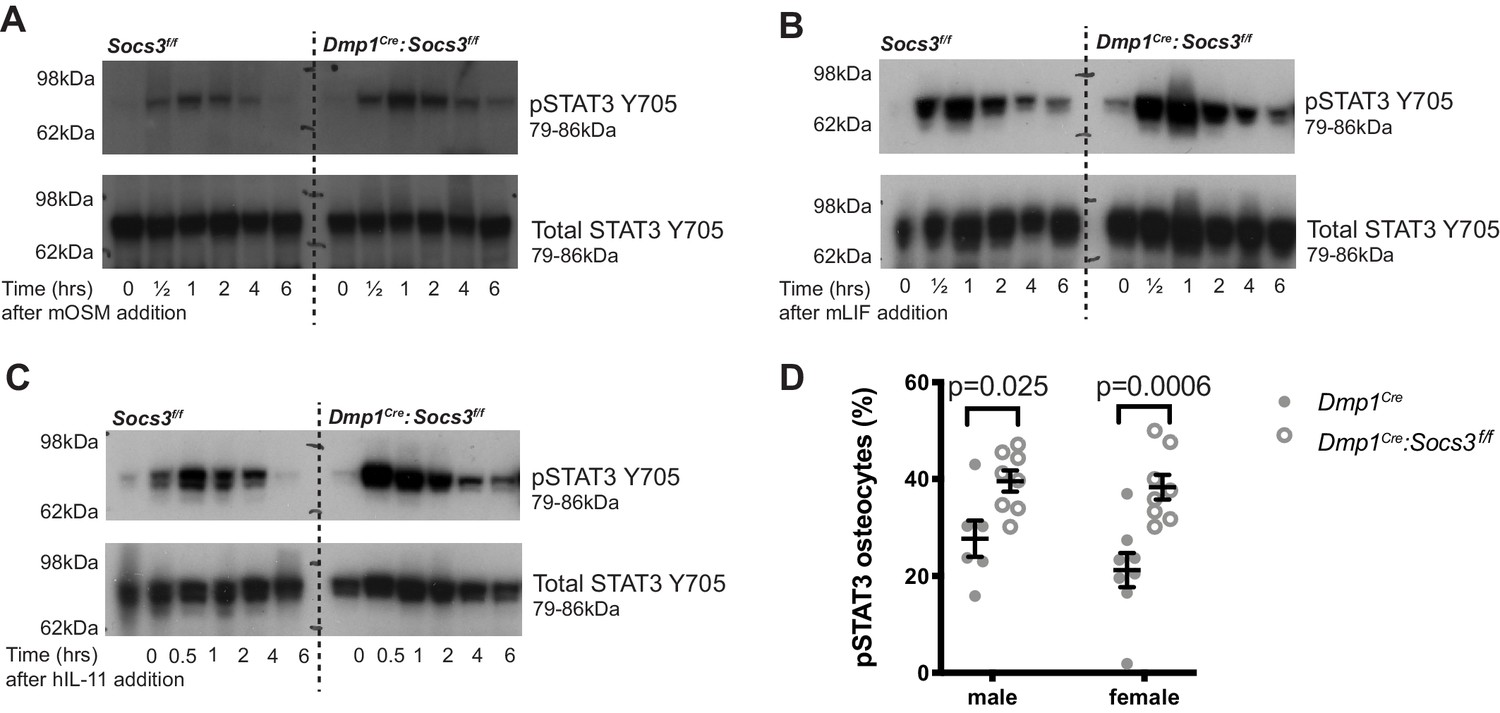
STAT3 phosphorylation response is magnified and extended in calvarial bone from male Socs3f/f (control) and Dmp1Cre:Socs3f/f mice treated with gp130-dependent stimuli (A-C), and elevated under basal conditions in Dmp1Cre:Socs3f/f osteocytes (D).
(A-C) Mice were given a single calvarial injection of murine oncostatin M (mOSM) (A), murine leukaemia inhibitory factor (mLIF) (B), or human interleukin- 11 (hIL-11) (C). Calvariae were collected at the time of injection, and at 30 min, 1, 2, 4, and 6 hr. Shown are phospho- and total STAT3 westeArn blots; 4 mice were assessed per group; representative blots shown. (D) Quantitation of phospho-STAT3 (pSTAT3) immunohistochemistry in the tibial lateral metaphyses of 12 week old male and female Dmp1Cre and Dmp1Cre:Socs3f/f mice; n = 5–8 per group; values are individual points with mean and SEM; p values generated by two-way ANOVA with Sidak post-hoc test.
-
Figure 4—source data 1
Uncropped gels for phospho-STAT3 (left panels) and total STAT3/pan actin (right panels) for calvarial samples from Socs3f/f and Dmp1Cre:Socs3f/f mice treated with OSM (A), LIF (B) or IL-11 (C).
Details of molecular weight markers and legends for the gels are in Figure 4.
- https://cdn.elifesciences.org/articles/56666/elife-56666-fig4-data1-v1.pdf
Figure 5 with 1 supplement

Rescue of delayed corticalisation in 12 week old male and female Dmp1Cre:Socs3f/f:Il6stf/f mice.
Metaphyseal cortical porosity in female and male control (Dmp1Cre) and Dmp1Cre:Il6stf/f mice (A) and Dmp1Cre:Socs3f/f and Dmp1Cre:Socs3f/f:Il6stf/f mice (B) and representative Otsu-based pseudocolorised images (C). (D) Bone volume, as a percentage of total metaphyseal volume, segregated by low, mid and high density volumes, in 12 week old Dmp1Cre:Socs3f/f and Dmp1Cre:Socs3f/f:Il6stf/f mice. Changes in low-, mid- and high-density bone are indicated by coloured asterisks; error bars shown are SEM for the low-, mid- and high-density bone volumes. *, p<0.5; **, p<0.01; ***, p<0.001 for comparisons shown, determined by repeated measures two-way ANOVA with Šidák post-hoc test; n = 9–11 mice per group. (E–H) Bone volume at low-, mid-, and high-density mineral levels in each slice from the distal to proximal end of the metaphyseal region in 12 week old female (E,F) and male (G,H) Dmp1Cre:Socs3f/f femora (E,G) and Dmp1Cre:Socs3f/f:Il6stf/f (F,H) f. Values are mean+ SEM, n = 9–11 mice per group; arrows denote where data becomes significantly different to the furthest slice from the arrow; colours denote the density level of bone that has changed. Pseudo-colourised images show a representative sample for the top and bottom slice for each graph. Differences between genotypes are shown in Figure 5—figure supplement 1 .
-
Figure 5—source data 1
Bone volume at low-, mid-, and high-density mineral levels in each slices from the distal to proximal end of the metaphyseal region in 12 week old female and male Dmp1Cre:Socs3f/f mice and Dmp1Cre:Socs3f/f:Il6stf/f mice.
- https://cdn.elifesciences.org/articles/56666/elife-56666-fig5-data1-v1.xls
Figure 5—figure supplement 1
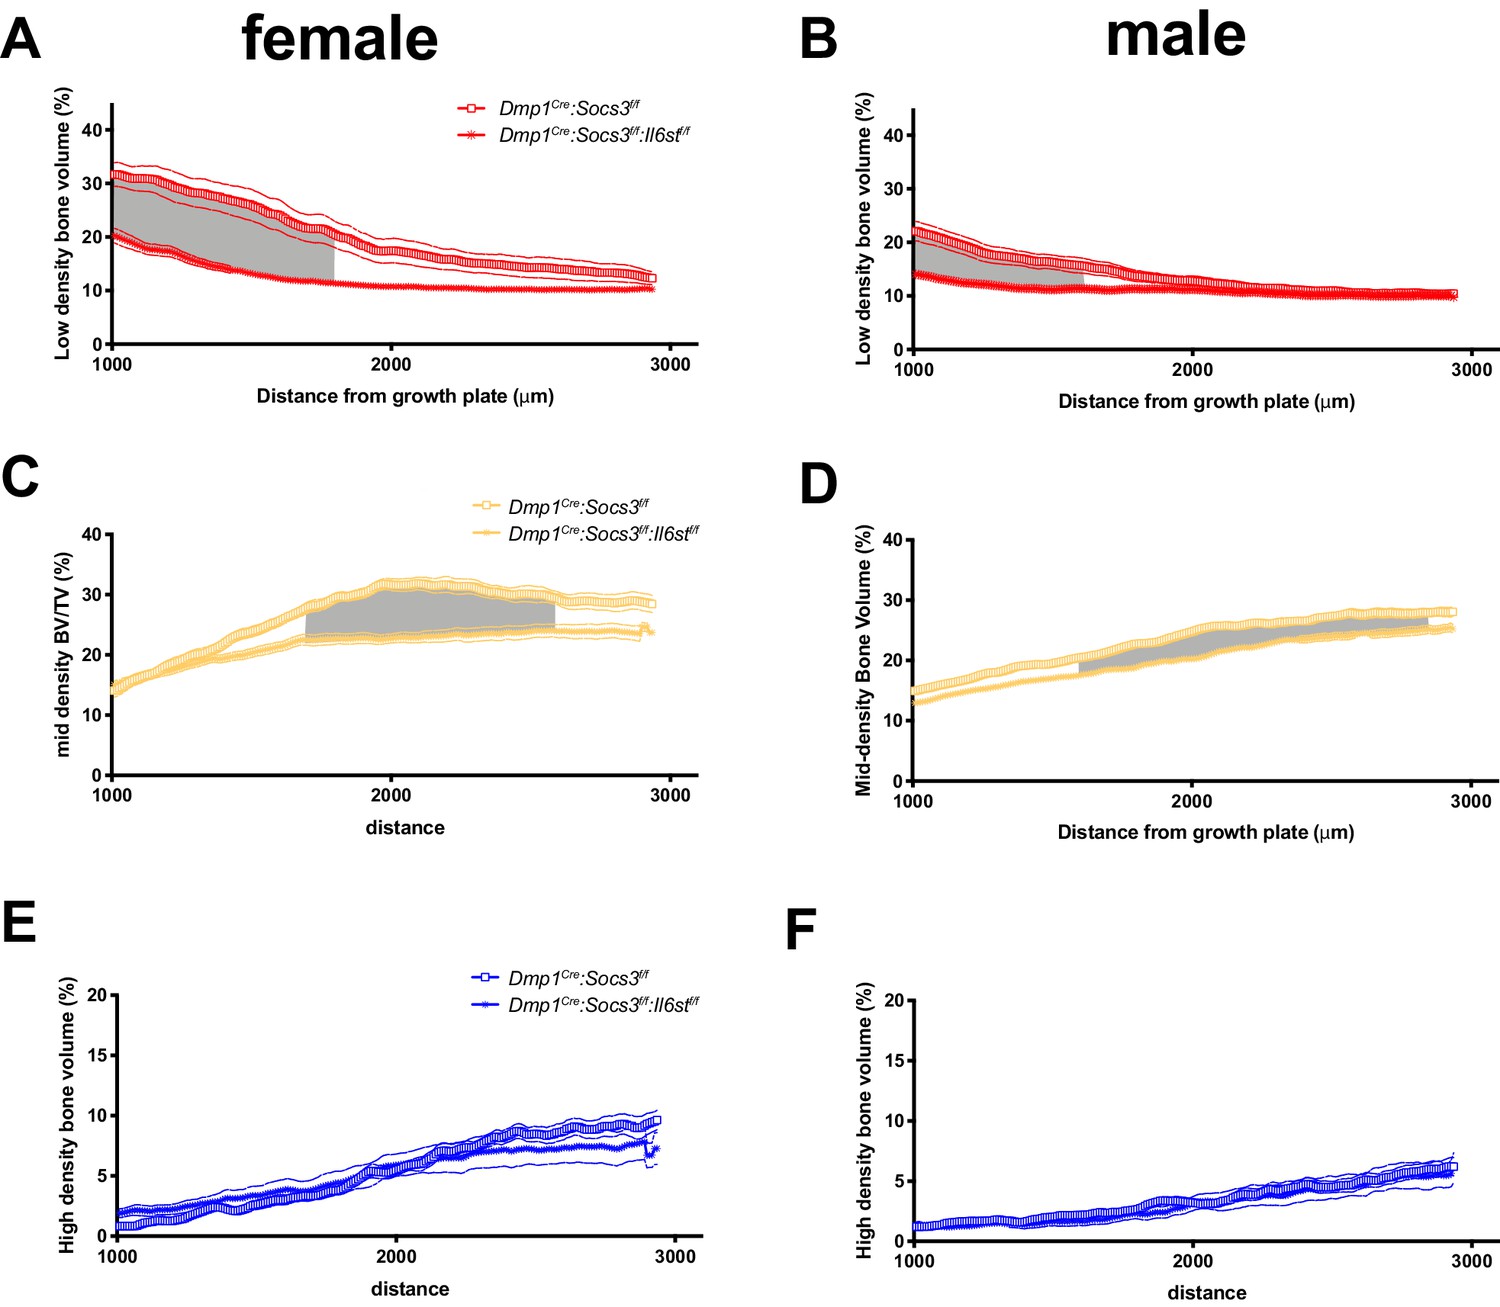
Direct comparison of high density (A,B), mid-density (C,D) and low-density (E,F) bone between Dmp1Cre:Socs3f/f and Dmp1Cre:Socs3f/f:Il6stf/f mice.
Data are mean with SEM shown by dashed lines, taken slice by slice through the metaphysis (see Figure 3A for schematic). Data are mean ± SEM; n = 9–11 mice per group. Gray region indicates significant difference between genotypes by repeated measures two-way ANOVA with Šidák post-hoc test.
Figure 6 with 1 supplement
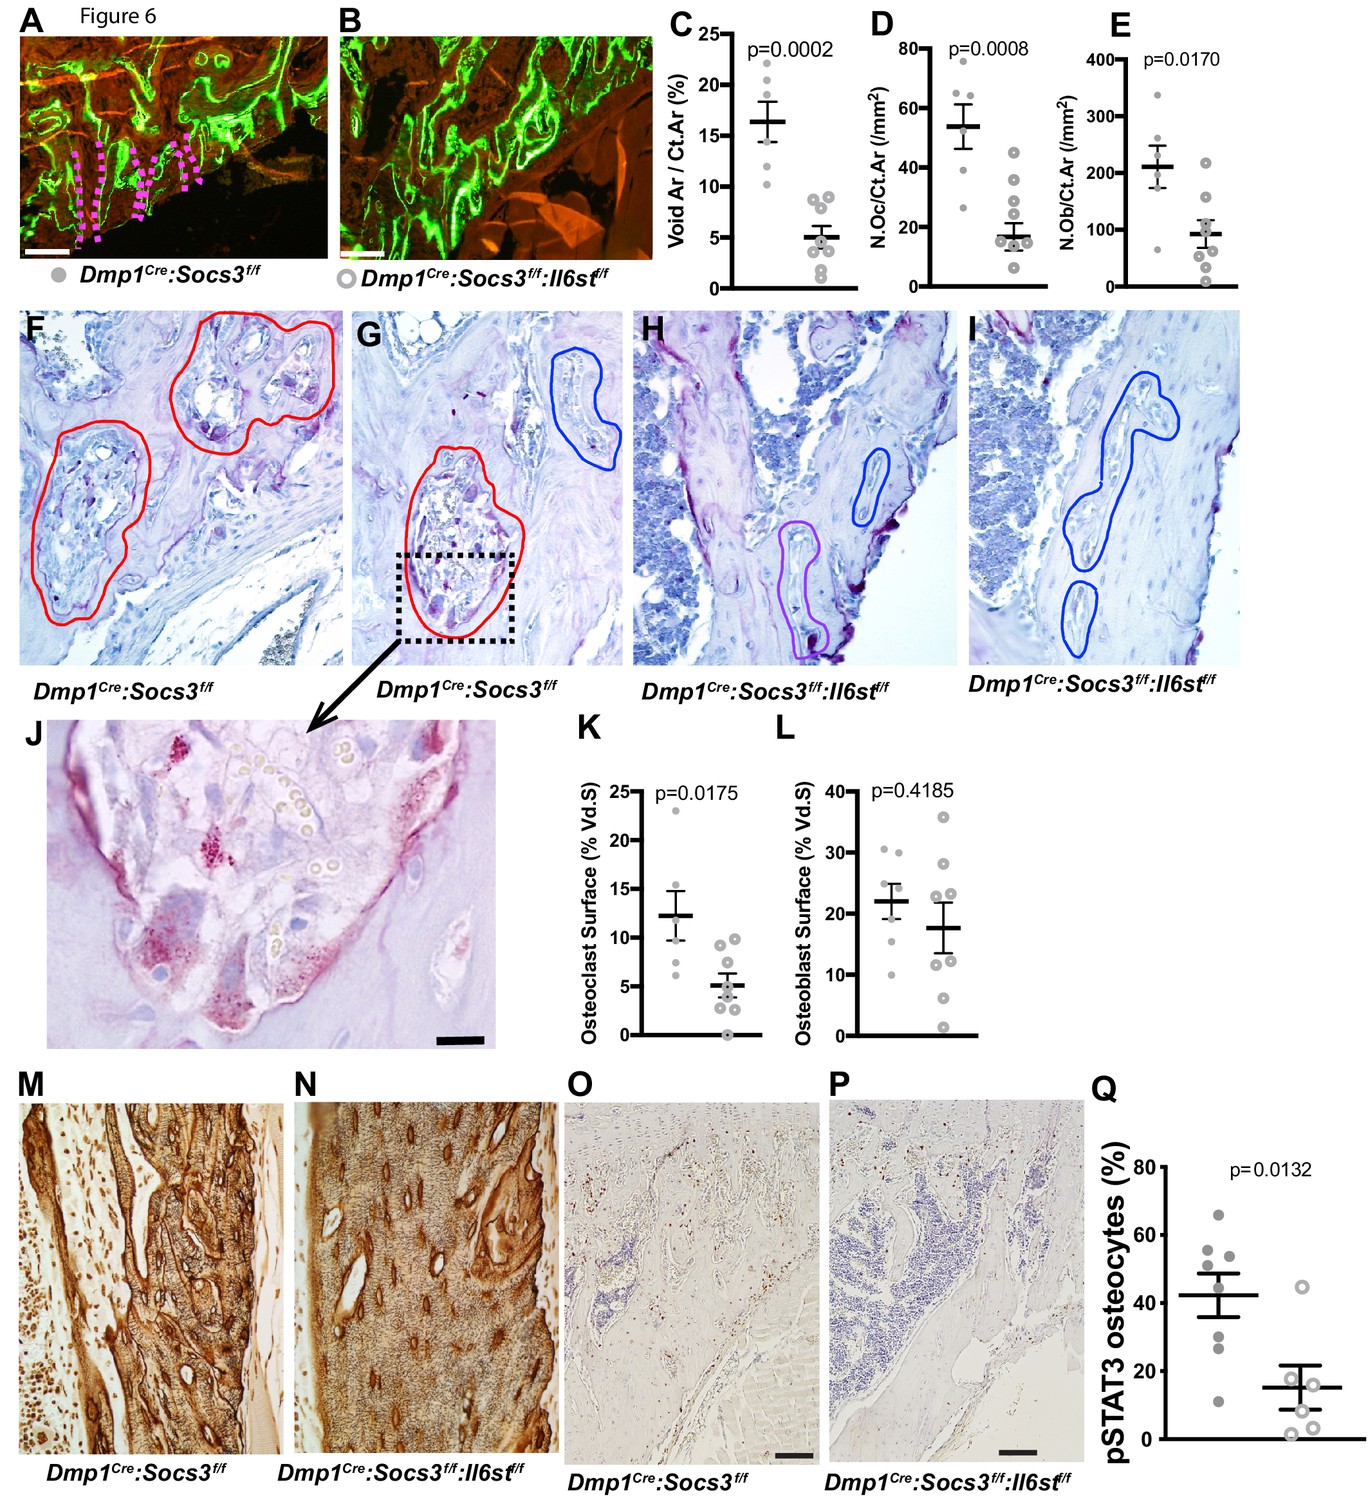
Closure of cortical pores in Dmp1Cre:Socs3f/f mice by Il6st knockdown involves reduced cortical resorption and reduced STAT3 phosphorylation.
(A,B) Representative calcein labelling in Dmp1Cre:Socs3f/f and Dmp1Cre:Socs3f/f:Il6stf/f mice. Pink dashed lines show transcortical pores. (C–E) Histomorphometry of cortical void area (Vd.Ar/Ct.Ar), numbers of osteoclasts (N.Oc/Ct.Ar) and osteoblasts (N.Ob/Ct.Ar) each normalised for cortical area. (F–I) Sections of the upper (F,H) and lower (G,I) regions of the tibial lateral proximal metaphysis showing more osteoclastic resorption (outlined in red) in Dmp1Cre:Socs3f/f compared to Dmp1Cre:Socs3f/f:Il6stf/f cortex; a high resolution image of resorption pits from boxed region of panel F is shown in panel J. (K,L) Cortical osteoclast surface and osteoblast surface normalised to the extent of void surface in 12 week old Dmp1Cre:Socs3f/f and Dmp1Cre:Socs3f/f:Il6stf/f mice. (M,N) Ploton silver stain showing loss of the extensive cement lines and more ordered orientation of osteocyte cell bodies in the 12 week old tibial lateral metaphysis in Dmp1Cre:Socs3f/f:Il6stf/f mice compared to Dmp1Cre:Socs3f/f mice. (O–Q) Phospho-STAT3 (pSTAT3) immunohistochemistry in the tibial lateral metaphysis of 12 week old Dmp1Cre:Socs3f/f (O) and Dmp1Cre:Socs3f/f:Il6stf/f mice (P) and osteocyte quantitation (Q) in the same region. For all graphs, data are individual data points with mean ± SEM. P values determined by Student’s t-test.
Figure 6—figure supplement 1
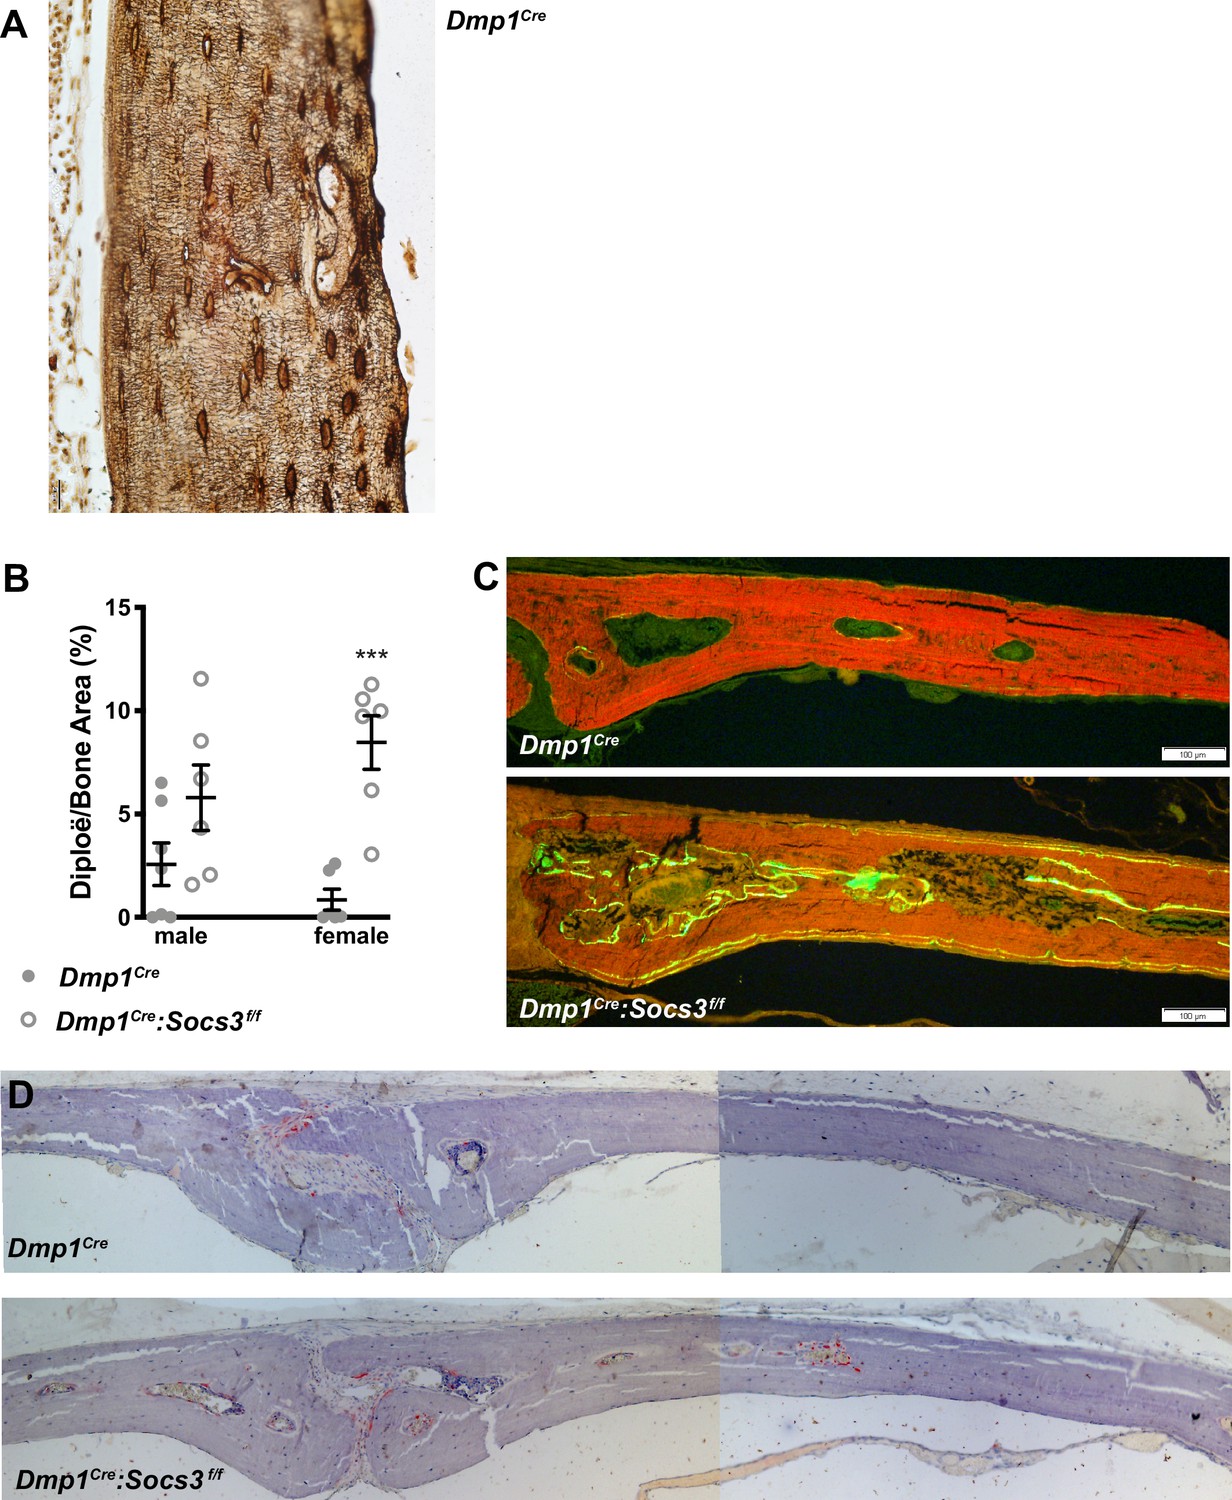
Additional histological images, including analysis of calvarial bone.
(A) Ploton silver stain in the tibial lateral metaphysis of a 12 week old Dmp1Cre mouse; for comparison with Figure 6M,N. (B) Area of voids (diplöe) as a proportion of calvarial bone from 12 week old Dmp1Cre and Dmp1Cre:Socs3f/f mice; ***, p<0.0001 vs Dmp1Cre. (C,D) Representative images, showing increased calcein labels, indicating bone formation (C) and TRAP staining, indicating osteoclasts (D) within diplöe in 12 week old Dmp1Cre:Socs3f/f mice compared to Dmp1Cre controls.
Figure 7
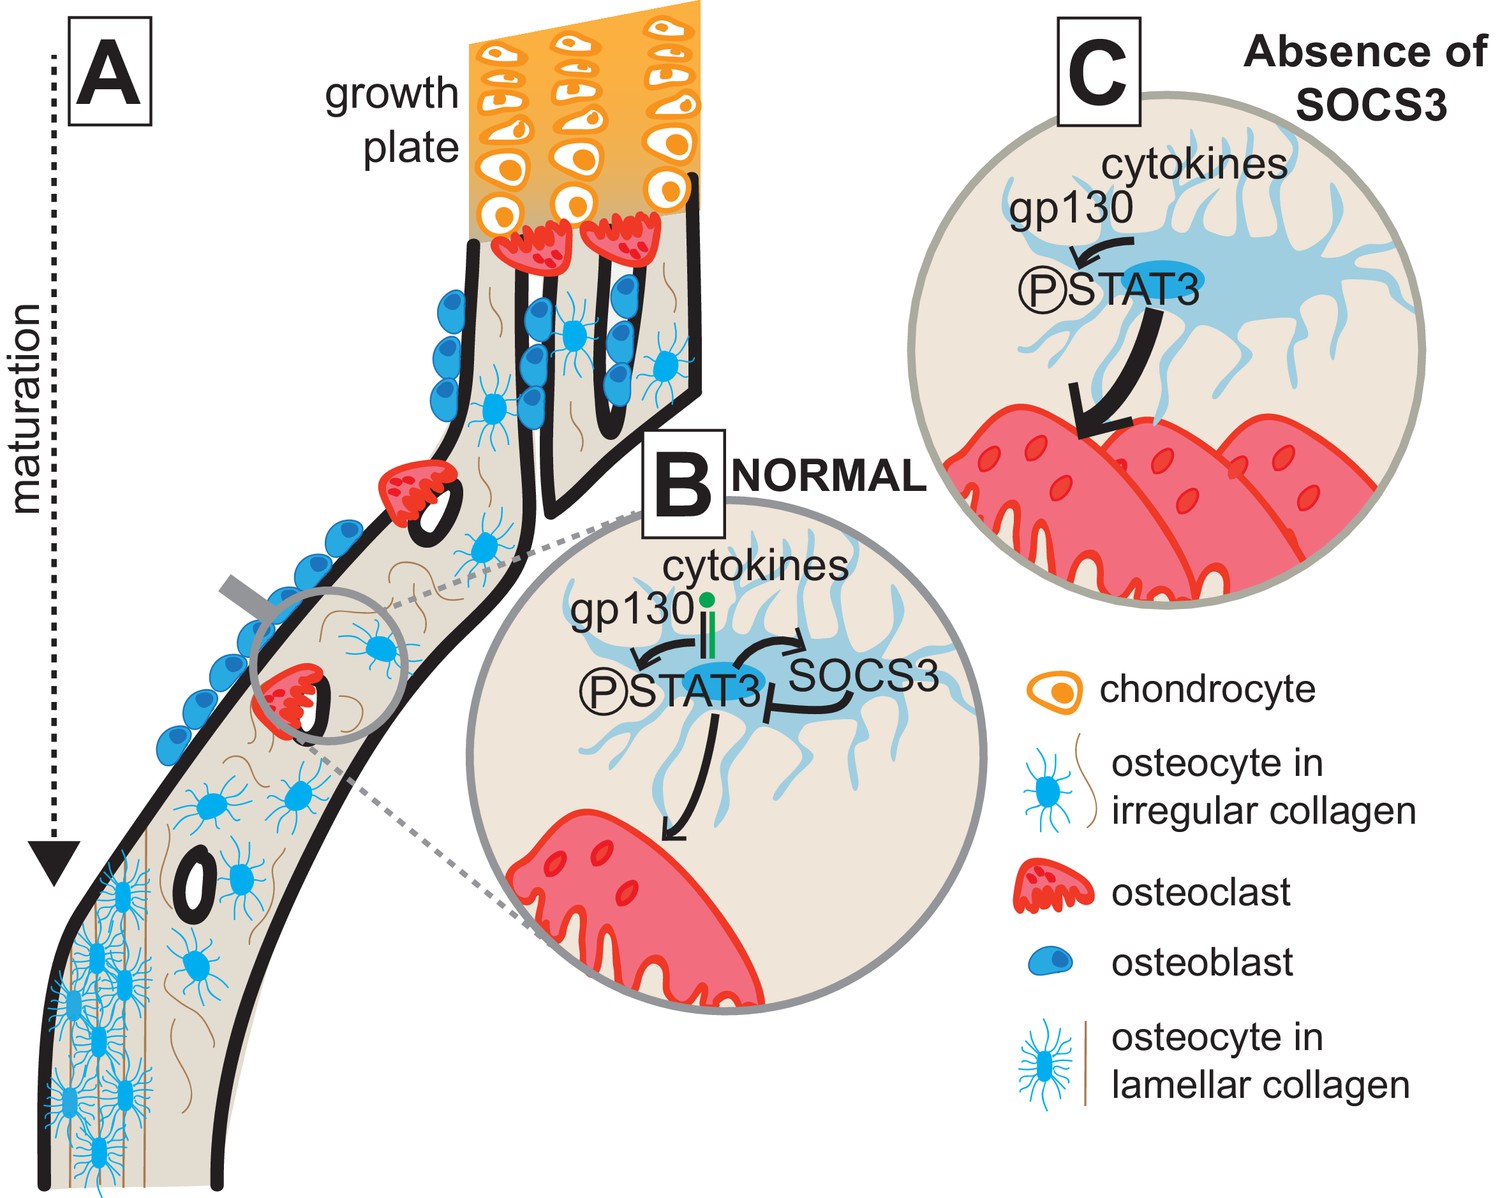
Model of cortical maturation and the role of SOCS3 in osteocytes.
(A) During longitudinal growth, trabeculae arising from remodelling of the growth plate consolidate, initially forming porous woven cortical bone with irregular oriented osteocytes with rounded cell bodies. This bone is subsequently remodelled to form less porous, more highly mineralized lamellar cortical bone, with flattened regularly-oriented osteocytes. (B) During normal cortical bone formation IL-6 family cytokines signal through gp130 in osteocytes, initiating STAT3 phosphorylation. This stimulates osteoclast formation within cortical pores and on the endocortical surface; the STAT3 signal and subsequent osteoclast formation is moderated by the SOCS3 negative feedback loop. (C) In the absence of SOCS3 in osteocytes, the unchecked STAT3 phosphorylation is prolonged, leading to increased osteoclast formation, and increased remodelling of the cortical bone, delaying the formation of the more highly mineralized lamellar structure.
Videos
Video 1
Video showing the sequence of metaphyseal images obtained by micro-CT in control (Dmp1Cre) mice from 12 to 15 weeks of age.
Pseudocolourisation reflects the same density scale shown in Figure 1.
Video 2
Video showing the sequence of metaphyseal images obtained by micro-CT in Dmp1Cre:Socs3f/f mice from 12 to 15 weeks of age.
Pseudocolourisation reflects the same density scale shown in Figure 1.
Tables
Table 1
Phenotypic data from 12 week old Dmp1Cre:Il6stf/f mice, including mRNA levels of the targeted gene in flushed femoral samples (Il6st:B2m), femoral trabecular and cortical structure (by micro-computed tomography) and tibial trabecular histomorphometry in the secondary spongiosa.
Data are mean ± SEM. *, p<0.05, **, p<0.01; ***, p<0.001 vs sex- and age-matched controls (Dmp1Cre) by two-way ANOVA with Šidák post-hoc test.
| Parameter | male | female | ||
|---|---|---|---|---|
| Dmp1Cre | Dmp1Cre:Il6stf/f | Dmp1Cre | Dmp1Cre:Il6stf/f | |
| Number of samples | 7 | 10 | 6 | 6 |
| IL6st:B2m (mRNA) | 1.14 ± 0.21 | 0.52 ± 0.08** | 0.88 ± 0.15 | 0.40 ± 0.18 |
| Trabecular bone volume (%) Trabecular number (/mm) Trabecular Thickness (μm) Trabecular Separation (μm) | 13.72 ± 1.26 2.54 ± 0.21 53.5 ± 0.8 217 ± 14.01 | 8.24 ± 0.96** 1.27 ± 0.12*** 64.1 ± 2.6*** 469 ± 26*** | 10.82 ± 1.06 2.38 ± 0.22 45.6 ± 1.0 239 ± 15 | 6.06 ± 0.51** 1.12 ± 0.08*** 54.0 ± 1.3*** 415 ± 29*** |
| Periosteal Perimeter (mm) Marrow Area (mm2) Moment of Inertia (mm4) | 7.21 ± 0.14 1.10 ± 0.04 0.395 ± 0.021 | 8.14 ± 0.25*** 1.37 ± 0.08*** 0.566 ± 0.51*** | 6.78 ± 0.13 0.94 ± 0.04 0.344 ± 0.02 | 7.29 ± 0.10* 1.11 ± 0.02* 0.404 ± 0.009 |
| Bone Formation Rate/Bone Surface (%) Double labelled Surface/Bone Surface (%) Mineral Appositional Rate (μm/day) Osteoclast Surface/Bone Surface (%) | 0.454 ± 0.019 29.1 ± 1.8 1.30 ± 0.08 4.39 ± 0.58 | 0.295 ± 0.048** 20.1 ± 2.8** 1.10 ± 0.14 6.59 ± 0.89 | 0.704 ± 0.03 26.6 ± 1.5 1.98 ± 0.24 3.61 ± 0.45 | 0.481 ± 0.065* 15.1 ± 1.8** 1.63 ± 0.19 4.82 ± 0.83 |
Table 2
mRNA analysis of osteoclast-related genes in flushed femora from 12 week old Dmp1Cre:Socs3f/f and Dmp1Cre:Socs3f/f: Il6stf/f.
Data are mean ± SEM normalised to the geometric mean of B2m and Hprt1; p values from two-way ANOVA analysis are shown in the right column, including p values for the comparison of male vs female, Dmp1Cre:Socs3f/f and Dmp1Cre:Socs3f/f:Il6stf/f (genotype) and the interaction between the two. No statistical differences between genotypes were detected by Šidák post-hoc test within each sex.
| Parameter | male | female | p values | ||
|---|---|---|---|---|---|
| Dmp1Cre:Socs3f/f | Dmp1Cre:Socs3f/f:Il6stf/f | Dmp1Cre:Socs3f/f | Dmp1Cre:Socs3f/f:Il6stf/f | ||
| Number of samples | 10 | 8 | 10 | 8 | |
| Tnfsf11 (RANKL) Tnfrsf11b (OPG) Acp5 (TRAP) | 0.015 ± 0.002 0.067 ± 0.014 3.64 ± 0.36 | 0.016 ± 0.004 0.097 ± 0.017 1.94 ± 0.26 | 0.015 ± 0.003 0.026 ± 0.004 10.25 ± 1.45 | 0.015 ± 0.003 0.044 ± 0.009 7.41 ± 1.12 | Male vs female: 0.752; Genotype: 0.841; Interaction: 0.923. Male vs female: 0.0003; Genotype: 0.048; Interaction: 0.635. Male vs female:<0.0001; Genotype: 0.028; Interaction: 0.568. |
Table 3
Results of three point bending tests of femora from male and female 12 week old Dmp1Cre:Socs3f/f and Dmp1Cre:Socs3f/f:Il6stf/f mice.
Data is mean ± SEM. *, p<0.05; **, p<0.01 vs Dmp1Cre:Socs3f/f by two-way ANOVA with Šidák post-hoc test.
| Parameter | male | female | ||
|---|---|---|---|---|
| Dmp1Cre:Socs3f/f | Dmp1Cre:Socs3f/f:Il6stf/f | Dmp1Cre:Socs3f/f | Dmp1Cre:Socs3f/f:Il6stf/f | |
| Number of samples | 9 | 11 | 10 | 9 |
| Ultimate Force (N) Ultimate Deformation (mm) Yield Force (N) Yield Deformation (mm) Post-Yield Deformation (mm) Energy to Failure (mJ) Ultimate Stress (MPa) Ultimate Strain (%) Yield Stress (MPa) Yield Strain (%) Post-Yield Strain (%) | 16.48 ± 0.69 0.304 ± 0.025 15.44 ± 1.75 0.240 ± 0.022 0.063 ± 0.018 2.61 ± 0.31 47.30 ± 4.69 0.033 ± 0.003 41.65 ± 5.20 0.026 ± 0.003 0.007 ± 0.002 | 15.31 ± 0.60 0.330 ± 0.02 11.29 ± 0.70** 0.212 ± 0.022 0.126 ± 0.019* 2.94 ± 0.25 39.67 ± 1.72 0.036 ± 0.003 28.97 ± 1.46* 0.023 ± 0.003 0.014 ± 0.002* | 13.40 ± 0.25 0.350 ± 0.029 11.03 ± 0.58 0.282 ± 0.024 0.068 ± 0.013 2.34 ± 0.16 63.96 ± 2.39 0.034 ± 0.003 52.46 ± 3.02 0.028 ± 0.002 0.007 ± 0.001 | 13.79 ± 0.59 0.350 ± 0.019 10.19 ± 0.69 0.219 ± 0.026 0.152 ± 0.020** 2.99 ± 0.19* 54.29 ± 2.33 0.037 ± 0.002 40.42 ± 3.44 0.023 ± 0.003 0.016 ± 0.002** |
Key resources table
| Reagent type (species) or resource | Designation | Source or reference | Identifiers | Additional information |
|---|---|---|---|---|
| Strain, strain background (Mus musculus) | Dmp1Cre | Lynda Bonewald (Indiana University, USA) | Tg(Dmp1-cre)1Jqfe | C57BL/6 background |
| Strain, strain background (Mus musculus) | Socs3tm1Wsa | Warren Alexander (Walter and Eliza Hal Institute) | Socs3tm1Wsa | C57BL/6 background |
| Strain, strain background (Mus musculus) | Il6st-flox mouse strain | NCRR-NIH-supported KOMP Repository | IL6sttm1a(KOMP)Mbp | C57BL/6 background |
| Antibody | phospho-STAT3 (Rabbit polyclonal) | Cell Signalling | Cat #9131 RRID:AB_331586 | IHC (1:100), WB (1:400) |
| Antibody | STAT3 (mouse monoclonal) | Cell Signalling | Cat#9139 RRID:AB_331757 | WB (1:400) |
| Antibody | Goat anti-Mouse | Dako | Cat#P0447 RRID:AB_2617137 | WB (1:1500) |
| Antibody | Swine anti-Rabbit | Dako | Cat#P0217 RRID:AB_2728719 | IHC (1:250) WB (1:2000) |
| Peptide, recombinant protein | Murine oncostatin M | R and D Systems | Cat#495-MO-025 | |
| Peptide, recombinant protein | human IL-11 | R and D Systems | Cat#218-IL-025 | |
| Peptide, recombinant protein | murine LIF | Merck Millipore | #LIF2010 | |
| Peptide, recombinant protein | Murine Leptin | R and D Systems | #498-OB-01M | |
| Peptide, recombinant protein | murine G-CSF | R and D Systems | #414-CS-005 |
Additional files
Download links
A two-part list of links to download the article, or parts of the article, in various formats.
Downloads (link to download the article as PDF)
Open citations (links to open the citations from this article in various online reference manager services)
Cite this article (links to download the citations from this article in formats compatible with various reference manager tools)
Cortical bone maturation in mice requires SOCS3 suppression of gp130/STAT3 signalling in osteocytes
eLife 9:e56666.
https://doi.org/10.7554/eLife.56666


