The caudate nucleus contributes causally to decisions that balance reward and uncertain visual information
- Department of Neuroscience, University of Pennsylvania, United States
- Department of Psychology, University of Pennsylvania, United States
- Neuroscience Graduate Group, University of Pennsylvania, United States
Figures
Figure 1
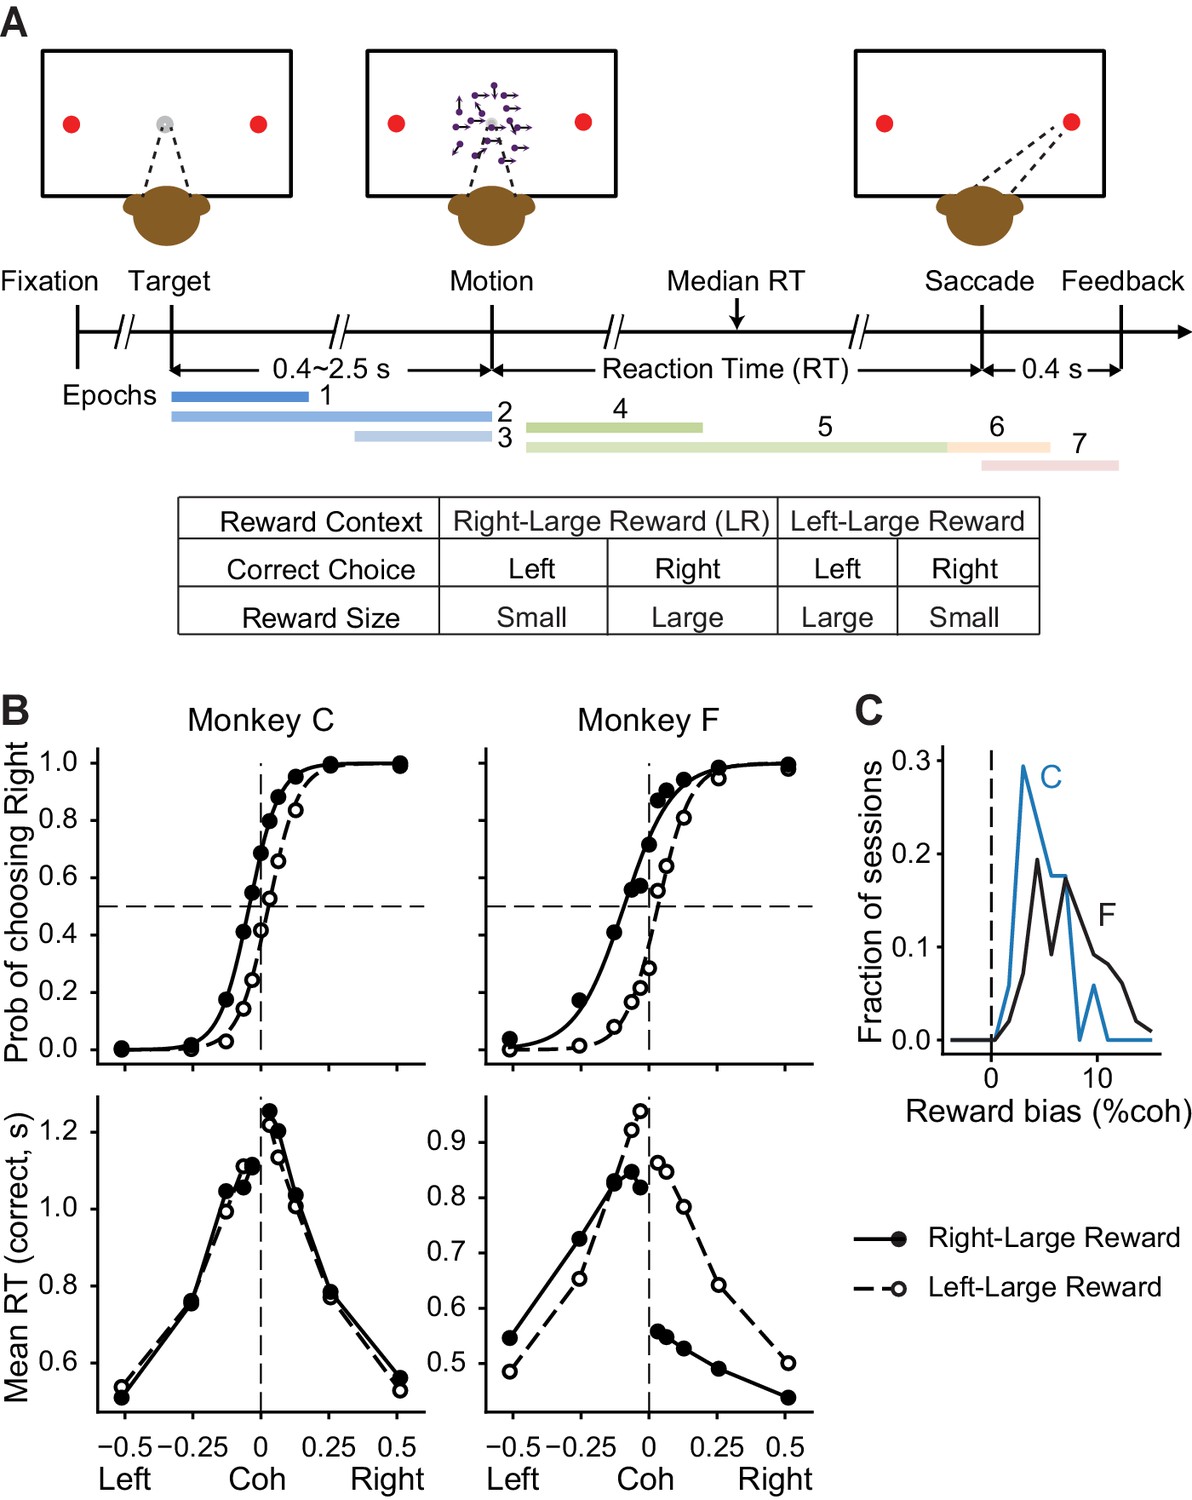
Monkeys biased toward choices associated with large reward.
(A) Task design and timeline. Monkeys reported the perceived motion direction with saccades to one of the two choice targets. The motion stimulus was turned off upon detection of saccade. Correct trials were rewarded based on the reward context. Error trials were not rewarded. The color bars in the timeline indicate epoch definitions for the regression analysis of neural firing rates in Equation 1. (B) Average choice (top) and RT (bottom) behavior of two monkeys (n = 17,493 trials from 38 sessions for monkey C, 29,599 trials from 79 sessions for monkey F). Filled and open circles: data from the two reward contexts. Lines in top row: logistic fits. (C) Histograms of reward bias (half of the horizontal shift between the two reward contexts estimated from logistic fits) for the two monkeys. Positive values indicate biases toward the large-reward choice.
Figure 2 with 2 supplements
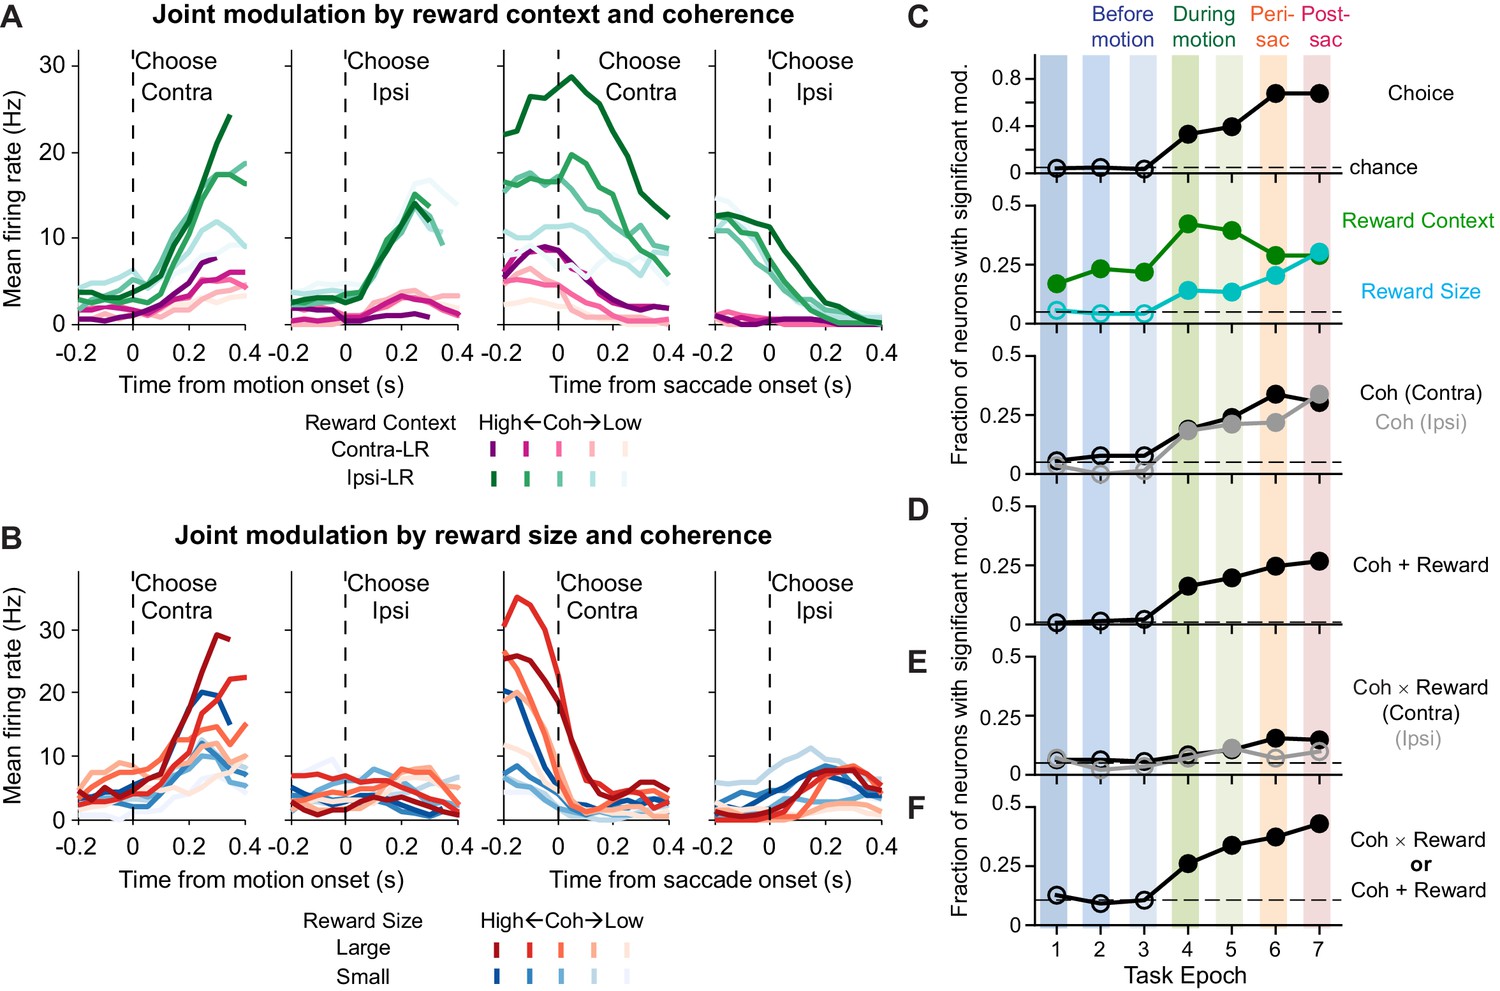
Caudate activity reflected motion strength, reward context, choice, and the expected reward size associated with the choice.
(A, B) Activity of two example neurons. Shades: coherence levels. Colors: reward context (A) and reward size (B). Firing rates were computed using a 200 ms running window (50 ms steps). Only correct trials were included. (C-F) Fractions of neurons showing significant coefficients for task-related regressors in the seven task epochs defined in Figure 1A (see Equation 1 for the formulation of the regression). Horizontal dashed lines: chance levels, adjusted based on the number of tests used and a 5% chance level for a single test. Filled circles: fractions that were significantly above chance levels (Chi-square test, p<0.05/63 (seven epochs and nine comparisons)). Coh: activity with non-zero coefficients for unsigned coherence values. Coh × Reward: activity with non-zero coefficients for the coherence × reward size interaction. Coh + Reward: activity with non-zero coefficients for coherence on trials with either choice and non-zero coefficients for either reward context or reward size.
-
Figure 2—source data 1
Regression results for Figure 2C–F, using Equation 1.
- https://cdn.elifesciences.org/articles/56694/elife-56694-fig2-data1-v1.csv
Figure 2—figure supplement 1
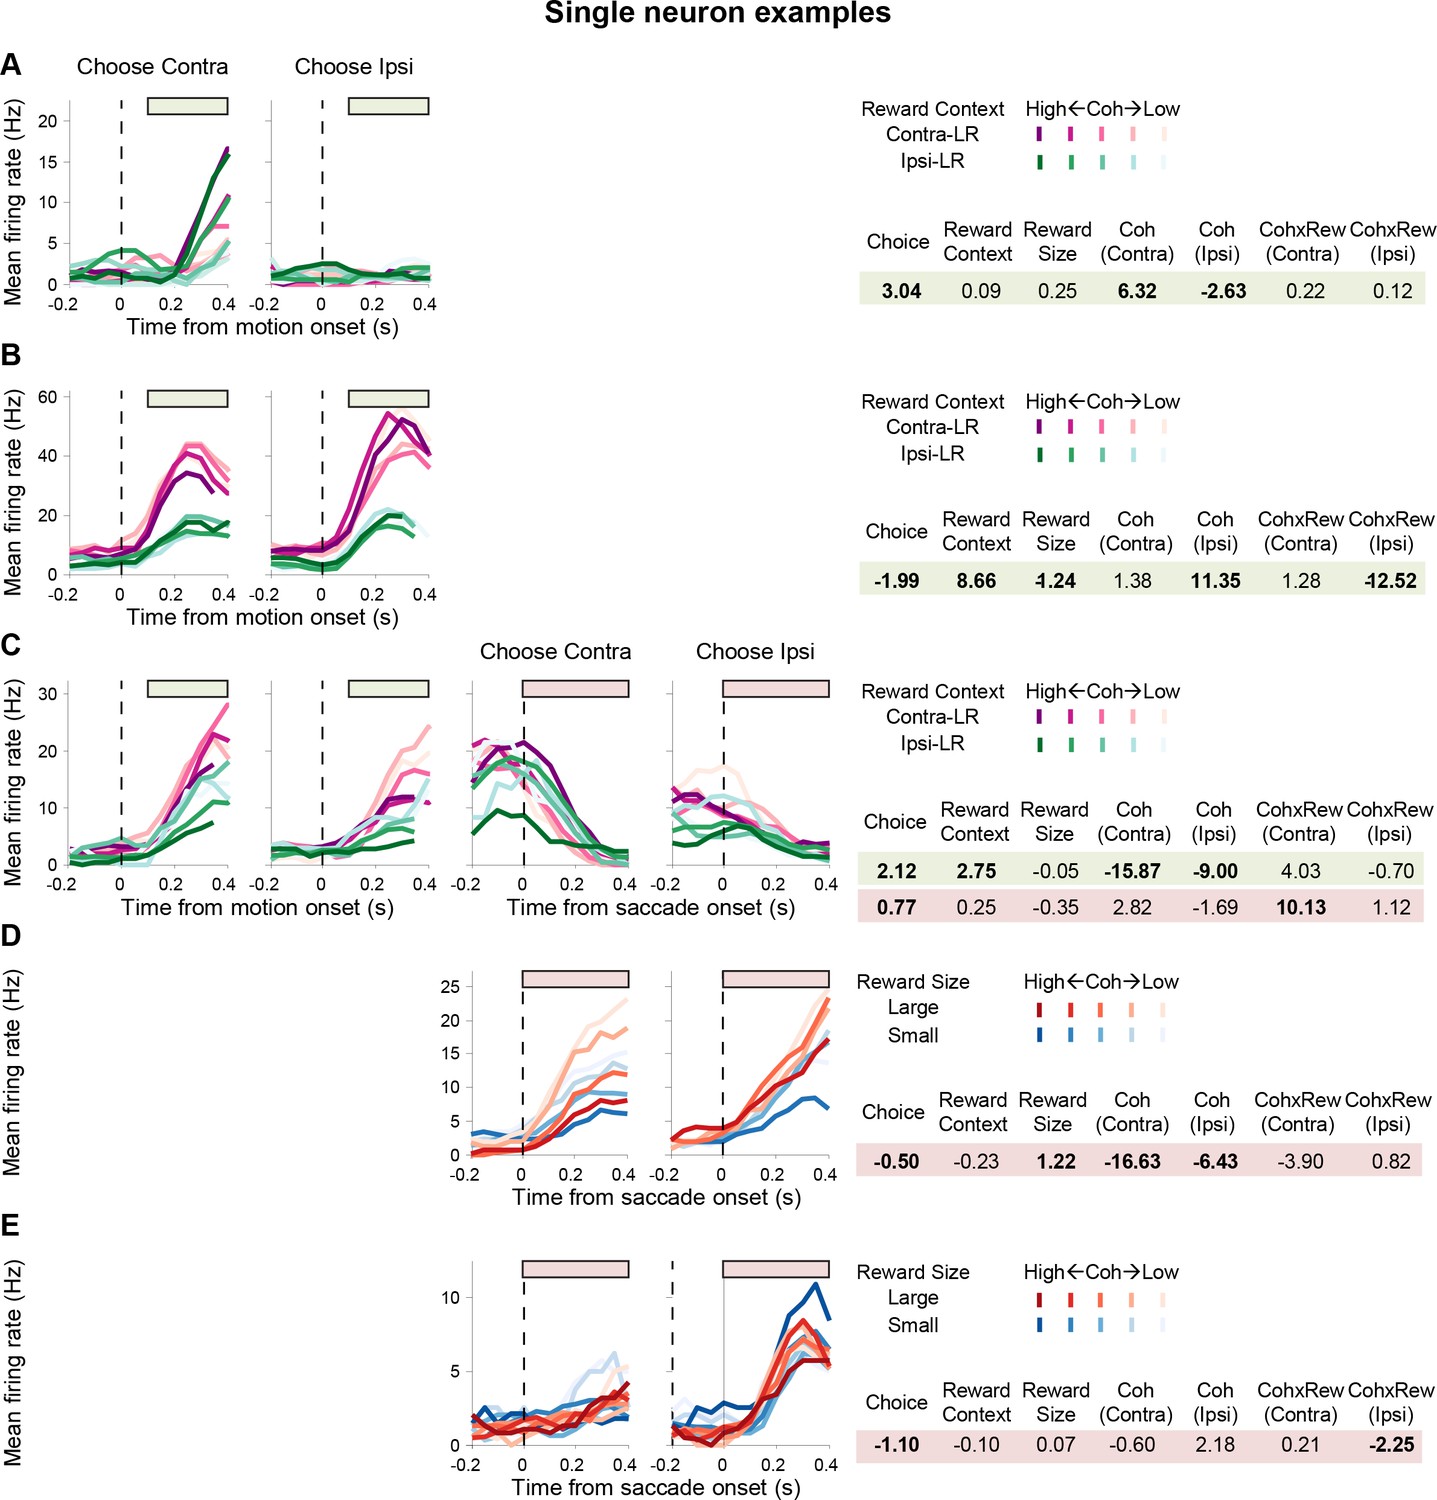
Example neurons with different kinds of task-relevant modulations.
Same format as Figure 2A and B. Note that colors indicate reward contexts in (A-C) and reward size in (D-E). Bars above the curves indicate the epochs used for regression analysis. Regression coefficients for each epoch are shown on the right. Bold: t-test, p<0.05. (A) A neuron with activity modulated by choice and coherence, but not reward-related quantities, during motion viewing. (B) A neuron with activity modulated by choice, reward context, expected reward size, coherence, and coherence-reward size interaction for trials with ipsilateral choices. (C) A neuron with different modulation patterns for activity during and after motion viewing. (D) A neuron with post-decision activity modulated by choice, expected reward size, and coherence. (E) A neuron with post-decision activity modulated by choice and coherence-reward size interaction for trials with ipsilateral choices.
Figure 2—figure supplement 2

Modulation patterns of “combination neurons” during motion viewing.
Color map showing the presence of significant non-zero regression coefficients for each combination neuron during Epoch 5 in Figure 1A (from 100 ms after motion onset until 100 ms before saccade onset). Only correct trials were included for regression analysis. Yellow: positive; dark blue: negative; green: not significant; criterion: p=0.05. Neurons were sorted by the signs of the coefficients.
Figure 3 with 2 supplements
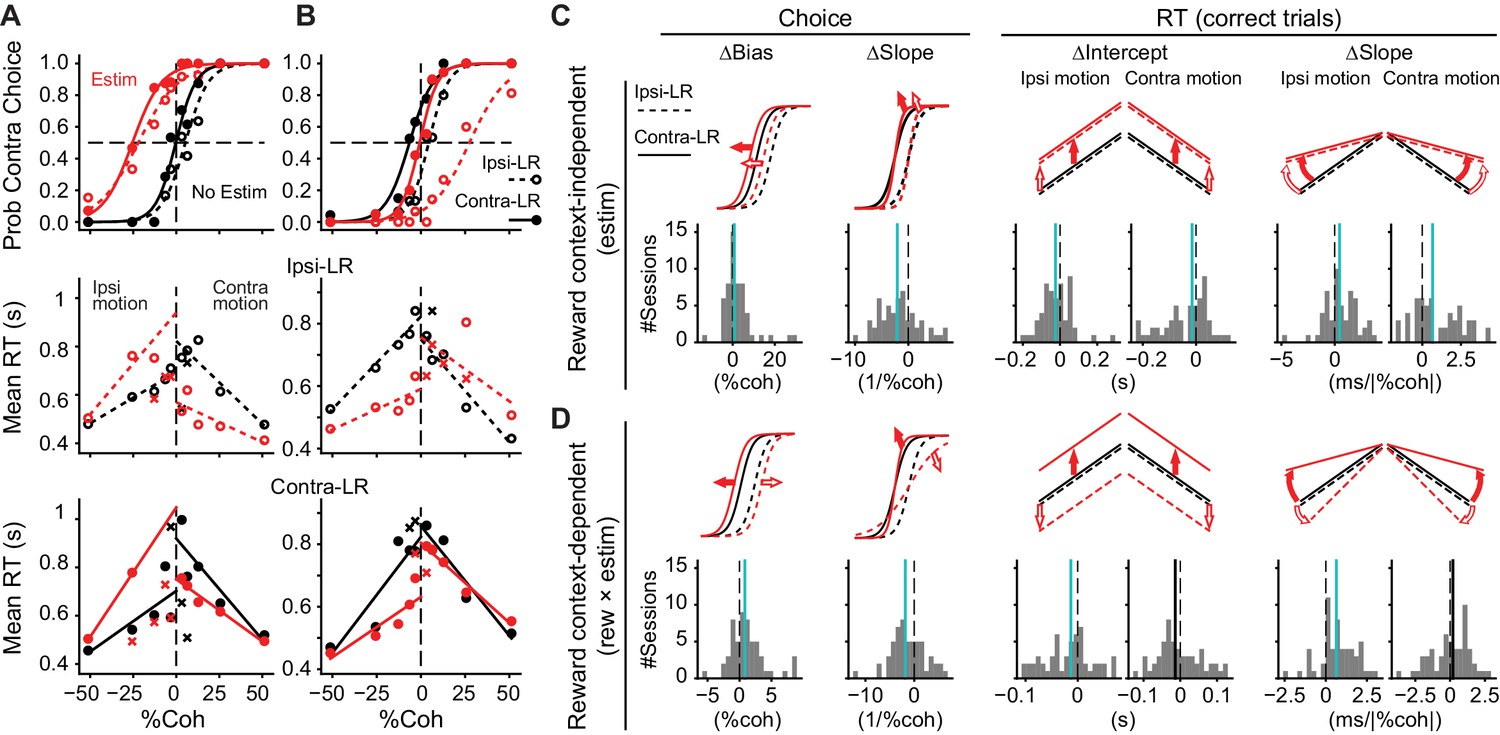
Caudate microstimulation affected the monkeys’ decision behavior.
(A, B) Two example sessions from monkey C showing different patterns of microstimulation effects. Black: trials without microstimulation; red: trials with microstimulation. Open circles and dashed lines: data and fits for blocks in which the ipsilateral choice was paired with large reward and the contralateral choice was paired with small reward. Filled circles and solid lines: data and fits for blocks in which the ipsilateral choice was paired with small reward and the contralateral choice was paired with large reward. Abscissa: signed coherence (positive: motion was toward the contralateral target; negative: motion was toward the ipsilateral target). Top panels: probability of making the contralateral choice. Lines are logistic fits to the choice data. Middle and bottom panels: mean reaction time (RT) for the two reward contexts. Circles and crosses represent correct and error choices, respectively. Lines: linear fits to single-trial RT data. (C, D) Summary of effects induced by microstimulation for both reward contexts (C, estim terms) and by interactions between microstimulation and reward context (D, rew × estim terms). The top rows illustrate the effects on psychometric and chronometric curves for positive values of the corresponding terms. Bottom rows show the histograms of changes in choice bias (logistic shift in %coh), perceptual sensitivity (logistic slope in 1/%coh), and intercept and slope of linear regression of RT as a function of unsigned motion coherence. Thick vertical lines indicate the median values. Green lines, Wilcoxon signed-rank test, p<0.05.
Figure 3—figure supplement 1

Effects of caudate microstimulation for all sessions.
(A) Scatter plots for microstimulation-induced effects for the Ipsi-LR blocks (x-axis) and Contra-LR blocks (y-axis). A1, choice bias (logistic shift in %coh, positive: biasing toward the contralateral choice). A2: perceptual sensitivity (logistic slope in 1/%coh, positive: increasing sensitivity). A3 and A4: intercept (ms, A3) and slope (ms/|%coh|, A4) of linear fits to RT for contralateral saccades. A5 and A6: corresponding values for ipsilateral saccades. Magenta circles: sessions with significant effects for monkey C. Green circles: sessions with significant effects for monkey F. Labels (a, b) correspond to the example sessions in Figure 3A and B, respectively. Lines with triangles on the histograms: median values. Green lines, Wilcoxon signed-rank test, p<0.05. (B) Scatter plots for microstimulation-induced effects that were reward context-independent ("estim", x-axis) and -dependent ("rew × estim", y-axis). Red circles: sessions in which both “estim” and “rew × estim” measurements from the original data were outside the 95% confidence intervals of measurements from shuffled data (the designations of trials with and without microstimulation were shuffled for each session 200 times). Green circles: only one measurement was outside the confidence intervals. The values correspond to illustrations in Figure 3C and D. The histograms are the same as those in Figure 3C and D. Labels (a, b) correspond to the example sessions in Figure 3A and B, respectively. Lines with triangles on the histograms: median values. Green lines, Wilcoxon signed-rank test, p<0.05.
-
Figure 3—source data 1
Fitting results for choice (logistic) and RT (linear) data.
The same data were used to plot Figure 3—figure supplement 1 and generate summary statistics in Supplementary file 1a.
- https://cdn.elifesciences.org/articles/56694/elife-56694-fig1-v1.csv
Figure 3—figure supplement 2
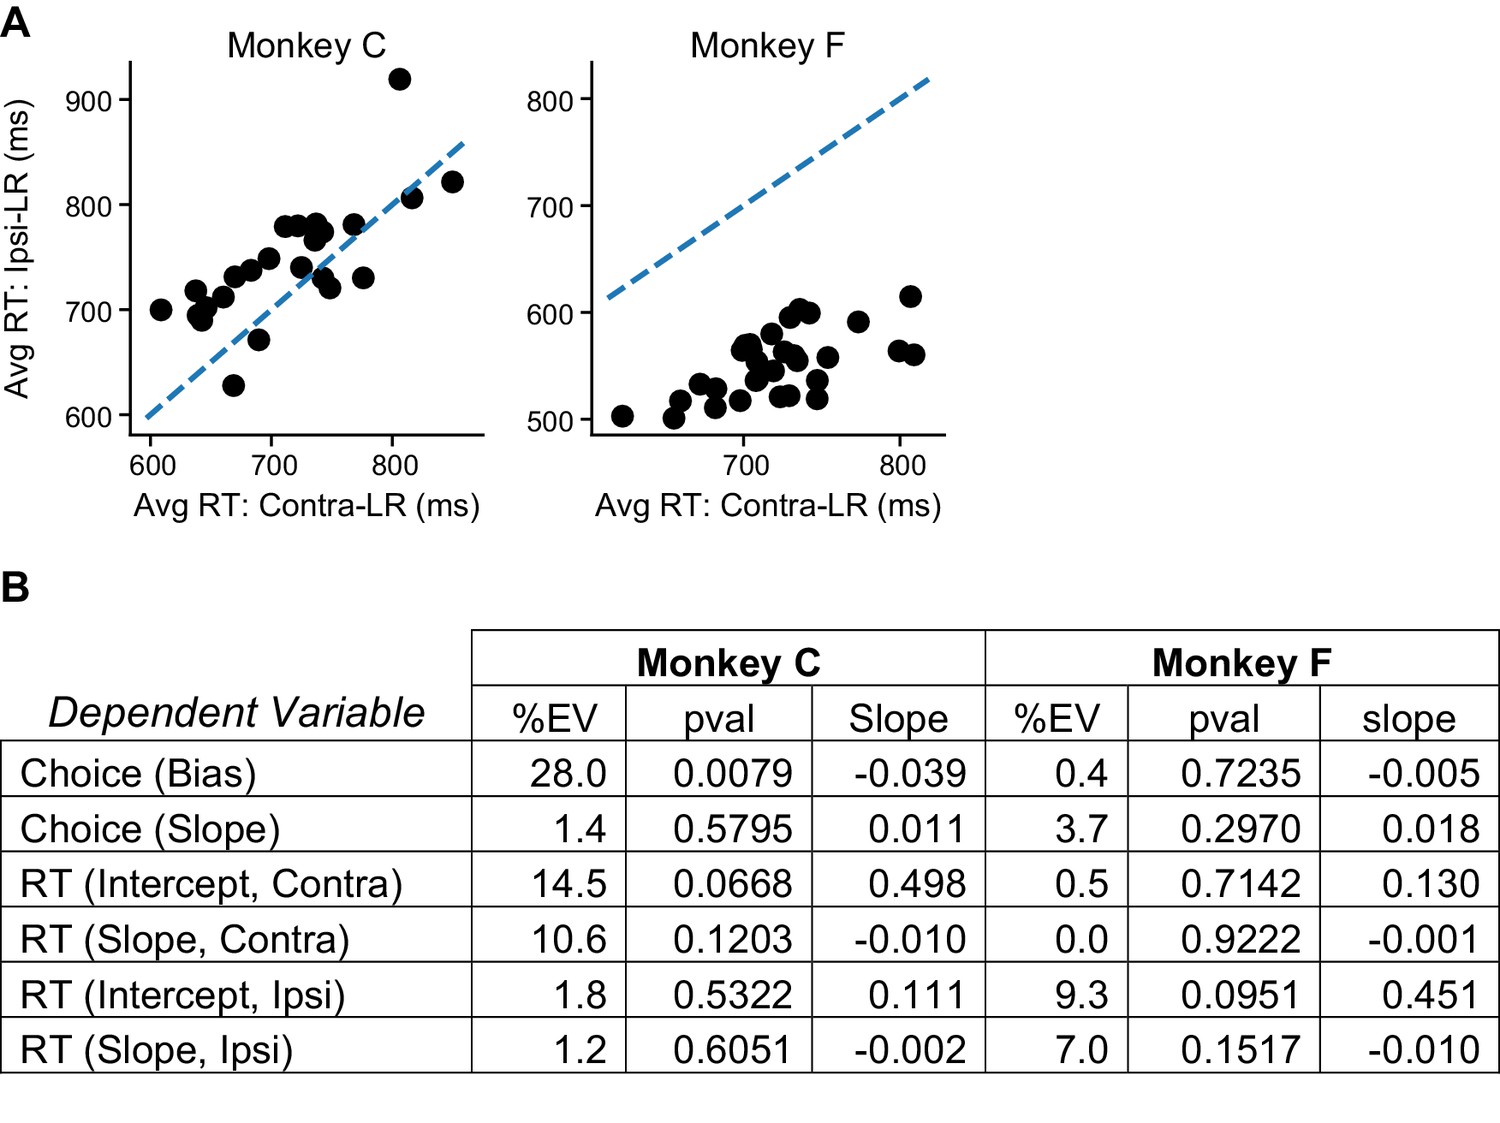
The average RT difference between the two reward contexts alone could not account for the reward context-dependent microstimulation effects.
(A) The average RT was longer for Ipsi-LR and Contra-LR blocks for the two monkeys, respectively (Wilcoxon signed rank test, p=0.002 and <0.0001). Data were from trials without stimulation. Dashed line: unity slope. Each circle represents one session. (B) Results of linear regressions using the difference in average RT between reward context as the independent variable and the rew × estim effects in Figure 3D as the dependent variables. %EV: percentage of variance explained by the difference in RT. Note the low %EV values for most regressions.
Figure 4

Illustration of correlation patterns induced by different hypothesized actions of microstimulation.
(A) Drift-diffusion model. Motion evidence (E) is modeled as samples from a Gaussian distribution (mean = signed coherence, variance = 1). The decision variable is computed as the time integral of E and compared at each time point to two (possibly time-varying) decision bounds. Crossing of either bound results in the corresponding choice. RT is modeled as the sum of the time to bound crossing and a non-decision time. Bias can be induced with offsets in evidence (me, biasing the drift rate) or relative bound heights (z, biasing bounds). (B) For the simulations in (C-F), reward context-dependent modulation of drift and bound on trials without microstimulation (i.e. Δdrift (rew) and Δbound (rew)) were negatively correlated across sessions. Each colored circle represents a session. (C and D) Microstimulation induces independent changes in baseline drift0 and bound0 values (C) or independent changes in Δdrift (rew) and Δbound (rew) (D). Note the absence of negative correlation in the rew × estim effects. (E) Microstimulation additively affected reward context-dependent adjustments in drift and bound in a coordinated manner. The dashed line represents a significant correlation. (F) Microstimulation additively and multiplicatively affected reward context-dependent adjustments in drift and bound in a coordinated manner. Note that the rew × estim effects were negatively correlated between drift and bound (dashed line). The rew × estim effects were negatively correlated with the reward effects without microstimulation in F (compare the orders of color progression to that in B), but not (C-E). See Materials and methods for simulation parameters.
Figure 5 with 4 supplements
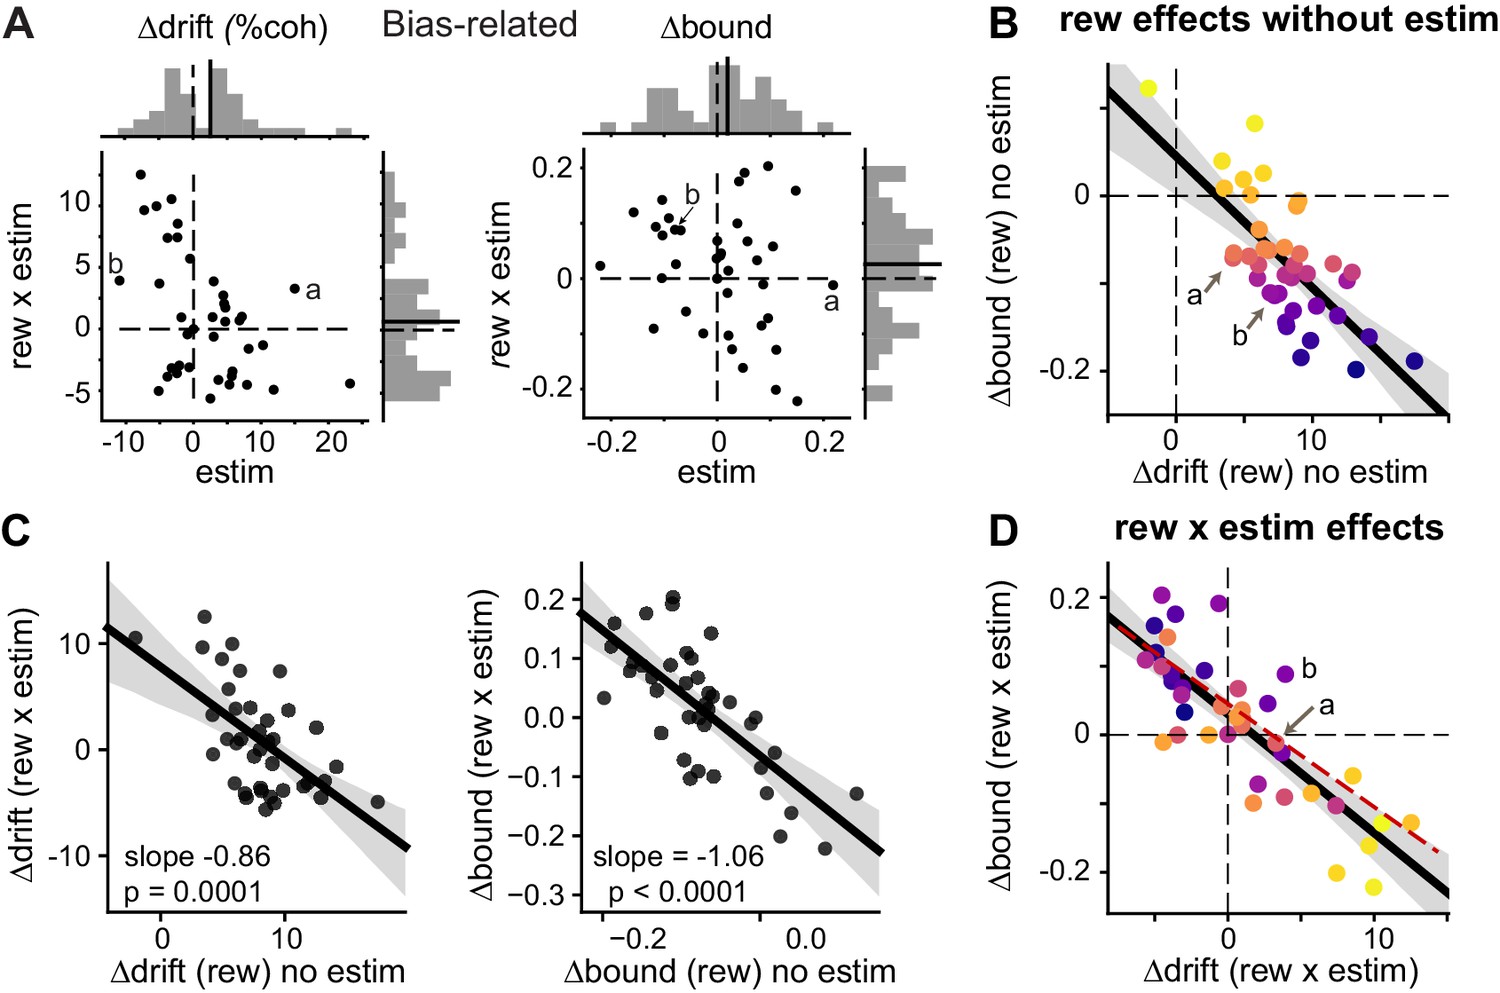
Microstimulation induced correlated changes in the reward modulation of drift and bound.
(A) Scatter plots of changes in drift and bound induced by electrical microstimulation (abscissa and top histograms) and by interactions between electrical microstimulation and reward condition (ordinate and right histograms). Solid lines in histograms: mean values across sessions, t-test, p>0.05. Labels (a, b) correspond to the example sessions in Figure 3A and B, respectively. (B) On trials without microstimulation, the differences in Δdrift and Δbound between the two reward contexts were negatively correlated. Line and shaded area: linear regression and 95% confidence interval, t-test, p<0.0001. “a” and “b” indicate the data points for the examples in Figure 3A and B. Data are color-coded by the values of Δbound (rew) no estim. (C) Scatter plots of reward effects on trials without microstimulation (abscissa) and interaction effects (ordinate) for Δdrift (left) and Δbound (right). Lines represent results of linear regression (shaded area: 95% confidence interval). (D) The interaction effects (Δdrift (rew x estim) and Δbound (rew x estim)), equivalent to the difference between “Δdrift/bound (rew) with estim” and “Δdrift/bound (rew) no estim”, were negatively correlated. Same format as B. t-test, p<0.0001. Red dashed line re-plots the linear regression results from Figure 5B, using the appropriate range of Δdrift (rew x estim) as x-values. Data are color-coded by the values of Δbound (rew) no estim. Note that the roughly reversed orders of color progressions in B and D is most consistent with simulated effects in Figure 4F.
-
Figure 5—source data 1
Fitting results for choice and RT data using the DDM for sessions with significant microstimulation effects.
The same data were used for plots in Figure 5—figure supplement 2, Figure 5—figure supplement 4, Figure 6A and E, Figure 6—figure supplement 3, and for the summary statistics in Supplementary file 1b.
- https://cdn.elifesciences.org/articles/56694/elife-56694-fig5-data1-v1.csv
Figure 5—figure supplement 1
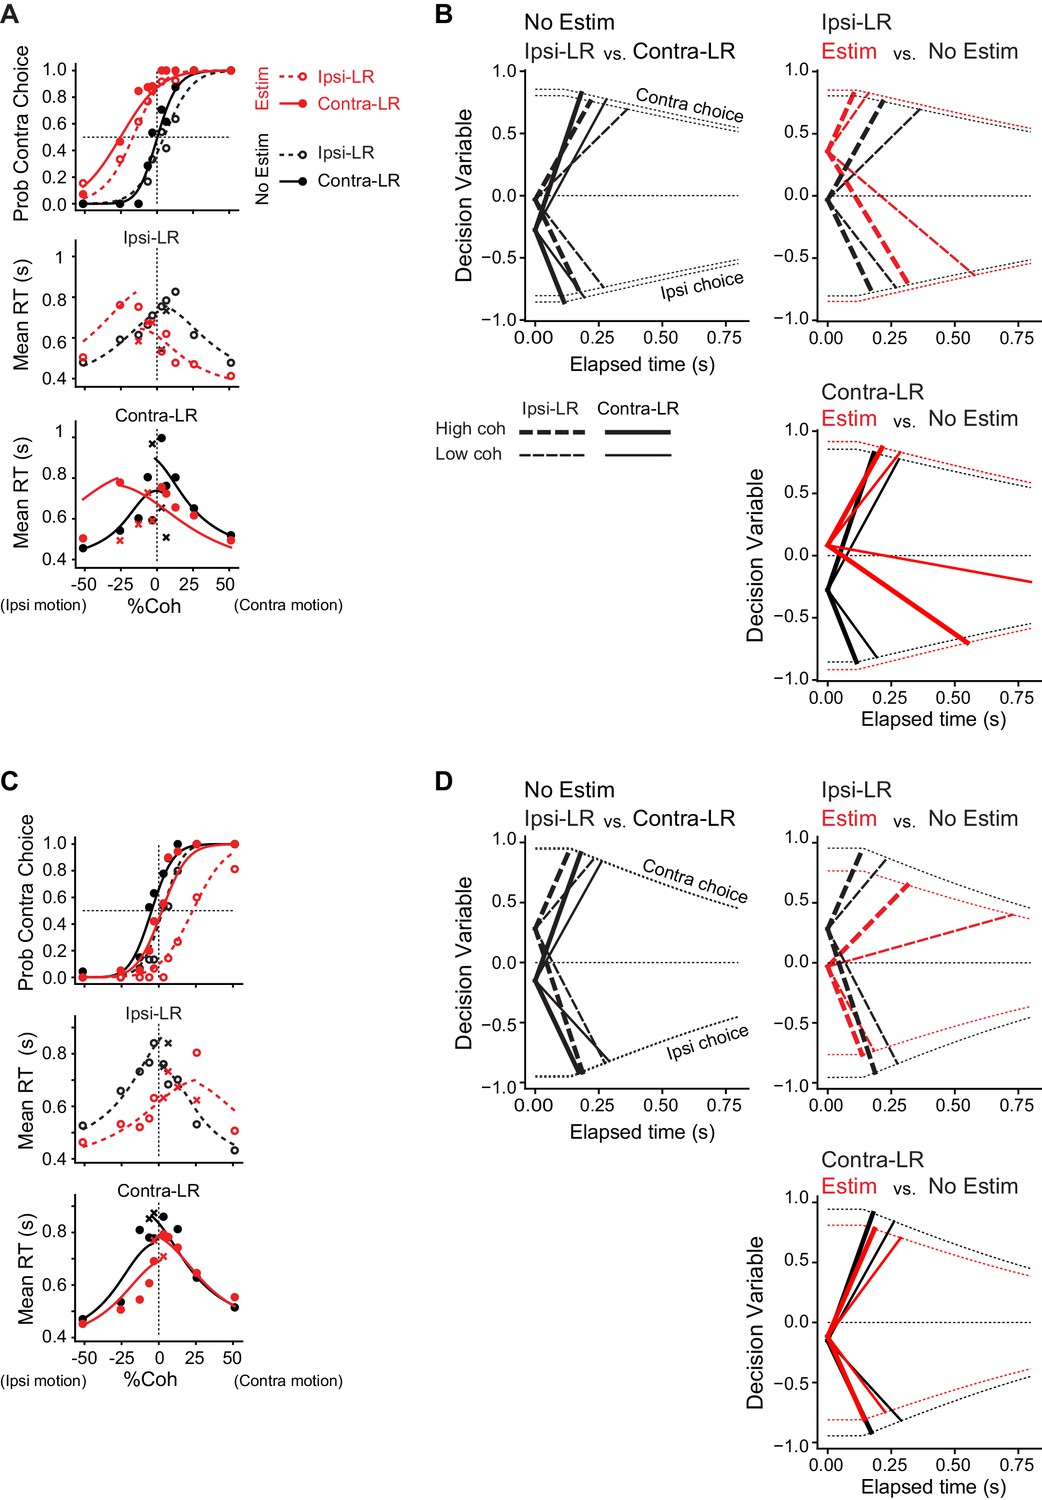
DDM fits to example sessions in Figure 3.
(A) DDM fit for the example session in Figure 3A. Lines are DDM fits to both choice and single-trial RT data (circles, correct trials; crosses, error trials). Same format as Figure 3A. (B) Illustration of average timecourses of decision variable, using the fitted DDM parameters. Thick and thin lines represent high and low coherence levels, respectively. Same line colors and types as in A. Dotted lines indicate collapsing bounds. (C, D) DDM fit for the example session in Figure 3B. Same format as A,B.
Figure 5—figure supplement 2
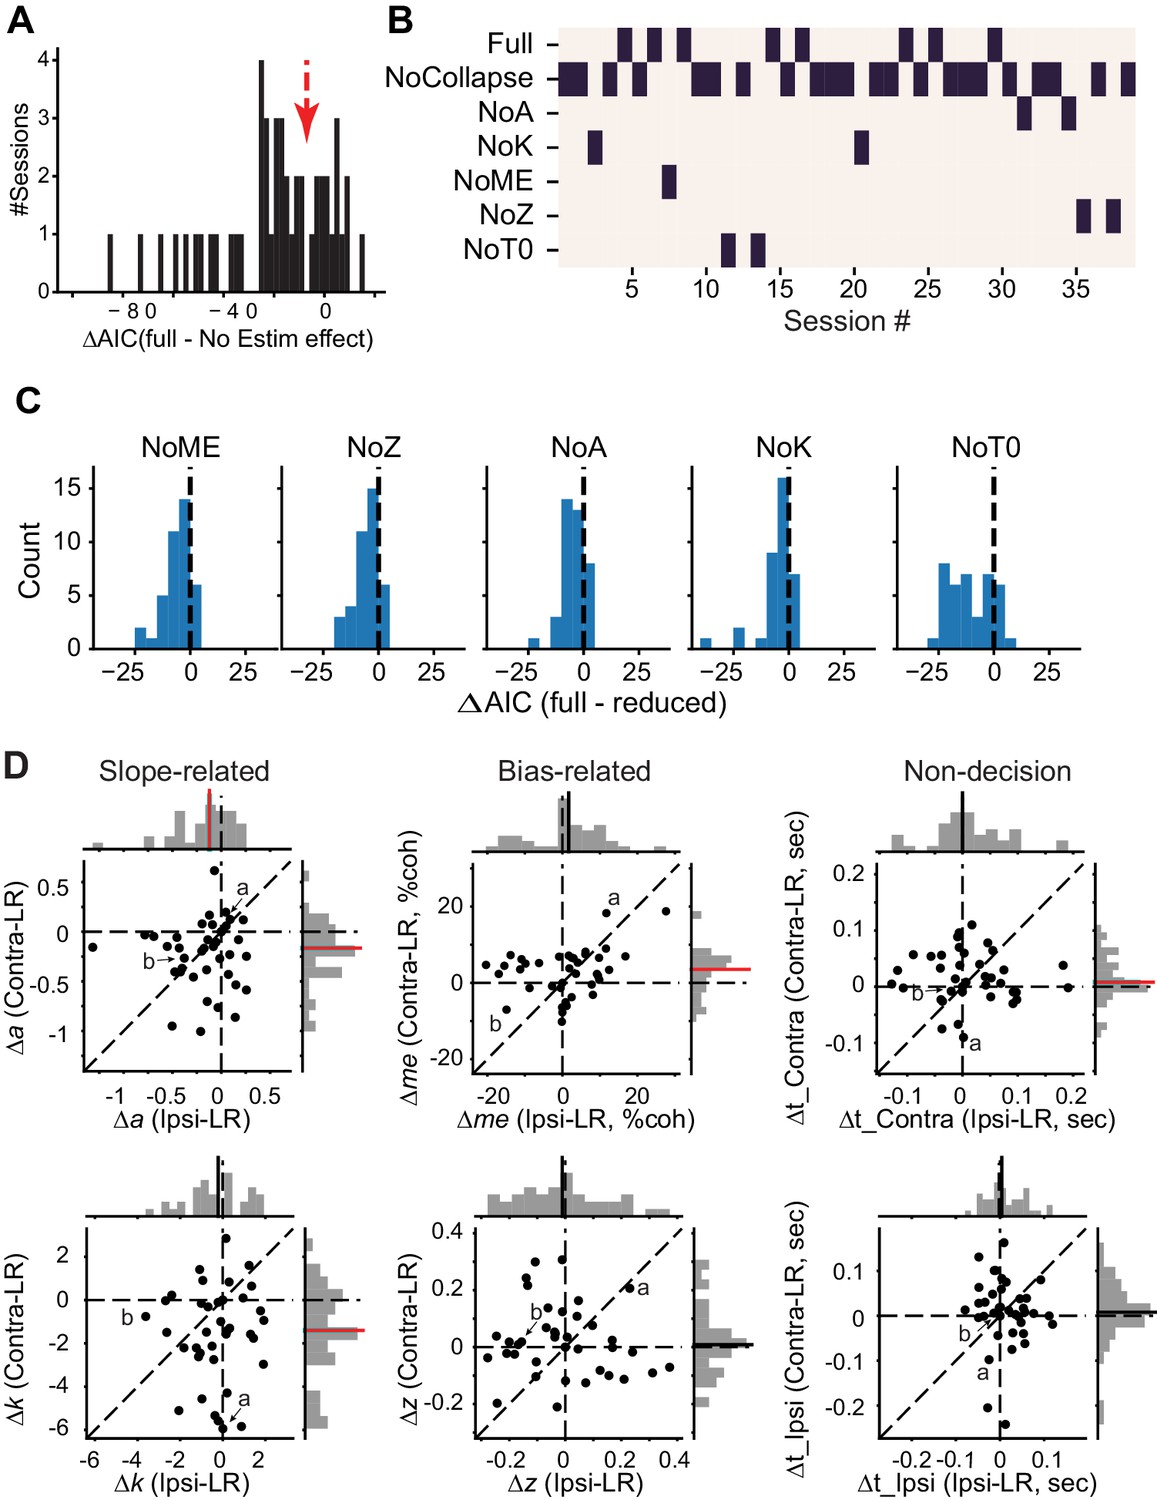
DDM fitting results.
(A) Histogram of the difference in AIC between the full model, in which all DDM parameters were allowed to vary by reward context and microstimulation status, and a reduced model, in which all DDM parameters were allowed to vary by reward context but not microstimulation status. Negative ΔAIC implies that the full model is better. The red arrow indicates the criterion we used and corresponds to the gap in the histogram. (B) Map showing the best DDM variant (lowest AIC, black bar) for sessions with significant microstimulation effects (n = 39 sessions to the left of the red arrow in A). In the reduced models, parameters associated with collapsing bounds (β_alpha and β_d, “NoCollapse”), total bound height (a, “NoA”), drift rate scalor (k, “NoK”), bias in drift rate (me, “NoME”), relative bound height (z, “NoZ”), and non-decision times (t_contra and t_ipsi, “NoT0”) were allowed to vary based on reward context, but not microstimulation status. (C) Histograms of differences in AIC between the full model and reduced models for the 39 sessions to the left of the red arrow in A. Mean ΔAIC values were negative for reduced models (t-test, p<0.001 for all). (D) Scatter plots of changes in DDM parameters induced by electrical microstimulation in the Ipsi-LR blocks (abscissa and top histograms) or in the Contra-LR blocks (ordinate and right histograms). Solid lines in histograms: mean values across sessions. Red lines, t-test p<0.05. Labels (a, b) correspond to the example sessions in Figure 3A and B, respectively.
Figure 5—figure supplement 3
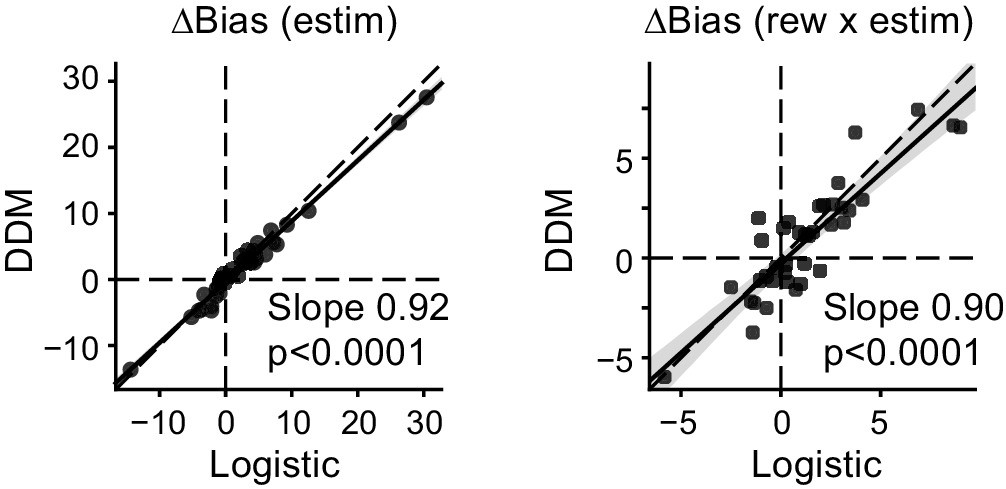
Biases in drift and bounds together accounted for biases measured in logistic fits.
Scatter plots of microstimulation effects on choice bias, measured with logistic fit (abscissa) and DDM fits (ordinate). Bias values for the DDM were simulated using fitted parameters. Lines: linear regression.
Figure 5—figure supplement 4
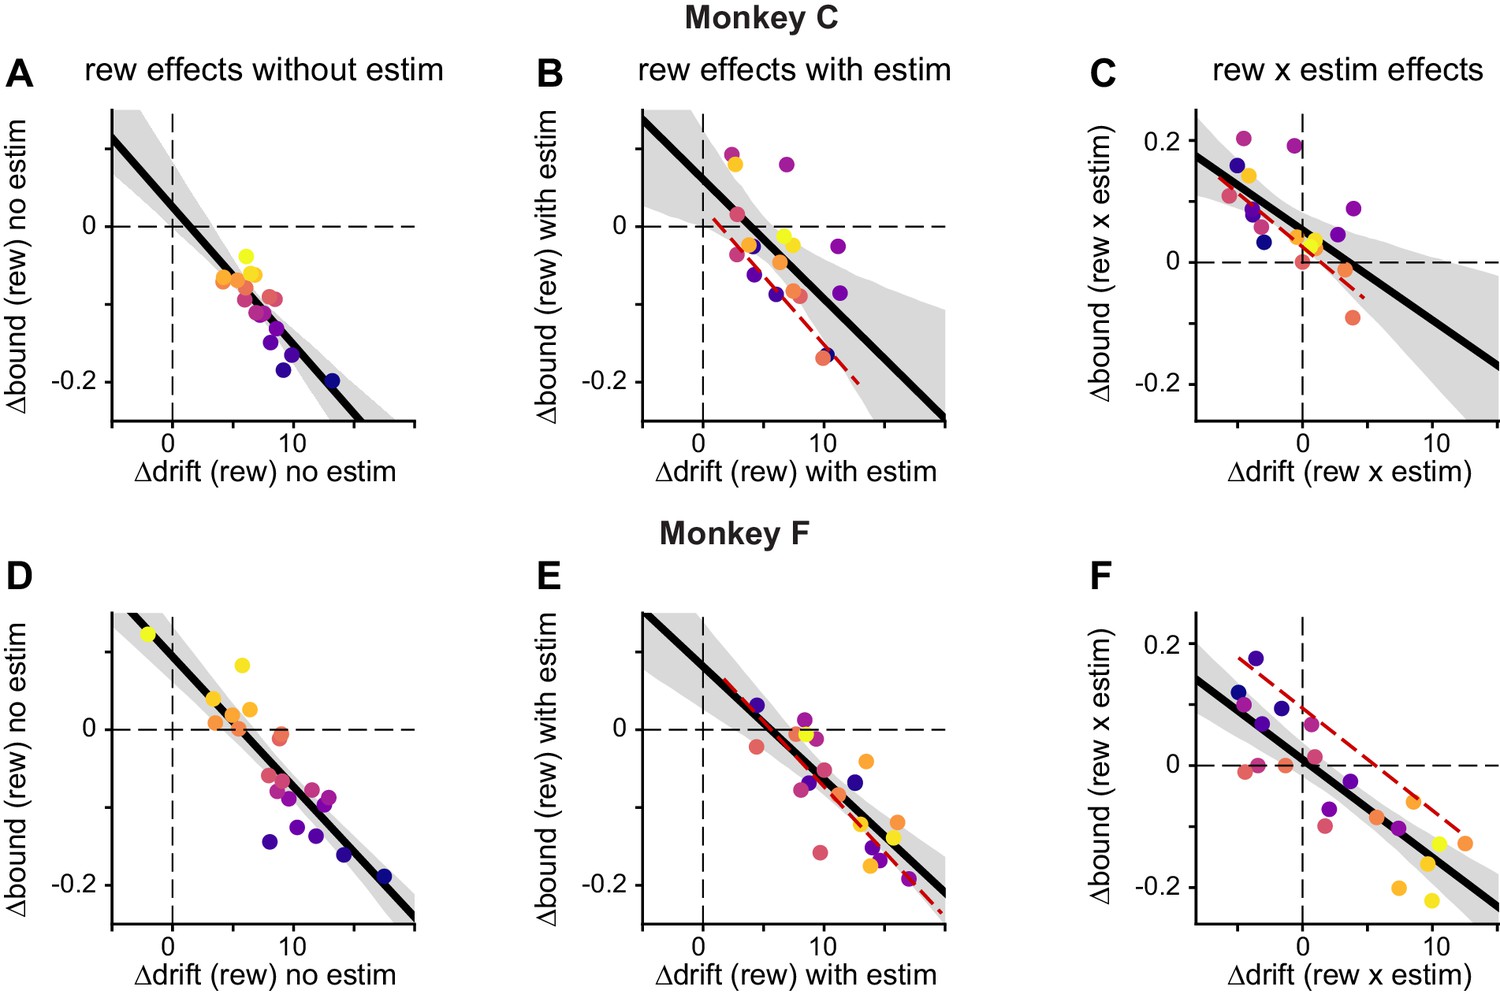
Both monkeys showed similar correlation patterns between ∆drift and ∆bound.
(A-C) Results from monkey C. Same format as Figure 5B and D. Data points were color-coded based on ∆bound (rew) no estim values. Red dashed lines replotted the linear regression in A, with x-values centered on ∆drift (rew) with estim and ∆drift (rew × estim), respectively. Solid lines, linear regressions with t-test, p<0.0001 ,=0.0058, and 0.004. respectively. (D-F) Results from monkey F. Linear regression, t-test, p<0.0001 for all.
Figure 6 with 3 supplements
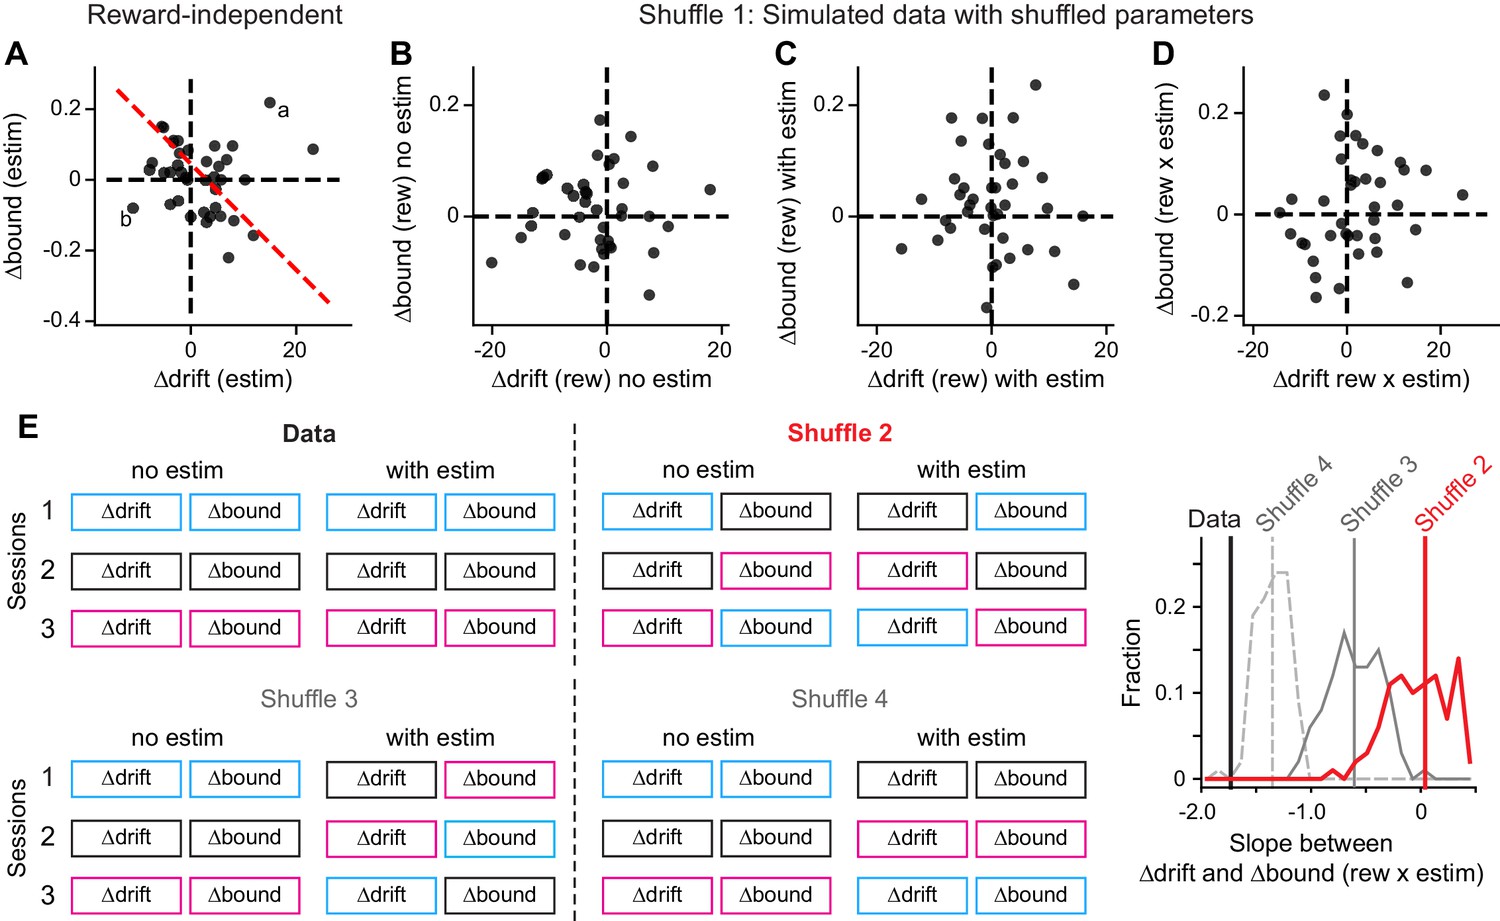
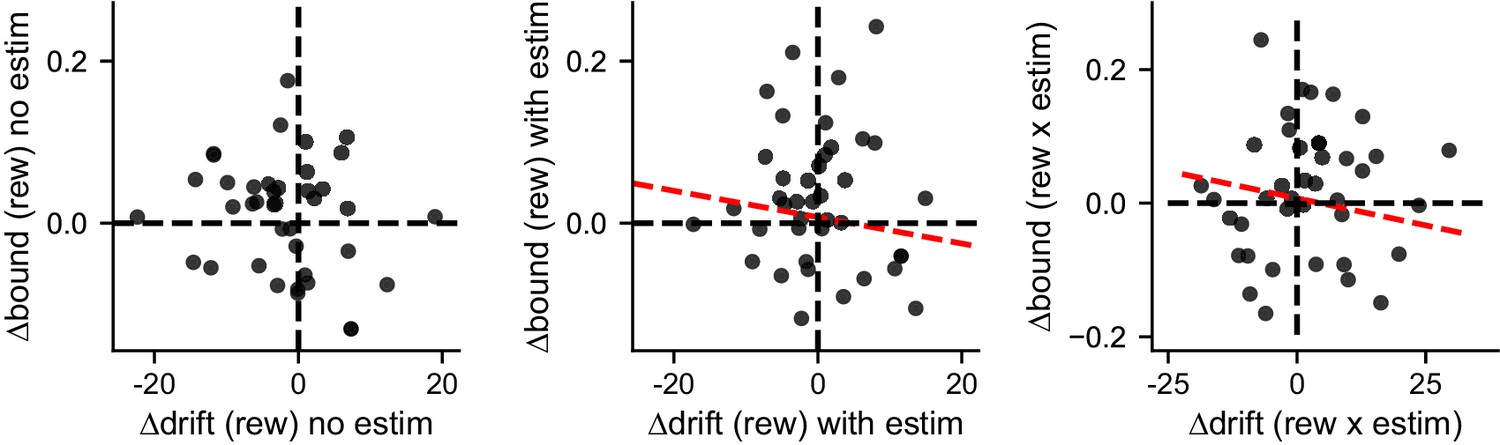
Control analysis results.
(A) The average microstimulation effects on ∆drift and ∆bound that were independent of reward context were not correlated. Same format as Figure 5D. Linear regression, t-test, p=0.60. (B-D) The patterns of correlation in Figure 5B and D were not observed in data simulated with shuffled DDM parameters (Shuffle 1). ∆drift and ∆bound values were obtained by fitting the simulated data with the “Full” DDM model. Linear regression, t-test, p=0.78, 0.81, 0.26 for the three panels, respectively. (E) The observed relationship between Δdrift (rew × estim) and Δbound (rew × estim) was different from those observed in shuffled data. Shuffle 2 (red): shuffle ∆drift and ∆bound values for trials with and without microstimulation across sessions independently. Shuffle 3 (gray, solid): shuffle ∆drift and ∆bound values for microstimulation trials only and across sessions independently. Shuffle 4 (gray, dashed): shuffle ∆drift and ∆bound values for microstimulation trials only across sessions while maintaining the coupling between drift and bound. Histograms were obtained from 200 shuffles for each method. Vertical lines indicate the mean slope values.
Figure 6—figure supplement 1
∆drift and ∆bound values obtained by fitting the simulated data to the “NoCollapse” DDM model did not show the same correlation patterns as the original data.
Linear regression, t-test, p=0.25, 0.65, and 0.66 for the three panels, respectively.
Figure 6—figure supplement 2
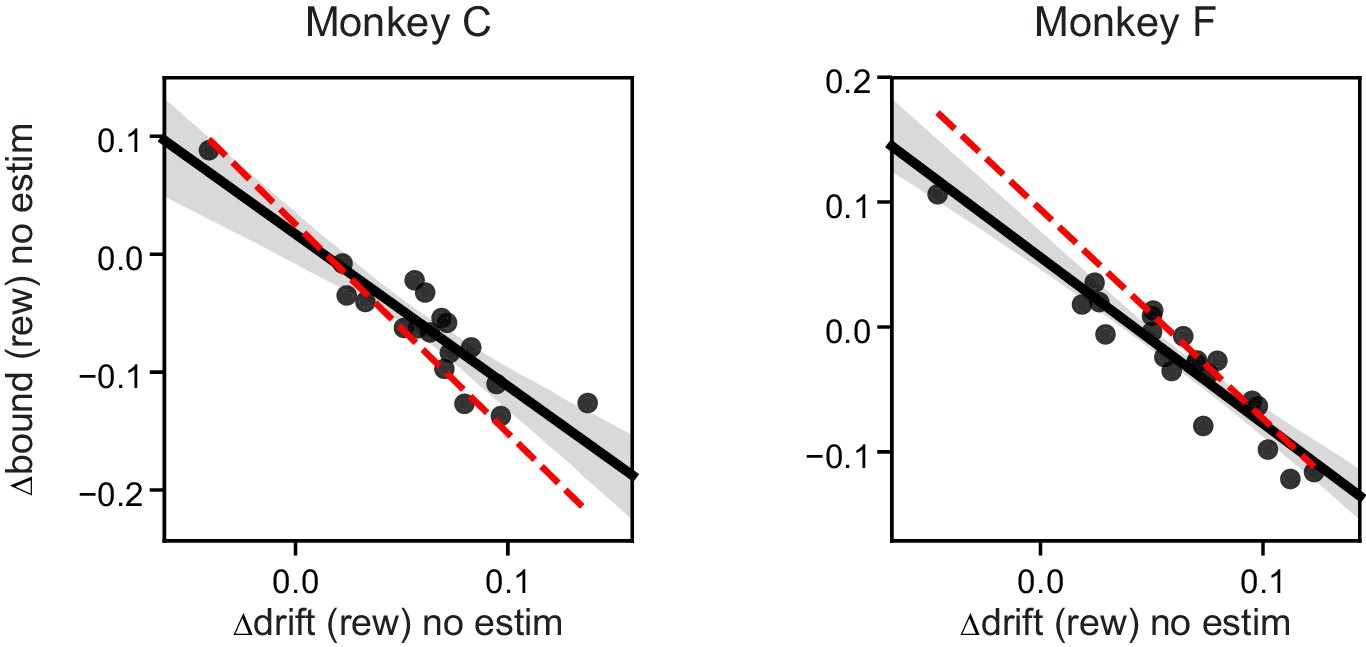
Both monkeys showed significant negative correlation between ∆drift (rew) and ∆bound (rew) on trials before microstimulation began.
Each data point represents one session. n = 18 and 21 for monkeys C and F, respectively. Linear regression, t-test, p<0.0001 for both monkeys. Red dashed lines re-plot the regression for “(rew) no estim” effects as in Figure 5B.
Figure 6—figure supplement 3
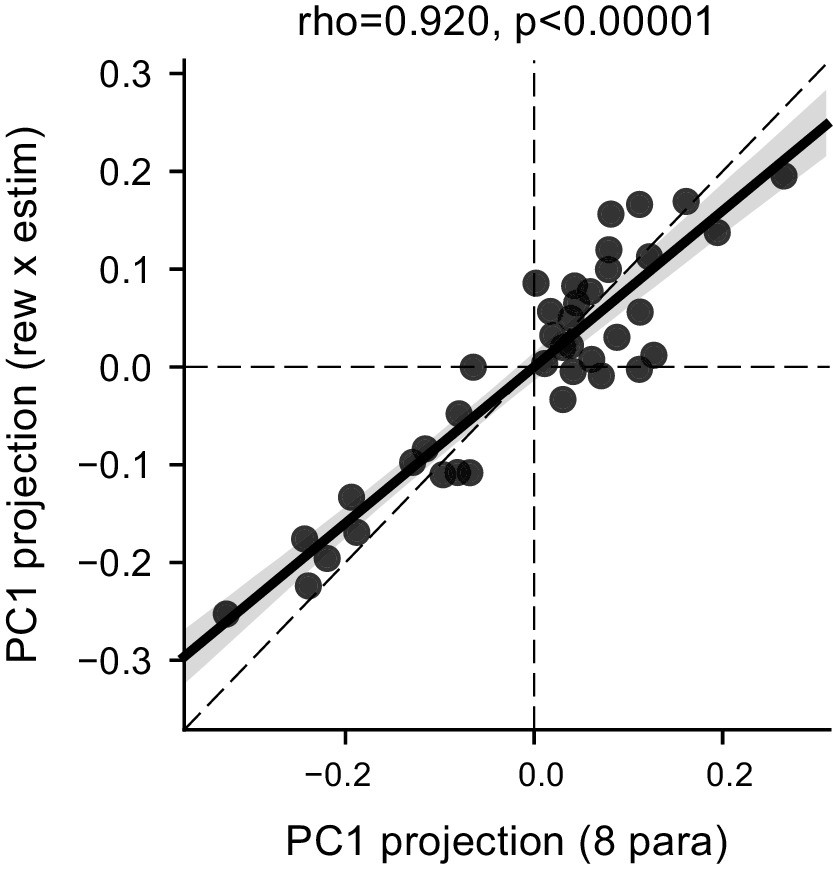
The correlated ∆drift (rew × estim) and ∆bound (rew × estim) effects represented the dominant features of the data.
Scatter plot of the projection values for the first principal component (PC) based on eight fitted parameters (x-axis, [me or z] × [contra-LR or ipsi-LR] × [with estim or no estim]) and for the first PC based on ∆drift (rew × estim) and ∆bound (rew × estim) (y-axis). The dashed diagonal line represents unity slope. Rho and p values were obtained with Pearson correlation.
Figure 7 with 1 supplement
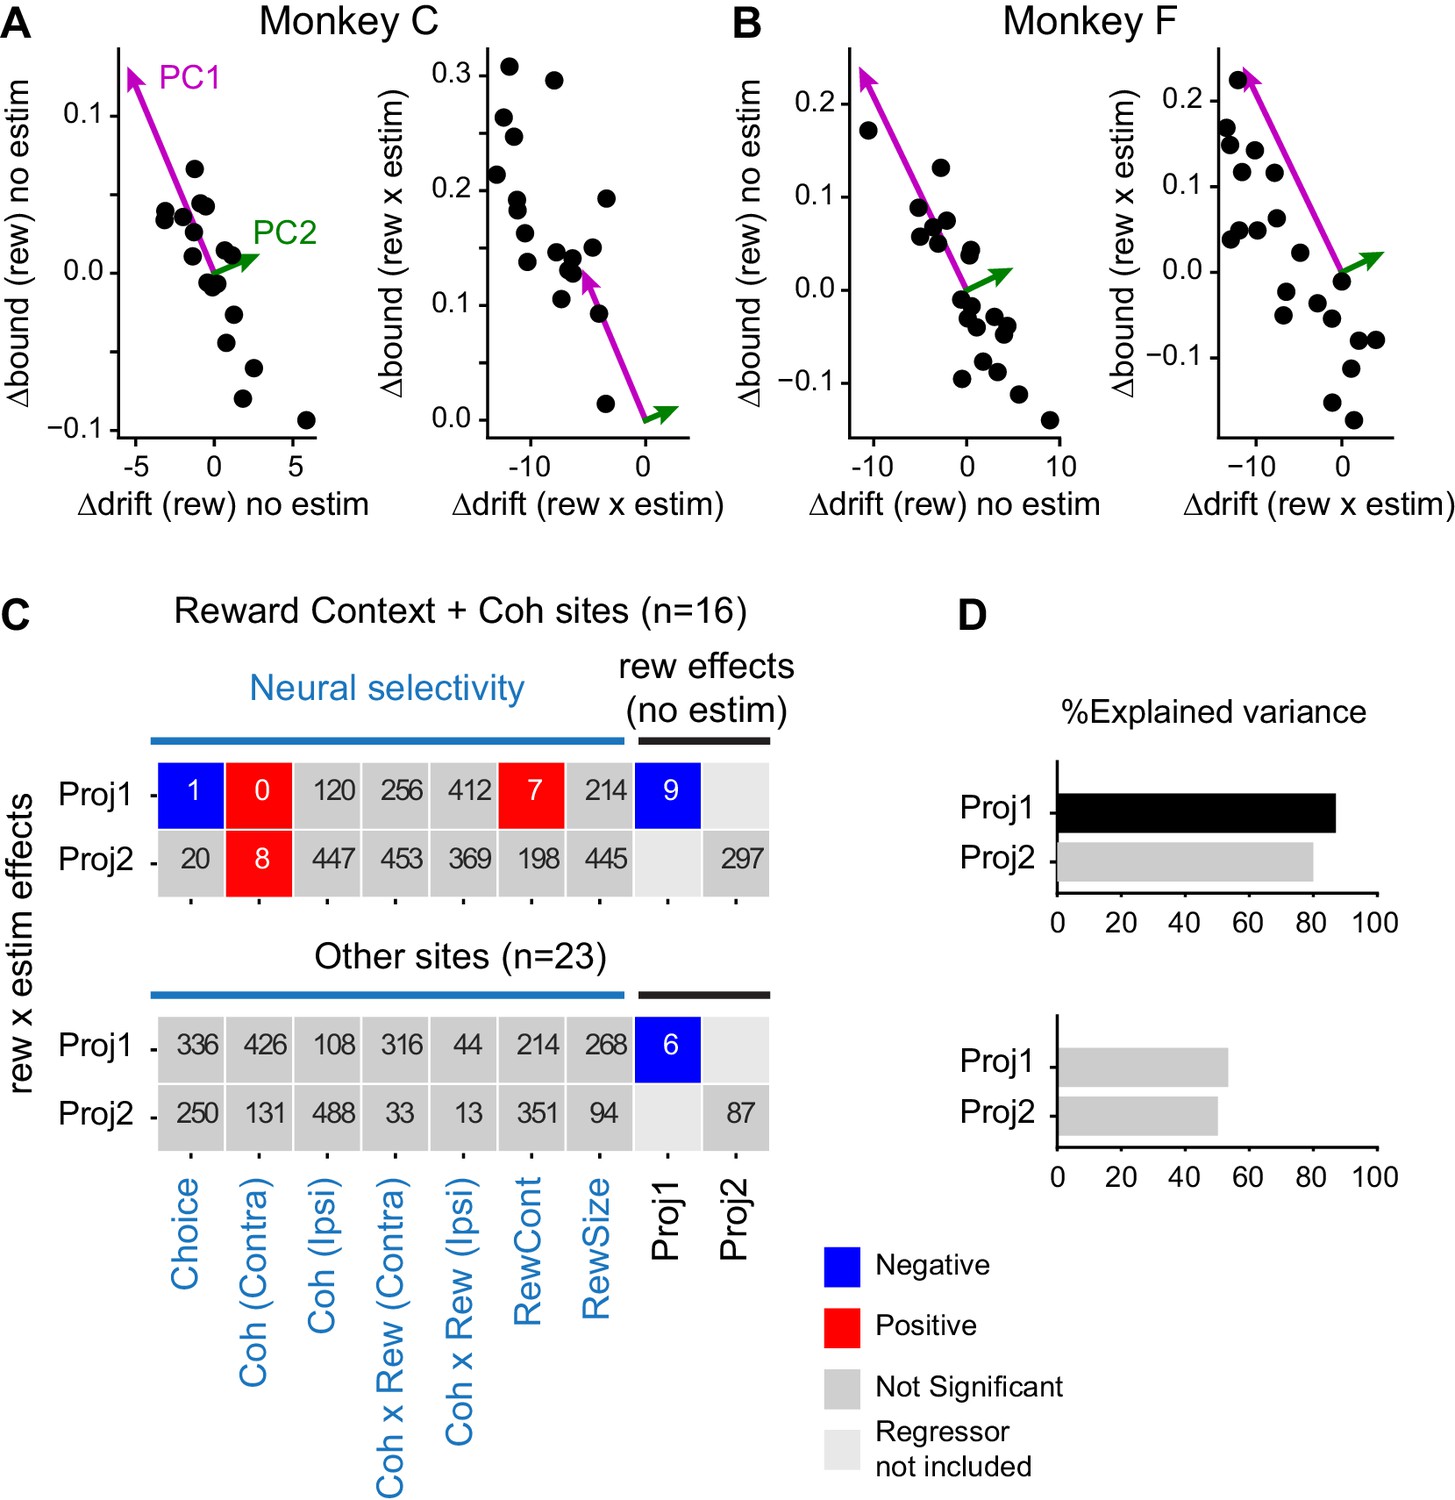
Microstimulation effects on coordination depended on neural selectivity and baseline adjustments of drift and bound.
(A and B) Principal components (PCs) were estimated for reward context modulation of Δdrift and Δbound without microstimulation (left panels; mean subtracted) for the two monkeys separately. The values of Δdrift (rew × estim) and Δbound (rew × estim) were projected onto these two PCs (right panels). (C) Visualization of the dependence of rew × estim effects on neural selectivity and reward effects without microstimulation for sites with combined modulations by motion coherence and reward context (top) and for other sites (bottom). Proj1(2): projection onto PC1(2). Each row shows the results from one multiple linear regression, with the quantity on the ordinate as the dependent variable and the quantities on the abscissa as the independent variables. Significance was assessed with bootstrap methods using 1000 shuffles of the independent variables. The number in each box indicates the number of shuffles with the same or stronger effect as the experimental data (e.g., six means an estimated p value of 0.006 and 0 means an estimated p value of < 0.001). Colors indicate the signs of regression coefficients (significance criterion: p<0.0125 = 0.05/4-regressions). (D) Percent explained variance for the regressions in (C), respectively. A black bar indicates that the experimental value is outside the 95 percentile of the bootstrapped distribution.
-
Figure 7—source data 1
Neural selectivity for different task factors at the microstimulation sites.
Column “indRewcontCoh” was used to divide the two subsets of stimulation sites in C and D. PCA was performed on DDM fitting results in Figure 5—source data 1.
- https://cdn.elifesciences.org/articles/56694/elife-56694-fig7-data1-v1.csv
Figure 7—figure supplement 1

MRI reconstruction of recording and microstimulation sites.
(A) Recording and microstimulation sites projected on coronal slices. AC: anterior commissure. Positive numbers: anterior to AC. Negative numbers: posterior to AC. Scale bars: 5 mm. (B) Summary of microstimulation sites, flattened along the Anterior-Posterior axis. Red: sites with significant rew × estim effects on choice, based on logistic fits. Same sites as colored dots with significant y-axis values in Figure 3—figure supplement 1, B1 and B2. (C) Same format as B. Red: sites with significant rew × estim effects on RT, based on linear fits. Same sites as colored dots with significant y-axis values in Figure 3—figure supplement 1, B3-B6. (D) microstimulation sites color-coded by the ranks of ∆drift (rew x estim) (top) and ∆bound (rew x estim) (bottom). Small vertical lines in the color bars indicate zero crossing.
Author response image 1
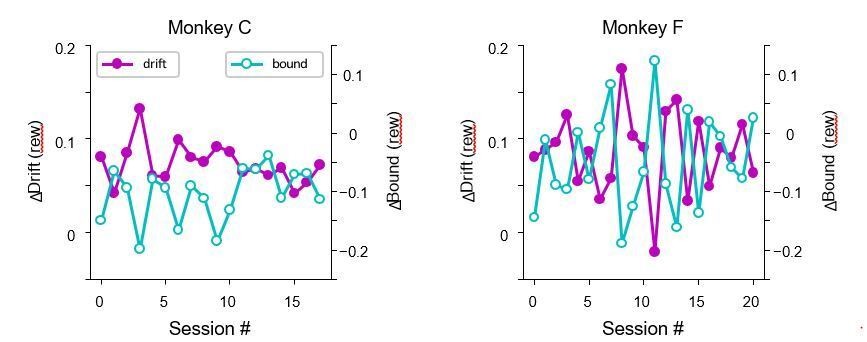
Monkeys did not show trends in their drift/bound biases across sessions.
Data were from trials without microstimulation in microstimulation sessions.
Tables
Key resources table
| Reagent type (species) or resource | Designation | Source or reference | Identifiers | Additional information |
|---|---|---|---|---|
| Software and Algorithms | Python 3.5 | Python Software Foundation | https://www.python.org/ | |
| Software and Algorithms | MATLAB | Mathworks | https://www.mathworks.com | |
| Software and Algorithms | Psychophysics Toolbox | Kleiner et al., 2007 | http://psychtoolbox.org/ | |
| Software and Algorithms | Pandas v0.19.2 | Python Data Analysis Library | https://pandas.pydata.org/ | |
| Software and Algorithms | Scikit-learn v0.18.1 | Pedregosa et al., 2011 | https://scikit-learn.org/stable/ | |
| Software and Algorithms | Scipy v0.18.1 | SciPy.org | https://docs.scipy.org/doc/scipy/reference/stats.html |
Additional files
-
Supplementary file 1
a, Median and p values for microstimulation-induced effects for all 55 sites, as measured by logistic fits to the choice data and linear fits to the RT data.P values were from Wilcoxon signed rank test.
Bold: p<0.05. b, Median and p values for microstimulation-induced effects in 39 effective sites, as measured by best DDM fits to the choice and RT data. P values were from Wilcoxon signed rank test. Bold: p<0.05.
- https://cdn.elifesciences.org/articles/56694/elife-56694-supp1-v1.docx
-
Transparent reporting form
- https://cdn.elifesciences.org/articles/56694/elife-56694-transrepform-v1.docx
Download links
A two-part list of links to download the article, or parts of the article, in various formats.
Downloads (link to download the article as PDF)
Open citations (links to open the citations from this article in various online reference manager services)
Cite this article (links to download the citations from this article in formats compatible with various reference manager tools)
The caudate nucleus contributes causally to decisions that balance reward and uncertain visual information
eLife 9:e56694.
https://doi.org/10.7554/eLife.56694


