A tudor domain protein, SIMR-1, promotes siRNA production at piRNA-targeted mRNAs in C. elegans
- Department of Biological Sciences, University of Southern California, United States
- Department of Biology, Colorado State University, United States
- Cell and Molecular Biology Program, Colorado State University, United States
- Biology of Non-coding RNA Group, Institute of Molecular Biology, Germany
- International PhD Programme on Gene Regulation, Epigenetics, and Genome Stability, Germany
Figures
Figure 1 with 1 supplement
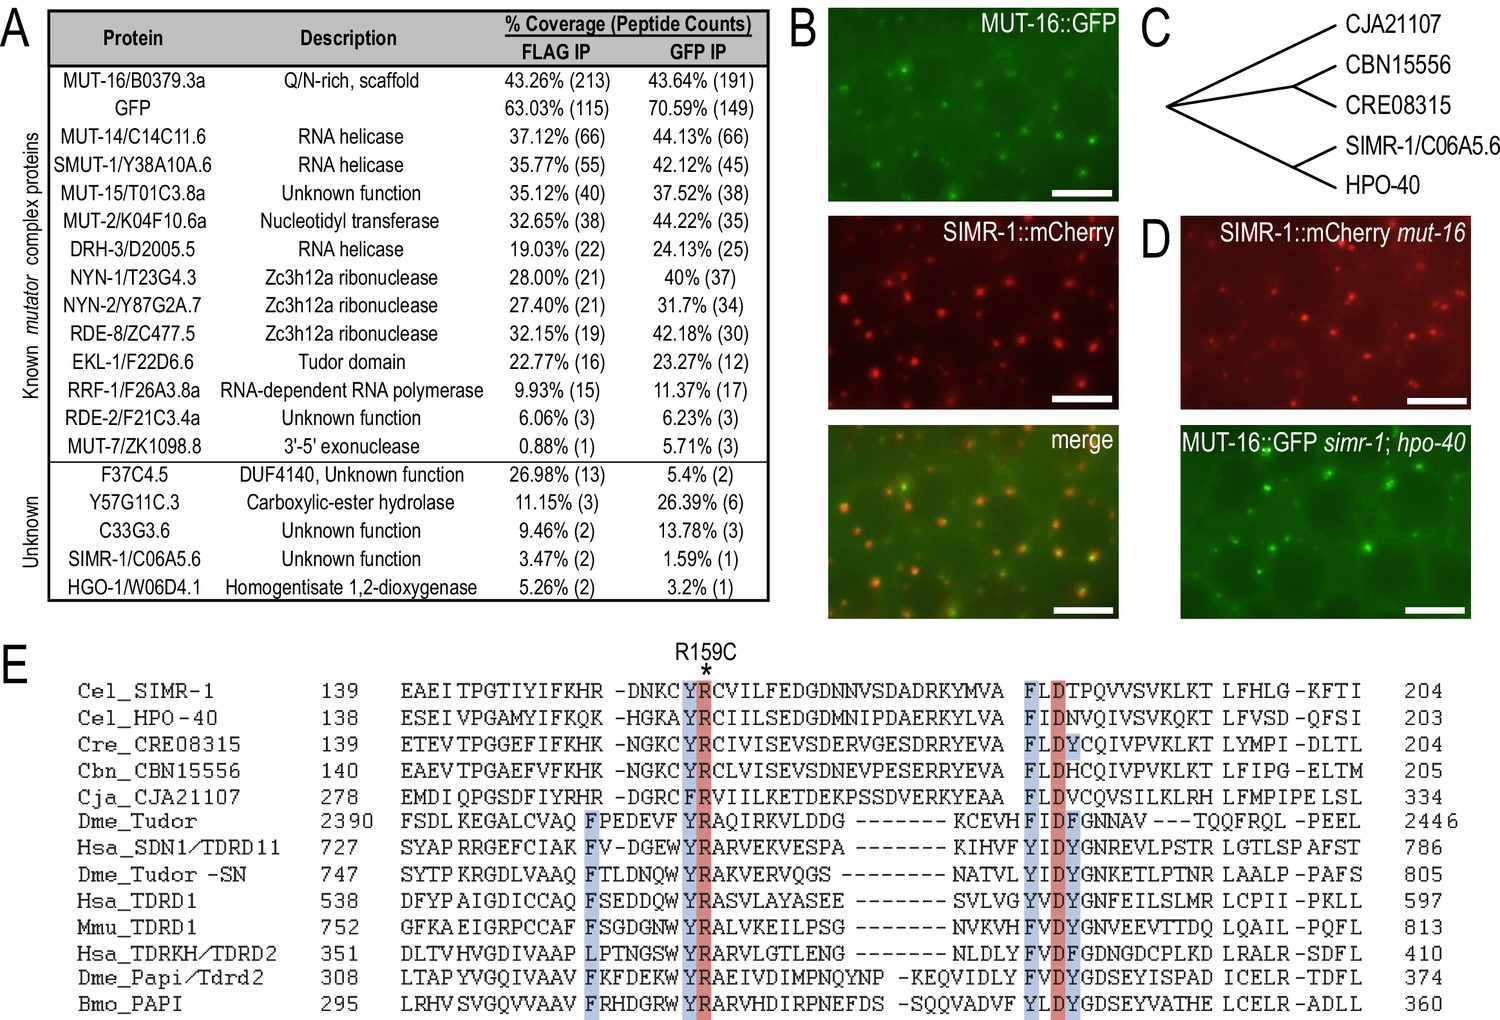
SIMR-1 is a perinuclear-localized Tudor domain protein.
(A) Proteins identified by IP-mass spec of MUT-16::GFP::3xFLAG but not wild-type animals. The percent coverage and total number of peptides captured are indicated for each MUT-16-associated protein. See Supplementary file 2 for complete list of immunoprecipitated proteins. (B) Live imaging of SIMR-1::mCherry demonstrate that it is adjacent to or colocalizes with MUT-16::GFP foci. Scale bars, 5 μm. (C) Cladogram representing the relationship between SIMR-1 and related proteins CJA21107 (C. japonica), CBN15556 (C. brenneri), CRE08315 (C. remanei), and HPO-40 (C. elegans). The protein alignment was generated using Clustal Omega and cladogram was made in Evolview V3. (D) Live imaging of SIMR-1::mCherry in a mut-16 mutant and MUT-16::GFP in a simr-1; hpo-40 double mutant indicate that mut-16 is not required for SIMR-1 foci formation, nor are simr-1 and hpo-40 required for Mutator foci formation. Scale bars, 5 μm. (E) Alignment of Tudor domain region generated by Clustal Omega of SIMR-1, HPO-40, their related nematode orthologs, and the eight most significant hits from HHpred server (see Methods). The four aromatic residues that constitute the aromatic cage are highlighted in blue and the absolutely conserved arginine and aspartate residues characteristic of extended Tudor domains are highlighted in red. The location of the simr-1[R159C] mutation is marked with an asterisk. Cel - C. elegans, Cre – C. remanei, Cbn – C. brenneri, Cja – C. japonica, Dme – D. melanogaster, Hsa – H. sapiens, Mmu – M. musculus, and Bmo – B. mori.
Figure 1—figure supplement 1
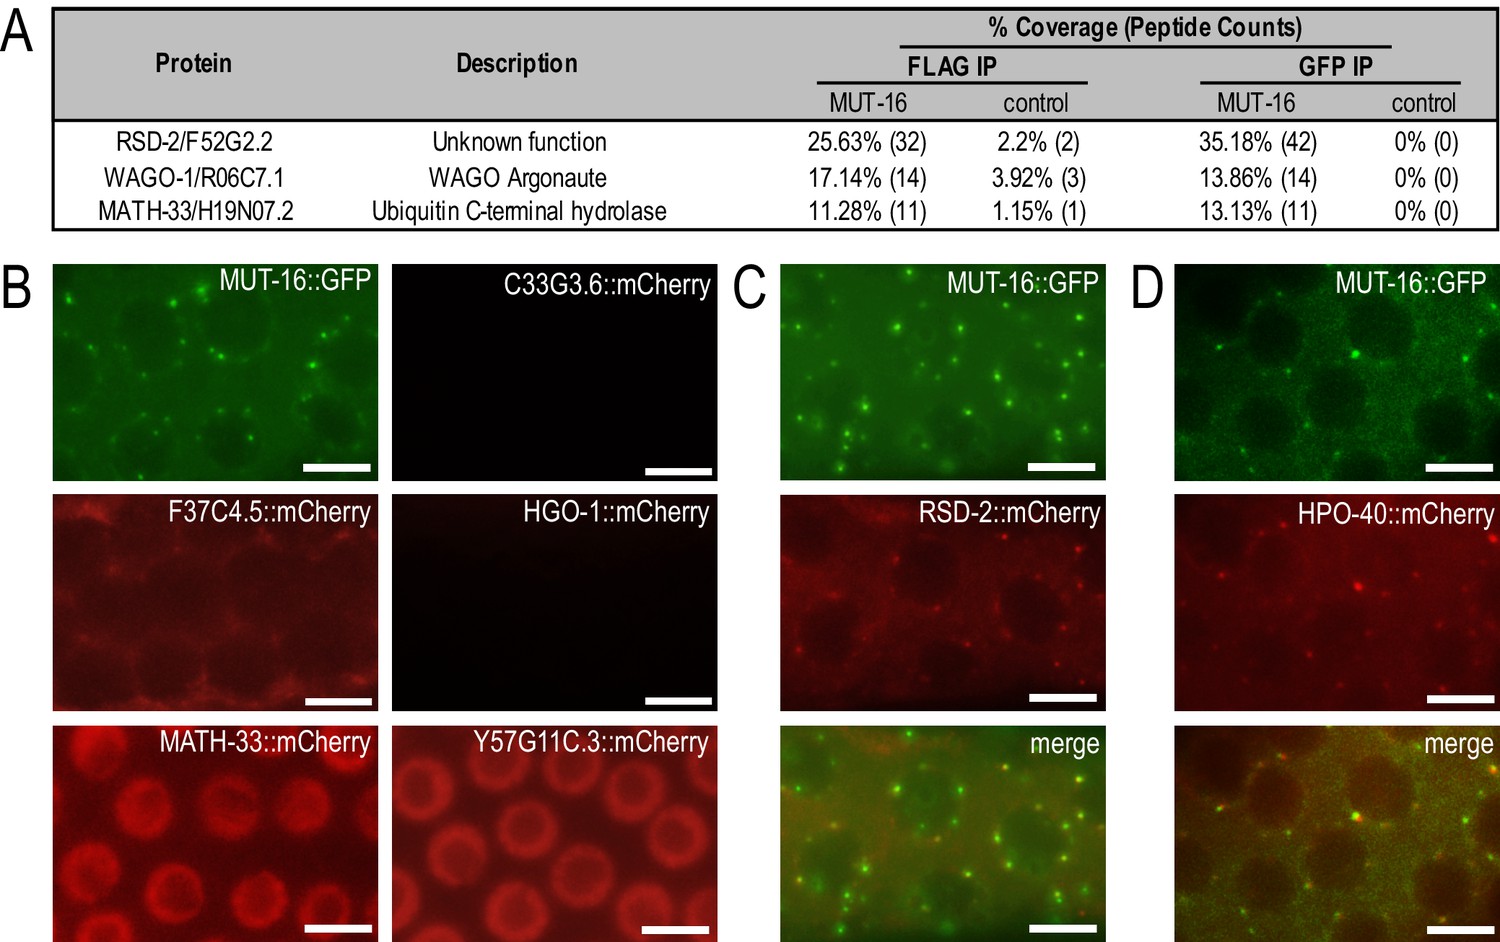
Identification and localization of MUT-16-associated proteins.
(A) Proteins identified by IP-mass spec of MUT-16::GFP::3xFLAG that are enriched at least four-fold in MUT-16 immunoprecipitations relative to control immunoprecipitations. See Supplementary file 2 for complete list of immunoprecipitated proteins. The percent coverage and total number of peptides captured are indicated for each MUT-16-associated protein. (B) Live imaging of C33G3.6::mCherry, F37C4.5::mCherry, HGO-1::mCherry, MATH-33::mCherry, and Y57G11C.3::mCherry. MUT-16::GFP is shown for reference. (C–D) Live imaging of RSD-2::mCherry (C) and HPO-40::mCherry (D) demonstrates that both proteins are adjacent to or colocalize with MUT-16::GFP foci. Scale bars, 5 μm.
Figure 2 with 1 supplement
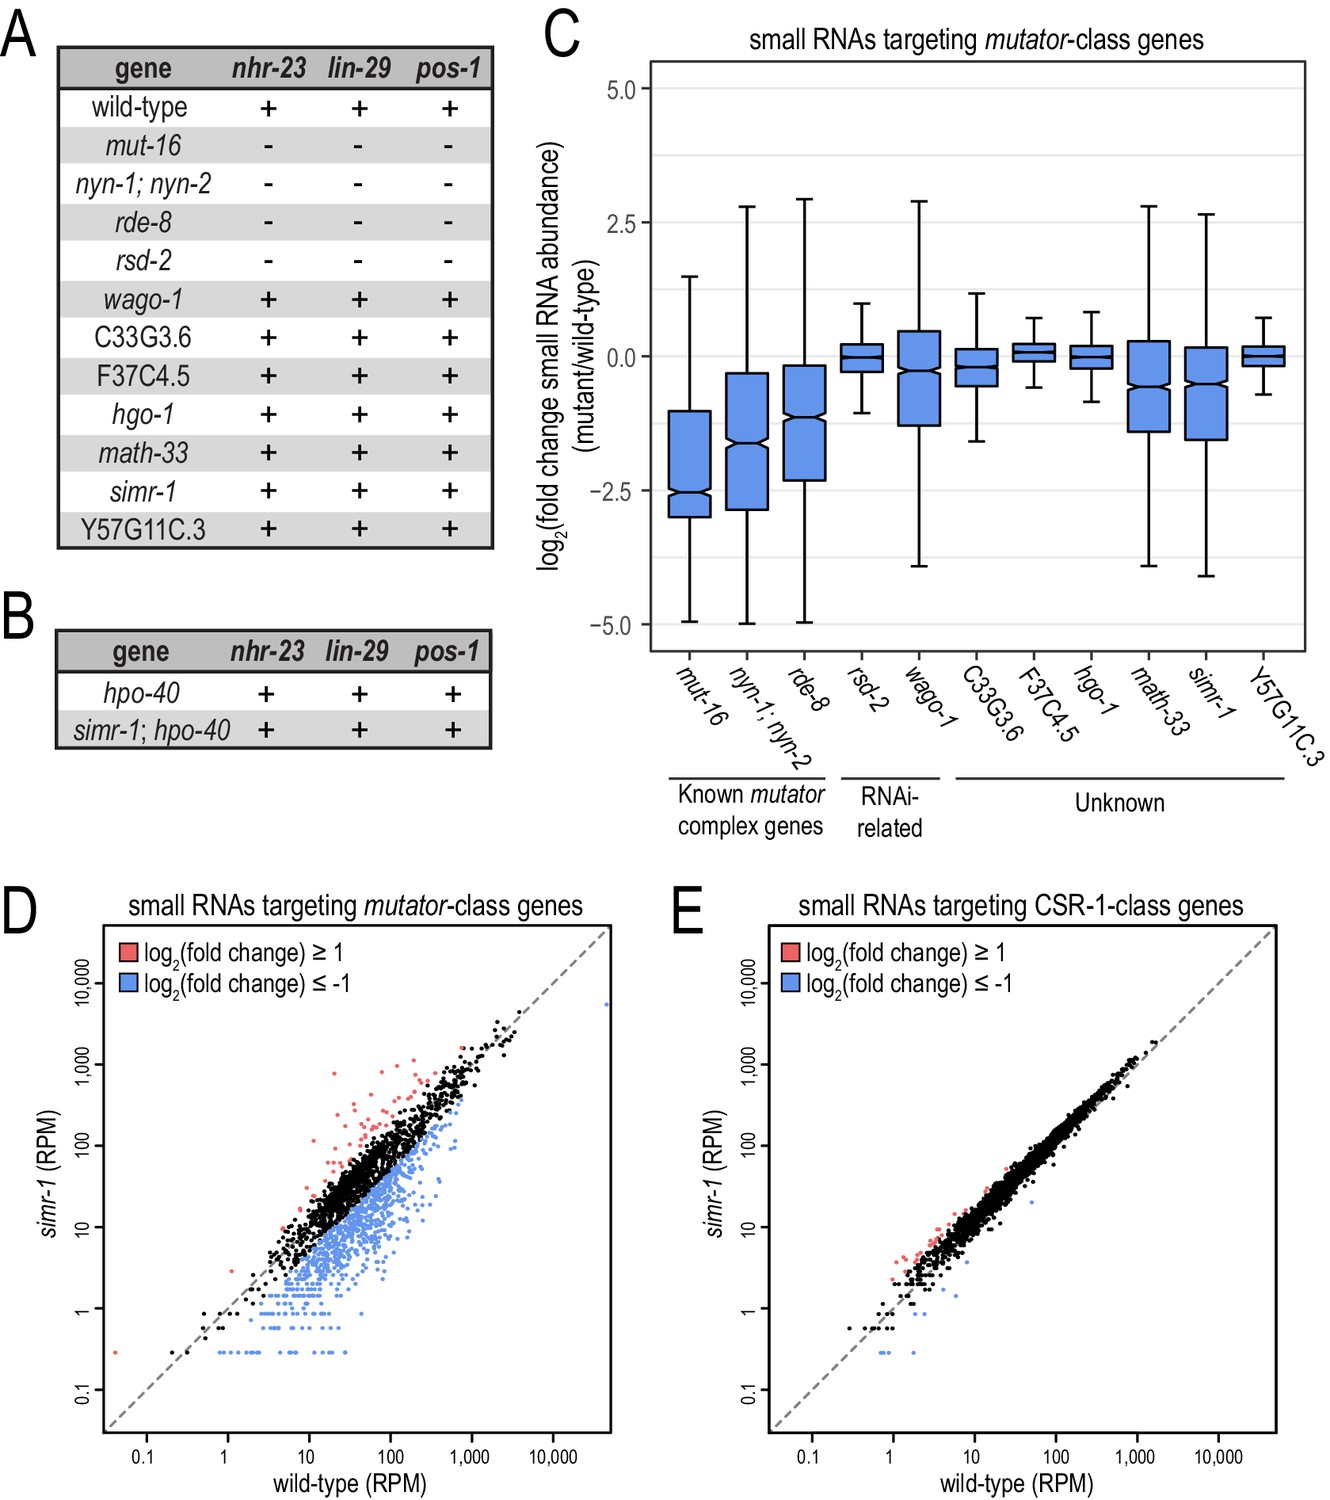
Small RNA-related phenotypes associated with deletions in MUT-16-associated proteins.
(A) Animals carrying deletions for each previously-uncharacterized gene identified in the MUT-16 IP-mass spec experiment were assayed for their ability to respond to somatic (nhr-23 or lin-29) or germline (pos-1) RNAi. “+” indicates wild-type response and “-” indicates RNAi-defective response. (B) Worms carrying deletions for hpo-40 single mutants or simr-1; hpo-40 double mutants were assayed for their ability to respond to somatic (nhr-23 or lin-29) or germline (pos-1) RNAi as described in (A). (C) Box plot displaying total small RNA levels targeting mutator-target genes in the indicated mutant strains relative to wild-type animals. (D,E) Scatter plots display small RNA reads per million total reads mapping to mutator-target genes (D) and CSR-1-class genes (E) in wild-type and simr-1 mutants. Genes for which log2(fold change small RNA abundance)≥1 are colored dark red and genes for which log2(fold change small RNA abundance)≤−1 are colored light blue.
Figure 2—figure supplement 1
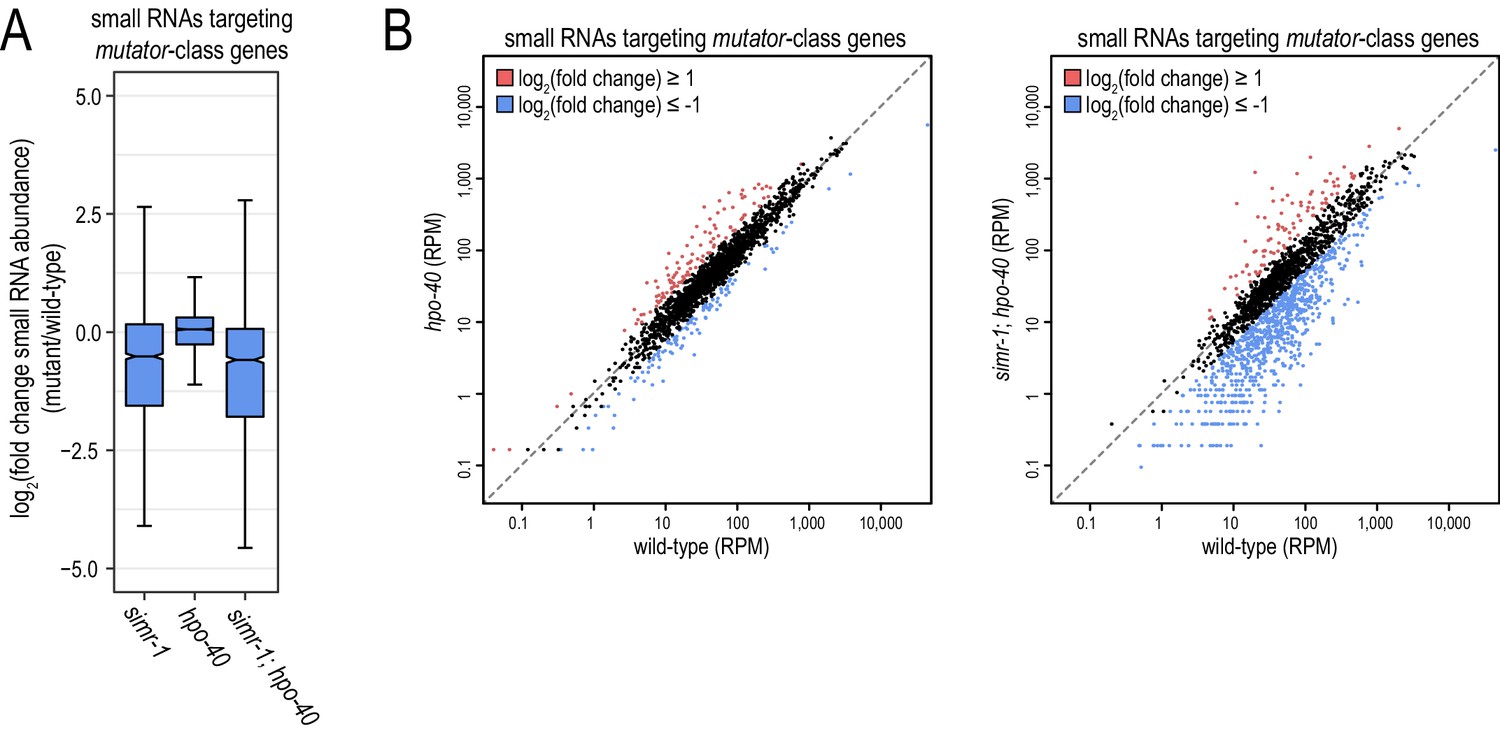
Mutator-class small RNAs are reduced in simr-1 but not hpo-40 mutants.
(A) Box plot displaying total small RNAs levels targeting mutator-target genes in the indicated mutant strains relative to wild-type animals. (B) Scatter plots display small RNA reads per million total reads mapping to mutator-target genes in wild-type and hpo-40 single mutants (left) or simr-1; hpo-40 double mutants (right). Genes for which log2(fold change small RNA abundance)≥1 are colored dark red and genes for which log2(fold change small RNA abundance)≤−1 are colored light blue.
Figure 3 with 1 supplement
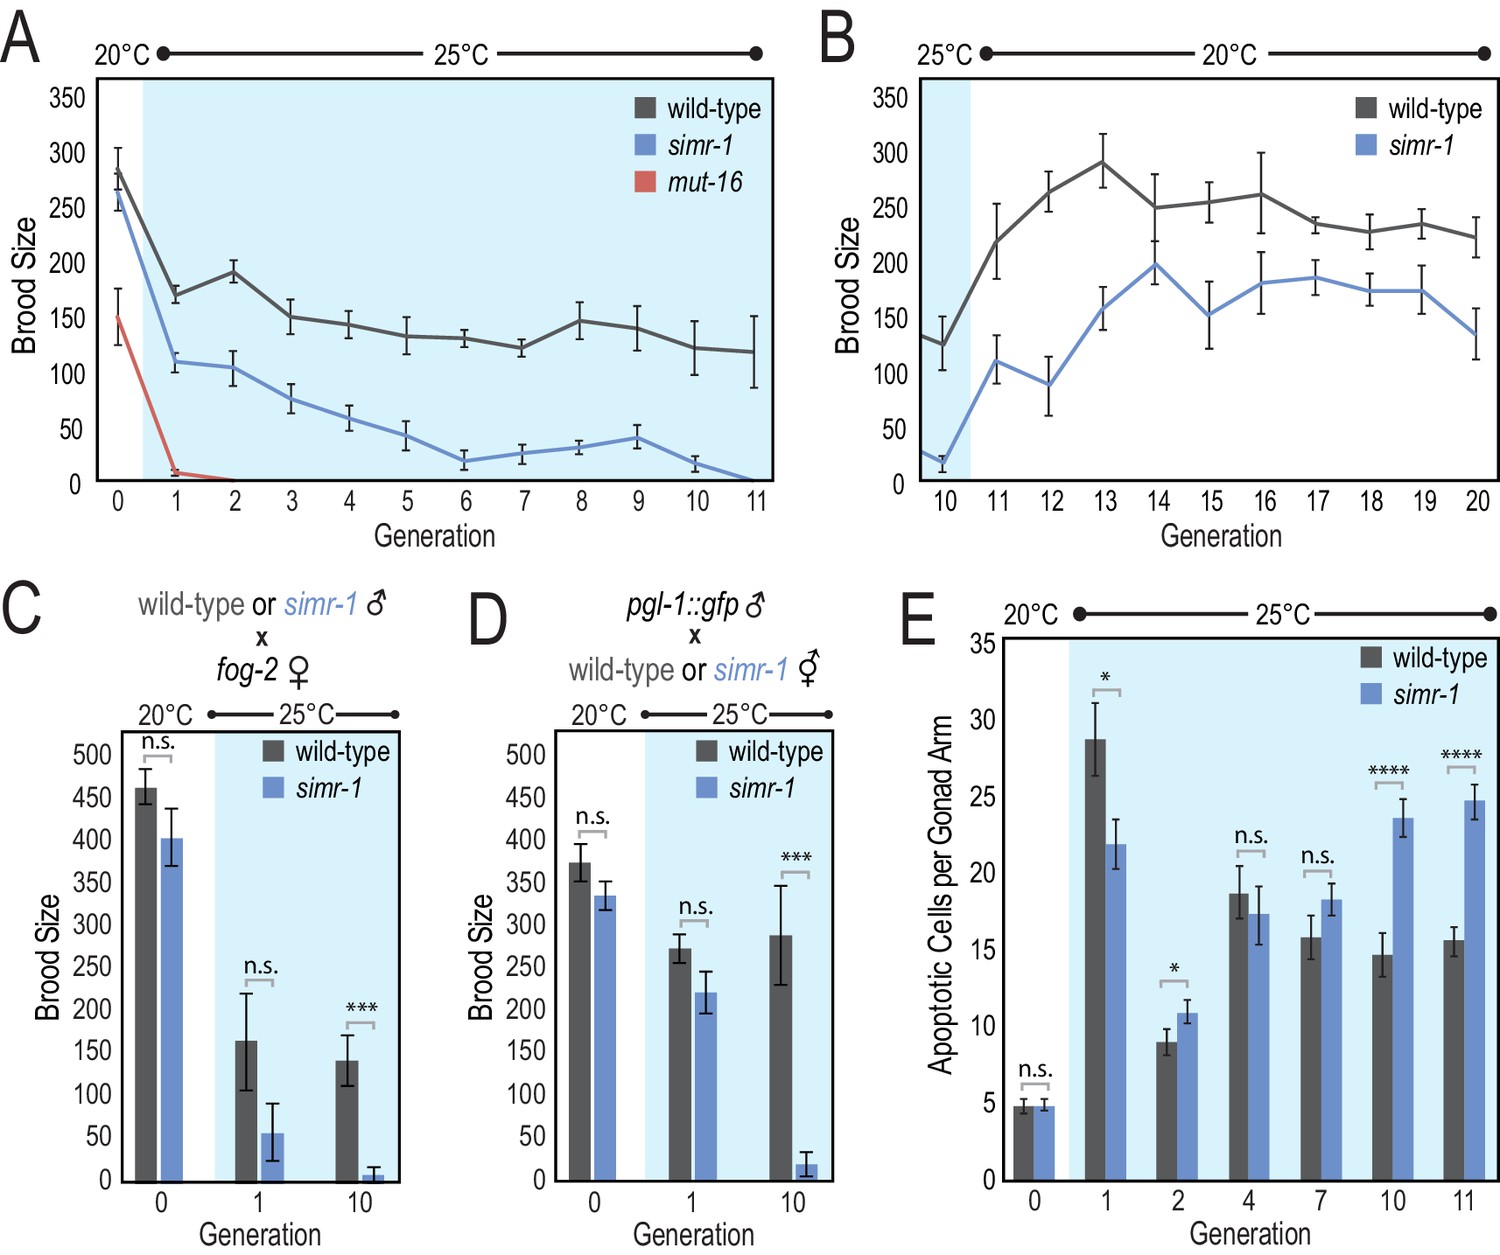
simr-1 mutants have a transgenerational fertility defect at elevated temperature.
(A) Brood size was scored for a single generation at 20°C, followed by 11 generations at 25°C, demonstrating that simr-1 mutants become progressively sterile at 25°C. 10 broods were scored for each genotype at each generation. (B) Brood sizes for simr-1 mutant and wild-type animals were scored for 10 generations after returning to 20°C, following 10 generations at 25°C, demonstrating restoration of fertility at permissive temperature. 10 broods were scored for each genotype at each generation. (C) Wild-type and simr-1 mutant males were raised either at 20°C, a single generation at 25°C, or following 10 generations of growth at 25°C, and then mated to fog-2 females raised at 20°C. Brood sizes were scored for 10 fog-2 females, each mated to four males of the indicated genotypes, and demonstrating that simr-1 male fertility is compromised at 25°C. (D) Wild-type and simr-1 mutant hermaphrodites were raised either at 20°C, a single generation at 25°C, or following 10 generations of growth at 25°C, and then mated to four pgl-1::gfp males raised at 20°C. Brood sizes were scored for each of 10 wild-type or simr-1 mutant hermaphrodites, mated to four pgl-1::gfp males. Only plates with GFP positive progeny were scored. These data indicate that oogenesis of simr-1 is compromised after multiple generations at 25°C. (E) Number of apoptotic germ cells were counted in a minimum of 20 wild-type and simr-1 mutant gonads using CED-1::GFP engulfment as a marker for apoptotic germ cells. Animals were raised either at 20°C, or for one, two, four, seven, 10 or 11 generations at 25°C, and imaged approximately 24 hr after the L4 larval stage. Error bars indicate SEM. n.s. denotes not significant and indicates a p-value>0.05, * indicates a p-value≤0.05, *** indicates a p-value≤0.001, **** indicates a p-value≤0.0001. See Supplementary file 8 for more details regarding statistical analysis.
-
Figure 3—source data 1
Data used to generate Figure 3A and Figure 3—figure supplement 1.
- https://cdn.elifesciences.org/articles/56731/elife-56731-fig3-data1-v2.xlsx
-
Figure 3—source data 2
Data used to generate Figure 3B.
- https://cdn.elifesciences.org/articles/56731/elife-56731-fig3-data2-v2.xlsx
-
Figure 3—source data 3
Data used to generate Figure 3C.
- https://cdn.elifesciences.org/articles/56731/elife-56731-fig3-data3-v2.xlsx
-
Figure 3—source data 4
Data used to generate Figure 3D.
- https://cdn.elifesciences.org/articles/56731/elife-56731-fig3-data4-v2.xlsx
-
Figure 3—source data 5
Data used to generate Figure 3E.
- https://cdn.elifesciences.org/articles/56731/elife-56731-fig3-data5-v2.xlsx
Figure 3—figure supplement 1
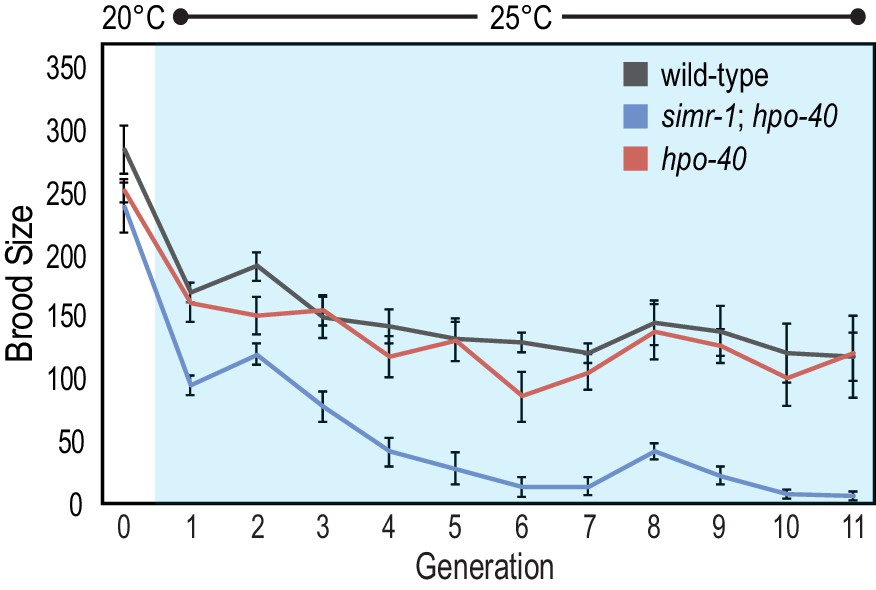
hpo-40 does not contribute to the progressive sterility of simr-1 mutants.
Brood sizes of wild-type, hpo-40 single mutants, and simr-1; hpo-40 double mutants were scored for a single generation at 20°C, followed by 11 generations at 25°C, demonstrating that hpo-40 does not contribute to the progressive sterility of simr-1 mutants at 25°C. 10 broods were scored for each genotype at each generation.
Figure 4 with 1 supplement
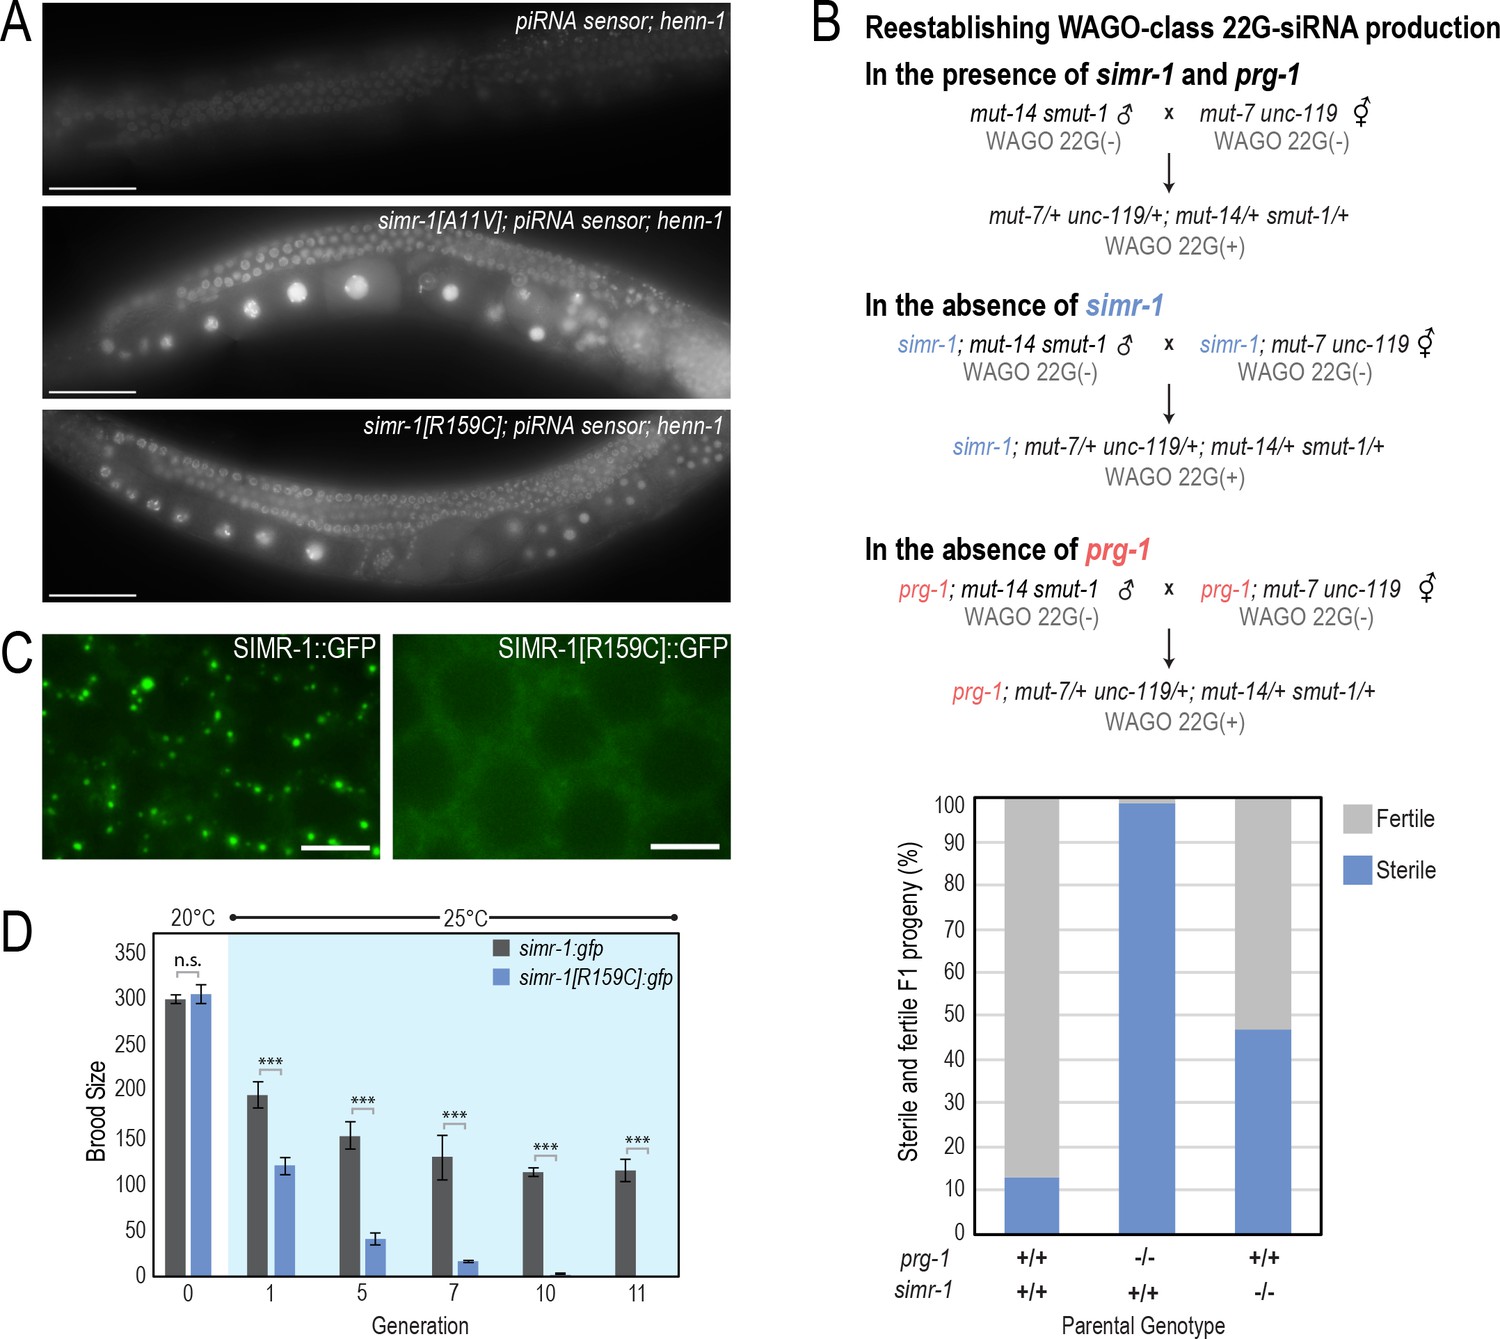
simr-1 mutants have piRNA-related defects.
(A) Images of adult animals, in which the henn-1 mutation weakly desilences the piRNA sensor (top). simr-1[A11V] (middle) and simr-1[R159C] (bottom) mutants, obtained from an EMS mutagenesis screen of the henn-1; piRNA sensor strain further desilence the sensor and increase GFP expression. All images were obtained using the same microscope settings. Scale bars, 50 μm. (B) A mating-based approach to reestablish WAGO-class 22G-siRNA production in the presence and absence of simr-1 and prg-1. Schematic (top) illustrating the three crosses and bar graph (bottom) showing percentage of fertile and sterile animals from each cross. (C) Live imaging of SIMR-1::GFP (left) and SIMR-1[R159C]::GFP (right) demonstrate that Tudor domain is critical for SIMR-1 localization to perinuclear foci. Scale bars, 5 μm. (D) Brood size was scored for simr-1::gfp and simr-1[R159C]::gfp strains at 20°C, then animals were raised for 11 generations at 25°C. Broods were additionally scored at generations one, five, seven, 10 and 11 at 25°C demonstrating that the simr-1[R159C]::gfp strain becomes progressively sterile at 25°C, similar to the simr-1 null mutation, while simr-1::gfp maintains fertility at 25°C similar to wild-type animals. 10 broods were scored for each genotype at each generation.
-
Figure 4—source data 1
Data used to generate Figure 4B.
- https://cdn.elifesciences.org/articles/56731/elife-56731-fig4-data1-v2.xlsx
-
Figure 4—source data 2
Data used to generate Figure 4D.
- https://cdn.elifesciences.org/articles/56731/elife-56731-fig4-data2-v2.xlsx
Figure 4—figure supplement 1
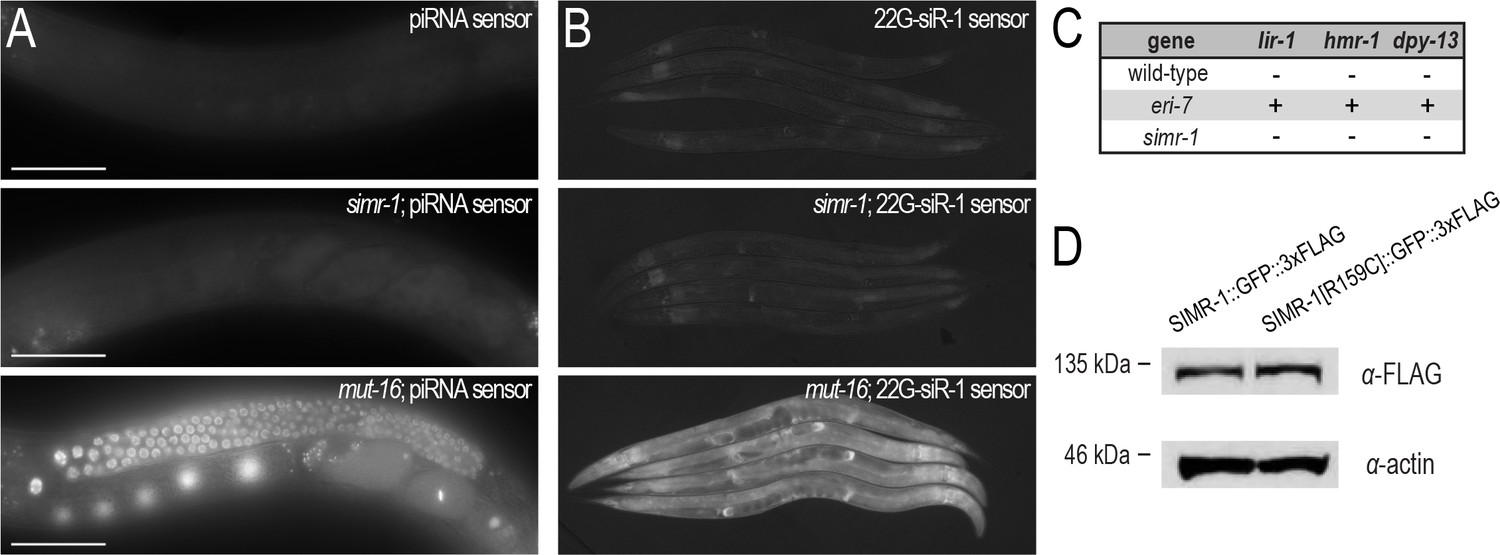
simr-1 mutants do not display defects associated with mutants in the mutator or ERGO-1 26G-siRNA pathways.
(A) Images of adult animals carrying the piRNA sensor in a wild-type (top), simr-1 mutant (middle), or mut-16 mutant (bottom) background. The piRNA sensor was maintained in a wild-type background for many generations prior to introduction of the simr-1 and mut-16 mutations and therefore is likely subject to heritable RNA silencing (RNAe). The simr-1 mutation is unable to relieve the RNAe-mediated silencing of the wild-type piRNA sensor, in contrast to the simr-1-mediated desilencing of the henn-1; piRNA sensor (Figure 4A). All images were obtained using the same microscope settings and processed identically. Scale bars, 50 μm. (B) Images of adults carrying the 22G-siR1 sensor, which is sensitive to perturbations in the ERGO-1 26G-siRNA pathway and the downstream mutator pathway. The simr-1 mutation (middle) was unable to desilence the 22G-siR1 sensor and expresses GFP at levels similar to a wild-type sensor strain (top). In contrast, mut-16 mutants robustly expressed GFP from the desilenced 22G-siR1 sensor. All images were obtained using the same microscope settings and processed identically. (C) Animals carrying the simr-1 deletion allele were assayed for their ability to respond to lir-1, hmr-1, or dpy-13 RNAi. ‘+” indicates an Enhanced RNAi (Eri) response and ‘-” indicates a wild-type response. Wild-type and eri-7 deletion animals, which display the Eri phenotype, are included as controls. (D) Western blot of SIMR-1::GFP and SIMR-1[R159C]::GFP in one-day adult animals demonstrate that the R159C mutation in the Tudor domain does not affect SIMR-1 protein expression. Actin protein is shown as a loading control.
Figure 5 with 1 supplement
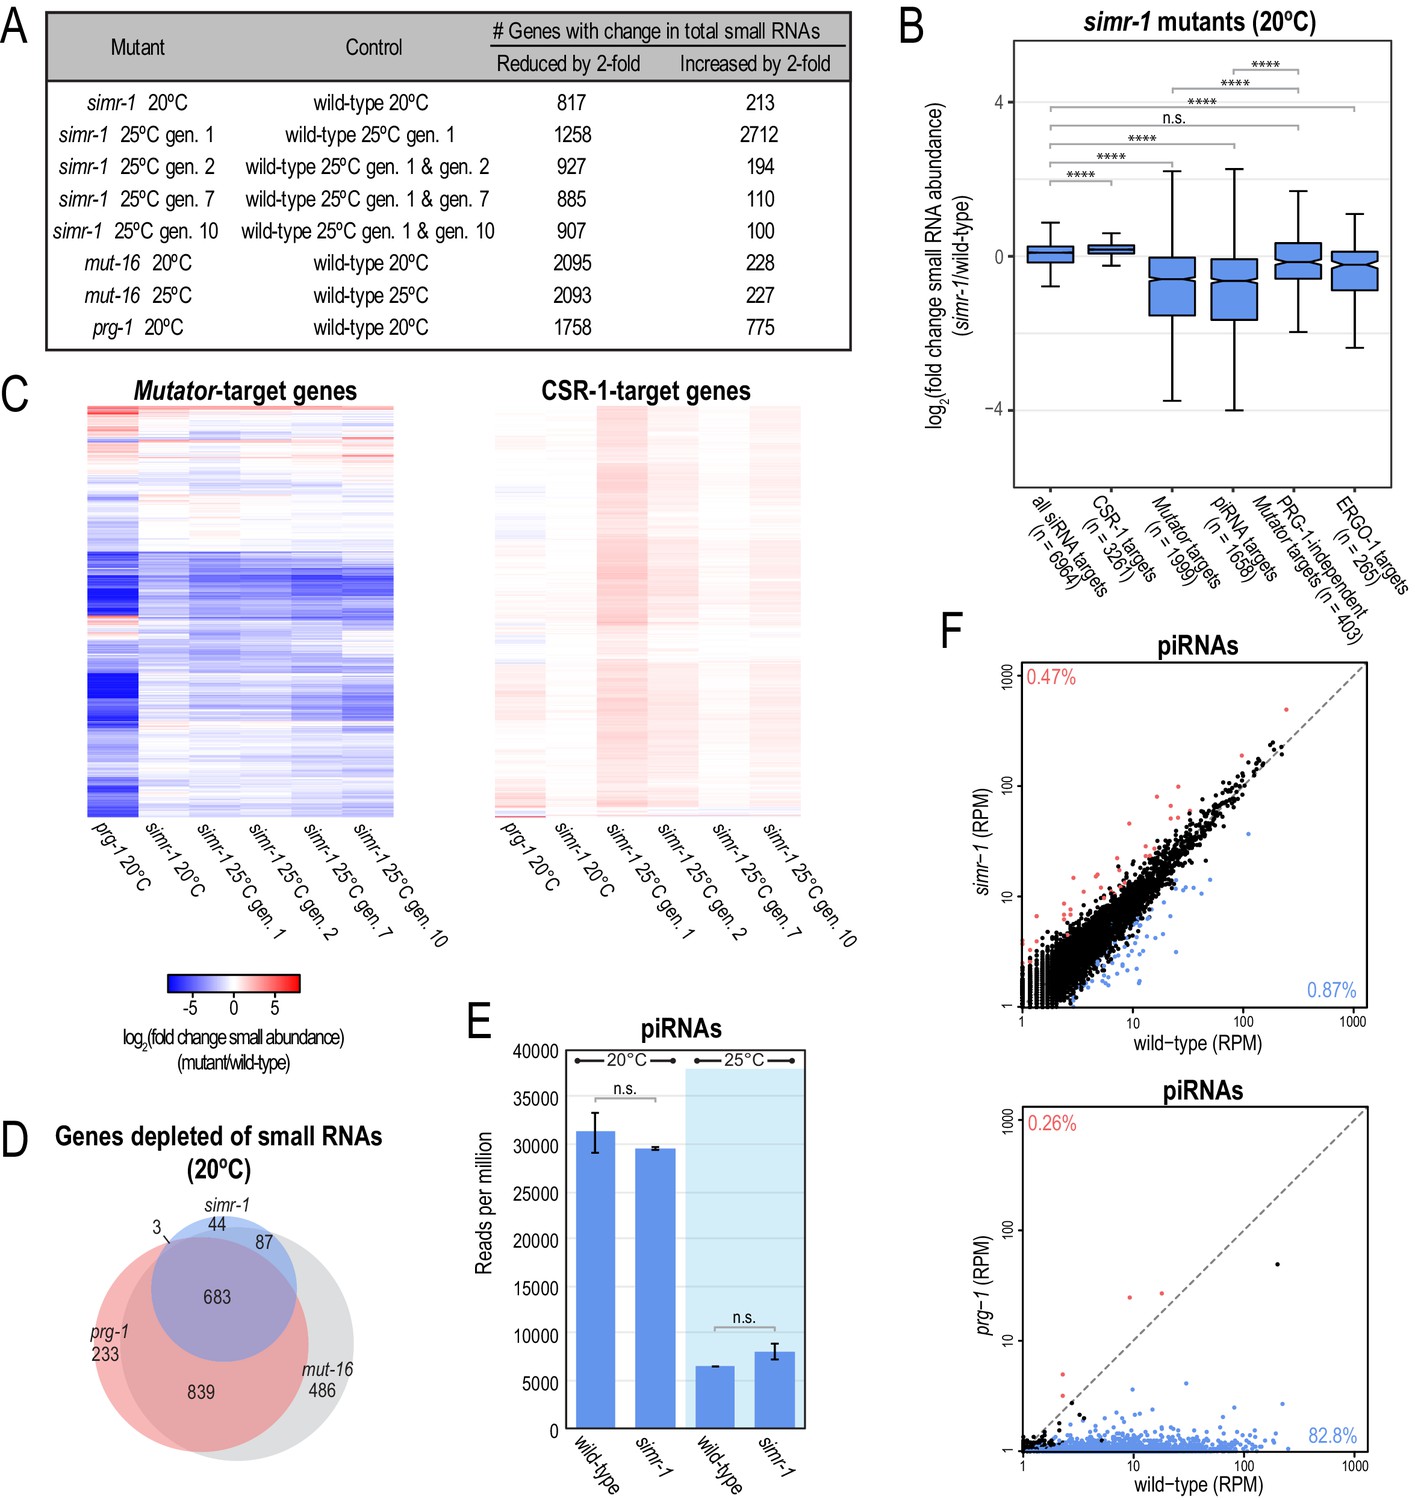
simr-1 mutants display reduced small RNAs mapping to mutator and piRNA-target genes.
(A) Table indicating the number of genes for which the total small RNA levels are either increased or reduced by at least two-fold for each indicated mutant. All genes also met the requirements of having at least 10 RPM in either mutant or control and a DESeq2 adjusted p-value of ≤0.05. (B) Box plots displaying total small RNAs levels mapping to genes from the indicated small RNA pathways in simr-1 mutants compared to wild-type animals raised at 20°C. Details regarding definition of small RNA target gene classes is provided in the Materials and Methods section. At least 10 RPM in wild-type or simr-1 mutant libraries was required to be included in the analysis. (C) Heat maps displaying total small RNAs levels targeting mutator-target genes or CSR-1-target genes in simr-1 mutants raised at 20°C, a single generation at 25°C, or two, seven, or 10 generations at 25°C relative to wild-type at the same temperature and generation. (D) Venn diagrams indicating overlap of genes depleted of total small RNAs by two-fold or more in mutants compared to wild-type. (E) Reads per total million reads mapping to piRNA and piRNA-target gene loci in wild-type and simr-1 mutants raised at either 20°C, or for a single generation at 25°C, indicate that piRNAs are not reduced in simr-1 mutants. Error bars indicate standard deviation of two replicate libraries. (F) Scatter plots display piRNA reads per million total reads in wild-type and simr-1 mutants (top) and wild-type and prg-1 mutants (bottom). Genes with two-fold increase in piRNA abundance and DESeq2 adjusted p-value≤0.05 are colored dark red and genes with two-fold reduction in piRNA abundance and DESeq2 adjusted p-value≤0.05 are colored light blue. The percentage of total piRNAs with an increase or reduction of greater than two-fold is indicated in the corners of the graph. n.s. denotes not significant and indicates a p-value>0.05 and **** indicates a p-value≤0.0001. See Supplementary file 8 for more details regarding statistical analysis.
Figure 5—figure supplement 1
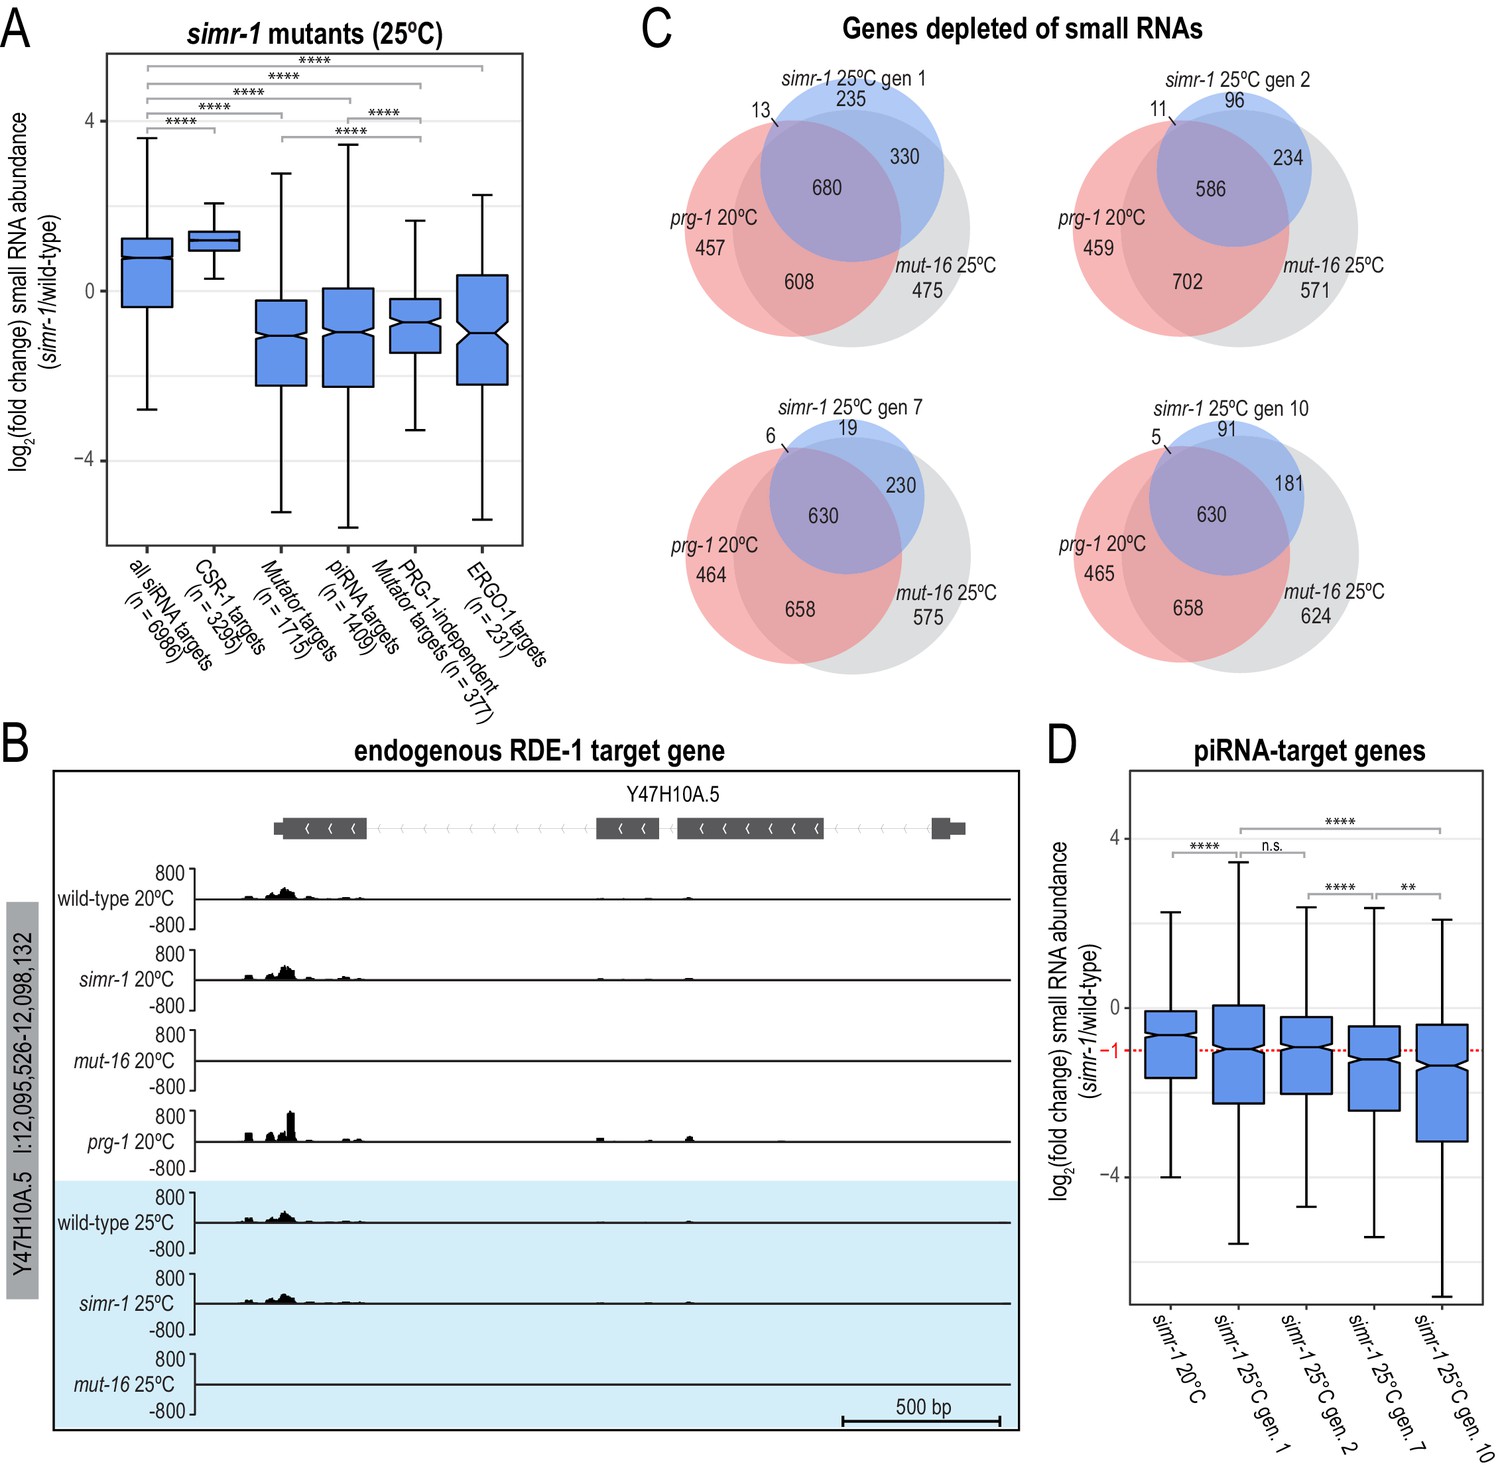
Small RNAs are reduced at many mutator, piRNA, and ERGO-1 target genes in simr-1 mutants at 25°C.
(A) Box plot displaying total small RNAs levels targeting genes from the indicated small RNA pathways in simr-1 mutants relative to wild-type animals raised for a single generation at 25°C. Details regarding definition of small RNA target gene classes is provided in the Materials and Methods section. (B) Small RNA distribution across the RDE-1-target gene Y47H10A.5 in wild-type, simr-1 mutants, prg-1 mutants and mut-16 mutants at 20°C and wild-type, simr-1 mutants, and mut-16 mutants for a single generation at 25°C, shows that small RNAs targeting Y47H10A.5 are produced independently of simr-1 and prg-1. (C) Venn diagrams indicating overlap of genes depleted of total small RNAs by two-fold or more in simr-1, prg-1, and mut-16 mutants compared to wild-type. (D) Box plot displaying total small RNAs levels mapping to piRNA-target genes in simr-1 mutants raised at 20°C or for one, two, seven or 10 generations at 25°C compared to wild-type animals raised at the same temperature for the same number of generations. piRNA-target genes are defined as those depleted of total small RNAs by two-fold or more in a prg-1 mutant, therefore all piRNA-target genes will have a log2(fold change small RNA abundance) ≤ −1 in a prg-1 mutant and would fall below the red dotted line.
Figure 6 with 1 supplement
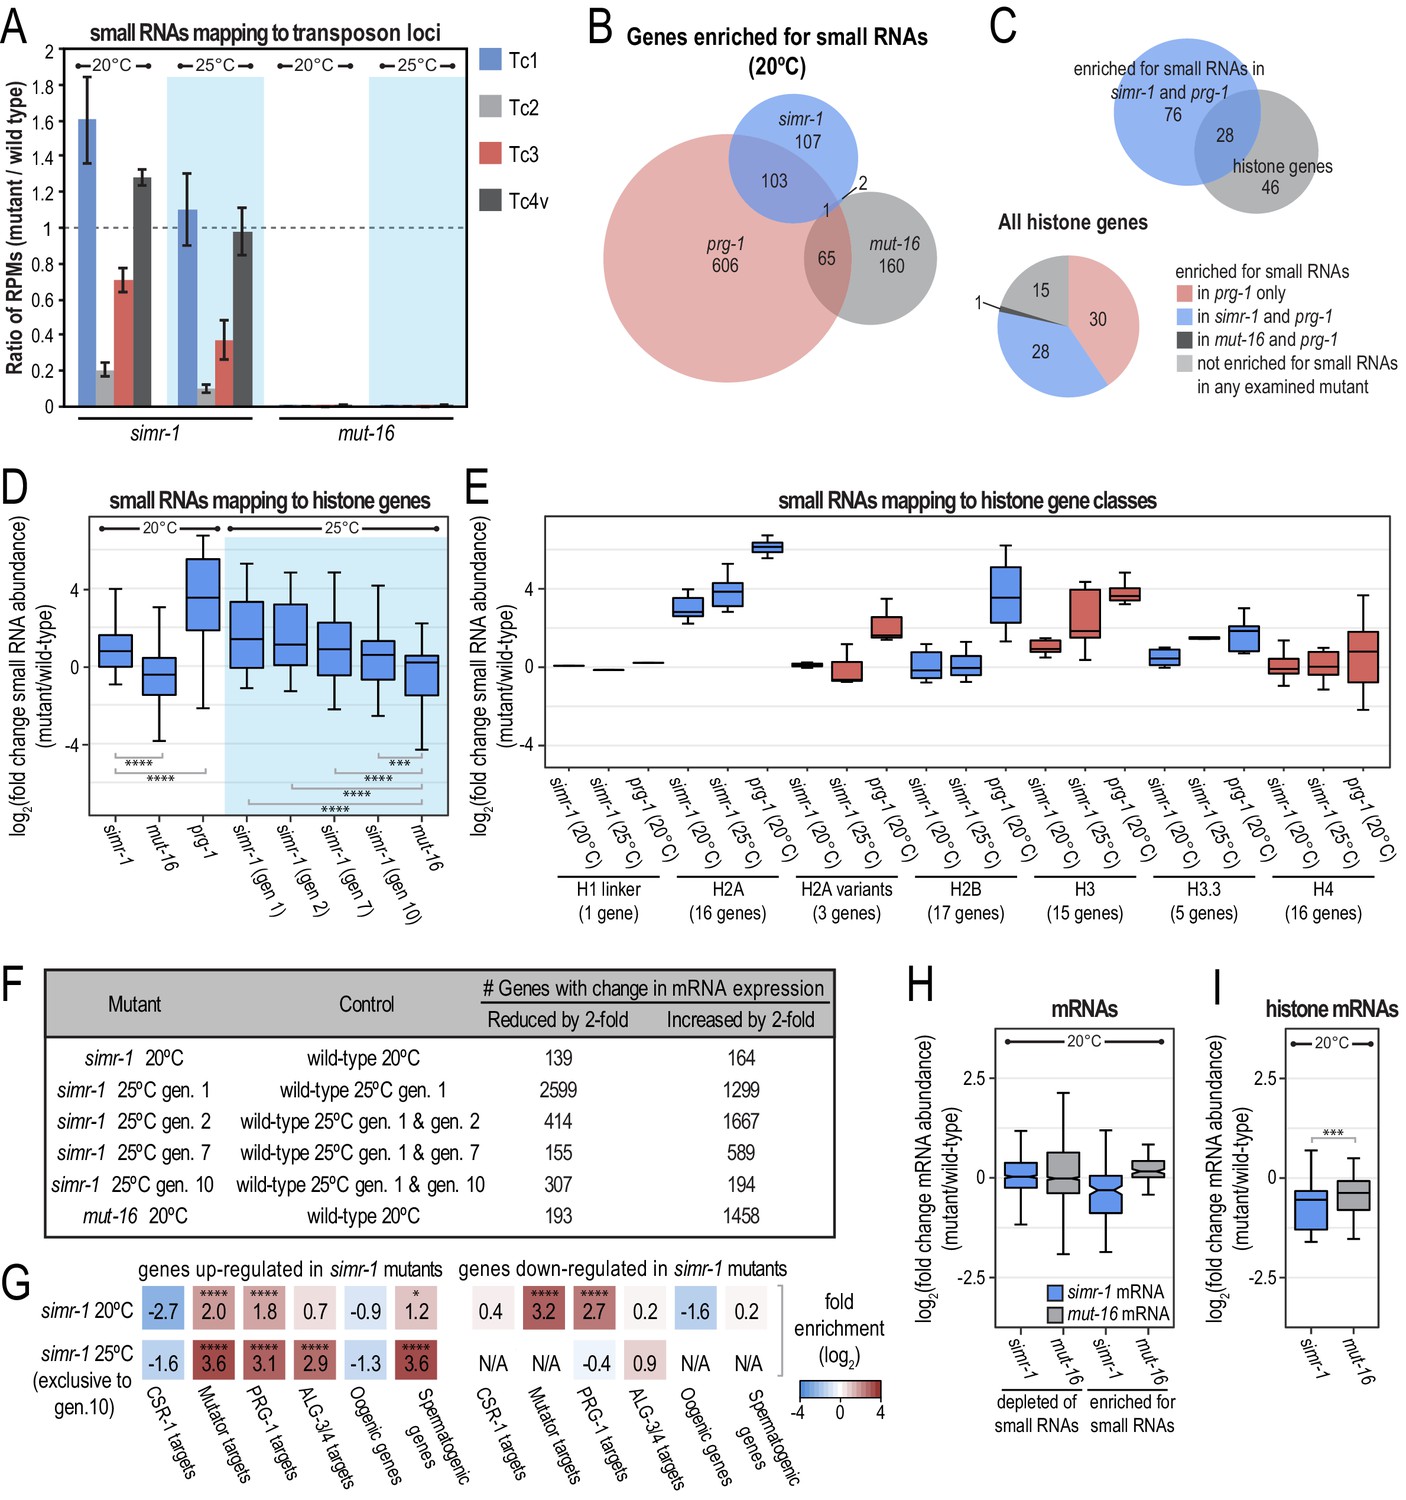
simr-1 mutants display reduced small RNAs mapping to piRNA-dependent transposons and increased small RNAs mapping to histone genes.
(A) Ratio of transposon-mapping small RNA reads per million total reads in simr-1 mutants and mut-16 mutants raised at 20°C or a single generation at 25°C compared to wild-type shows that small RNAs mapping to Tc2 and Tc3 depend on SIMR-1, but those mapping to Tc1 and Tc4v do not. Error bars indicate standard deviation of two replicate libraries. (B) Venn diagram indicating overlap between genes enriched for small RNAs in simr-1 mutants, prg-1 mutants, and mut-16 mutants. (C) Venn diagram (top) of the 104 genes enriched for small RNAs in both simr-1 and prg-1 mutants compared to a list of all histone genes. A pie chart (bottom) of all histone genes shows the number of genes enriched for small RNAs in prg-1, simr-1, and mut-16 mutants compared to wild-type. (D) Box plot displays small RNAs mapping to histone genes in simr-1 mutants raised at 20°C, a single generation at 25°C, or two, seven, or 10 generations at 25°C, mut-16 mutants at 20°C or 25°C, and prg-1 mutants at 20°C compared to wild-type animals at the same temperature and generation, demonstrating that small RNAs mapping to histone genes increase at all temperatures in simr-1 mutants and in prg-1 mutants but not mut-16 mutants. (E) Box plot displays small RNAs mapping to histone gene classes in simr-1 mutants raised at 20°C or a single generation at 25°C and prg-1 mutants at 20°C compared to wild-type animals, demonstrating that small RNAs mapping to some histone gene classes increase in both simr-1 mutants and in prg-1 mutants while others increase only in prg-1 mutants. (F) Table indicating the number of genes for which the mRNA expression is either increased or reduced by at least two-fold for each indicated mutant. All genes met the requirements of having a DESeq2 adjusted p-value of ≤0.05 but no minimum read count was required. (G) Enrichment analysis (log2(fold enrichment)) examining the overlap of genes up and down-regulated in simr-1 mutants with known targets of the CSR-1, mutator, PRG-1 and ALG-3/4 small RNA pathways and oogenesis and spermatogenesis-enriched genes. Color of boxes correlates with fold enrichment (red) or depletion (blue). Statistical significance for enrichment was calculated using the Fisher’s Exact Test function in R. (H) Box plot displays mRNA expression in simr-1 (blue) or mut-16 (grey) relative to wild-type for genes that are enriched or depleted of small RNAs in the same mutants. (I) Box plot displays histone mRNA expression in simr-1 (blue) or mut-16 (grey) relative to wild-type, demonstrating that histone mRNA expression is reduced in simr-1 mutant animals. n.s. denotes not significant and indicates a p-value>0.05, * indicates a p-value≤0.05, ** indicates a p-value≤0.01, *** indicates a p-value≤0.001, **** indicates a p-value≤0.0001. See Supplementary file 8 for more details regarding statistical analysis.
Figure 6—figure supplement 1
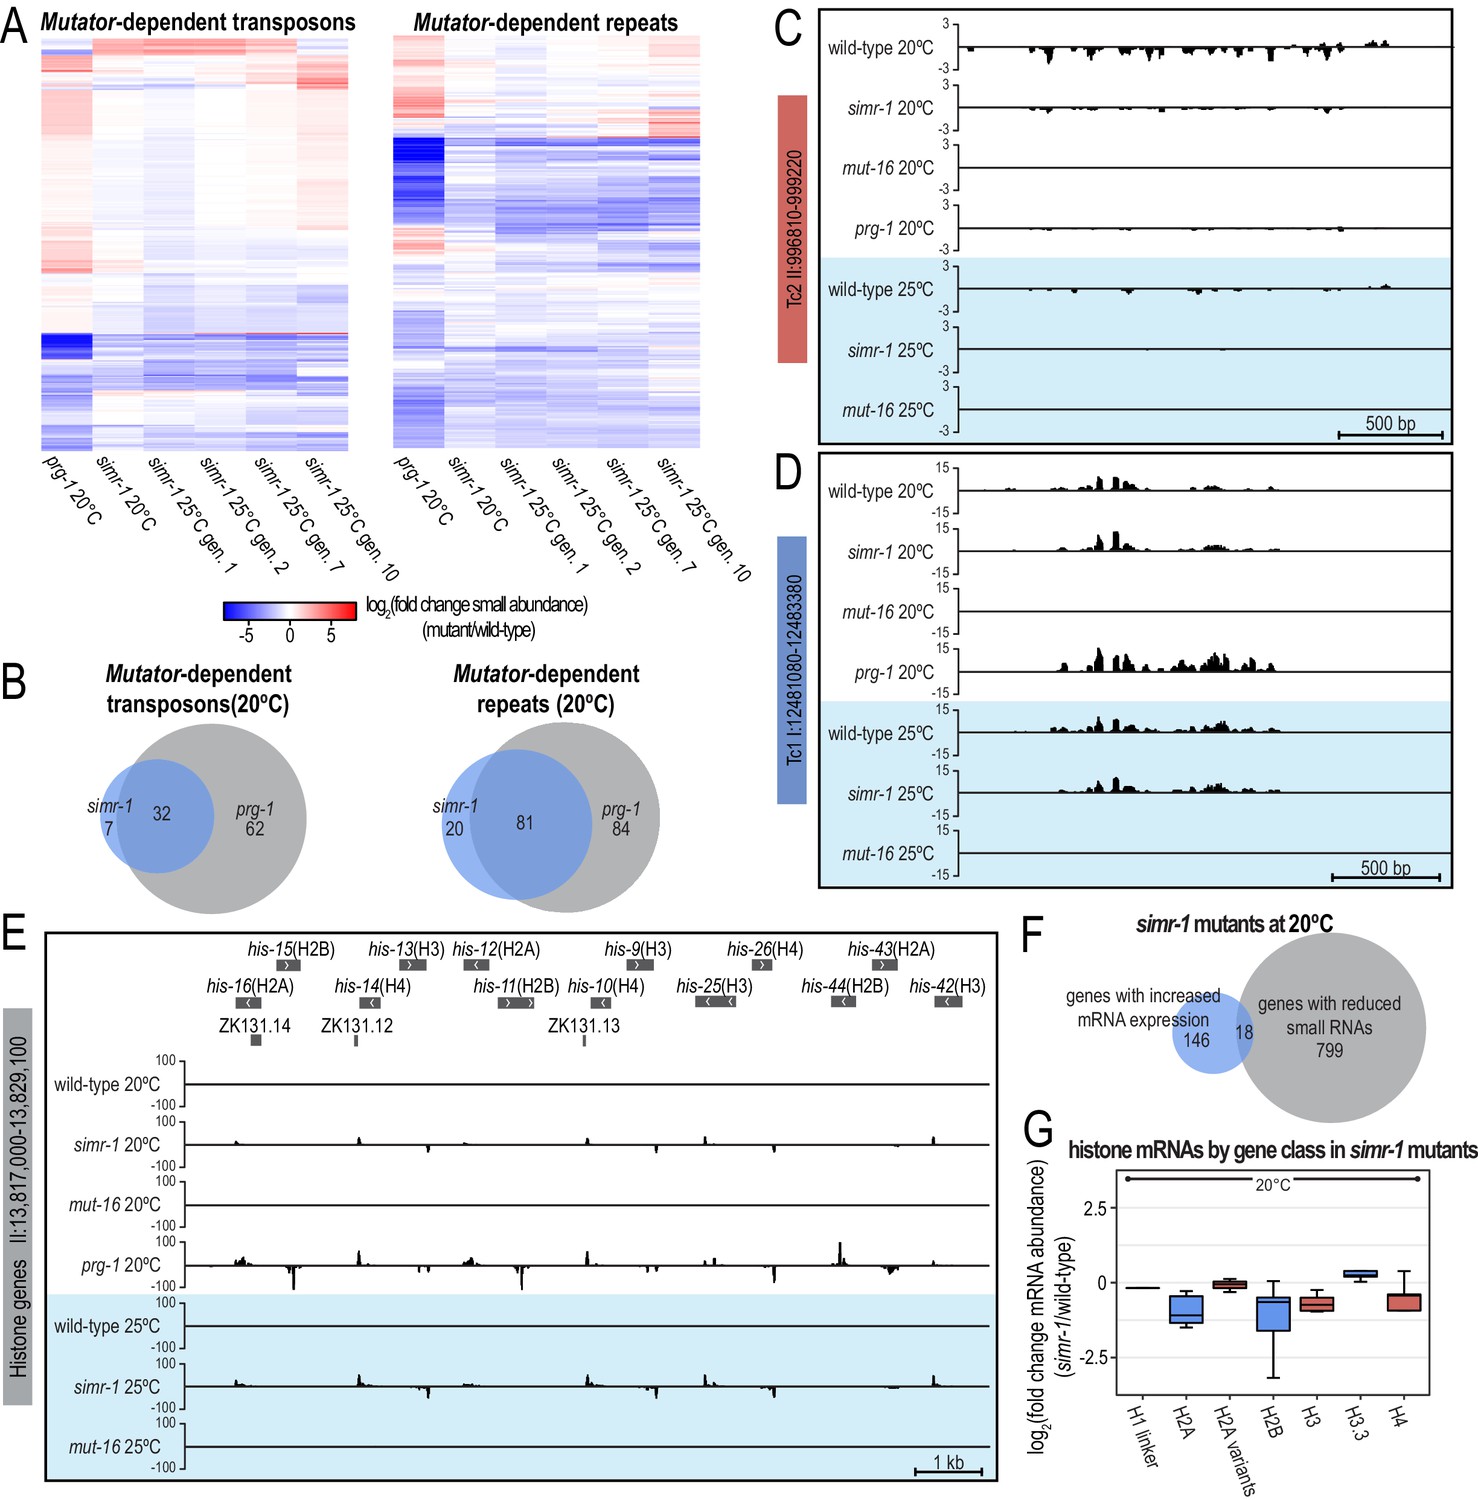
Small RNAs mapping to piRNA target transposons are reduced and small RNAs mapping to histone genes are increased in simr-1 mutants.
(A) Heat maps displaying small RNAs levels targeting mutator-dependent transposons and repeats in prg-1 and simr-1 mutants raised at 20°C, and simr-1 mutants raised at 25°C for one, two, seven, or 10 generations compared to wild-type at the same temperature and generation. (B) Venn diagrams showing the overlap of mutator-dependent transposons (left) or mutator-dependent repeats (right) depleted of small RNAs in simr-1 mutants compared to those depleted of small RNAs in prg-1 mutants at 20°C. (C,D) Small RNA distribution across two transposon loci in wild-type, simr-1 mutants, mut-16 mutants, and prg-1 mutants at 20°C and in wild-type, simr-1 mutants, and mut-16 mutants after a single generation at 25°C. The Tc2 locus (C) requires SIMR-1, PRG-1 and MUT-16 for wild-type small RNA levels, while the Tc1 locus (D) requires MUT-16 but not SIMR-1 or PRG-1 for small RNA production. (E) Small RNA distribution across a histone gene cluster in wild-type, simr-1 mutants, mut-16 mutants, and prg-1 mutants at 20°C and in wild-type, simr-1 mutants, and mut-16 mutants after a single generation at 25°C, shows that siRNAs targeting histone genes increase in simr-1 mutants and prg-1 mutants but not mut-16 mutants. (F) Venn diagram showing the overlap of genes with increased mRNA expression compared to genes with reduced small RNAs in simr-1 mutants raised at 20°C. (G) Box plot displaying mRNAs mapping to the histone gene classes in simr-1 mutants raised at 20°C, shows that distinct histone gene classes have reduced mRNA expression in simr-1 mutants.
Figure 7 with 1 supplement
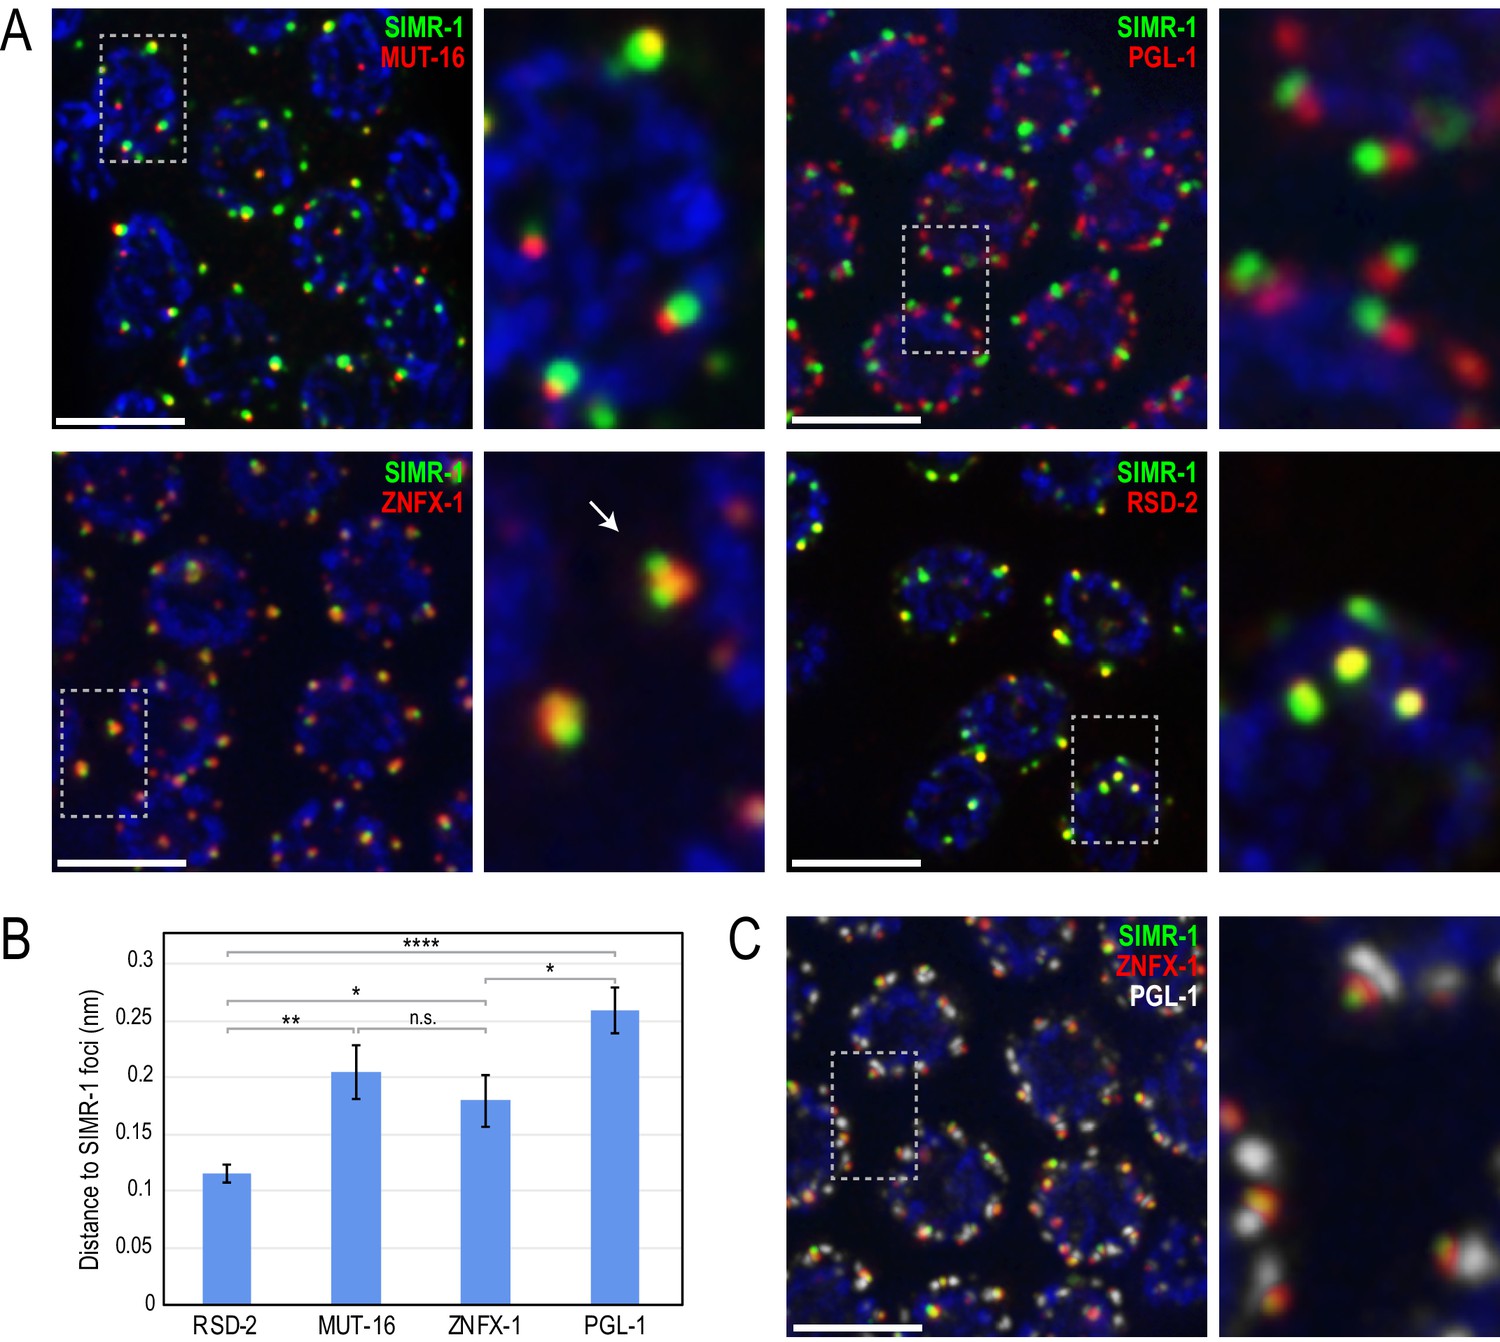
SIMR-1 localizes to foci adjacent to P granules and Mutator foci.
(A) Immunostaining of SIMR-1 (green) with MUT-16 (red, top left), PGL-1 (red, top right), ZNFX-1 (red, bottom left), and RSD-2 (red, bottom right) demonstrates that SIMR-1 localizes to foci near Mutator foci (MUT-16), P granules (PGL-1), and Z granules (ZNFX-1) but overlaps most substantially with RSD-2 foci. Arrow indicates an example of a single Z granule associated with two SIMR-1 foci. (B) Bar graph showing distance between the centers of fluorescence for indicated proteins to SIMR-1 (mean +/- SEM). See Materials and Methods for description of quantification methods. n.s. denotes not significant and indicates a p-value>0.05, * indicates a p-value≤0.05, ** indicates a p-value≤0.01, **** indicates a p-value≤0.0001. See Supplementary file 8 for more details regarding statistical analysis. (C) Immunostaining of SIMR-1 (green), ZNFX-1 (red), and PGL-1 (white) allows for visualization of the stacked SIMR/Z granule/P granule foci. All images are projections of 3D images following deconvolution. DAPI is blue in all panels and scale bars are 5 μm.
-
Figure 7—source data 1
Data used to generate Figure 7B.
- https://cdn.elifesciences.org/articles/56731/elife-56731-fig7-data1-v2.xlsx
Figure 7—figure supplement 1
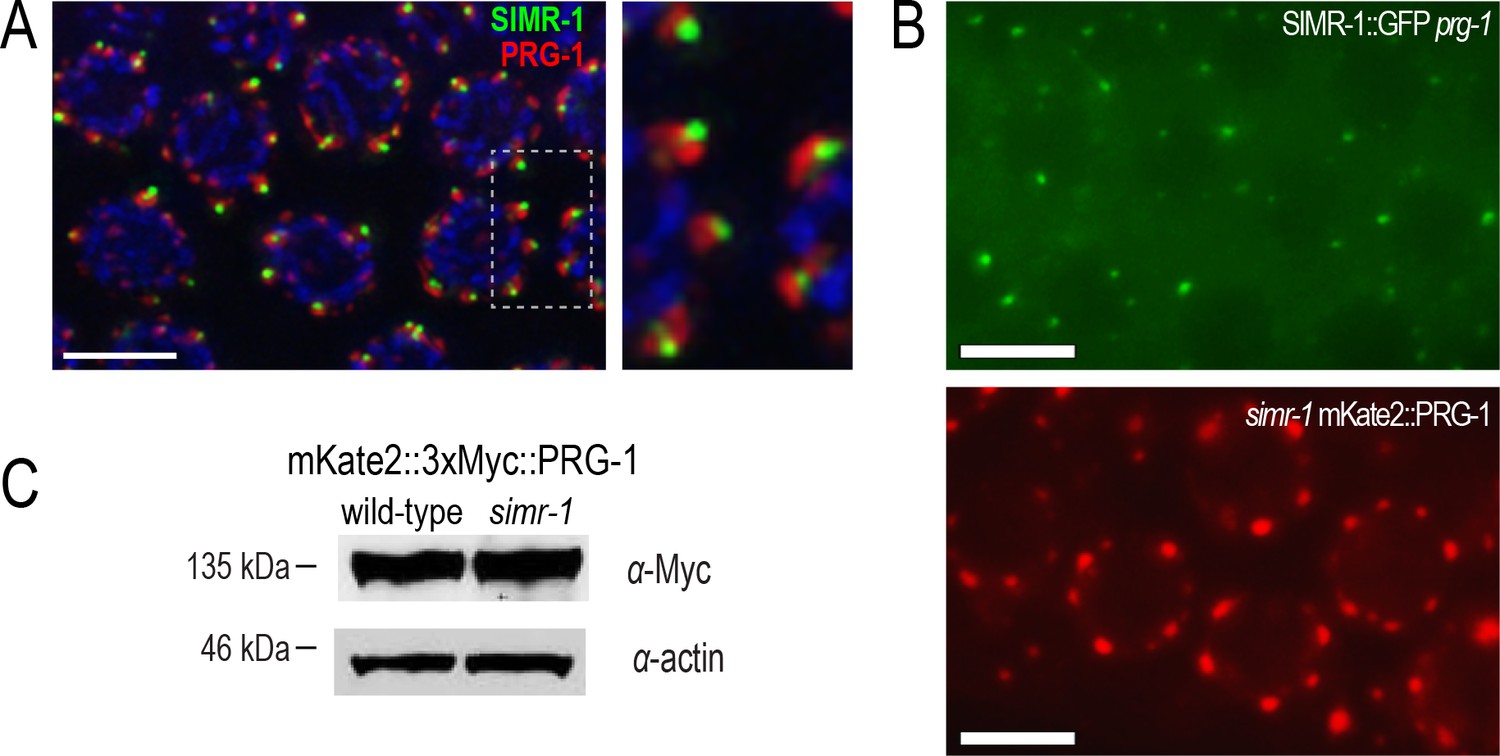
SIMR-1 and PRG-1 localize independently and to distinct granules.
(A) Immunostaining of SIMR-1::GFP (green) and PRG-1::mKate (red) demonstrates that SIMR-1 and PRG-1 localize near one another but their localization is not coincident. (B) Live imaging of SIMR-1::GFP in a prg-1 mutant (top) and PRG-1::mKate in a simr-1 mutant (bottom) indicate that prg-1 is not required for SIMR-1 foci formation, nor is simr-1 required for PRG-1 localization to P granules. (C) Western blot of mKate2::3xMyc::PRG-1 in a wild-type or simr-1 mutant background demonstrate that the simr-1 mutation does not affect PRG-1 protein expression. Actin protein is shown as a loading control. Scale bars, 5 μm.
Additional files
-
Source code 1
Python script to calculate reads per million (RPM) over a genomic region.
- https://cdn.elifesciences.org/articles/56731/elife-56731-code1-v2.py
-
Source code 2
Python script to generate WIG files for visualization of tracks in IGV.
- https://cdn.elifesciences.org/articles/56731/elife-56731-code2-v2.py
-
Supplementary file 1
Known components of the L4 and adult germ granules.
- https://cdn.elifesciences.org/articles/56731/elife-56731-supp1-v2.xlsx
-
Supplementary file 2
Proteins identified in MUT-16 IP.
Those examined further highlighted in blue.
- https://cdn.elifesciences.org/articles/56731/elife-56731-supp2-v2.xlsx
-
Supplementary file 3
Small expression in simr-1, mut-16, and prg-1 mutant animals.
- https://cdn.elifesciences.org/articles/56731/elife-56731-supp3-v2.xlsx
-
Supplementary file 4
mRNA target predictions for simr-1-depleted piRNAs.
- https://cdn.elifesciences.org/articles/56731/elife-56731-supp4-v2.xlsx
-
Supplementary file 5
mRNA expression in simr-1 and mut-16 mutant animals.
- https://cdn.elifesciences.org/articles/56731/elife-56731-supp5-v2.xlsx
-
Supplementary file 6
Key resources table.
- https://cdn.elifesciences.org/articles/56731/elife-56731-supp6-v2.xlsx
-
Supplementary file 7
Oligonucleotides sequences used in this study.
- https://cdn.elifesciences.org/articles/56731/elife-56731-supp7-v2.xlsx
-
Supplementary file 8
Statistical analysis.
- https://cdn.elifesciences.org/articles/56731/elife-56731-supp8-v2.xlsx
-
Supplementary file 9
Sequencing library statistics.
- https://cdn.elifesciences.org/articles/56731/elife-56731-supp9-v2.xlsx
-
Transparent reporting form
- https://cdn.elifesciences.org/articles/56731/elife-56731-transrepform-v2.docx
Download links
A two-part list of links to download the article, or parts of the article, in various formats.
Downloads (link to download the article as PDF)
Open citations (links to open the citations from this article in various online reference manager services)
Cite this article (links to download the citations from this article in formats compatible with various reference manager tools)
A tudor domain protein, SIMR-1, promotes siRNA production at piRNA-targeted mRNAs in C. elegans
eLife 9:e56731.
https://doi.org/10.7554/eLife.56731


