A powerful drug combination strategy targeting glutamine addiction for the treatment of human liver cancer
- State Key Laboratory of Oncogenes and Related Genes, Shanghai Cancer Institute, Renji Hospital, Shanghai Jiao Tong University School of Medicine, China
- Division of Molecular Carcinogenesis, Oncode Institute. The Netherlands Cancer Institute, Netherlands
- Biomolecular Mass Spectrometry and Proteomics, Bijvoet Center for Biomolecular Research, Utrecht University, Netherlands
- Department of Cell and Chemical Biology, Leiden University Medical Centre, Netherlands
- Department of Pathology, Eastern Hepatobiliary Surgery Hospital, Second Military Medical University, China
- Department of Biochemistry and Cell Biology, Faculty of Veterinary Medicine, Utrecht University, Netherlands
Figures
Figure 1
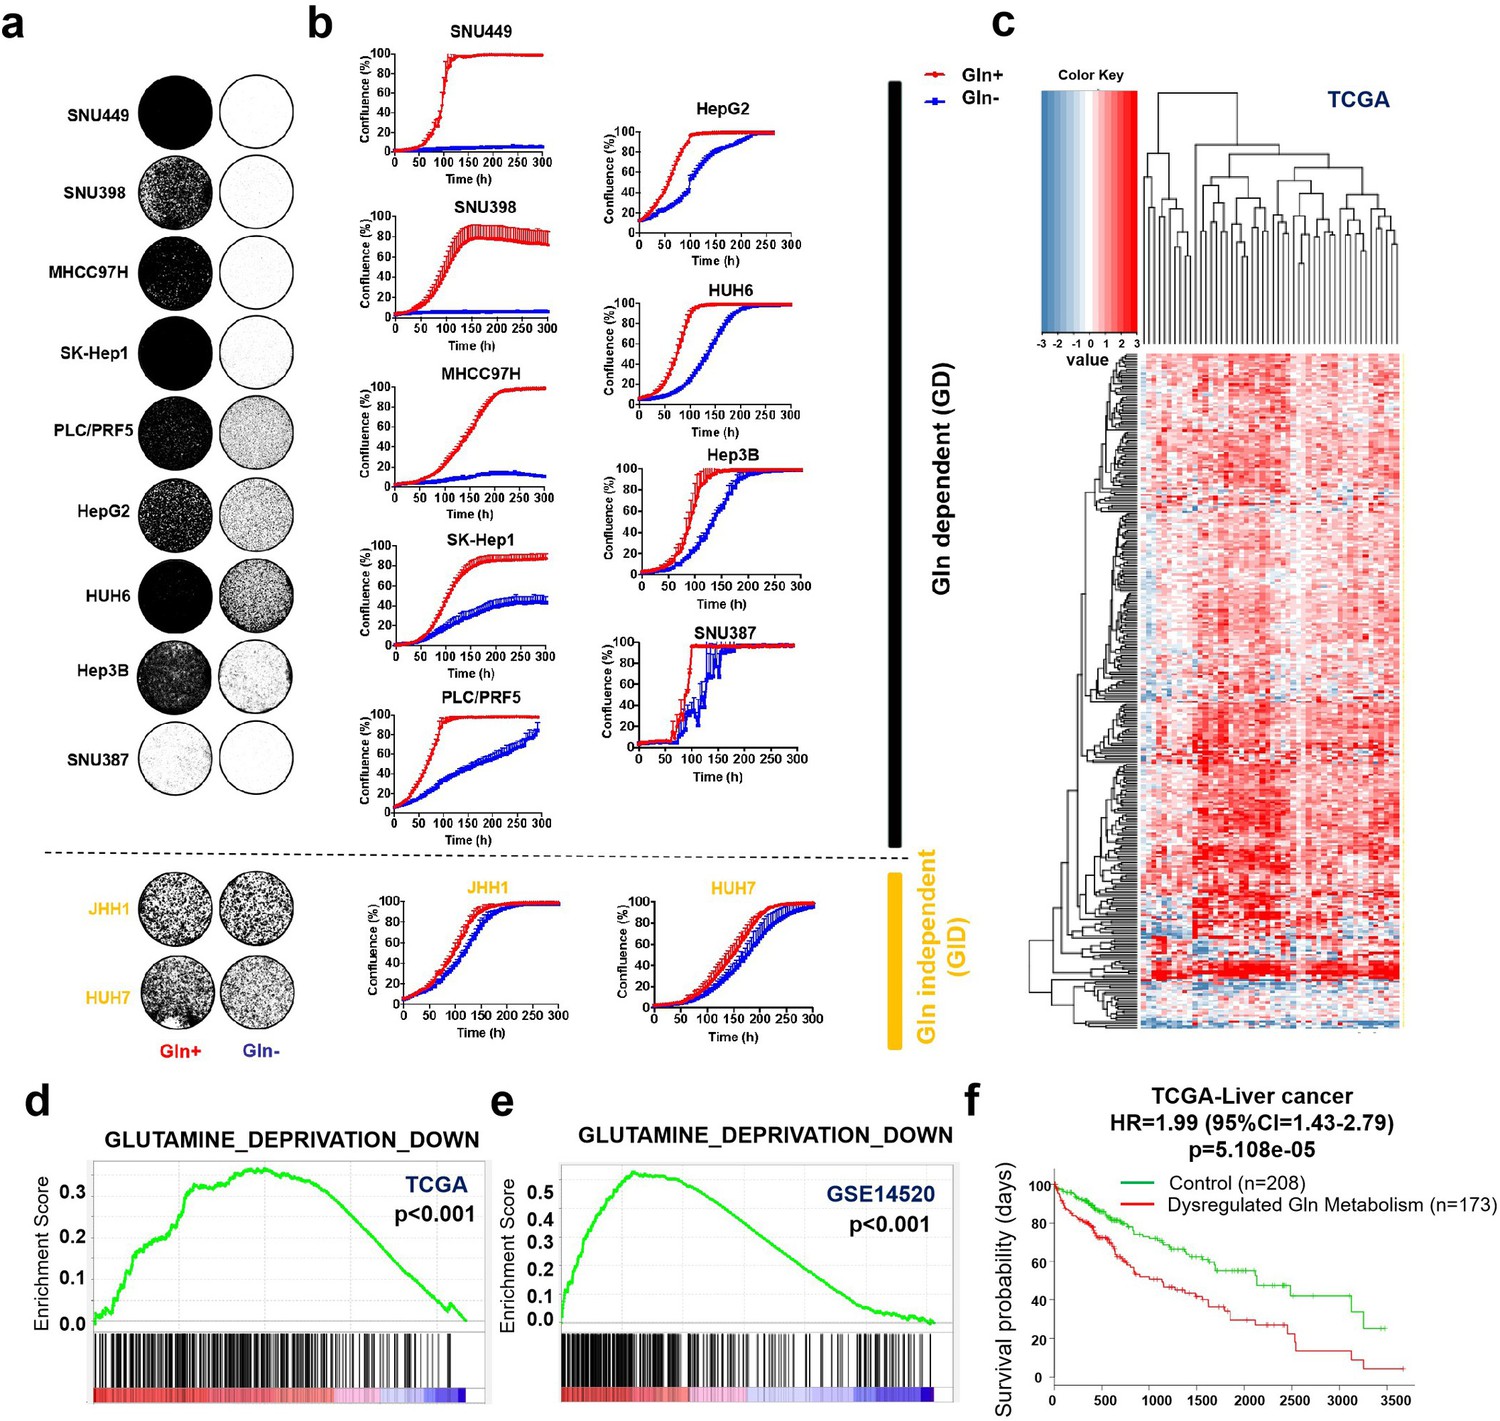
Liver cancer is addicted to glutamine.
(a, b) A total of 11 liver cancer cell lines were cultured with 4 mM glutamine (Gln+) or glutamine deprivation (Gln-). Proliferation was assessed by colony formation assay (a) and IncuCyte assay (b), respectively. Liver cancer cell lines were divided into Gln dependent (GD) and Gln independent (GID) subtypes, respectively. (c) Differential expression profiles of Gln metabolism-related genes (Gene Set: PENG_GLUTAMINE_DEPRIVATION_DN) in 50 paired HCC samples in TCGA cohort. Heatmap illustrated the log2 fold-change values of Gln metabolism-related genes between cancerous tissues and their corresponding noncancerous liver tissues. Red color indicates gene upregulation; blue color indicates gene downregulation. Each column indicates a patient; each row indicates a gene. (d, e) Gene set enrichment analysis (GSEA) enrichment of cancerous tissues versus corresponding noncancerous tissues for gene set ‘PENG_GLUTAMINE_DEPRIVATION_DN’ in TCGA (d) and GSE14520, respectively (e). (f) Expression of Gln metabolism-related genes correlated with poor prognosis of liver cancer patients in TCGA. HR: hazard ratio; CI: confidence interval.
-
Figure 1—source data 1
Liver cancer is addicted to glutamine.
- https://cdn.elifesciences.org/articles/56749/elife-56749-fig1-data1-v1.xls
Figure 2

The glutaminase inhibitor CB-839 monotherapy shows an insufficient anti-tumor effect in liver cancer.
(a) mRNA levels of GLS1 in the cohort of GSE14520 (n = 229; probe for GLS1: 203159_at; N: nontumor tissues, T: tumor tissues). Data are represented as mean ± SEM. (b) Log2 fold change of GLS1 mRNA in 229 paired HCC samples in the cohort of GSE14520 (probe for GLS1: 203159_at; N: nontumor tissues, T: tumor tissues). (c) GLS1 expression and Kaplan-Meier OS analysis for patients with HCC in TCGA cohort (n = 364). (d–f) IHC staining analyses of GLS1 were performed in 377 patients with HCC. The patients were divided into two groups: GLS1low group (n = 175) and GLS1high group (n = 202). (d) Typical immunostaining images of GLS1 in GLS1low group and GLS1high group were shown. Scale bars = 100 μm. The Kaplan-Meier analysis for OS (e) and DFS (f) was performed according to GLS1 levels. (g, h) Liver cancer cell lines were treated with increasing concentrations of CB-839. Proliferation and viability were assessed by colony formation assay (g) and CellTiter Blue assay (h), respectively. (i) Lysates of liver cancer cell lines were western blotted for two splice variants of GLS1 (KGA and GAC). HSP90 served as a control. ***p<0.001, Student’s t test.
-
Figure 2—source data 1
The glutaminase inhibitor CB-839 monotherapy shows insufficient anti-tumor effect in liver cancer.
- https://cdn.elifesciences.org/articles/56749/elife-56749-fig2-data1-v1.xls
Figure 3 with 1 supplement
A compounds screen identifies ASCT-2 inhibitor V-9302 sensitizing GD liver cancer cells to CB-839 treatment.
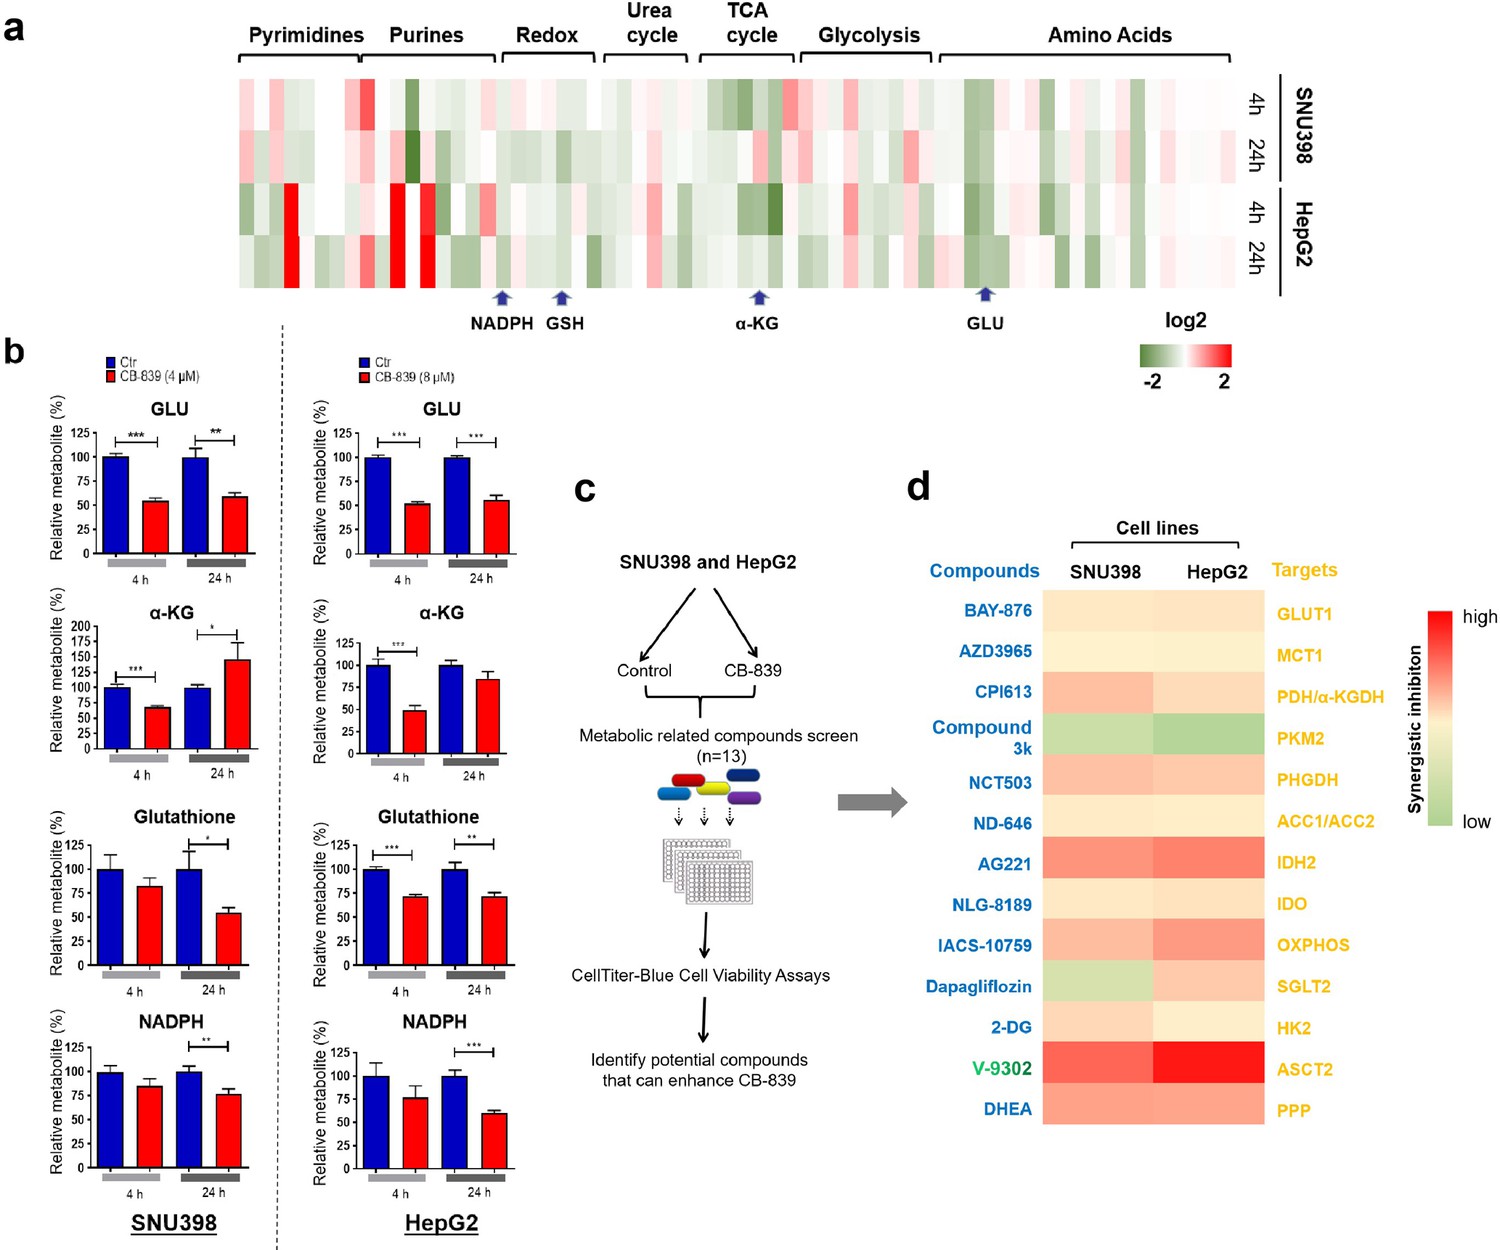
(a) Heatmap representation of 66 metabolites between treated and untreated groups. Intracellular metabolite levels measured by LC/MS-MS in SNU398 and HepG2 cells treated with DMSO or CB-839 (SNU398: 4 μM; HepG2: 8 μM) for 4 and 24 hr, respectively. These metabolites were mapped to seven major pathways including those of the glycolytic system, TCA cycle, urea cycle, redox reaction, purine and pyrimidine metabolism. Each column represented a metabolite. Deeper red color represents higher content; conversely, deeper green color represents lower content. (b) Graphic representation of glutamate (GLU), α-ketoglutarate (α-KG), glutathione (GSH), NADPH were shown in the LC/MS-MS screen in a. Data are represented as mean ± SEM, n = 3 independent experiments. (c) Schematic outline of the compounds screen on the basis of CB-839 treatment: Two GD cell lines, SNU398 and HepG2, were first treated with 4 and 8 μM CB-839, respectively. Then, 13 compounds inhibiting a variety of druggable tumor metabolism targets were tested at their IC50 concentrations for 4 d. (d) Heatmap represents the enhanced percentage of viability inhibition by 13 compounds in SNU398 and HepG2, respectively. Deeper red color represents higher enhance; conversely, deeper green color represents lower enhance. Statistical significance was assessed using a Student’s t test. *p<0.05, **p<0.01, ***p<0.001.
-
Figure 3—source data 1
Intracellular metabolite levels were measued by LC/MS-MS in SNU398 and HepG2 cells treated with DMSO or CB-839.
- https://cdn.elifesciences.org/articles/56749/elife-56749-fig3-data1-v1.xls
-
Figure 3—source data 2
Data related to Figure 3d.
- https://cdn.elifesciences.org/articles/56749/elife-56749-fig3-data2-v1.docx
Figure 3—figure supplement 1
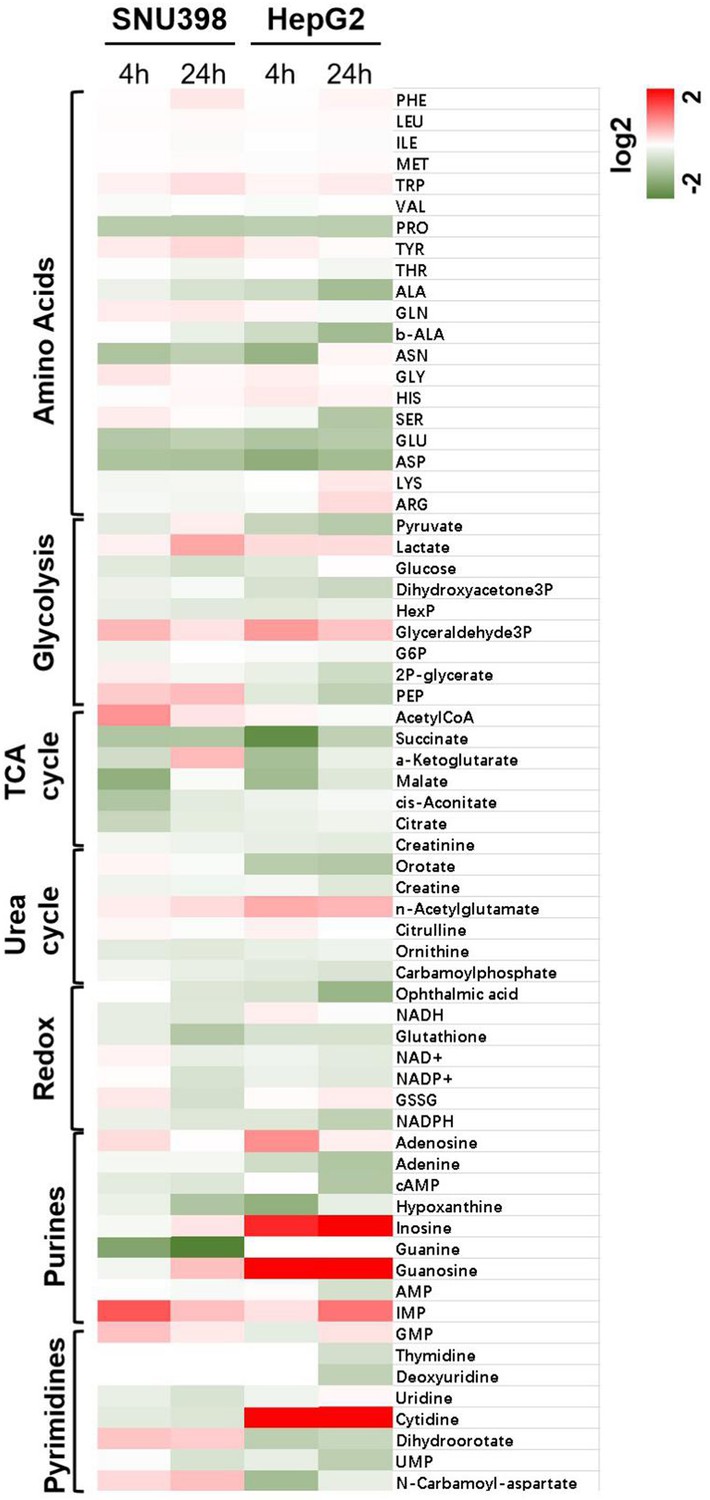
All metabolites shown in Figure 3a were labeled.
Heatmap representation of 66 metabolites between treated and untreated groups. Intracellular metabolite levels measured by LC/MS-MS in SNU398 and HepG2 cells treated with DMSO or CB-839 (SNU398: 4 μM; HepG2: 8 μM) for 4 and 24 hr, respectively.
Figure 4 with 2 supplements
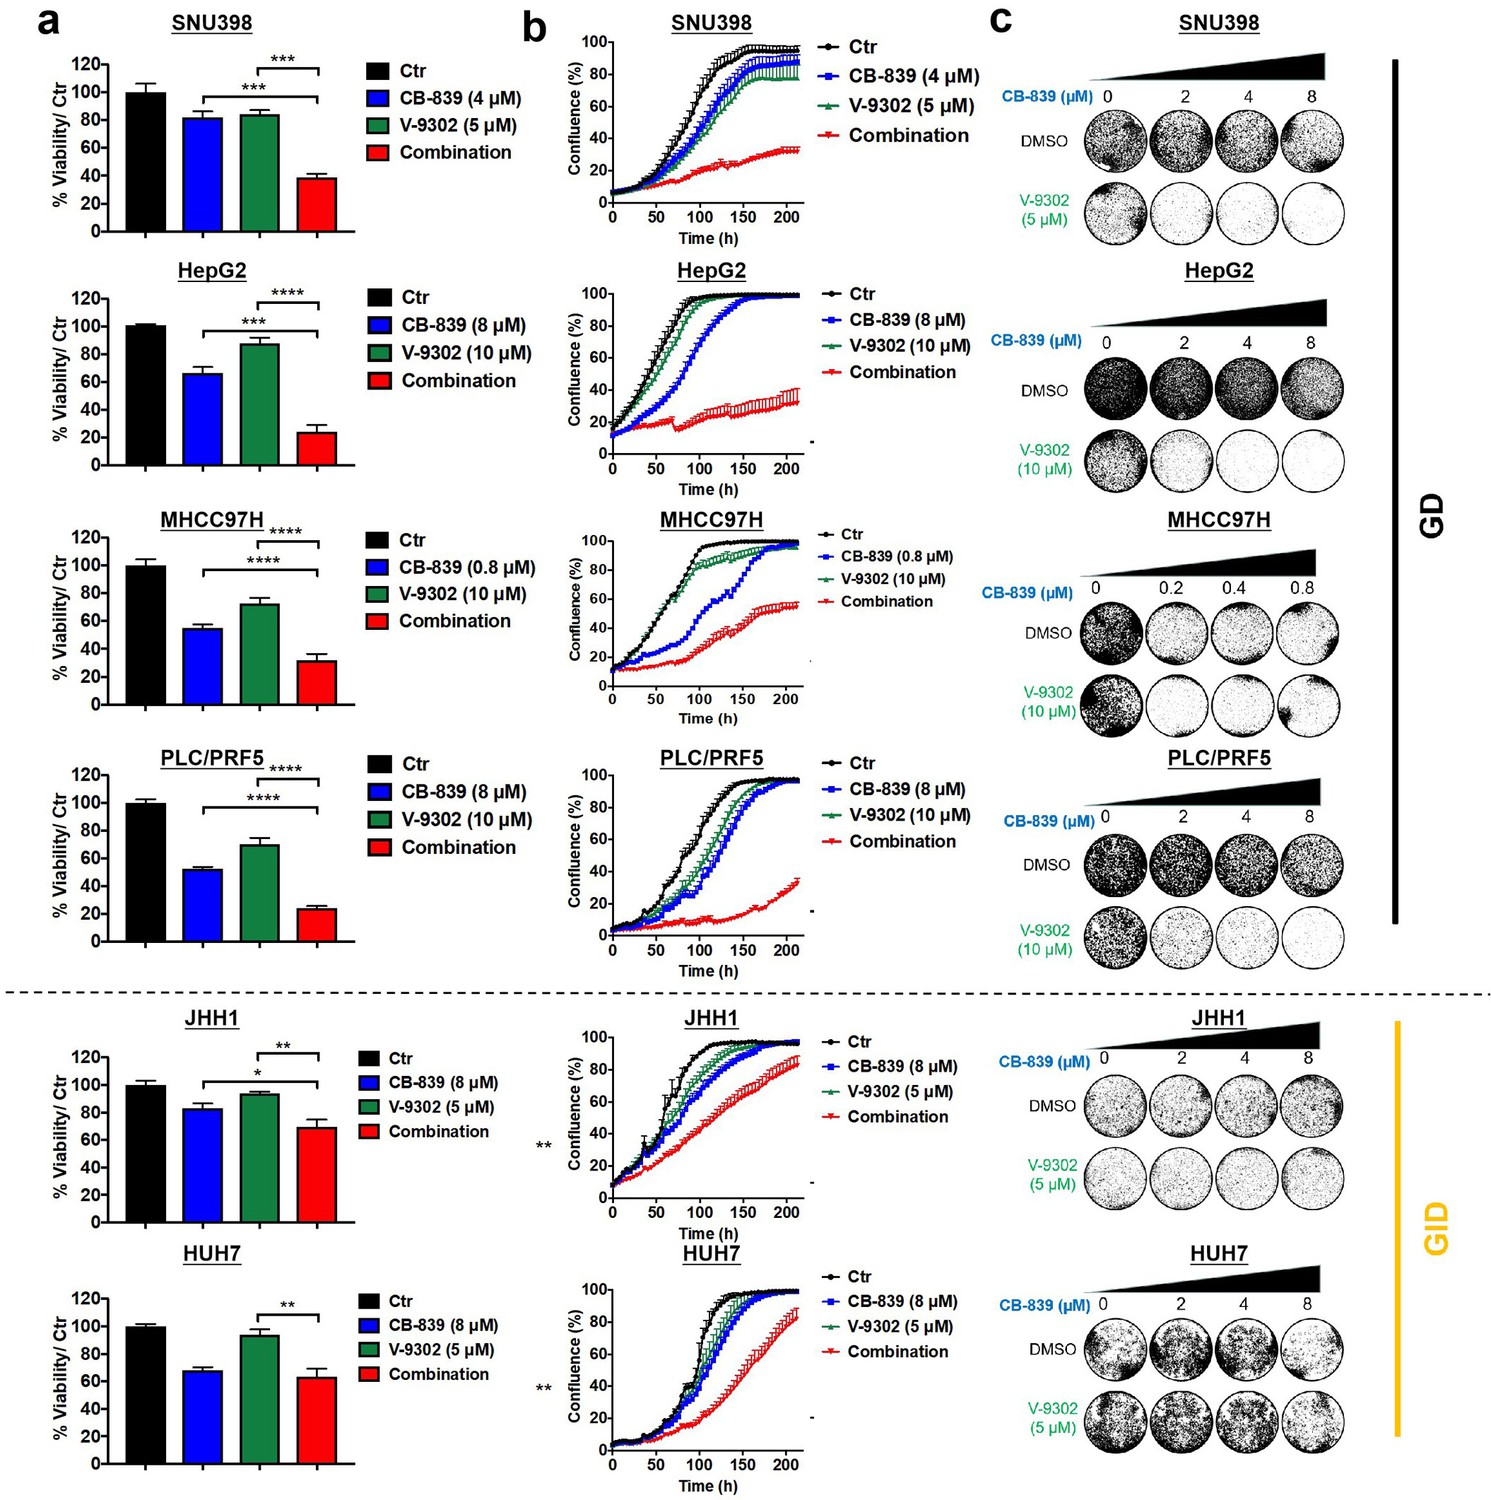
Combination of CB-839 and V-9302 shows potential synergy in multiple GD liver cancer cells.
(a-c) Liver cancer cells (four GD cell lines and two GID cell lines) were treated with CB-839, V-9302, or the combination at the indicated concentration. CellTiter Blue viability assays (a), IncuCyte assays (b) and long-term colony formation assays (c) were performed, respectively. Data are represented as mean ± SEM. Statistical significance was assessed using a Student’s t test. *p<0.05, **p<0.01, ***p<0.001.
-
Figure 4—source data 1
Combination of CB-839 and V-9302 shows potential synergy in multiple GD liver cancer cells.
- https://cdn.elifesciences.org/articles/56749/elife-56749-fig4-data1-v1.xls
Figure 4—figure supplement 1
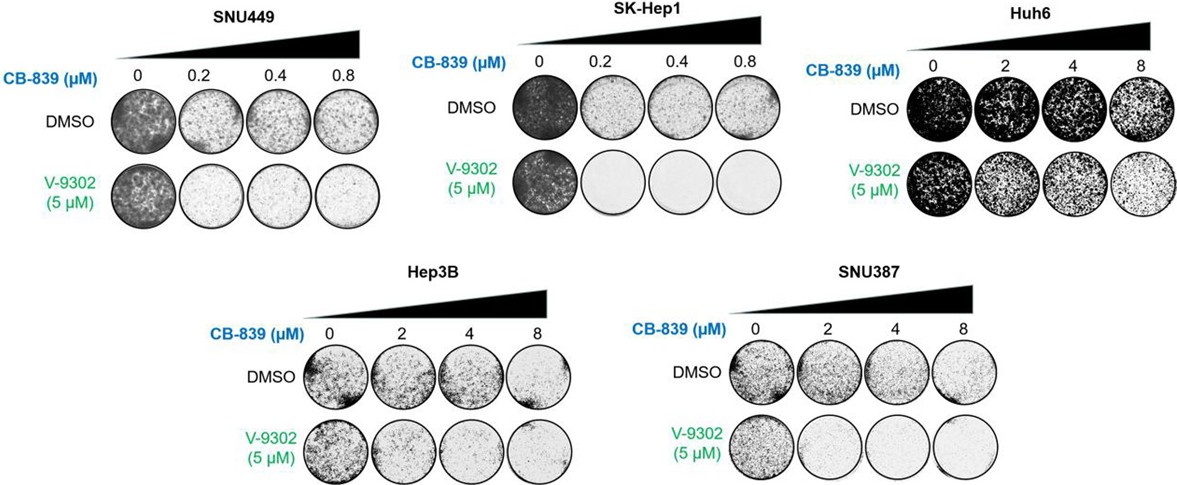
The combination of CB-839 and V-9302 showed an anti-proliferation effect in GD cell lines in vitro.
Liver cancer cell lines (SNU449, SK-Hep1, Huh6, Hep3B, and SNU387) were treated with CB-839, V-9302, or the combination at the indicated concentration. Long-term colony formation assays were performed.
Figure 4—figure supplement 2
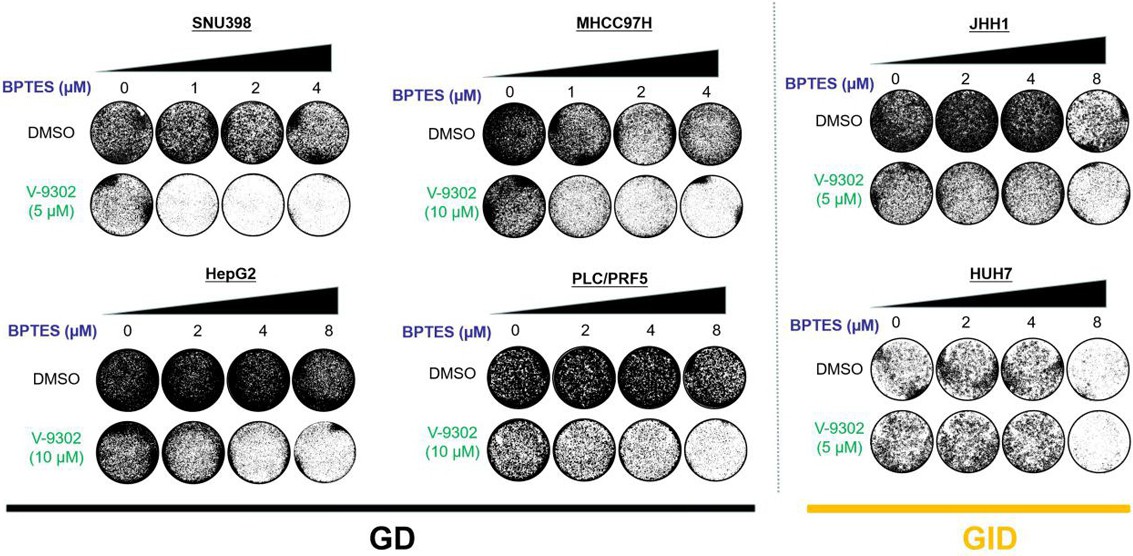
The combination of BPTES and V-9302 showed an anti-proliferation effect in four GD cell lines, but not in two GID cell lines in vitro.
Liver cancer cells (four GD and two GID cell lines) were treated with BPTES, V-9302, or the combination at the indicated concentration. Long-term colony formation assays were performed.
Figure 5
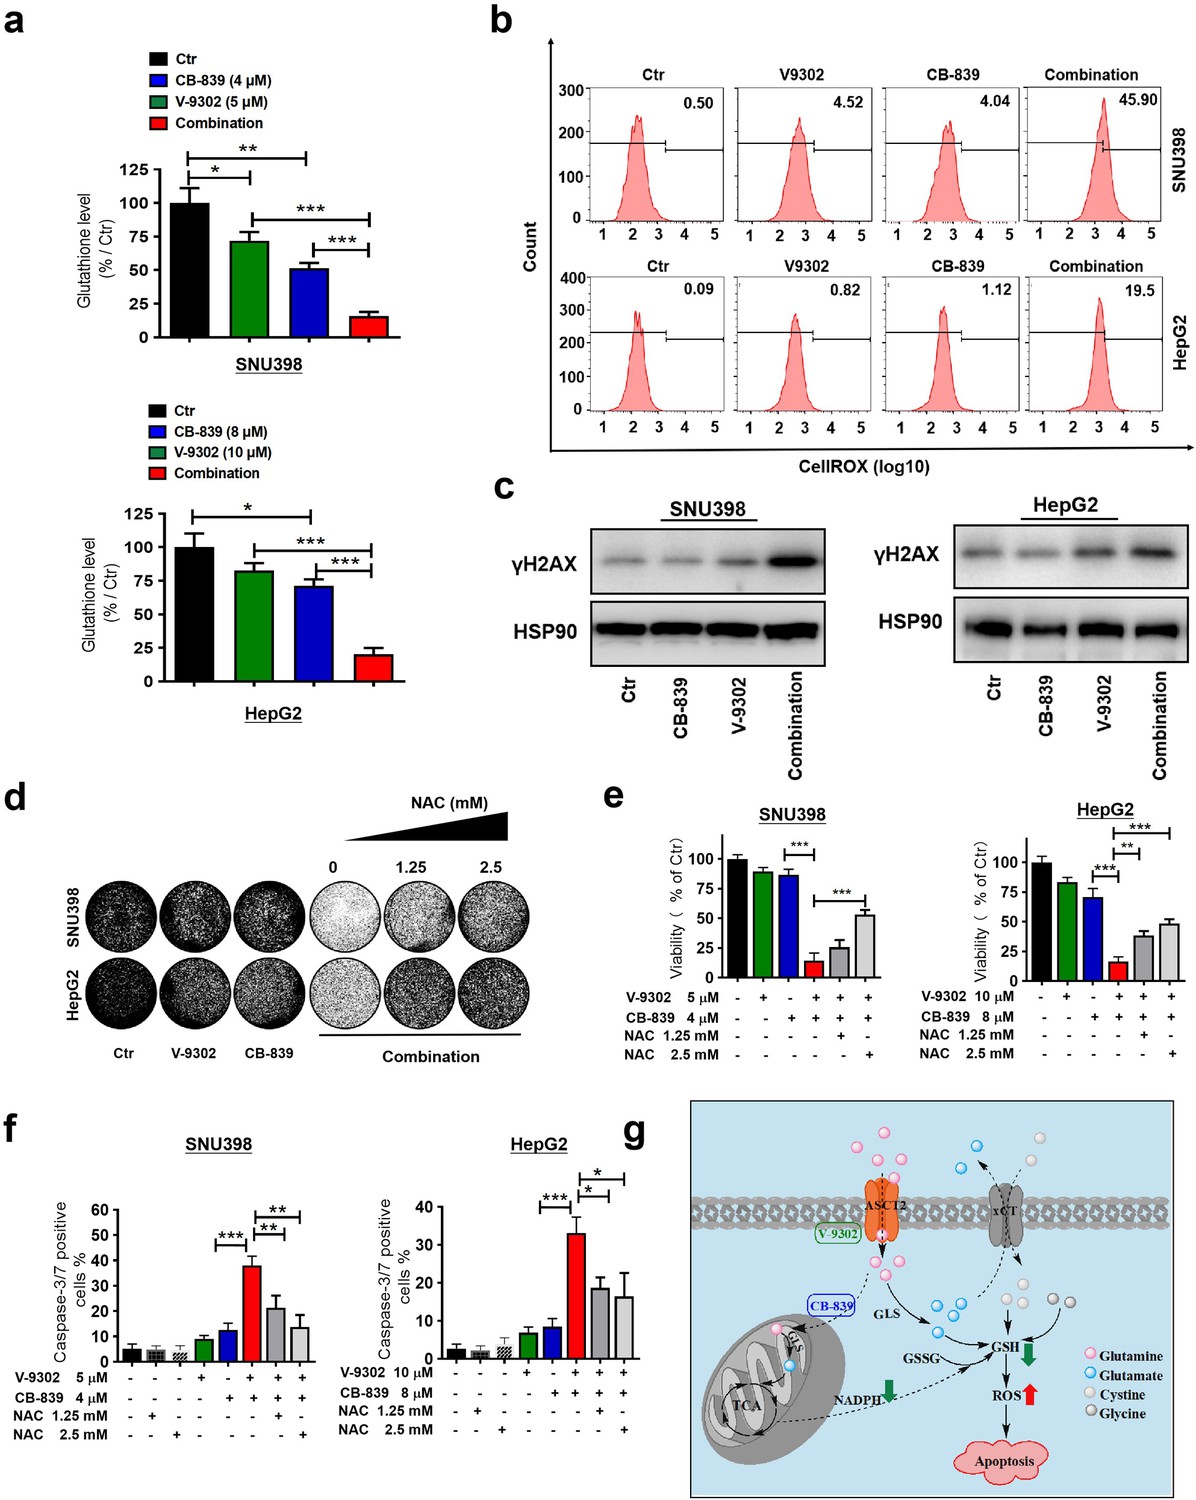
Combination of CB-839 and V-9302 depletes GSH and induces lethal ROS levels in GD liver cancer cells.
(a) Intracellular GSH levels were measured by LC/MS-MS in SNU398 and HepG2 cells treated with indicated drugs for 48 hr, respectively. (b) ROS levels were measured using the CellROX Deep Red flow cytometry assay. (c) Western blot analysis was performed for γH2AX as a DNA damage marker. HSP90 served as a control. (d, e) Long-term colony formation assay and CellTiter-Blue viability assay show rescued proliferation and viability of SNU398 and HepG2 cells after ROS scavenger N-acetyl-cysteine (NAC) treatment. (f) Caspase-3/7 positive percentages of control, NAC, V-9302, CB-839, the combination, or combination plus NAC treated SNU398 and HepG2 cells in the presence of a caspase-3/7 activatable dye. (g) Schematic showing how the combination of CB-839 and V-9302 decreases GSH and induce apoptosis in liver cancer. All the data in this figure are represented as mean ± SEM. Statistical significance was assessed using a Student’s t test. *p<0.05, **p<0.01, ***p<0.001.
-
Figure 5—source data 1
Combination of CB-839 and V-9302 depletes GSH and induces lethal ROS level in GD liver cancer cells.
- https://cdn.elifesciences.org/articles/56749/elife-56749-fig5-data1-v1.xls
Figure 6 with 1 supplement
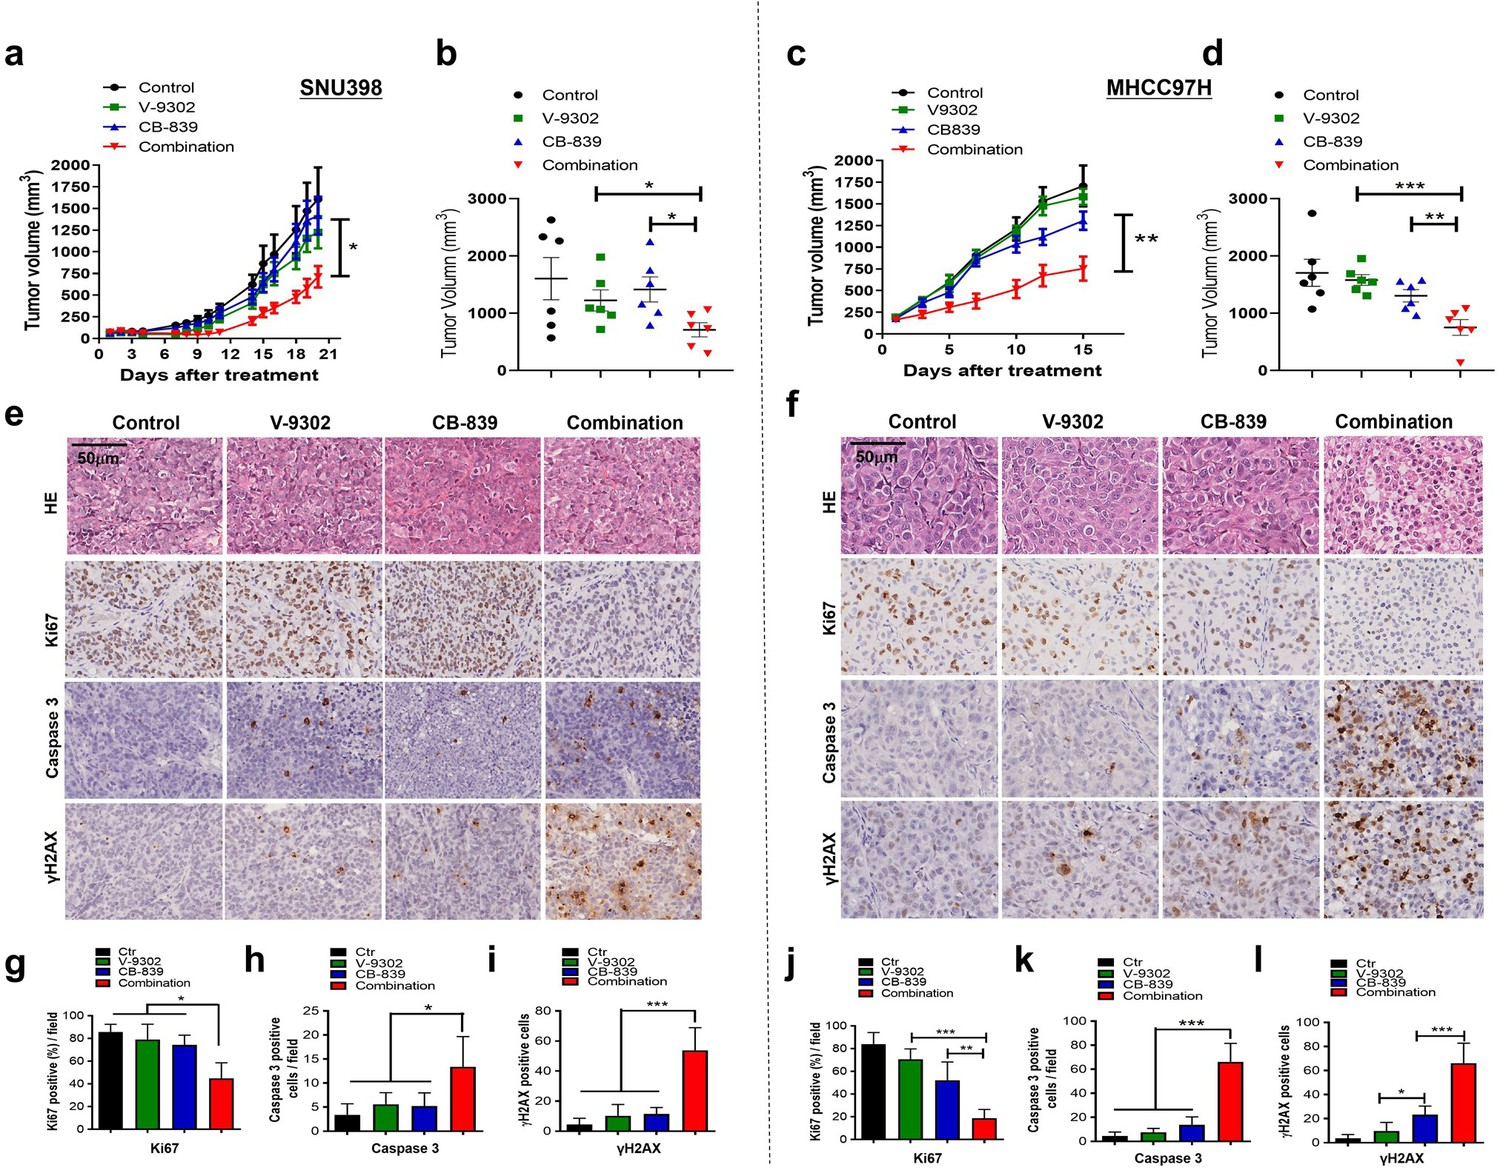
Combined treatment inhibits xenograft growth and induces apoptosis in vivo.
SNU398 and MHCC97H cells were grown as tumor xenografts in BALB/c nude mice. Longitudinal tumor volume progression in SNU398 and MHCC97H tumor-bearing mice treated with vehicle (n = 6), CB-839 (150 mg/kg, oral gavage, twice per day; n = 6), V-9302 (30 mg/kg, intraperitoneal injection; n = 6), or combined therapies (n = 6) for 20 or 15 d, respectively. Growth curve and endpoint tumor volume of SNU398 (a, b) and MHCC97H (c, d) xenografts. (e, f) Representative images of HE, Ki67, cleaved caspase-3, and γH2AX in SNU398 (e) and MHCC97H (f) xenograft models. Scale bars = 50 μm. (g–i) Quantification of Ki67 positive cells (g), cleaved caspase-3 positive cells (h), and γH2AX positive cells (i) in SNU398 xenografts. (j–l) Quantification of Ki67 positive cells (j), cleaved caspase-3 positive cells (k), and γH2AX positive cells (l) in SNU398 xenografts. Data are represented as mean ± SEM. Statistical significance was assessed using a Student’s t test. *p<0.05, **p<0.01, ***p<0.001.
-
Figure 6—source data 1
Combined treatment inhibits xenograft growth and induces apoptosis in vivo.
- https://cdn.elifesciences.org/articles/56749/elife-56749-fig6-data1-v1.xls
Figure 6—figure supplement 1

Combination of CB-839 and V-9302 showed no reduction of mice weight in vivo.
SNU398 and MHCC97H tumor-bearing mice treated with vehicle (n = 6), CB-839 (150 mg/kg, oral gavage, twice per day; n = 6), V-9302 (30 mg/kg, intraperitoneal injection; n = 6), or combined therapies (n = 6) for 20 or 15 d, respectively. Graph shows mean ± SEM.
Author response image 1
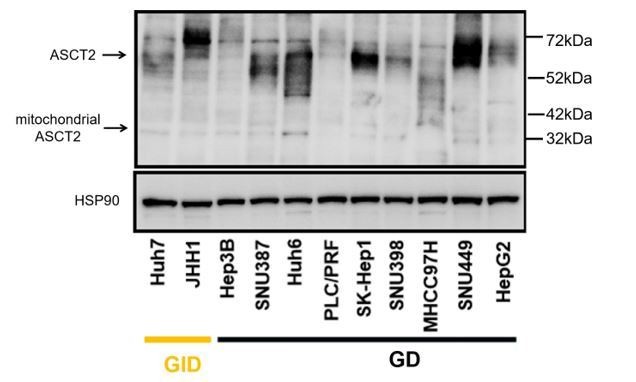
Western blot analysis of the two different splice variants of ASCT2 in liver cancer cell lines.
Tables
Key resources table
| Reagent type (species) or resource | Designation | Source or reference | Identifiers | Additional information |
|---|---|---|---|---|
| Cell line (Homo-sapiens) | Hep3B | ATCC | Cat#:HB-8064 | |
| Cell line (Homo-sapiens) | Huh7 | JCRB | Cat#:JCRB0403; RRID:CVCL_0336 | |
| Cell line (Homo-sapiens) | HepG2 | ATCC | Cat# HB-8065; RRID:CVCL_0027 | |
| Cell line (Homo-sapiens) | SNU398 | ATCC | Cat# CRL-2233; RRID:CVCL_0077 | |
| Cell line (Homo-sapiens) | SNU449 | ATCC | Cat# CRL-2234; RRID:CVCL_0454 | |
| Cell line (Homo-sapiens) | Huh6 | RCB | Cat# RCB1367; RRID:CVCL_4381 | |
| Cell line (Homo-sapiens) | SK-Hep1 | ATCC | Cat# HTB-52; RRID:CVCL_0525 | |
| Cell line (Homo-sapiens) | JHH1 | JCRB | Cat# NIHS0056; RRID:CVCL_2785 | |
| Cell line (Homo-sapiens) | SNU387 | ATCC | Cat# CRL-2237; RRID:CVCL_0250 | |
| Cell line (Homo-sapiens) | PLC/PRF5 | ATCC | Cat# CRL-802 | |
| Cell line (Homo-sapiens) | MHCC97H | RRID:CVCL_4972 | Liver Cancer Institute of Zhongshan Hospital (Shanghai, China) | |
| Chemical compound, drug | CB-839 | Selleck Chemicals | S7655 | |
| Chemical compound, drug | BPTES | Selleck Chemicals | S7753 | |
| Chemical compound, drug | BAY-876 | Selleck Chemicals | S8452 | |
| Chemical compound, drug | AZD3965 | Selleck Chemicals | S7339 | |
| Chemical compound, drug | CPI613 | Selleck Chemicals | S2776 | |
| Chemical compound, drug | Compound 3 k | Selleck Chemical | S8616 | |
| Chemical compound, drug | NCT503 | Selleck Chemical | S8619 | |
| Chemical compound, drug | AG221 | Selleck Chemical | S8205 | |
| Chemical compound, drug | NLG-8189 | Selleck Chemical | S7756 | |
| Chemical compound, drug | IACS-10759 | Selleck Chemical | S8731 | |
| Chemical compound, drug | Dapagliflozin | Selleck Chemical | S1548 | |
| Chemical compound, drug | 2-DG | Selleck Chemical | S4701 | |
| Chemical compound, drug | DHEA | Selleck Chemical | S2604 | |
| Chemical compound, drug | ND-646 | MedChemExpress | HY-101842 | |
| Chemical compound, drug | V-9302 | Probechem Biochemicals | 1855871-76-9 | |
| Chemical compound, drug | N-acetyl cysteine (NAC) | Sigma-Aldrich | 616-91-1 | |
| Antibody | Anti-HSP90 (Mouse monoclonal) | Santa Cruz Biotechnology | sc-13119; RRID:AB_675659 | (WB 1:2000) |
| Antibody | Anti-GLS (Rabbit polyclonal) | Proteintech | Cat# 12855–1-AP, RRID:AB_2110381 | (WB 1:1000) |
| Antibody | Anti-γH2AX (Rabbit monoclonal) | Cell Signaling Technology | Cat# 9718; RRID:AB_2118009 | (WB 1:1000) (IHC 1:200) |
| Antibody | Anti-Ki67 (Rabbit polyclonal) | Abcam | Cat# ab15580; RRID:AB_443209 | (IHC 1:200) |
| Antibody | Anti-Cleaved Caspase-3 (Rabbit polyclonal) | Abcam | ab2302 | (IHC 1:200) |
| Commercial assay or kit | CellROX Deep Red Flow Cytometry Assay Kit | Life Technologies | C10491 | |
| Software, algorithm | javaGSEA desktop application | http://software.broadinstitute.org/gsea | ||
| Software, algorithm | Prism - Graphpad | https://www.graphpad.com/scientific-software/prism/ |
Additional files
Download links
A two-part list of links to download the article, or parts of the article, in various formats.
Downloads (link to download the article as PDF)
Open citations (links to open the citations from this article in various online reference manager services)
Cite this article (links to download the citations from this article in formats compatible with various reference manager tools)
A powerful drug combination strategy targeting glutamine addiction for the treatment of human liver cancer
eLife 9:e56749.
https://doi.org/10.7554/eLife.56749


