Gamma activity accelerates during prefrontal development
- Institute of Developmental Neurophysiology, Center for Molecular Neurobiology, University Medical Center Hamburg-Eppendorf, Germany
Figures
Figure 1
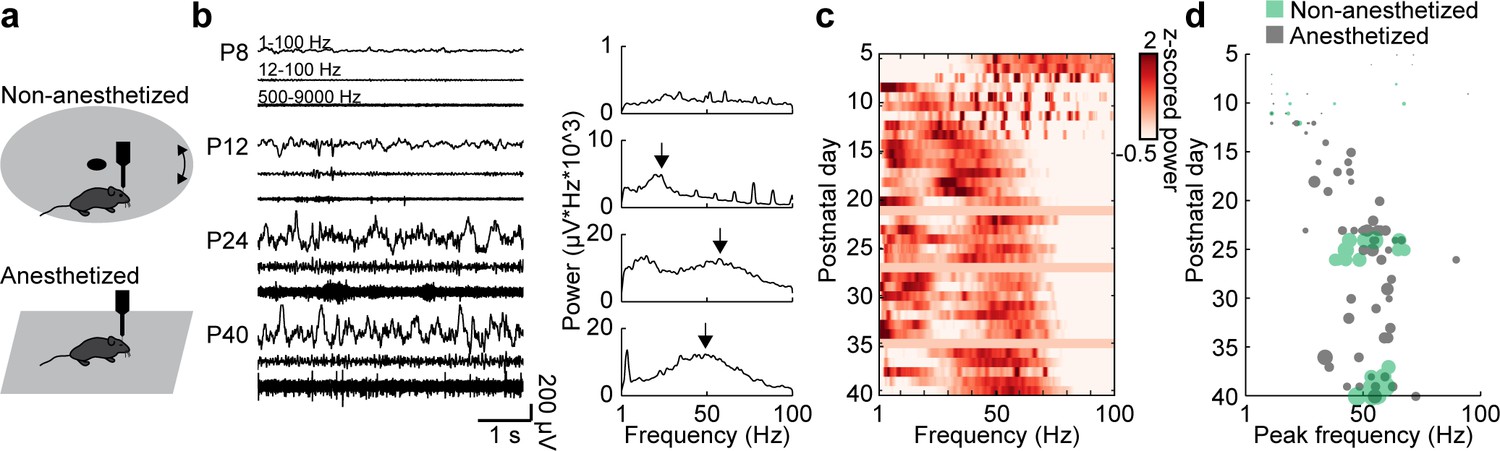
Development of gamma activity in the mouse mPFC.
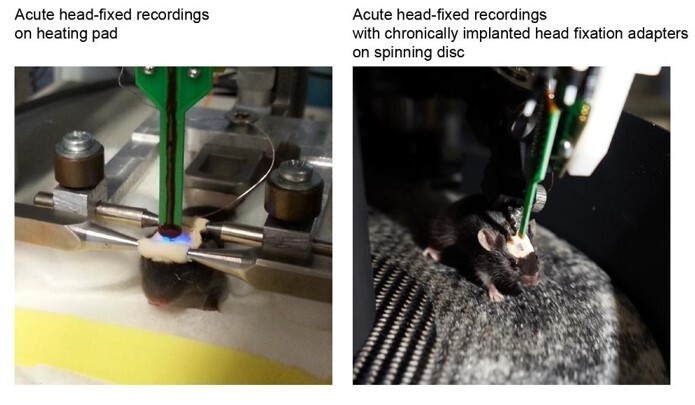
(a) Schematic of extracellular recordings in the mPFC of anesthetized and non-anesthetized P5-40 mice. (b) Characteristic examples of extracellular recordings of local field potentials (LFP) and multi-unit activity (MUA) at different ages after band-pass filtering (left) and the corresponding power spectra (right). (c) Z-scored average power spectra of spontaneous oscillatory activity for P5-40 mice (n = 114 recordings from 100 mice). (d) Scatter plot displaying peak frequencies of fast oscillations (12–100 Hz) during postnatal development of anesthetized (gray, n = 80 recordings/mice) and non-anesthetized mice (green, n = 34 recordings from 20 mice). Marker size displays peak strength. (See Supplementary file 1 for a summary of experimental conditions. See Supplementary file 2 for statistics.).
-
Figure 1—source data 1
Source data for Figure 1b.
- https://cdn.elifesciences.org/articles/56795/elife-56795-fig1-data1-v1.mat
Figure 2 with 1 supplement

Development of FS interneurons in the mouse mPFC.
(a) Left, examples of PV immunostaining in the mPFC at different ages. Right, scatter plot displaying the density of PV-immunopositive neurons in the mPFC of P5-40 mice (n = 38 mice). (b) Same as (a) for SOM-immunopositive neurons (n = 39 mice). (c) Example mean waveforms of extracellular recorded single units from P5-40 mice. (d) Schematic showing features classically used to distinguish RS and FS units in adult mice. (e) Left, scatter plot showing the first two components of a t-sne dimensionality reduction on the mean waveforms for all units recorded from P5-40 mice (n = 3554 units from 66 recordings/mice). Right, same as left with the first two clusters obtained by hierarchical clustering labeled in black and red. (f) Scatter plot of half width and trough-to-peak time for cluster 1 (black) and 2 (red). (g) Mean waveform for cluster 1 (black) and 2 (red). (h) Scatter plot showing the proportion of FS units for P5-40 mice. (i) Scatter plots showing classic spike shape features for P5-40 for cluster 1 (RS, black) and 2 (FS, red). (See Supplementary file 1 for a summary of experimental conditions. See Supplementary file 2 for statistics).
-
Figure 2—source data 1
Source data for Figure 2a,b.
- https://cdn.elifesciences.org/articles/56795/elife-56795-fig2-data1-v1.mat
-
Figure 2—source data 2
Source data for Figure 2f.
- https://cdn.elifesciences.org/articles/56795/elife-56795-fig2-data2-v1.mat
-
Figure 2—source data 3
Source data for Figure 2g.
- https://cdn.elifesciences.org/articles/56795/elife-56795-fig2-data3-v1.mat
-
Figure 2—source data 4
Source data for Figure 2h.
- https://cdn.elifesciences.org/articles/56795/elife-56795-fig2-data4-v1.mat
-
Figure 2—source data 5
Source data for Figure 2i.
- https://cdn.elifesciences.org/articles/56795/elife-56795-fig2-data5-v1.mat
Figure 2—figure supplement 1
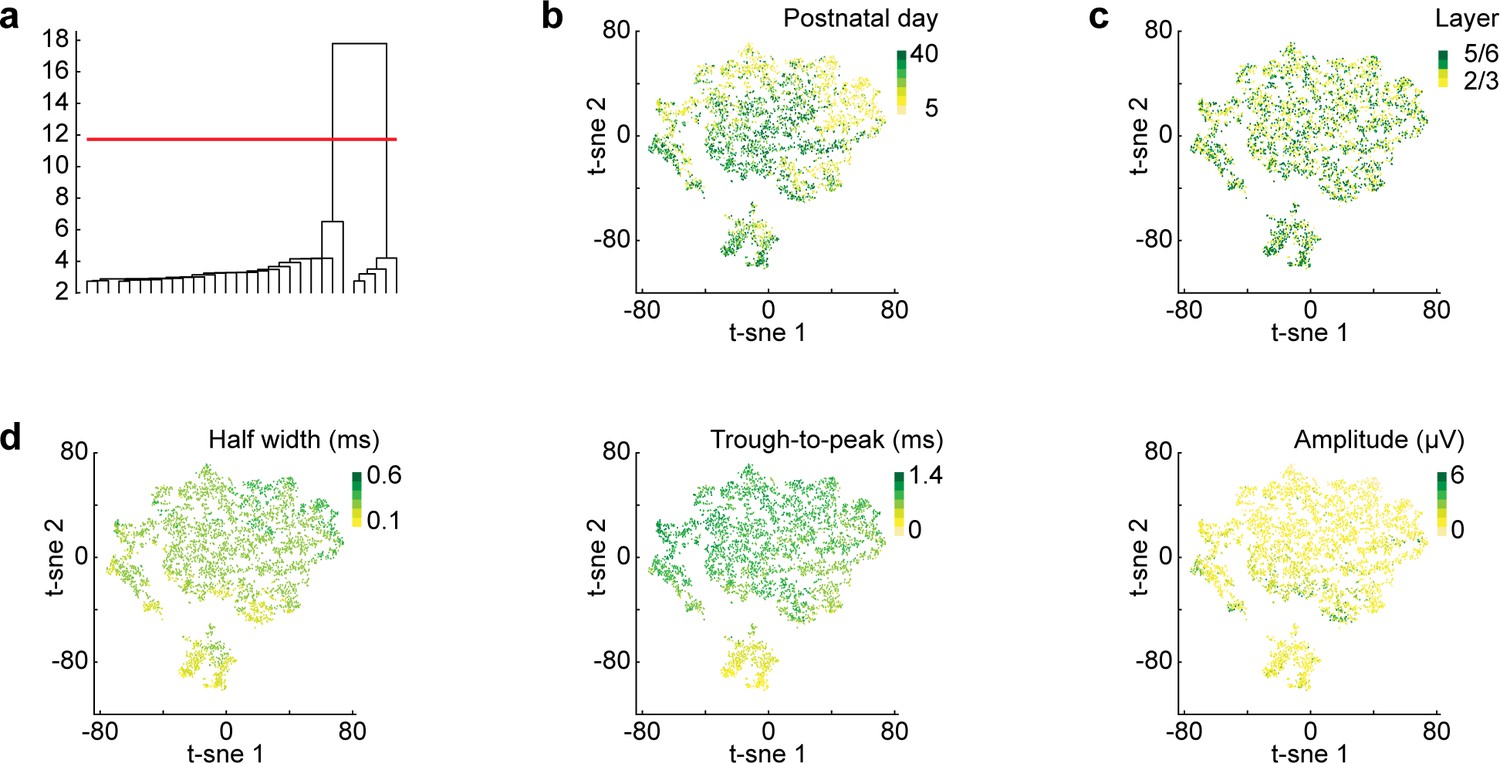
t-sne dimensionality reduction.
(a) Dendrogram of binary hierarchical clustering after t-sne dimensionality reduction. The height of the lines represents the distance between subclusters. (b) Scatter plot showing the first two components of a t-sne dimensionality reduction on the mean waveforms for all units recorded from P5-40 (n = 3554 units from 66 recordings/mice) color coded by age. (c) Same as (b) color coded by mPFC layer. (d) Same as (b) color coded by values of classic spike shape features (half width, trough to peak time, amplitude).
-
Figure 2—figure supplement 1—source data 1
Source data for Figure 2—figure supplement 1b–d.
- https://cdn.elifesciences.org/articles/56795/elife-56795-fig2-figsupp1-data1-v1.mat
Figure 3 with 1 supplement
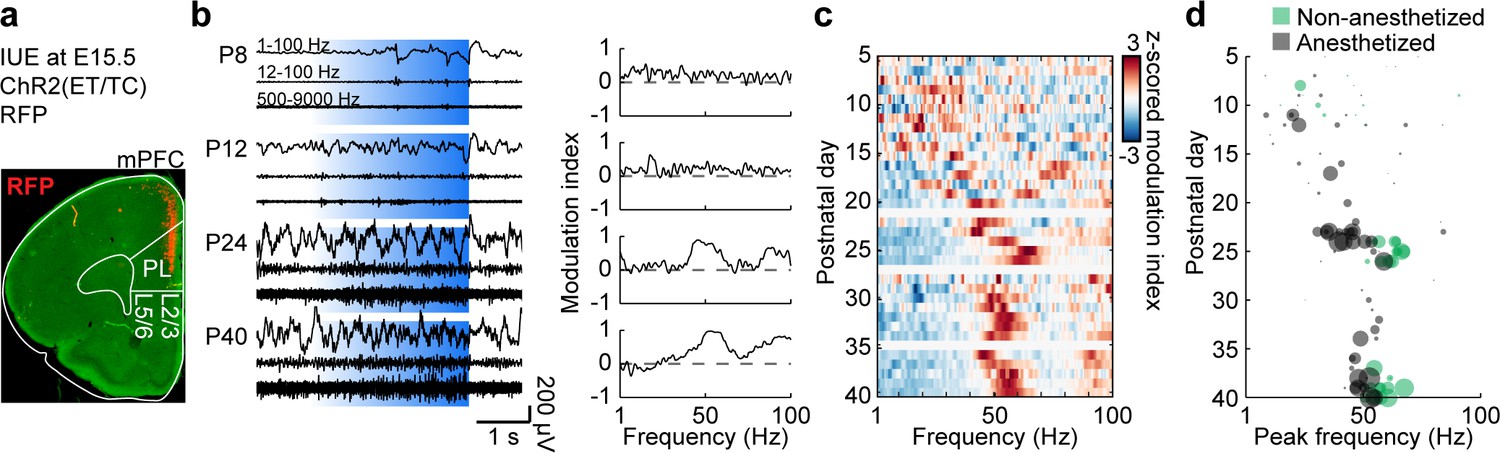
Development of L2/3 PYR-driven gamma in the mPFC.
(a) ChR2(ET/TC)−2A-RFP-expression in L2/3 PYRs in mPFC after IUE at E15.5 in a coronal slice of a P10 mouse. (b) Characteristic examples of extracellular recordings of LFP and MUA during ramp light stimulations (473 nm, 3 s) of prefrontal L2/3 PYRs at different ages (left) and the corresponding MI of power spectra (right). (c) Z-scored average MI of power spectra for P5-40 mice (n = 115 recordings from 101 mice). (d) Scatter plot displaying stimulus induced peak frequencies during postnatal development for anesthetized (gray, n = 80 recordings/mice) and non-anesthetized mice (green, n = 35 recordings from 21 mice). Marker size displays peak strength. (See Supplementary file 1 for a summary of experimental conditions. See Supplementary file 2 for statistics).
-
Figure 3—source data 1
Source data for Figure 3d.
- https://cdn.elifesciences.org/articles/56795/elife-56795-fig3-data1-v1.mat
Figure 3—figure supplement 1
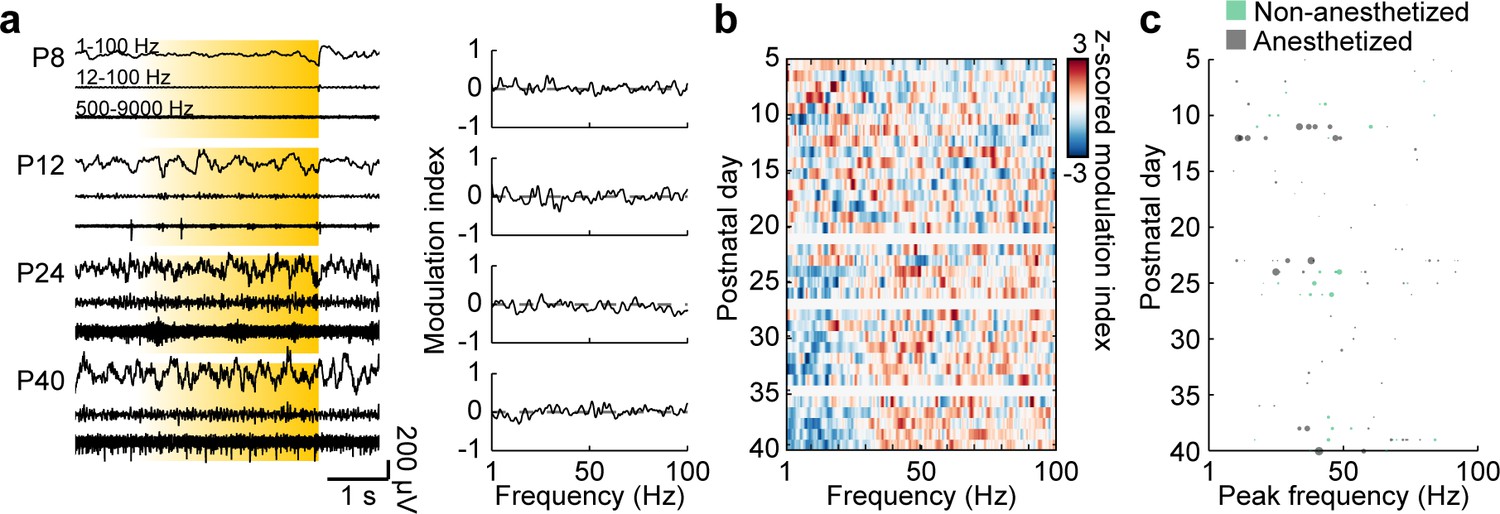
Control stimulations of L2/3 PYRs in the mPFC.
(a) Characteristic examples of extracellular recordings of LFP and MUA during control ramp light stimulations (594 nm, 3 s) of mPFC L2/3 PYR at different ages (left) and the corresponding MI of power spectra (right). (b) Z-scored average MI of power spectra for P5-40 mice (n = 111 recordings from 97 mice). (c) Scatter plot displaying stimulus induced peak frequencies across age for anesthetized (gray, n = 76 recordings/mice) and non-anesthetized mice (green, n = 35 recordings from 21 mice). Marker size displays peak strength. (See Supplementary file 1 for a summary of experimental conditions. See Supplementary file 2 for statistics).
-
Figure 3—figure supplement 1—source data 1
Source data for Figure 3—figure supplement 1c.
- https://cdn.elifesciences.org/articles/56795/elife-56795-fig3-figsupp1-data1-v1.mat
Figure 4 with 1 supplement
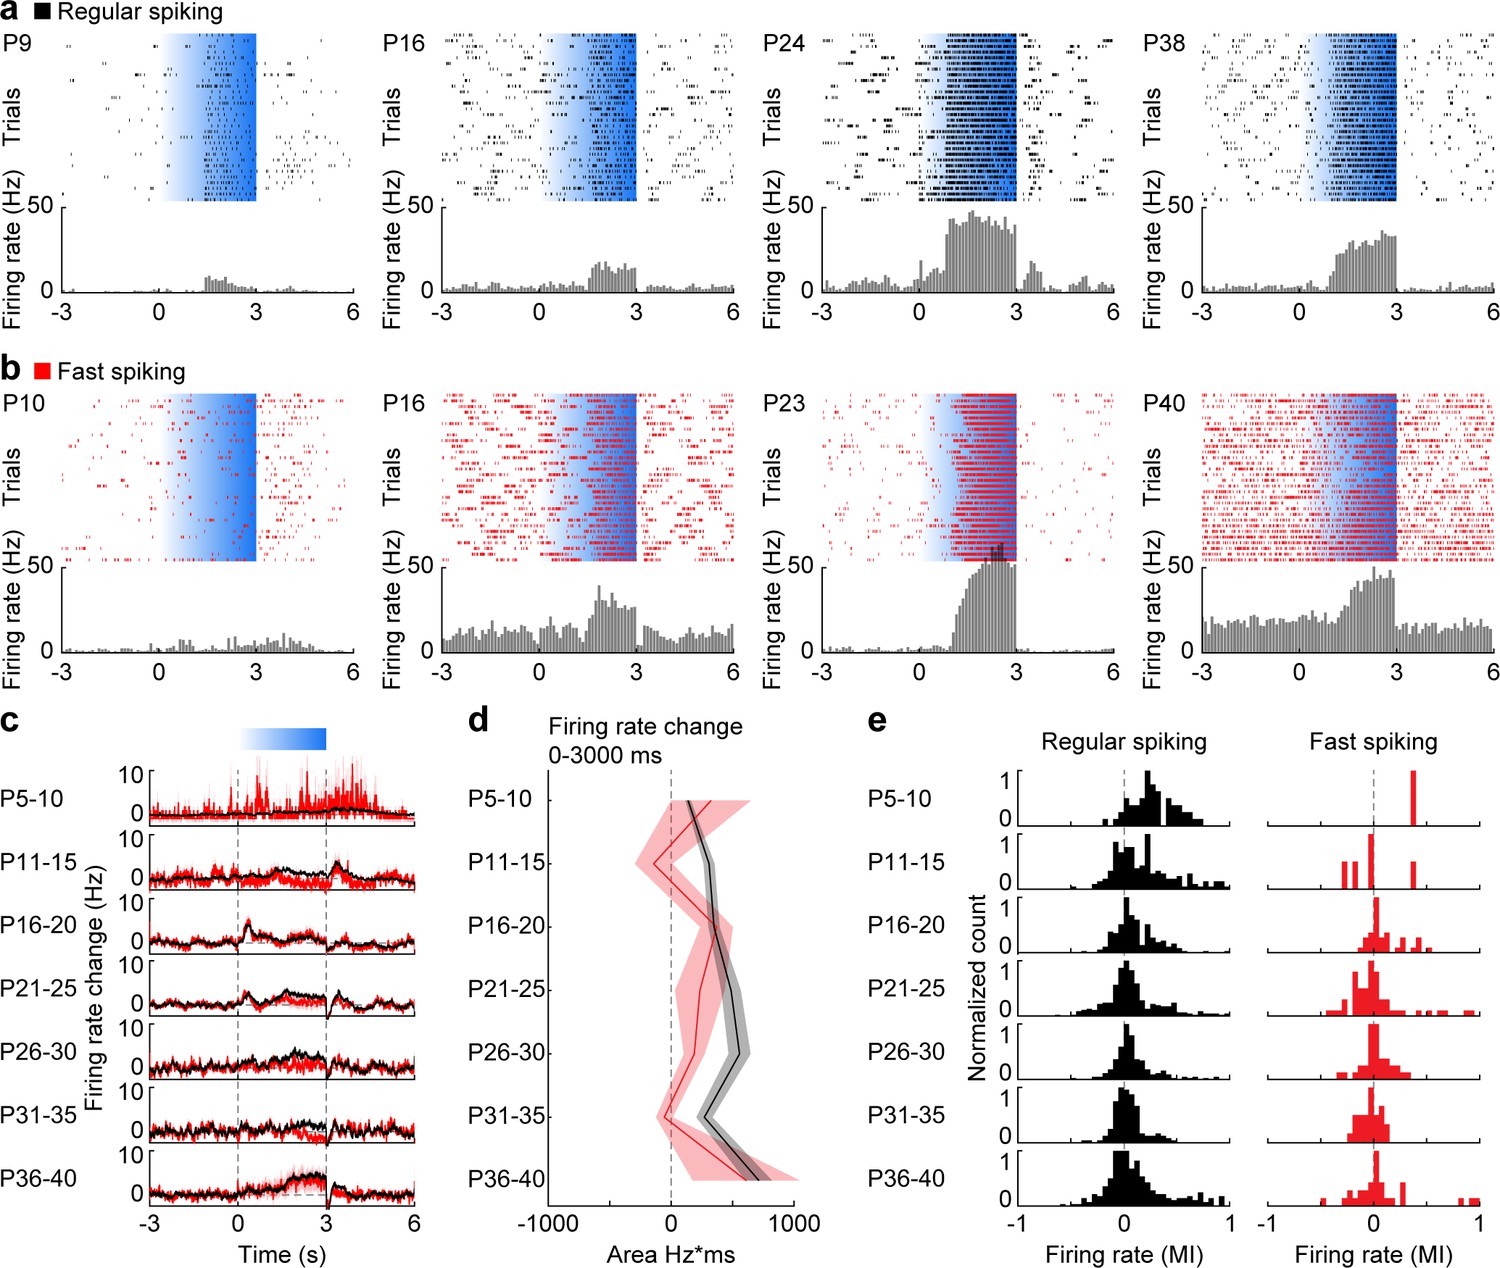
Development of RS and FS unit activity during L2/3 PYR-driven gamma in the mPFC.
(a) Raster plots and peri-stimulus time histograms for activated RS example units in response to ramp light stimulation (3 s, 473 nm, 30 repetitions) of prefrontal PYRs at different ages. (b) Same as (a) for FS units. (c) Average firing rate change of RS (black, n = 1824 units from 66 recordings/mice) and FS (red, n = 226 units from 66 recordings/mice) units in response to ramp light stimulation of prefrontal L2/3 PYRs for different age groups. (d) Line plot displaying the average firing rate changes of RS and FS units during ramp light stimulation for different age groups. (e) Histograms of the MI of firing rates in response to ramp light stimulation for RS and FS units. (Average data is displayed as mean ± sem. See Supplementary file 1 for a summary of experimental conditions. See Supplementary file 2 for statistics.).
-
Figure 4—source data 1
Source data for Figure 4d.
- https://cdn.elifesciences.org/articles/56795/elife-56795-fig4-data1-v1.mat
Figure 4—figure supplement 1
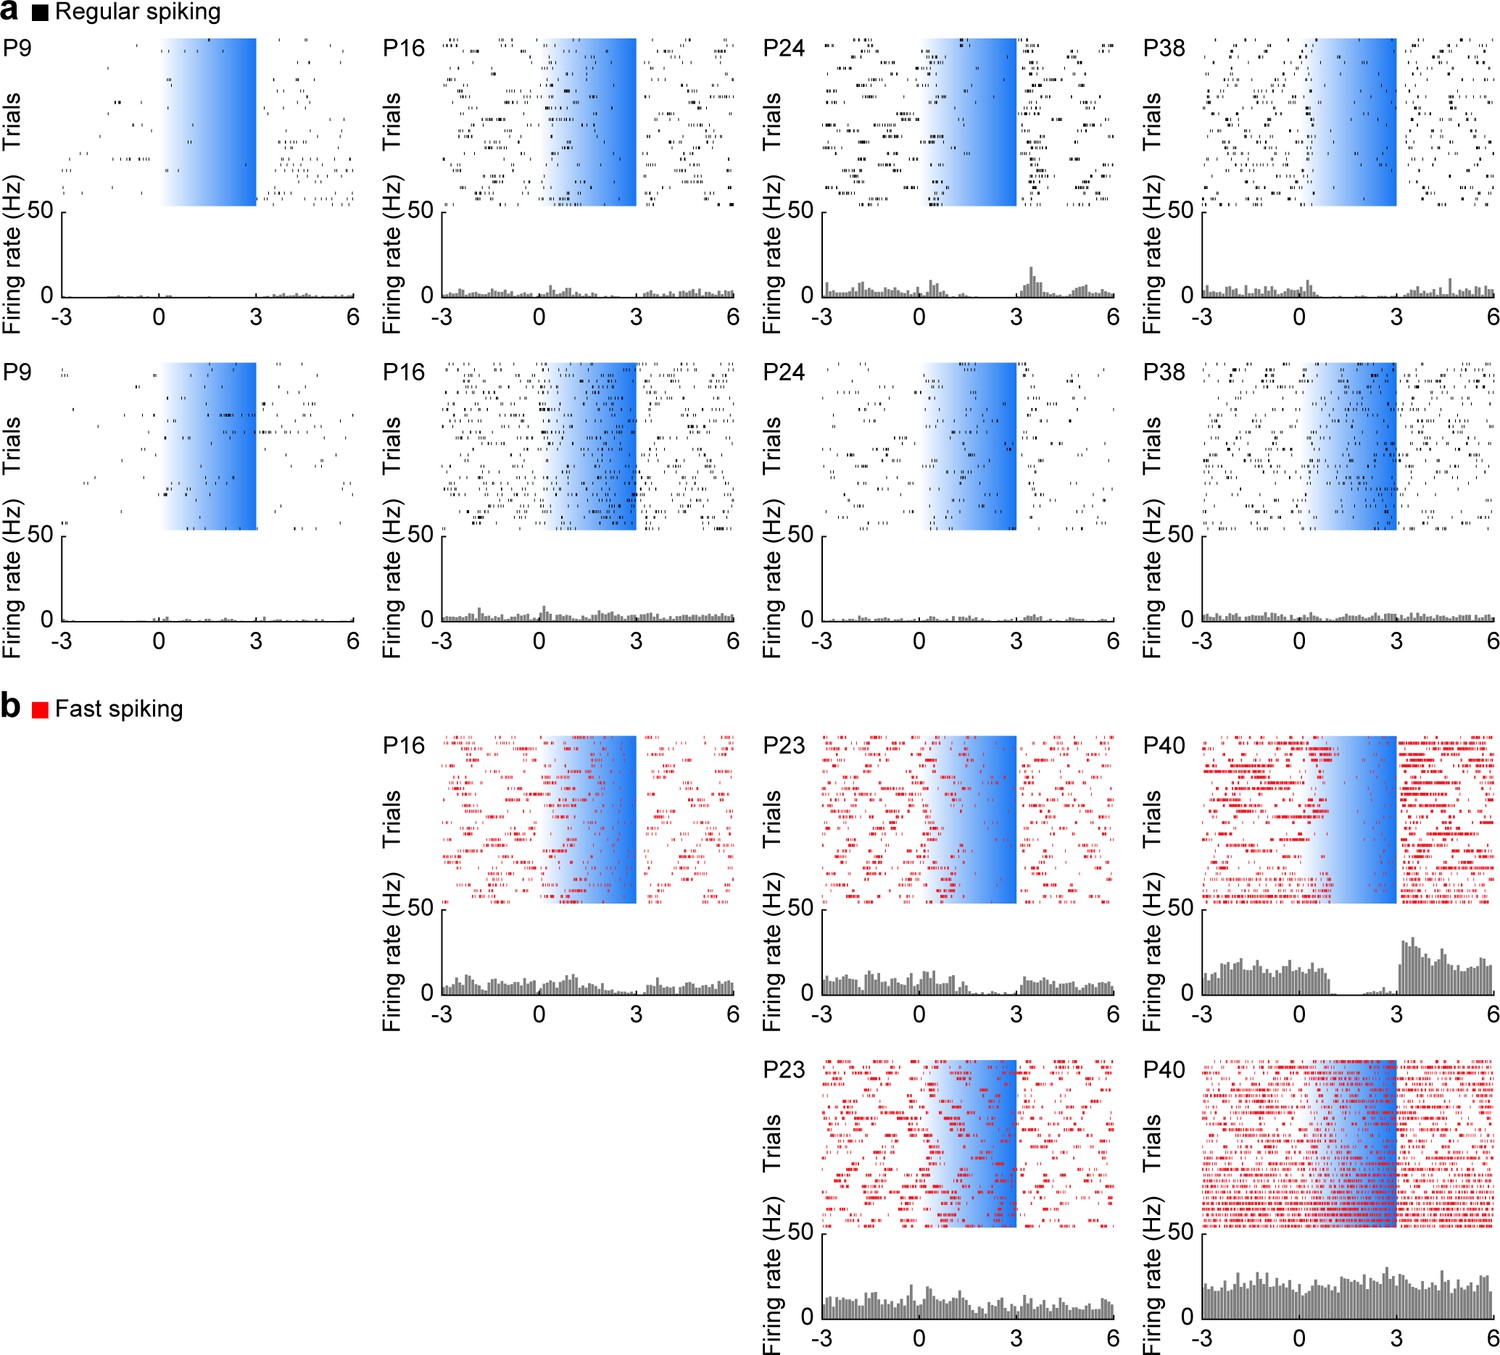
RS and FS unit activity during L2/3 PYR-driven gamma in the mPFC.
(a) Raster plots and peri-stimulus time histograms for inactivated (top) and unaffected (bottom) RS example units in response to ramp light stimulation (3 s, 473 nm) of prefrontal L2/3 PYRs at different ages. The displayed example units were recorded simultaneously with the examples shown in Figure 4a. (b) Same as (a) for FS units. These example units were recorded simultaneously with the examples shown in Figure 4b.
Figure 5 with 3 supplements
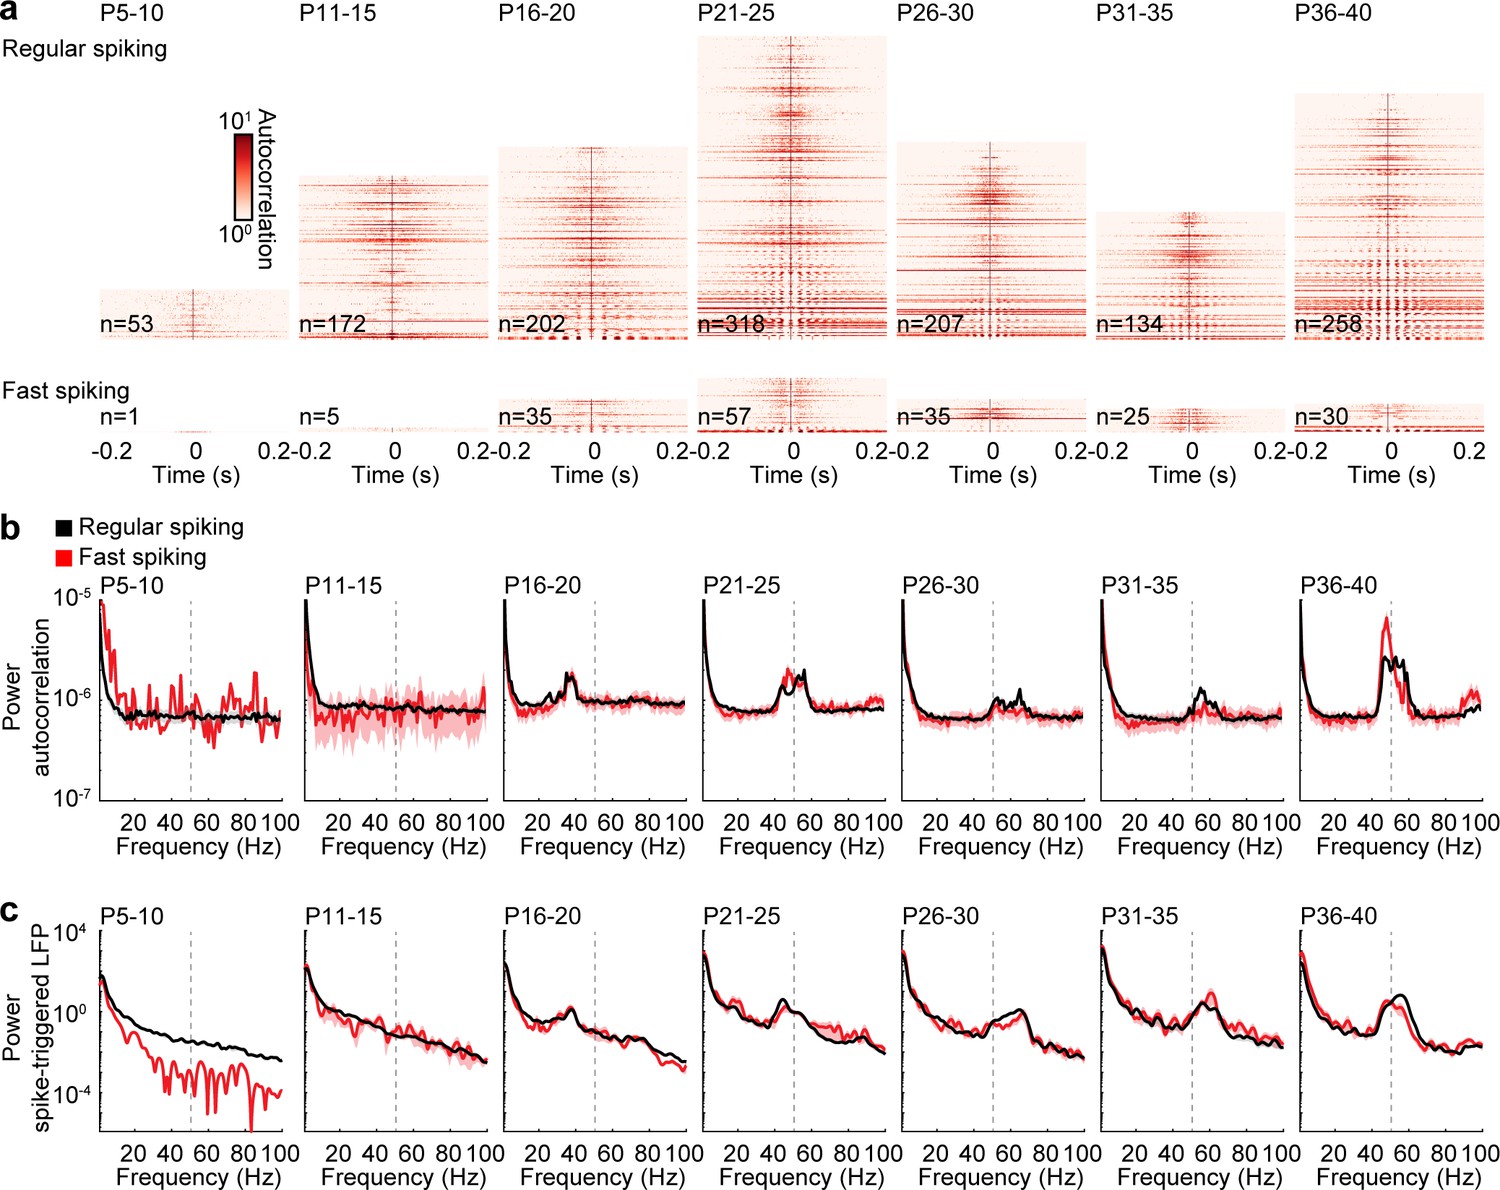
Rhythmicity of RS and FS units across age.
(a) Color-coded autocorrelations of prefrontal RS (top) and FS (bottom) units during ramp light stimulation (3 s, 473 nm) for different age groups. Each row represents one unit (only units firing > 1 Hz are included). (b) Average autocorrelation power of RS (black) and FS (red) units during ramp light stimulation for different age groups. (c) Average power of mean spike-triggered LFP of RS (black) and FS (red) units during ramp light stimulation for different age groups. (Average data is displayed as mean ± sem. See Supplementary file 1 for a summary of experimental conditions. See Supplementary file 2 for statistics.).
Figure 5—figure supplement 1
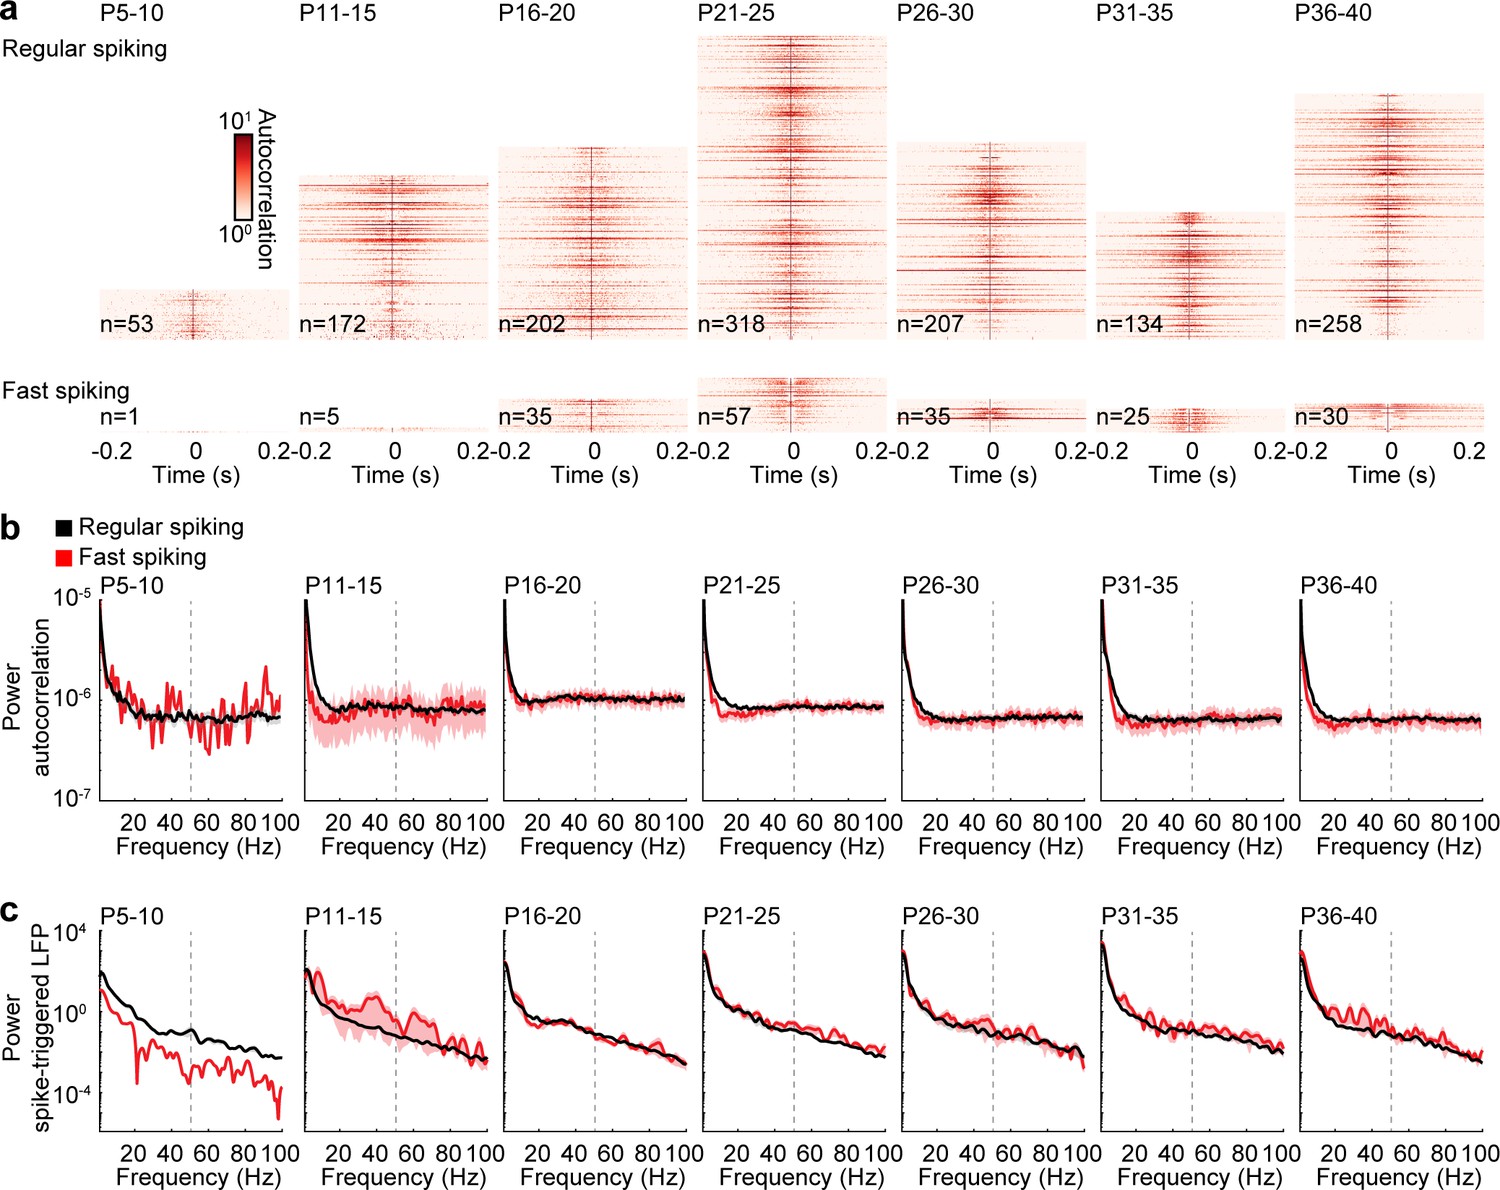
Rhythmicity of RS and FS units during spontaneous activity.
(a) Color-coded autocorrelations of prefrontal RS (top) and FS (bottom) units during spontaneous activity for different age groups. Each row represents one unit (only units firing > 1 Hz included). (b) Average autocorrelation power of RS (black) and FS (red) units during spontaneous activity for different age groups (multifactorial ANOVA: unit type F(1,153093) = 1.88, p=0.169, age group F(6, 153093)=41.8, p=2.53×10−51, frequency F(99, 153093)=663.5, p=0.000). (c) Average power of mean spike-triggered LFP of RS (black) and FS (red) units during spontaneous activity for different age groups (multifactorial ANOVA: unit type F(1,805201) = 248.426, p=5.83×10−56, age group F(6, 805201)=1413.2, p=0.000, frequency F(400, 805201)=747.0, p=0.000). (Average data is displayed as mean ± sem. See Supplementary file 1 for a summary of experimental conditions. See Supplementary file 2 for statistics).
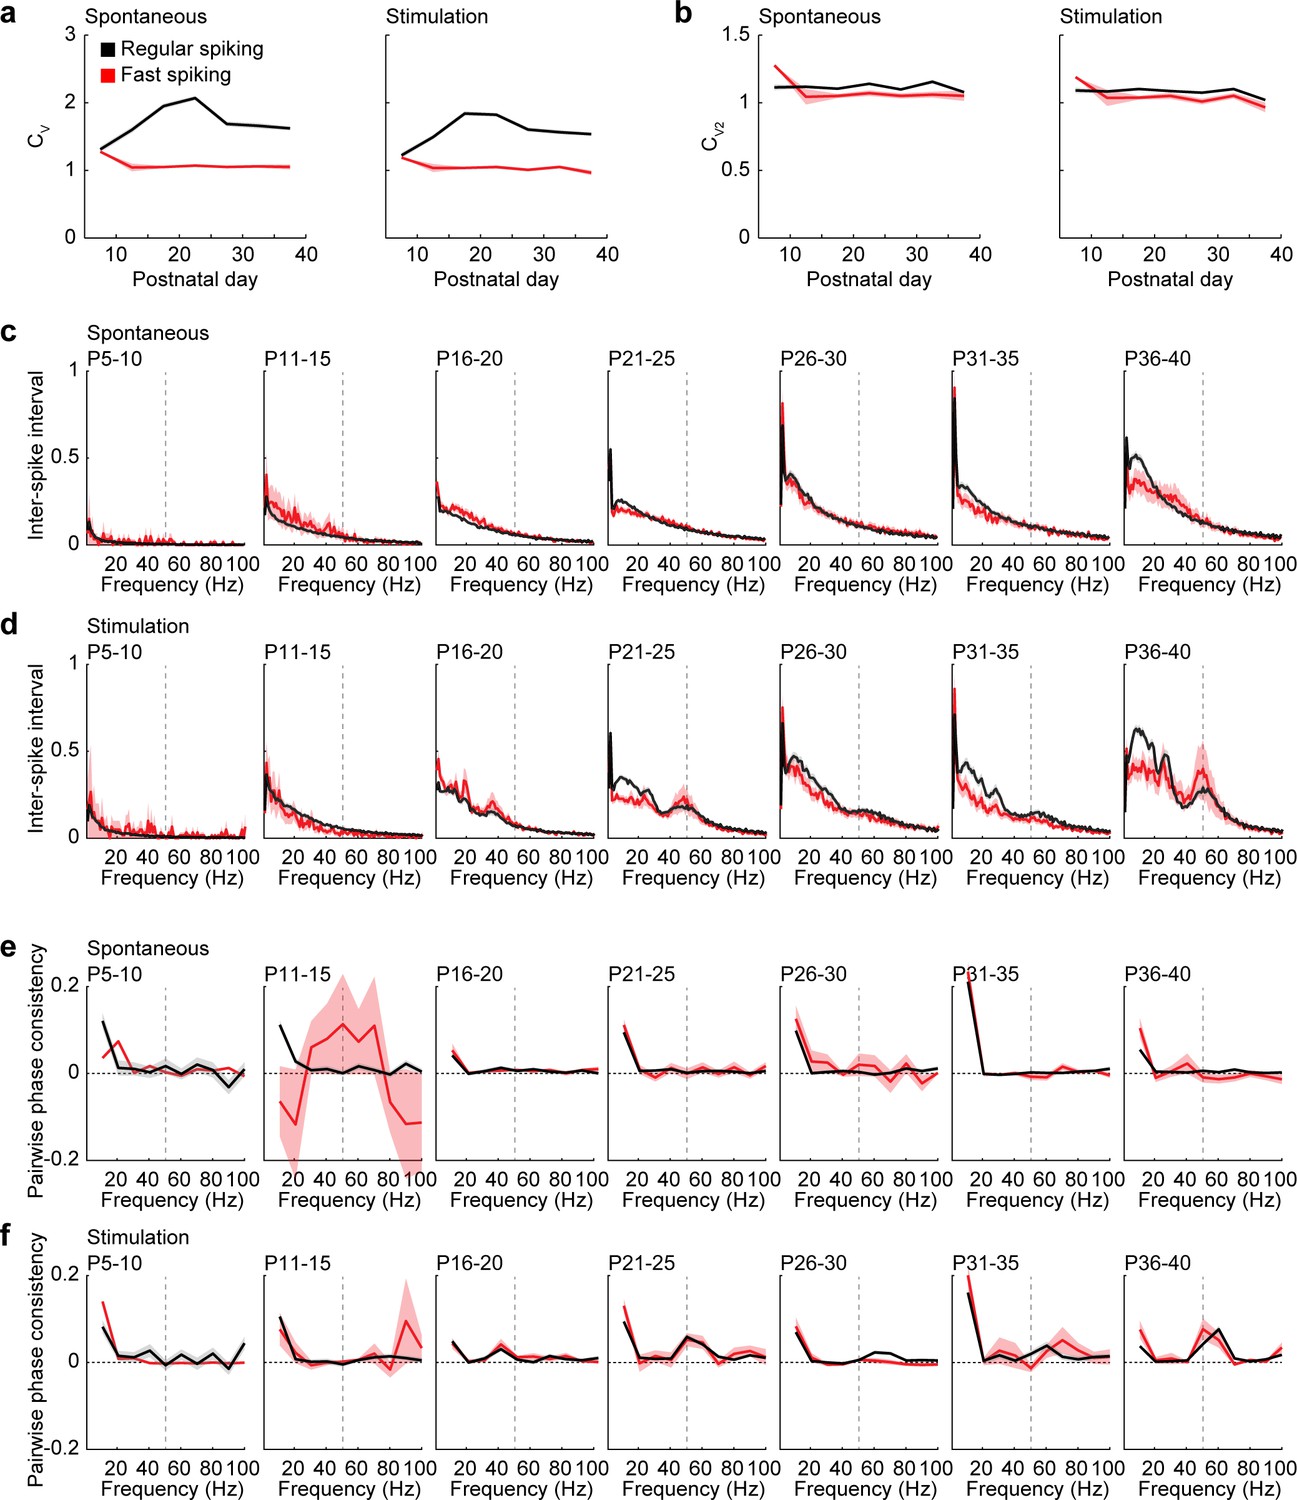
Figure 5—figure supplement 2
Additional measures for rhythmicity of RS and FS units.
(a) Average variability of spiking measured as coefficient of variation (CV) of inter-spike intervals of RS (black) and FS (red) units during spontaneous activity (Mann-Kendall trend test, RS p=0.763, n = 7 age groups, tau-b 0.142; FS p=0.880, n = 7 age groups, tau-b 0.047) and ramp light stimulation (Mann-Kendall trend test, RS p=0.880, n = 7 age groups, tau-b 0.047; FS p=0.367, n = 7 age groups, tau-b −0.333) for different age groups. (b). Average variability of spiking measured as CV2 of adjacent inter-spike intervals of RS (black) and FS (red) units during spontaneous activity (Mann-Kendall trend test, RS p=0.763, n = 7 age groups, tau-b −0.142; FS p=0.880, n = 7 age groups, tau-b 0.047) and ramp light stimulation (Mann-Kendall trend test, RS p=0.367, n = 7 age groups, tau-b −0.333; FS p=0.367, n = 7 age groups, tau-b −0.333) for different age groups. (c) Average inter-spike intervals (shown as instantaneous frequency) of RS (black) and FS (red) units during spontaneous activity for different age groups (multifactorial ANOVA: unit type F(1,204893) = 5.24, p=0.022, age group F(6, 204893)=3519.8, p=0.000, frequency F(99, 204893)=583.2, p=0.000). (d) Same as (c) for RS and FS units during ramp light stimulation (multifactorial ANOVA: unit type F(1,204893) = 146.6, p=9.64×10⁻³⁴, age group F(6, 204893)=2745.0, p=0.000, frequency F(99, 204893)=447.1, p=0.000). (e) Average pairwise phase consistency of RS (black) and FS (red) units during spontaneous activity for different age groups (multifactorial ANOVA: unit type F(1, 20262)=1.14, p=0.283, age group F(6, 20262)=6.83, p=2.93×10⁻⁷, frequency F(9, 20262)=164.0, p=2.67×10−301). (f) Same as (e) for RS and FS units during ramp light stimulation (multifactorial ANOVA: unit type F(1,20385) = 3.61, p=0.057, age group F(6, 20385)=13.5, p=1.90×10⁻¹⁵, frequency F(9, 20385)=124.8, p=8.13×10−230). (Average data is displayed as mean ± sem. See Supplementary file 1 for a summary of experimental conditions. See Supplementary file 2 for statistics).
Figure 5—figure supplement 3
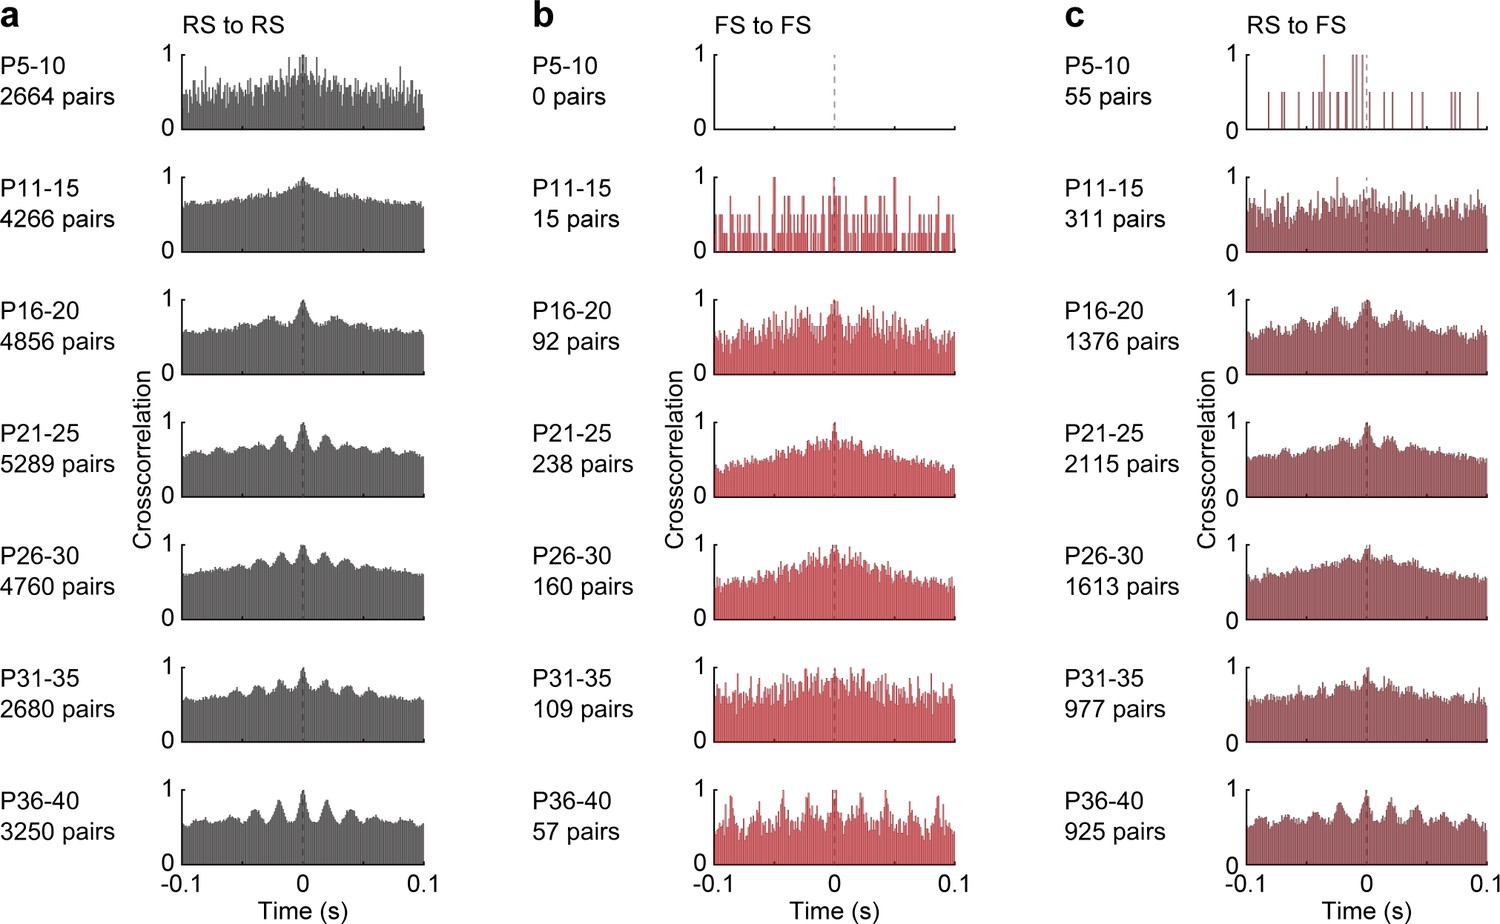
Crosscorrelations of RS and FS units during spontaneous activity.
(a) Average crosscorrelation histograms of all simultaneously recorded RS unit pairs during ramp light stimulation for different age groups. (b) Same as (a) for FS unit pairs. (c) Same as (a) for RS-FS unit pairs (See Supplementary file 1 for a summary of experimental conditions).
Figure 6 with 1 supplement

Firing of RS and FS units in response to pulse light stimulation.
(a) Firing rate changes of prefrontal RS (black, n = 1824 units from 66 recordings/mice) and FS (red, n = 226 units from 66 recordings/mice) units in response to repetitive pulse light stimulation (3 ms, 473 nm) of 4, 8, 16, 32, and 64 Hz averaged for different age groups. (b) Line plots displaying the ratio of firing rate change in response to the 10th versus the 1st pulse for different frequencies and age groups (multifactorial ANOVA: unit type F(1,7698) = 0.39, p=0.530, age group F(6, 7698)=18.7, p=1.00×10⁻²¹, stimulation frequency F(4, 7698)=36.0, p=6.29×10⁻³⁰). (c) Firing rate changes of RS and FS units in response to pulse light stimulation (3 ms, 473 nm) of L2/3 PYRs averaged for different age groups. (d) Line plot displaying the average firing rate change of RS and FS units 0–10 ms after pulse light stimulation for different age groups. (e) Same as (c) displayed at longer time scale. (f) Same as (d) for 10–50 ms after pulse start. (Average data is displayed as mean ± sem. See Supplementary file 1 for a summary of experimental conditions. See Supplementary file 2 for statistics).
-
Figure 6—source data 1
Source data for Figure 6b.
- https://cdn.elifesciences.org/articles/56795/elife-56795-fig6-data1-v1.mat
-
Figure 6—source data 2
Source data for Figure 6d.
- https://cdn.elifesciences.org/articles/56795/elife-56795-fig6-data2-v1.mat
-
Figure 6—source data 3
Source data for Figure 6f.
- https://cdn.elifesciences.org/articles/56795/elife-56795-fig6-data3-v1.mat
Figure 6—figure supplement 1
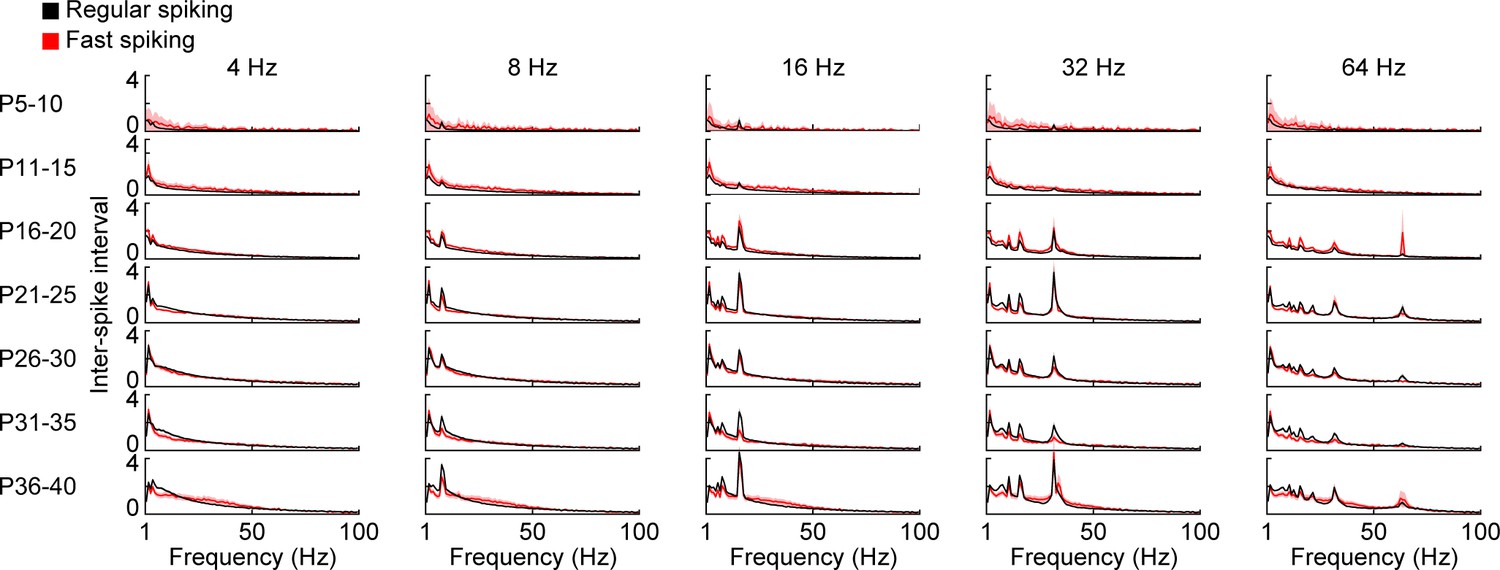
Inter-spike intervals of RS and FS units during pulse light stimulation.
Inter-spike intervals of prefrontal RS (black, n = 1824 units from 66 recordings/mice) and FS (red, n = 226 units from 66 recordings/mice) units in response to repetitive ramp light stimulation of L2/3 PYRs (3 ms, 473 nm) of 4, 8, 16, 32, and 64 Hz averaged for different age groups. (Average data is displayed as mean ± sem. See Supplementary file 1 for a summary of experimental conditions).
Author response image 1
Tables
Key resources table
| Reagent type (species) or resource | Designation | Source or reference | Identifiers | Additional information |
|---|---|---|---|---|
| Antibody | Rabbit polyclonal-anti-parvalbumin | Abcam | ab11427 | (1:500) |
| Antibody | Rabbit polyclonal-anti-somatostatin | Santa Cruz | sc13099 | (1:250) |
| Antibody | Goat-anti-rabbit secondary antibody, Alexa Fluor 488 | Invitrogen-Thermo Fisher | A11008 | (1:500) |
| Chemical compound, drug | Isoflurane | Abbott | B506 | |
| Chemical compound, drug | Urethane | Fluka analytical | 94300 | |
| Strain, strain background (mouse, both genders) | C57Bl/6J | Universitätsklinikum Hamburg-Eppendorf –Animal facility | C57Bl/6J | https://www.jax.org/strain/008199 |
| Recombinant DNA reagent | pAAV-CAG-ChR2(E123T/T159C)−2AtDimer2 | Provided by T. G. Oertner | pAAV-CAG-ChR2(E123T/T159C)−2AtDimer2 | http://www.oertner.com/ |
| Software, algorithm | Matlab R2018b | MathWorks | Matlab R2018b | https://www.mathworks.com/ |
| Software, algorithm | Kilosort2 | MouseLand | https://github.com/MouseLand/Kilosort2 | |
| Software, algorithm | ImageJ | ImageJ | https://imagej.nih.gov/ij/ | |
| Other | Arduino Uno SMD | Arduino | A000073 | |
| Other | Digital Lynx 4SX | Neuralynx | Digital Lynx 4SX | http://neuralynx.com/ |
| Other | Diode laser (473 nm) | Omicron | LuxX 473–100 | |
| Other | Electroporation device | BEX | CUY21EX | |
| Other | Electroporation tweezer-type paddles | Protech | CUY650-P5 | |
| Other | Recording electrode (one-shank, 16 channels) | Neuronexus | A1 × 16 5 mm | |
| Other | Recording electrode (four-shank, 16 channels) | Neuronexus | A4 × 4 5 mm |
Additional files
-
Supplementary file 1
Recording summary.
Table summarizing the recordings for each experimental condition.
- https://cdn.elifesciences.org/articles/56795/elife-56795-supp1-v1.docx
-
Supplementary file 2
Detailed statistical results.
Table summarizing the statistical results.
- https://cdn.elifesciences.org/articles/56795/elife-56795-supp2-v1.docx
-
Transparent reporting form
- https://cdn.elifesciences.org/articles/56795/elife-56795-transrepform-v1.pdf
Download links
A two-part list of links to download the article, or parts of the article, in various formats.
Downloads (link to download the article as PDF)
Open citations (links to open the citations from this article in various online reference manager services)
Cite this article (links to download the citations from this article in formats compatible with various reference manager tools)
Gamma activity accelerates during prefrontal development
eLife 9:e56795.
https://doi.org/10.7554/eLife.56795


