Persistent firing in LEC III neurons is differentially modulated by learning and aging
- Department of Physiology, Feinberg School of Medicine, Northwestern University, United States
Figures
Figure 1
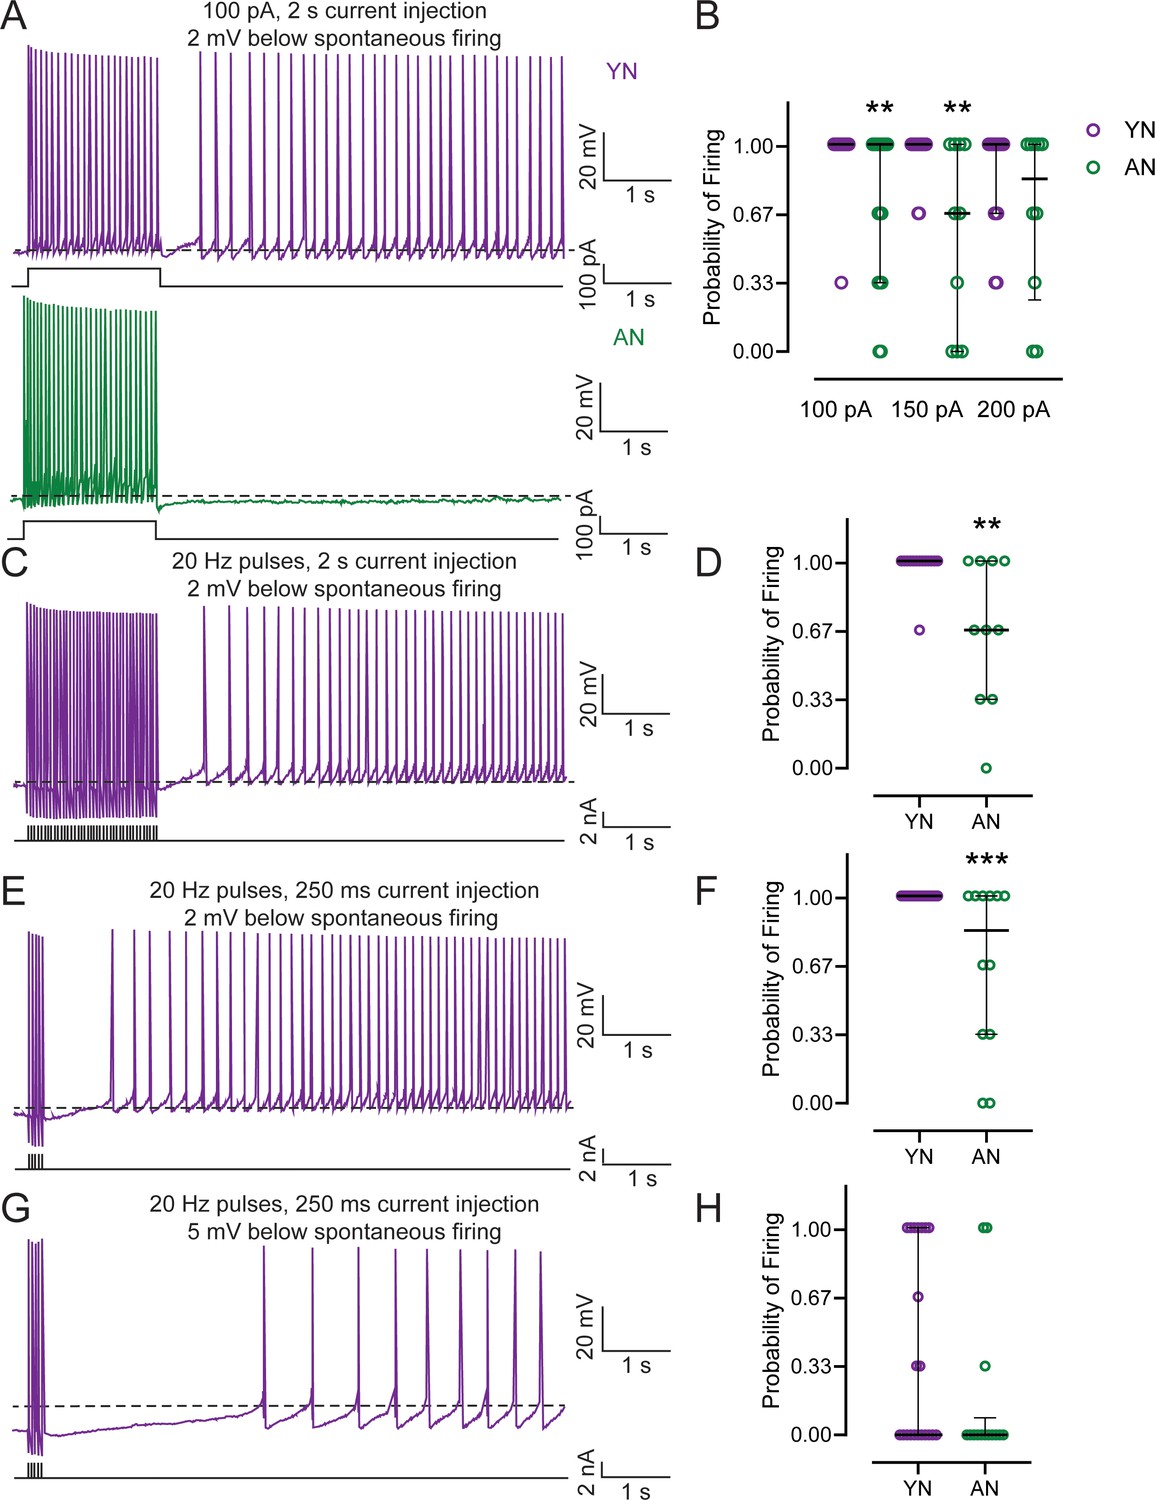
Persistent firing probability is decreased in neurons from behaviorally naïve aged animals.
(A) Persistent firing example traces from neurons from behaviorally naive young (Young Naive – YN; top, purple) and aged (Aged Naive – AN; bottom, dark green) animals. Persistent firing was evoked with a 100 pA 2 s long current injection while the neuronal membrane potential was held at 2 mV more hyperpolarized than spontaneous firing. Dotted lines indicate spontaneous firing threshold. Black lines underneath persistent firing activity indicate the current injections used. (B) Neurons from AN animals have a lower probability of firing relative to neurons from YN animals when neurons are injected with a 100 pA (AN, n = 18 neurons; YN, n = 25), 150 pA (AN, n = 10; YN, n = 18), but not a 200 pA training stimulus (AN, n = 10; YN, n = 16). (Mann-Whitney, 100 pA U = 134.5, **p=0.0016; 150 pA U = 42, **p=0.0029; 200 pA U = 60.50, p=0.2458). Error bars: median and quartiles (75%–25%). (C) Persistent firing example trace from YN neuron evoked with 2 s long 20 Hz train of current pulses. Neuronal membrane potential held at 2 mV more hyperpolarized than spontaneous firing threshold. Dotted lines indicate spontaneous firing threshold. Black lines underneath persistent firing activity indicate the current used. (D) Neurons from AN animals (n = 10 neurons) have a lower probability of firing relative to neurons from YN animals when persistent firing is evoked with 2 s long 20 Hz train of current pulses (n = 14). (Mann-Whitney, U = 31.50, **p=0.0052). Error bars: median and quartiles (75%–25%). (E) Persistent firing example trace from YN neuron evoked with 250 ms long 20 Hz train of current pulses. Neuronal membrane potential held at 2 mV more hyperpolarized than spontaneous firing threshold. Dotted lines indicate spontaneous firing threshold. Black lines underneath persistent firing activity indicate the current used. (F) Neurons from AN animals (n = 12 neurons) have a lower probability of firing relative to YN (n = 22) when persistent firing is evoked with a 250 ms long 20 Hz train of current pulses and the neuronal membrane potential is 2 mV more hyperpolarized than spontaneous firing threshold. (Mann-Whitney, U = 66, ***p=0.0007). Error bars: median and quartiles (75%–25%) (G) Persistent firing example trace from YN neuron evoked with 250 ms long 20 Hz train of current pulses. Neuronal membrane potential held at 5 mV more hyperpolarized than spontaneous firing threshold. Dotted lines indicate spontaneous firing threshold. Black lines underneath persistent firing activity indicate the current used. (H) No difference in probability between neurons from AN (n = 14 neurons) and YN (n = 21) animals when persistent firing is evoked with a 250 ms long 20 Hz train of current pulses and the membrane potential is 5 mV more hyperpolarized than spontaneous firing threshold. (Mann-Whitney, U = 107.5, p=0.1304). Error bars: median and quartiles (75%–25%). See Tables 1 and 2.
Figure 2 with 2 supplements

Neurons from aged impaired animals have a decreased persistent firing probability, and successful learning increases persistent firing probability in neurons from both young adult and aged animals.
(A) Trace Eyeblink Conditioning Paradigm. Top, Young adult and aged rats were trained on trace eyeblink conditioning over the course of 3 days. The first session of Day 1 was a habituation session to the training apparatus. Following habituation, the rats were given five sessions of eyeblink conditioning. Biophysical recordings were performed 24 hrs after the last session of eyeblink conditioning. Bottom, Conditioned and Pseudoconditioned paradigms. Aged animals were trained on the conditioning paradigm and separated into Aged Unimpaired (AU) and Aged Impaired (AI) groups depending on learning ability. Young adult animals were conditioned (Young Conditioned – YC) or pseudoconditioned (Young Pseudoconditioned – YP). In the Conditioning Paradigm, animals are presented with a 250 ms long tone Conditioned Stimulus (CS) paired with a 100 ms long electrical shock to the periorbital region Unconditioned Stimulus (US), separated with a 500 ms long stimulus-free trace period. (B) YC (n = 21 rats; red) and AU (n = 21; pink) animals successfully acquire trace eyeblink conditioning. Criterion for successful learning is 60% Conditioned Responses (CRs) (dotted line). AI (n = 16; lime green) animals are unable to achieve 60% CRs, while YP (n = 19; blue) animals do not receive paired CS-US stimuli. Error bars: mean ± SEM. Inset, frequency distribution of %CR from aged animals in Session 5 of trace eyeblink conditioning shows a separation in behavior at around 55–60% CR. (C) Neurons from AI animals (n = 18 neurons) have a lower probability of firing relative to neurons from YC (n = 12), YP (n = 11), and AU (n = 19) animals when persistent firing is evoked with a 250 ms long 20 Hz train of current pulses and the neuronal membrane potential is 2 mV more hyperpolarized than spontaneous firing threshold. (Dunn’s, **p=0.0049; AI vs. YC *p=0.0188; AI vs. YP *p=0.0241). Error bars: median and quartiles (75%–25%). (D) Learning enhances persistent firing probability in neurons from YC animals (n = 11 neurons), relative to neurons from YP animals (n = 13). Neurons from AI animals (n = 16) have a lower probability of firing, relative to neurons from YC and AU animals (n = 15). Persistent firing evoked with a 250 ms long 20 Hz train of current pulses and the membrane potential is 5 mV more hyperpolarized than spontaneous firing threshold. (Dunn’s, AI vs. YC ***p<0.0001; AI vs. AU ***p=0.0008; **p=0.0063). Error bars: median and quartiles (75%–25%). (E) Neurons from AI animals (n = 11 neurons) have a lower probability of firing relative to neurons from YC (n = 8), and YP (n = 8), but not AU (n = 7) animals when persistent firing is evoked with a 2 s long train of 20 Hz current pulses and the neuronal membrane potential is 2 mV more hyperpolarized than spontaneous firing threshold. (Dunn’s AI vs. YC *p=0.0236; AI vs. YP *p=0.0236). Error bars: median and quartiles (75%–25%). See Tables 3–6.
Figure 2—figure supplement 1
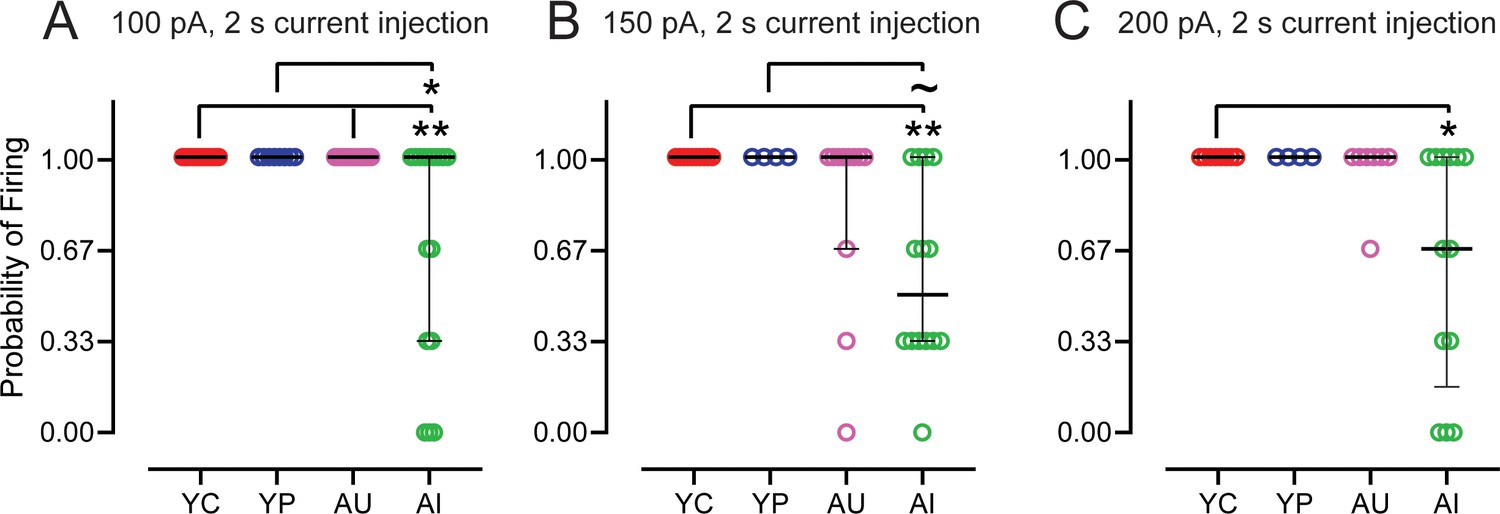
Neurons from aged impaired animals have a decreased probability of firing, when persistent firing is evoked with a 2 s long rectangular current injection and the membrane potential is held at 2 mV below spontaneous firing threshold.
(A) Neurons from AI animals (n = 16 neurons) have a lower probability of firing relative to neurons from YC (n = 14), and YP (n = 8), and AU (n = 17) animals when injected with a 100 pA current step injection. (Dunn’s, AI vs. YC **p=0.0024; AU vs. AI **p=0.0012; *p=0.0164). Error bars: median and quartiles (75%–25%). (B) Neurons from AI animals (n = 14 cells) have a lower probability of firing relative to neurons from YC animals (n = 10) when injected with a 150 pA current step injection. (Dunn’s, **p=0.0028;~p = 0.0639). Error bars: median and quartiles (75%–25%). (C) Neurons from AI animals (n = 13 cells) have a lower probability of firing relative to neurons from YC animals (n = 8) when injected with a 200 pA current step injection. (Dunn’s, *p=0.0356). Error bars: median and quartiles (75%–25%). See Table 5 .
Figure 2—figure supplement 2
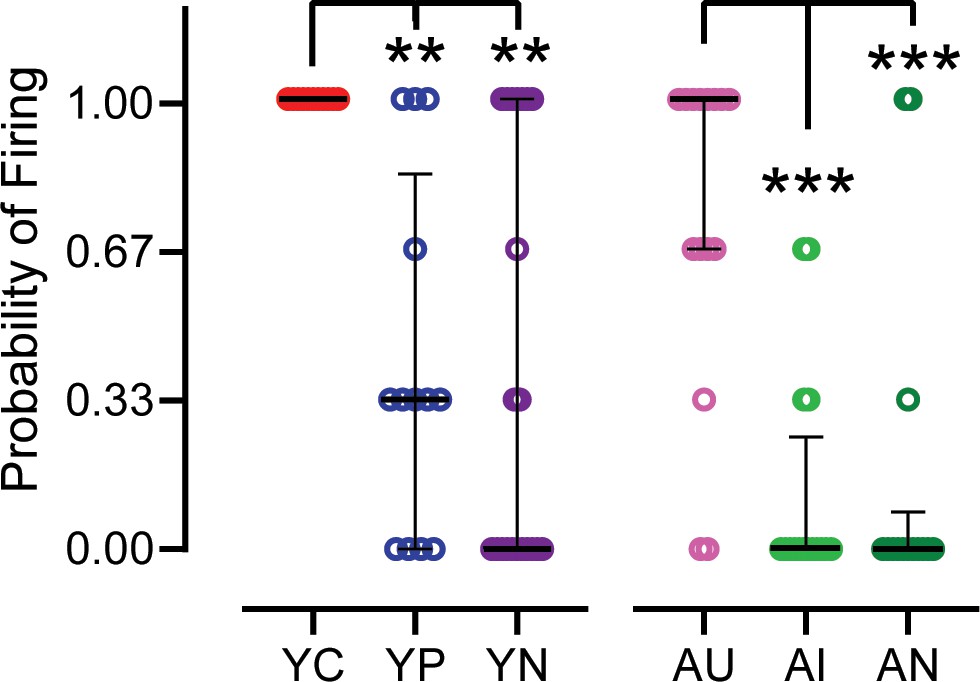
Neurons from YC had increased persistent firing probability compared to YP and YN, and neurons from AU had increased persistent firing probability compared to AI and AN.
Left, Persistent firing evoked with a 250 ms long 20 Hz training stimulus while the membrane potential was held 5 mV more hyperpolarized than spontaneous firing. Neurons from YC animals (n = 11 cells) have a higher probability of firing relative to neurons from YP (n = 13) or YN (n = 21) animals. (Kruskal-Wallis, H = 14.21, p=0.0008) (Dunn’s, YC vs. YP **p=0.0062, YC vs. YN **p=0.0010). Right, Neurons from AI animals (n = 15 cells) have a higher probability of firing relative to neurons from AI (n = 16) or AN (n = 14) animals. (Kruskal-Wallis, H = 18.81, p<0.0001) (Dunn’s, AU vs. AI ***p=0.0003; AU vs. AN ***p=0.0009). Error bars: median and quartiles (75%–25%). See Table 6.
Figure 3
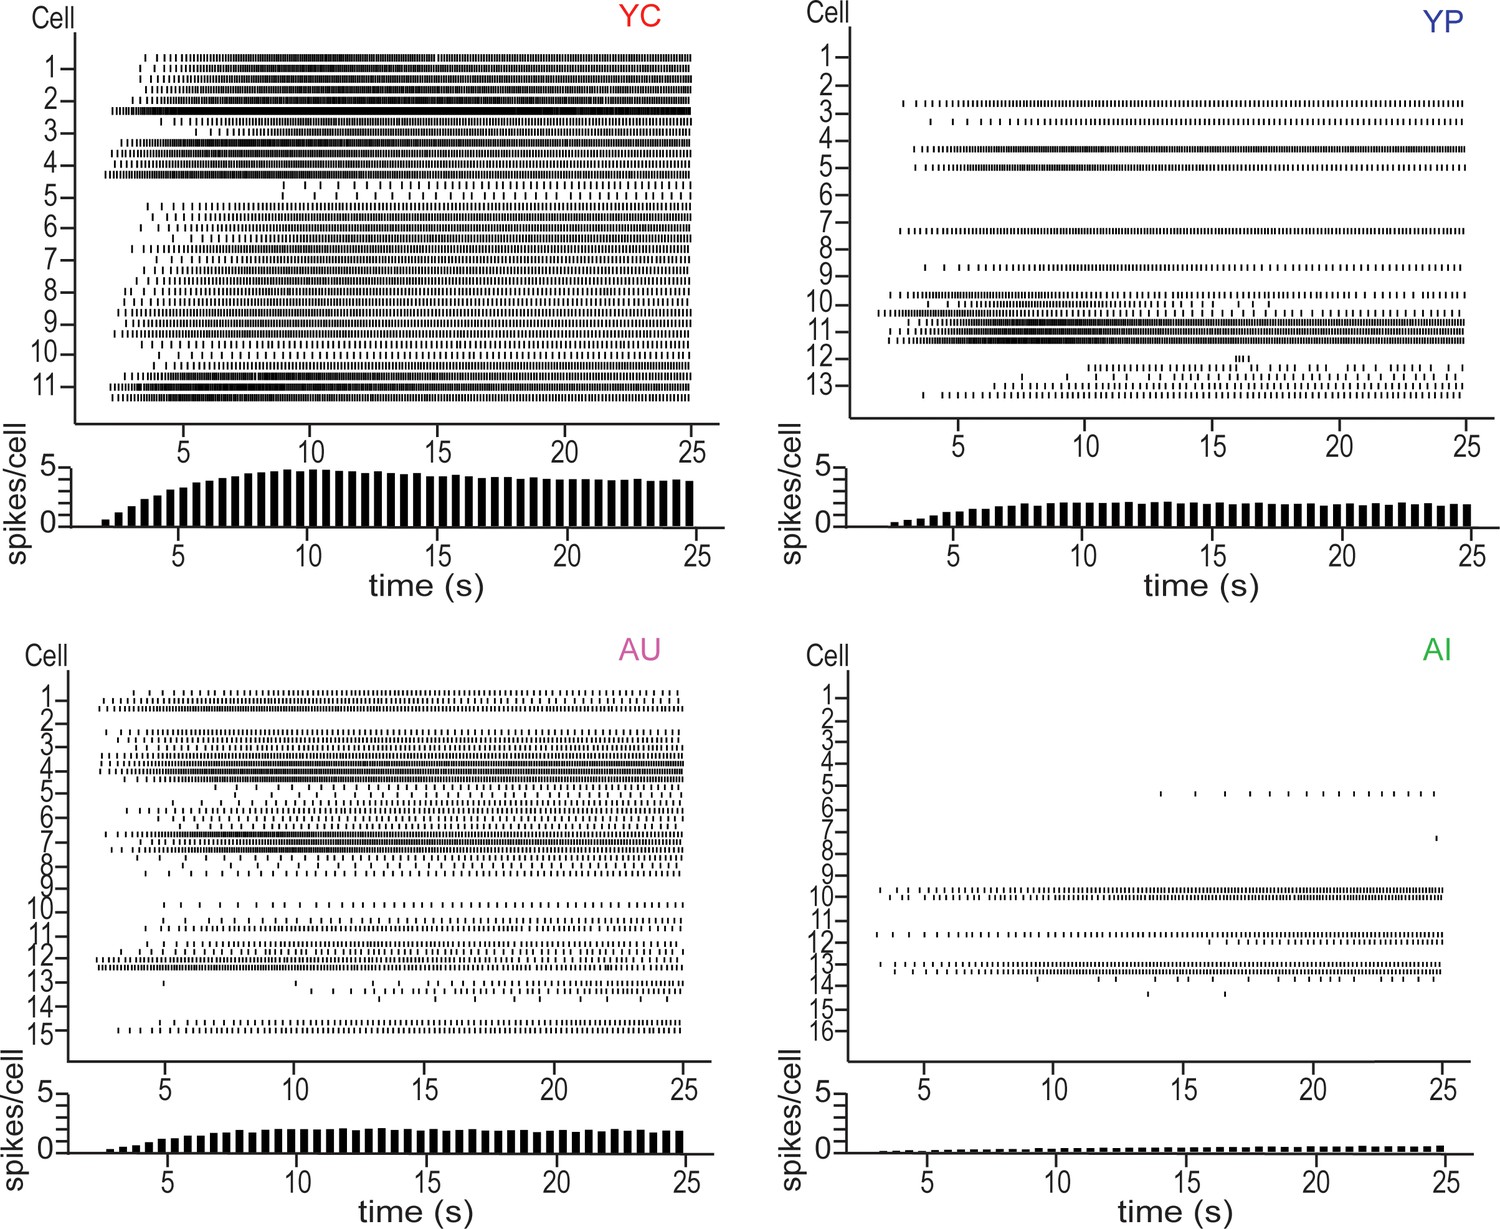
Raster plots of persistent firing activity for neurons from YC (top left), YP (top right), AU (bottom left) and AI (bottom right) animals.
Persistent firing evoked with 250 ms long 20 Hz pulses and neuronal membrane potential held at 5 mV below spontaneous firing. Activity from each of the three sweeps is shown for each neuron. Each vertical line in a row represents a spike. Each row represents one sweep of activity, with each cell marked by its second sweep of activity. Below each raster plot is a histogram of activity across the sweep. Neurons from YC animals are the most active, having the highest spike count per cell across the sweep. In contrast, neurons from AI animals have the lowest spike count across the sweep, reflecting its inactivity.
Figure 4 with 2 supplements
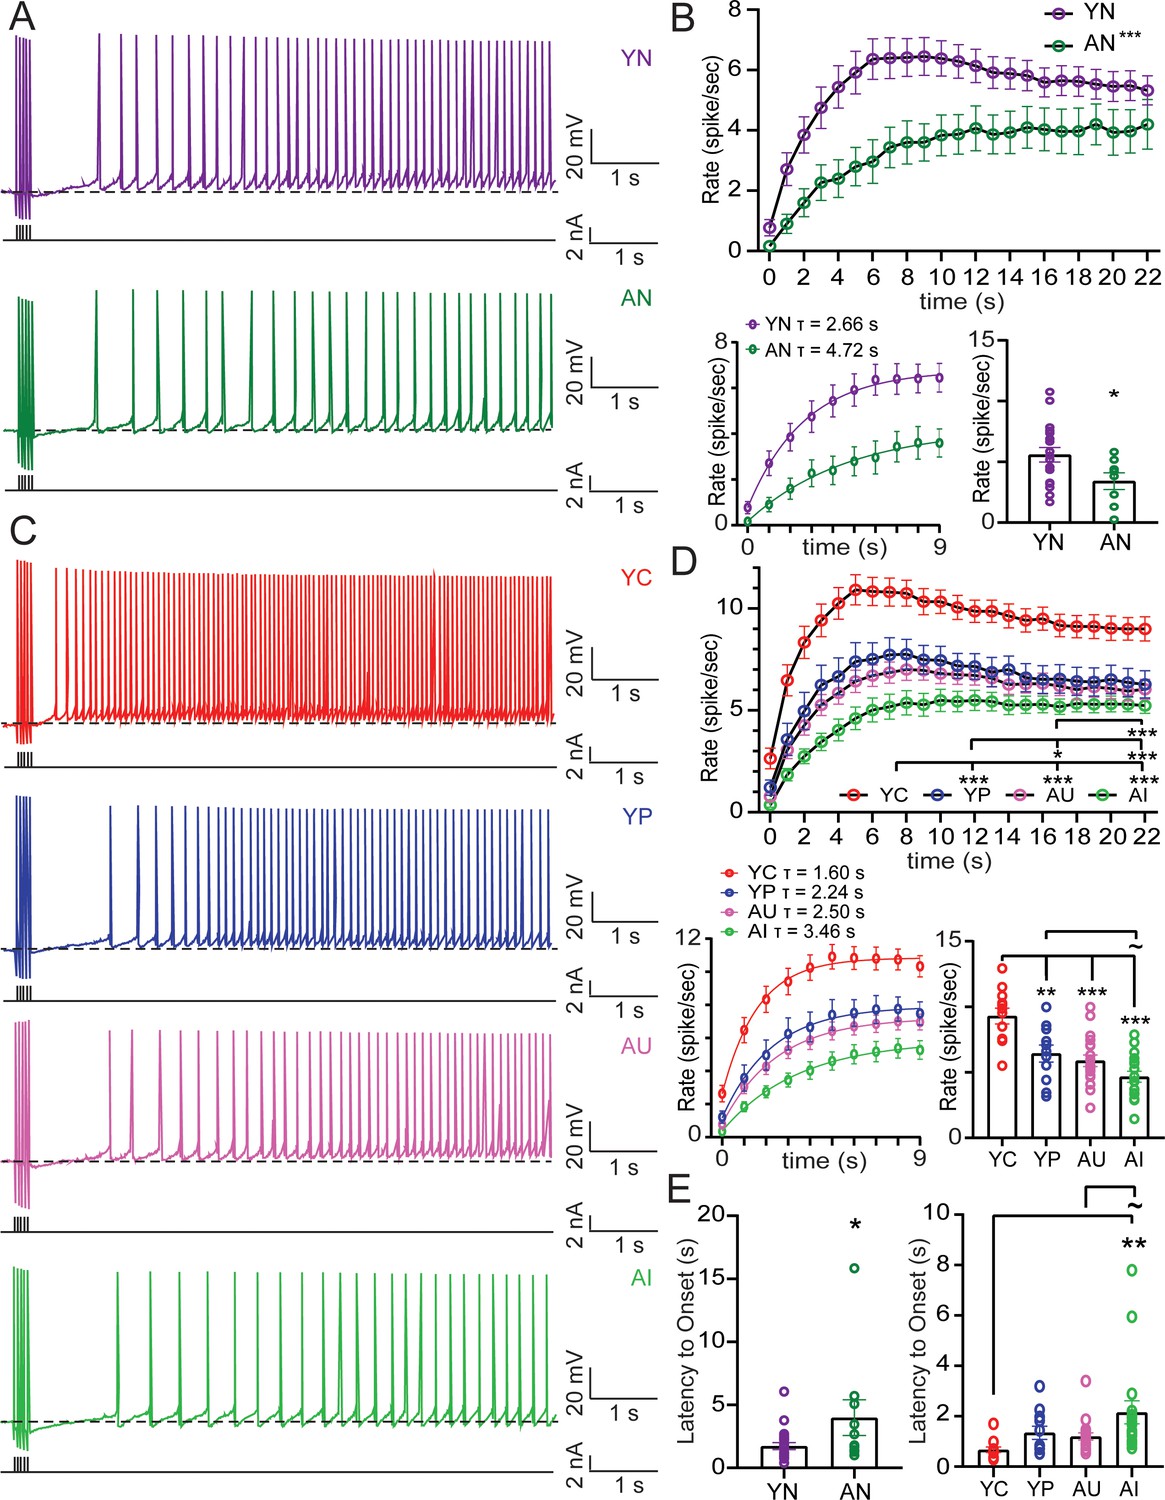
Aging decreases persistent firing rate and increases onset latency, while successful learning in young and aged increases firing rate and decreases latency.
(A) Persistent firing example traces from neurons from YN (top) and AN (bottom) animals evoked with 250 ms long train of 20 Hz current pulses and neuronal membrane potential held at 2 mV more hyperpolarized than spontaneous firing threshold. Dotted lines indicate spontaneous firing threshold. Black lines underneath persistent firing activity indicate the training stimulus. (B) Top, Firing rate increases over time, with neurons from YN animals (n = 22 neurons) increasing firing rate faster than neurons from AN animals (n = 10). (RM ANOVA, ***p<0.0001). Error bars: mean ± SEM. Bottom Left, Rising phase of persistent firing fit with a one phase exponential decay function. Error bars: mean ± SEM. Bottom Right, Mean firing rate of neurons (firing rate averaged across the entire sweep) from AN animals is slower than neurons from YN animals. (unpaired t-test, *p=0.0281). Error bars: mean ± SEM. (C) Persistent firing example traces from neurons from YC, YP, AU, AI (top to bottom) animals evoked with 250 ms long train of 20 Hz current Pulses. Neuronal membrane potential held at 2 mV below spontaneous firing threshold. Dotted lines indicate spontaneous firing threshold. Black lines underneath persistent firing activity indicate the training stimulus. (D) Top, Neurons from YC (n = 12 neurons) animals increase firing rate the fastest. Neurons from AU (n = 19) animals had a slower firing rate compared to neurons from YC and YP (n = 11) animals. Neurons from AI animals (n = 17) fire the slowest. (Tukey’s, ***p<0.0001; *p=0.0469). Error bars: mean ± SEM. Bottom Left, Rising phase of persistent firing fit with a one phase exponential decay function. Error bars: mean ± SEM. Bottom Right, Neurons from YC animals have the fastest mean firing rate. (Tukey’s, ***p<0.0001; **p=0.0042;~p = 0.0964). Error bars: mean ± SEM. (E) Left, Neurons from AN animals have a longer onset latency than neurons from YN. (un-paired t-test, *p=0.0347). Error bars: mean ± SEM. Right, Learning impairments in AI animals increased the time to onset, compared to young animals who successfully learn. (Tukey’s, **p=0.0063;~p = 0.0711). Error bars: mean ± SEM. See Tables 7–9. Source data files for the firing rate is available in Figure 4—source data 1.
-
Figure 4—source data 1
Source data for the mean firing rate and firing rate over time.
This excel file contains the values for the mean firing rate and firing rate over time. Data for the cells from YN and AN animals are in Tabs 1 and 2. Data for the cells from YC, YP, AU, and AI are in Tabs 2 and 3. Three sweeps of persistent firing were evoked from each cell. Mean firing rate for each sweep for each cell is shown. Firing rate was averaged over the three sweeps to determine the firing rate over time for each cell.
- https://cdn.elifesciences.org/articles/56816/elife-56816-fig4-data1-v2.xlsx
Figure 4—figure supplement 1
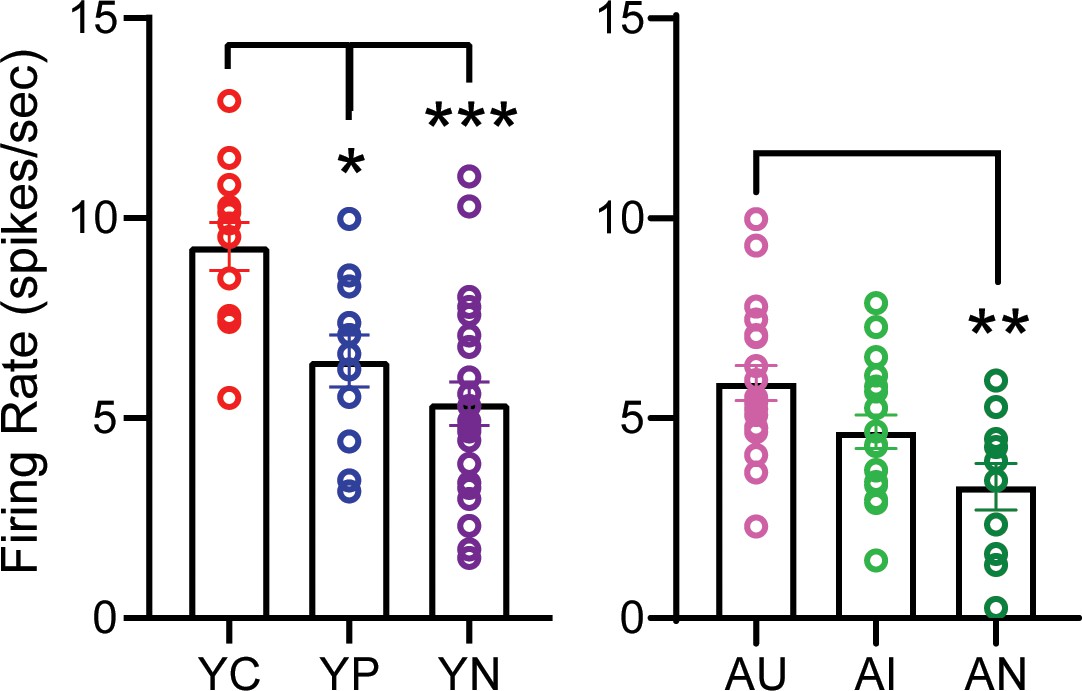
Neurons from YC had increased persistent firing rate compared to YP and YN, and neurons from AU had increased persistent firing rate compared to AN.
Left, Neurons from YC animals (n = 12 cells) have a faster mean persistent firing rate than neurons from YP (n = 11) or YN (n = 22) animals. (one-way ANOVA, F2, 42 = 11.07, p=0.0001) (Tukey’s, ***p<0.0001, *p=0.0144). Right, Neurons from AU animals (n = 19) have a faster persistent firing rate than neurons from AN (n = 10) but not AI (n = 17) animals. (one-way ANOVA, F2, 43 = 6.287, p=0.0027) (Tukey’s, **p=0.0020). Error bars: mean ± SEM. See Table 8.
Figure 4—figure supplement 2
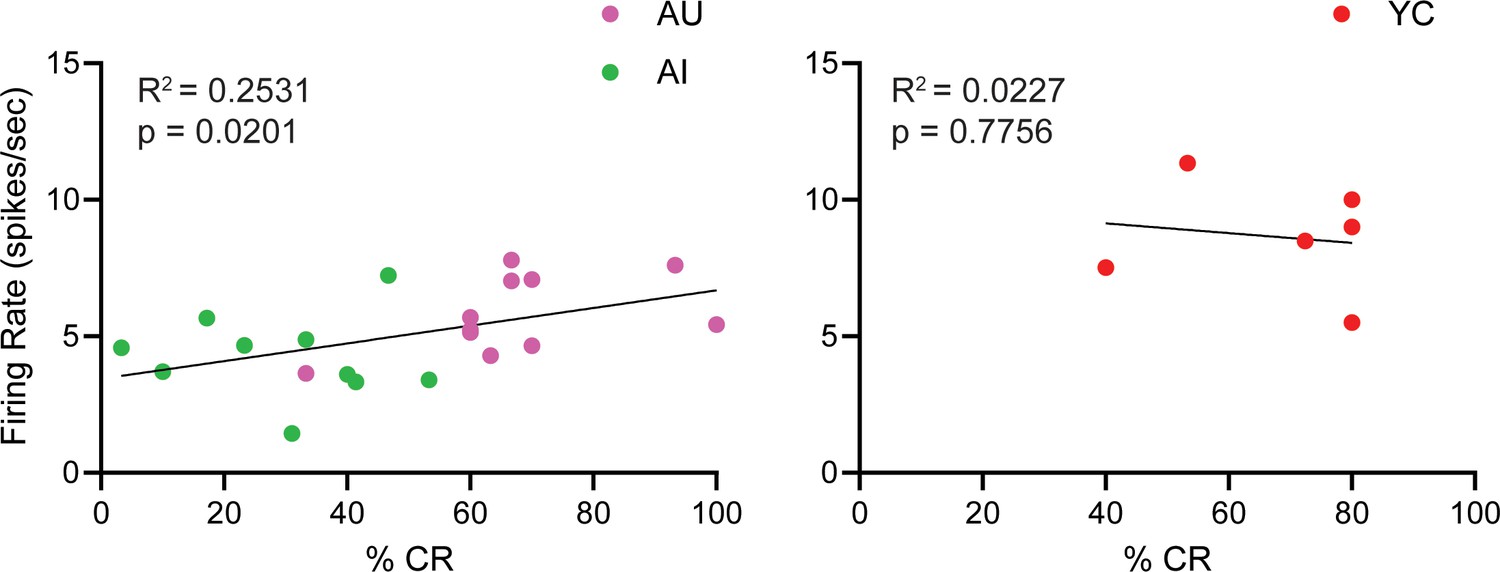
Session 5 %CR from AU and AI groups is positively correlated with persistent firing rate, but there is no correlation between Session 5 %CR from YC group and persistent firing rate.
Left, Session 5% CR is positively correlated with persistent firing rate in AU and AI animals (Pearson, r = 0.5031). Right, No correlation in Session 5% CR with persistent firing rate in YC animals (Pearson, r = −0.1507). Individual circles represent a single animal; values from the same animal were averaged together.
Figure 5 with 2 supplements
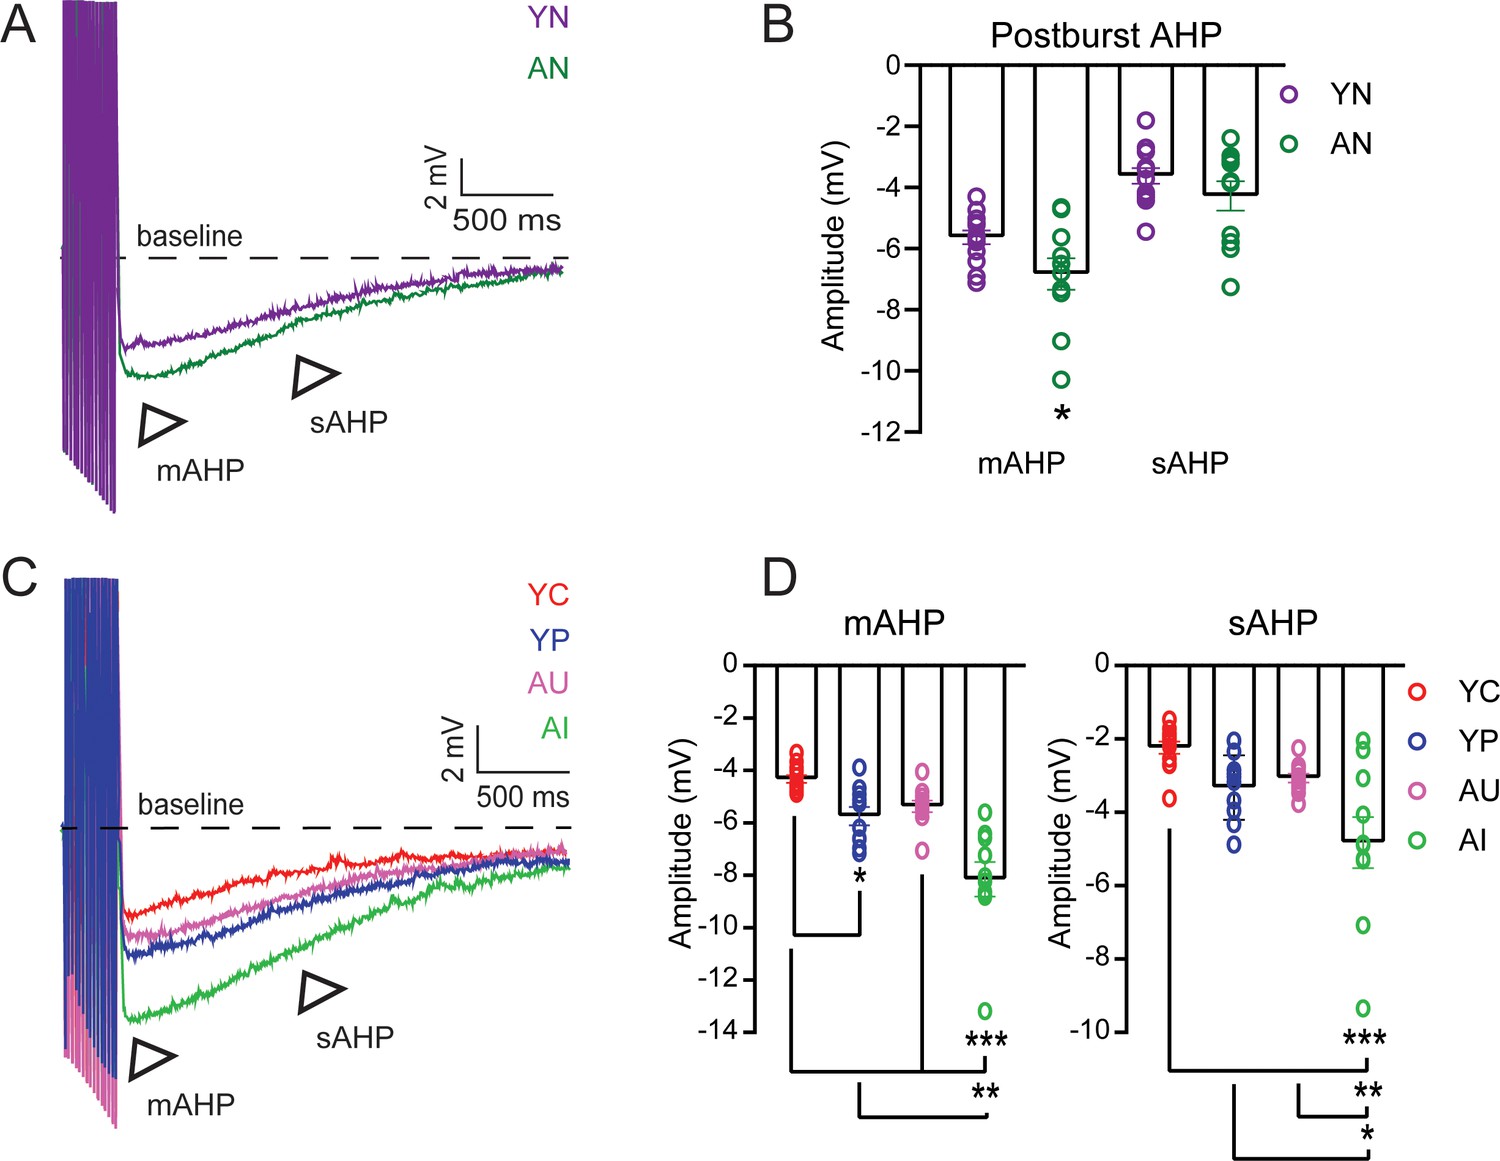
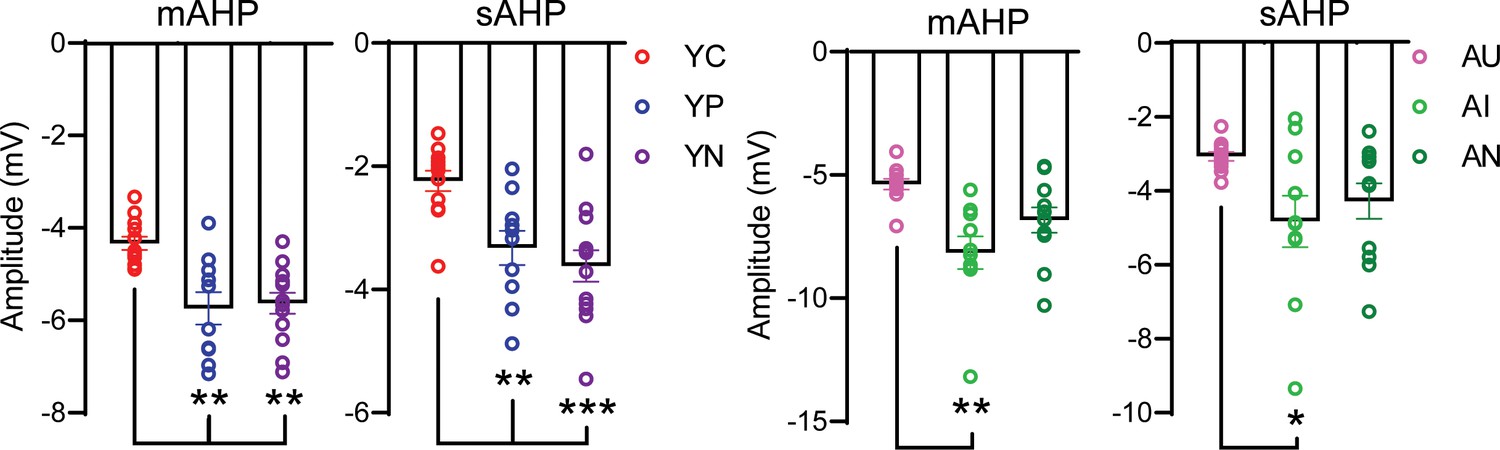
The postburst AHP amplitude is increased in LEC layer III neurons from behaviorally naïve aged animals but is decreased in neurons from both young adult and aged animals after successful acquisition of trace eyeblink conditioning.
(A) Postburst AHP example traces from neurons from YN (purple) and AN (dark green) animals. Arrows indicate the medium (mAHP) and slow (sAHP) AHPs. Suprathreshold current injections have been truncated to illustrate the postburst AHP. (B) mAHP from cells from AN animals (n = 11 neurons) is larger in amplitude relative to cells from YN animals (n = 13). (un-paired t-test, *p=0.0343). No difference between neurons from aged and young animals in sAHP. Error bars: mean ± SEM. (C) Postburst AHP Example Traces from Neurons from YC, YP, AU, AI. Arrows indicate the medium (mAHP) and slow (sAHP) AHPs. (D) Successful learning decreases Postburst AHP amplitude. Error bars: mean ± SEM. Left, mAHP Amplitudes. Neurons from YC (n = 12 neurons, n = 9 rats) animals have a smaller mAHP relative to neurons from YP (n = 10, n = 8 rats) animals. Neurons from AU animals (n = 11, n = 8 rats) are comparable to the neurons from young animals, while neurons from AI animals (n = 10, n = 5 rats) have a larger mAHP amplitude relative to neurons from YC, YP, and AU animals. (Tukey’s, ***p<0.0001; **p=0.0004; *p=0.0493). Right, sAHP Amplitudes. AI have a larger sAHP amplitude relative to the others. (Tukey’s, ***p<0.0001; **p=0.0092; *p=0.0380. Error bars: mean ± SEM. See Tables 10–12. Source data files for the postburst AHP amplitudes is available in Figure 5—source data 1.
-
Figure 5—source data 1
Source data for the postburst AHP.
- https://cdn.elifesciences.org/articles/56816/elife-56816-fig5-data1-v2.xlsx
Figure 5—figure supplement 1
Neurons from YC had smaller mAHP and sAHP amplitude compared to YP and YN, and neurons from AU had smaller mAHP and sAHP amplitude compared to AI.
Left, mAHP and sAHP amplitudes from cells from YC animals (n = 12 cells) are smaller relative to neurons from YP (n = 10) and YN (n = 13) animals. (mAHP: one-way ANOVA, F2, 32 = 10.39, p=0.0003) (mAHP: Tukey’s, YC vs. YP **p=0.0011; YC vs. YN **p=0.0013) (sAHP: one-way ANOVA, F2,32 = 9.867, p=0.0005) (sAHP: Tukey’s, ***p=0.0005; **p=0.0098). Right, mAHP and sAHP from cells from AU (n = 11 cells) animals are smaller in amplitude relative to neurons from AI animals (n = 10) but not AN animals (n = 11). (mAHP: one-way ANOVA, F2, 29 = 8.036, p=0.017) (mAHP: Tukey’s, **p=0.0011) (sAHP: one-way ANOVA, F2, 29 = 3.531, p=0.0424) (sAHP: Tukey’s, *p=0.0394). Error bars: mean ± SEM. See Table 12.
Figure 5—figure supplement 2
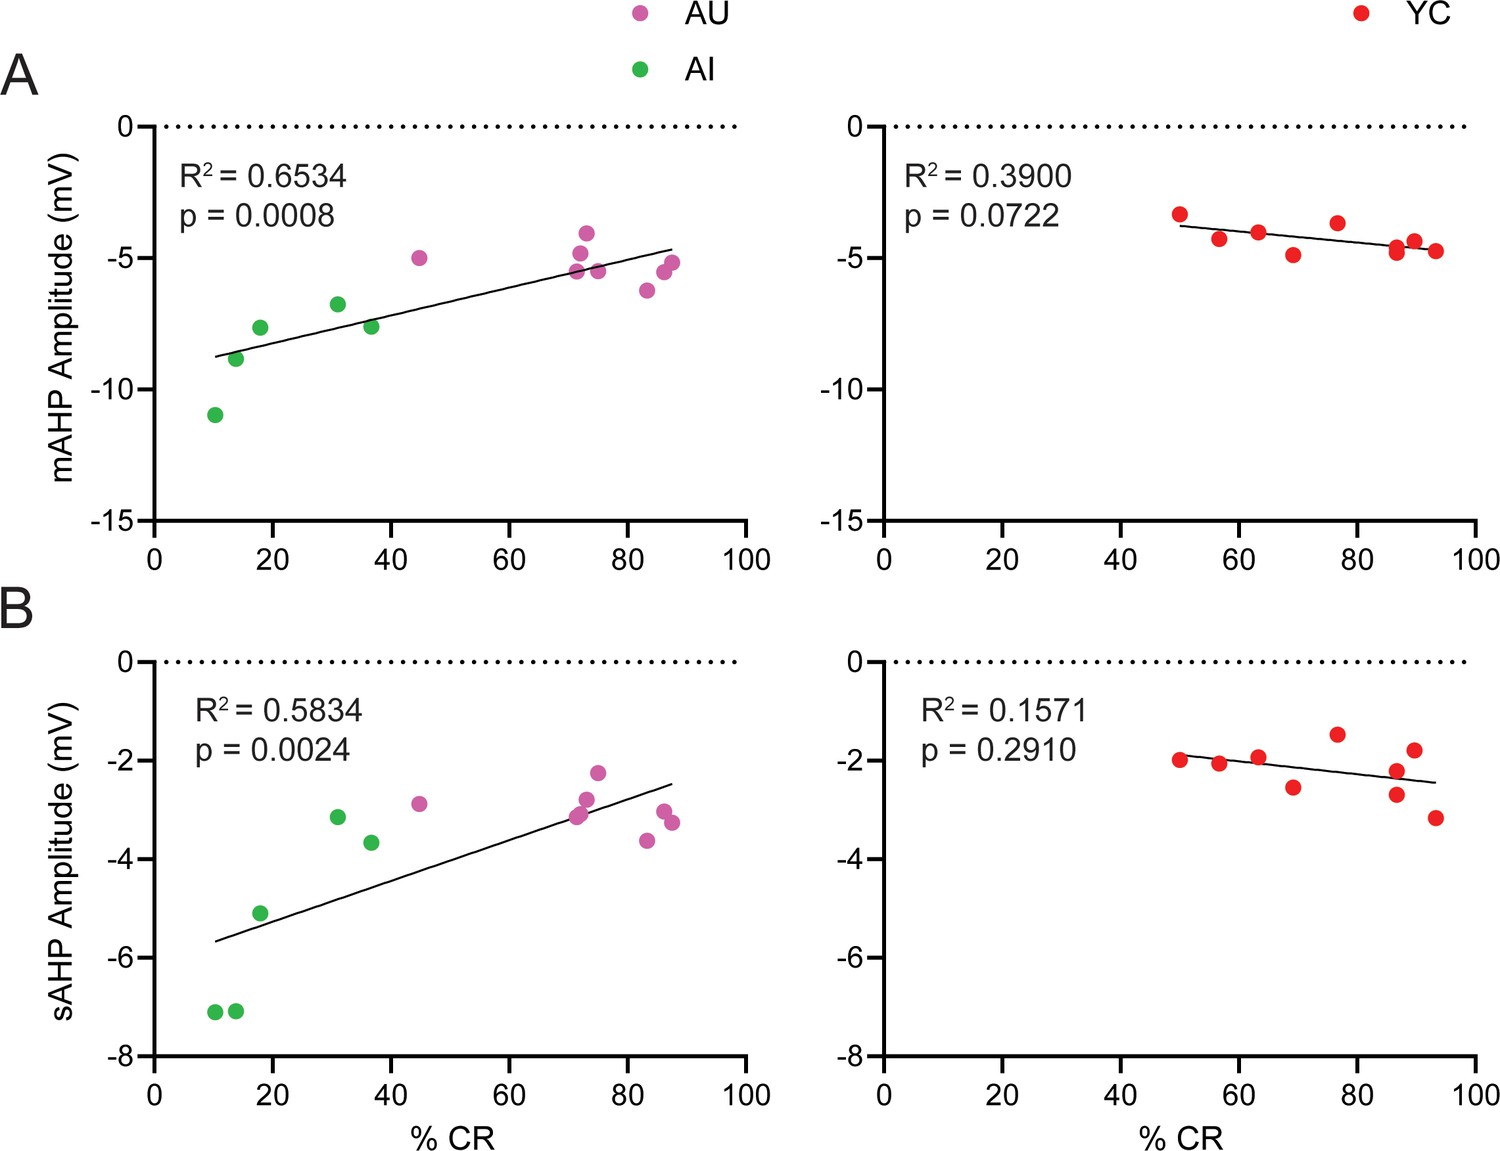
Session 5 %CR from AU and AI groups is positively correlated with mAHP and sAHP amplitudes, but there is no correlation between Session 5 %CR from YC group and mAHP and sAHP amplitudes.
(A) Left, Session 5% CR is positively correlated with mAHP amplitude in AU and AI animals (Pearson, r = 0.8083). Right, No correlation in Session 5% CR with mAHP amplitude in YC animals (Pearson, r = −0.6245). (B) Left, Session 5% CR is positively correlated with sAHP amplitude in AU and AI animals (Pearson, r = 0.7638). Right, No correlation in Session 5% CR with sAHP amplitude in YC animals (Pearson, r = −0.3963).Individual circles represent a single animal; values from the same animal were averaged together.
Figure 6 with 2 supplements

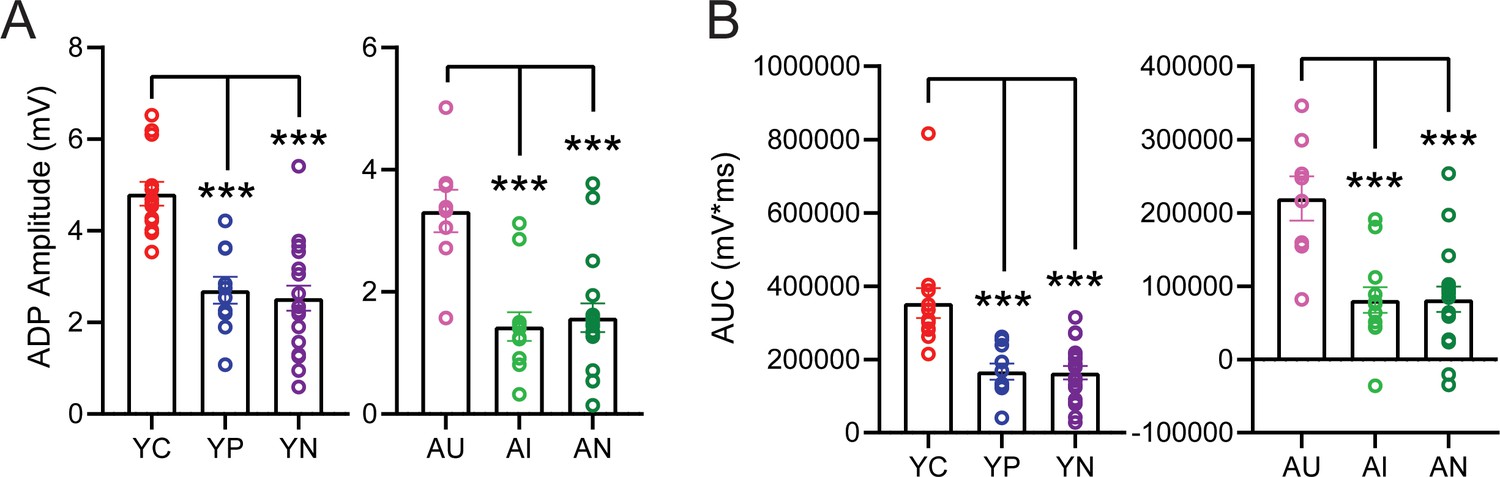
The afterdepolarization (ADP) and plateau potential (PP) determine persistent firing properties and are increased in neurons from young adult and aged animals that successfully acquire trace eyeblink conditioning but decreased in neurons from aged animals that are learning impaired.
(A) Averaged ADPs from neurons from YN and AN animals. Shaded areas: SEM. Black lines underneath the averaged traces indicate the training stimulus. (B) Left, ADP peak amplitude from neurons from AN animals (n = 17 neurons) is smaller than in neurons from YN animals (n = 19). (unpaired t-test, *p=0.0130). Error bars: mean ± SEM. Right, Neurons from AN animals have a smaller ADP and PP area. (unpaired t-test, **p=0.0025). Error bars: mean ± SEM. (C) Averaged ADPs from neurons from YC, YP, AU, and AI animals. Shaded areas: SEM. Black lines underneath the averaged traces indicate the training stimulus. (D) Left, Neurons from YC animals (n = 13 neurons) have the largest ADP peak amplitude compared to neurons from YP (n = 10), AU (n = 8), and AI (n = 12), while neurons from AI have the smallest ADP peak. (Tukey’s, ***p<0.0001; ** YC vs. AU p=0.0042, ** AI vs. AU p=0.0003; *p=0.0115). Error bars: mean ± SEM. Right, Neurons from YC animals have the largest ADP and PP area, while neurons from AI animals have the smallest. (Tukey’s, ***p<0.0001; **p=0.0005; YC vs. AU *p=0.0265; AI vs. AU *p=0.0231). Error bars: mean ± SEM. (E) ADP Amplitude determines persistent firing properties. Left, A larger ADP (>~4 mV) allows for more successful persistent firing, when persistent firing was evoked with the membrane potential 5 mV more hyperpolarized than spontaneous firing threshold. Dotted line indicates the ADP size boundary that results in the difference between successful firing (i.e. 1.0) and unsuccessful firing (i.e. 0.0). Middle, ADP amplitude is positively correlated with persistent firing rate. Right, ADP amplitude is negatively correlated with the latency to firing onset. See Tables 13–15. Source data files for the ADP amplitude and AUC is available in Figure 6—source data 1.
-
Figure 6—source data 1
Source data for ADP amplitude and AUC.
- https://cdn.elifesciences.org/articles/56816/elife-56816-fig6-data1-v2.xlsx
Figure 6—figure supplement 1
Neurons from YC had larger ADP and PP compared to YP and YN, and neurons from AU had larger ADP and PP compared to AI and AN.
(A) Left, ADP amplitude of cells from YC animals (n = 13 cells) is larger than in cells from YP animals (n = 10) or YN animals (n = 19) (one-way ANOVA, F2, 39 = 20.02, p<0.0001) (Tukey’s, ***p<0.0001). Right, ADP amplitude of cells from AU animals (n = 8 cells) is larger than in cells from AI (n = 12) or AN (n = 17) animals. (one-way ANOVA, F2, 34 = 12.13, p=0.0001) (Tukey’s, AU vs. AI ***p=0.0002; AU vs. AN ***p=0.0003). Error bars: mean ± SEM. (B) Left, ADP and PP area from YC animals (n = 13 cells) is larger than in cells from YP animals (n = 10) or YN animals (n = 19). (one-way ANOVA, F2, 39 = 14.89, p<0.0001) (Tukey’s, YC vs. YP ***p=0.0003; YC vs. YN ***p<0.0001). Right, ADP and PP area from AU animals (n = 8) is larger than in cells from AI (n = 12) or AN (n = 17) animals. (one-way ANOVA, F2, 34 = 11.85, p=0.0001) (Tukey’s, AU vs. AI ***p=0.0004; AU vs. AN ***p=0.0002). Error bars: mean ± SEM. See Table 15.
Figure 6—figure supplement 2
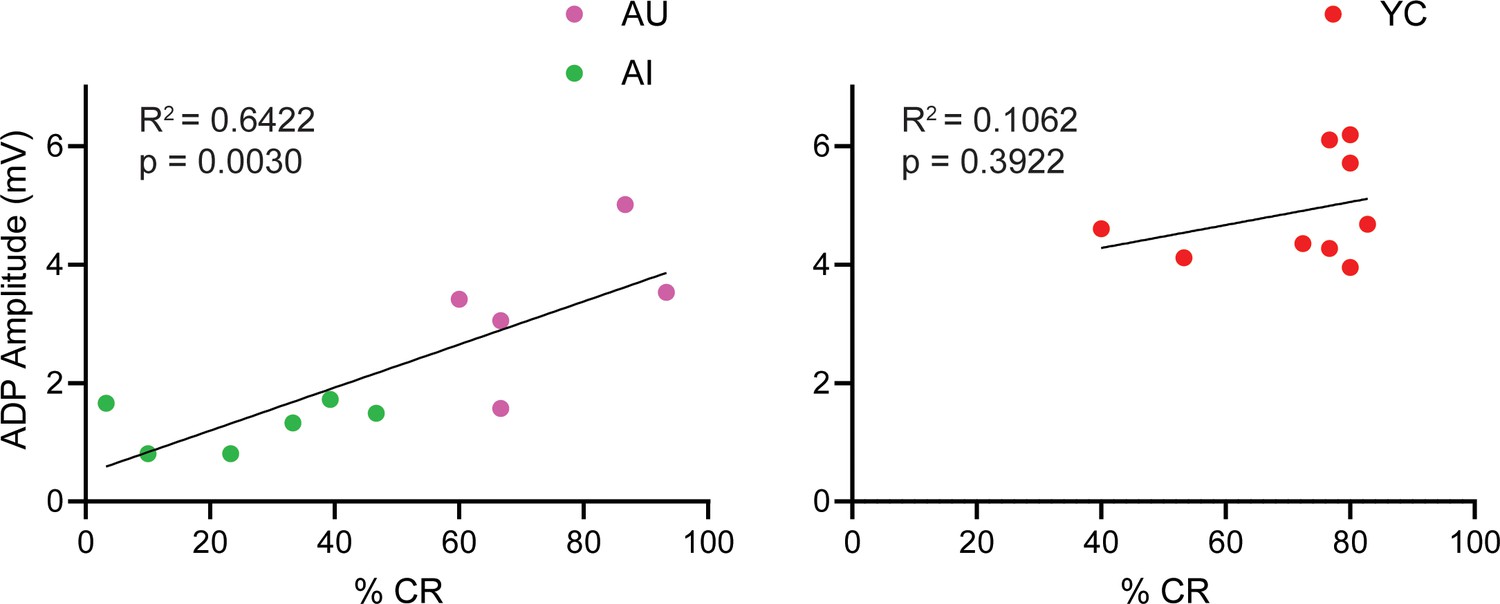
Session 5 %CR from AU and AI groups is positively correlated with ADP amplitude, but there is no correlation between Session 5 %CR from the YC group and ADP amplitude.
Left, Session 5% CR is positively correlated with ADP amplitude in AU and AI animals (Pearson, r = 0.8014). Right, No correlation in Session 5% CR with ADP amplitude in YC animals (Pearson, r = 0.3258).
Figure 7
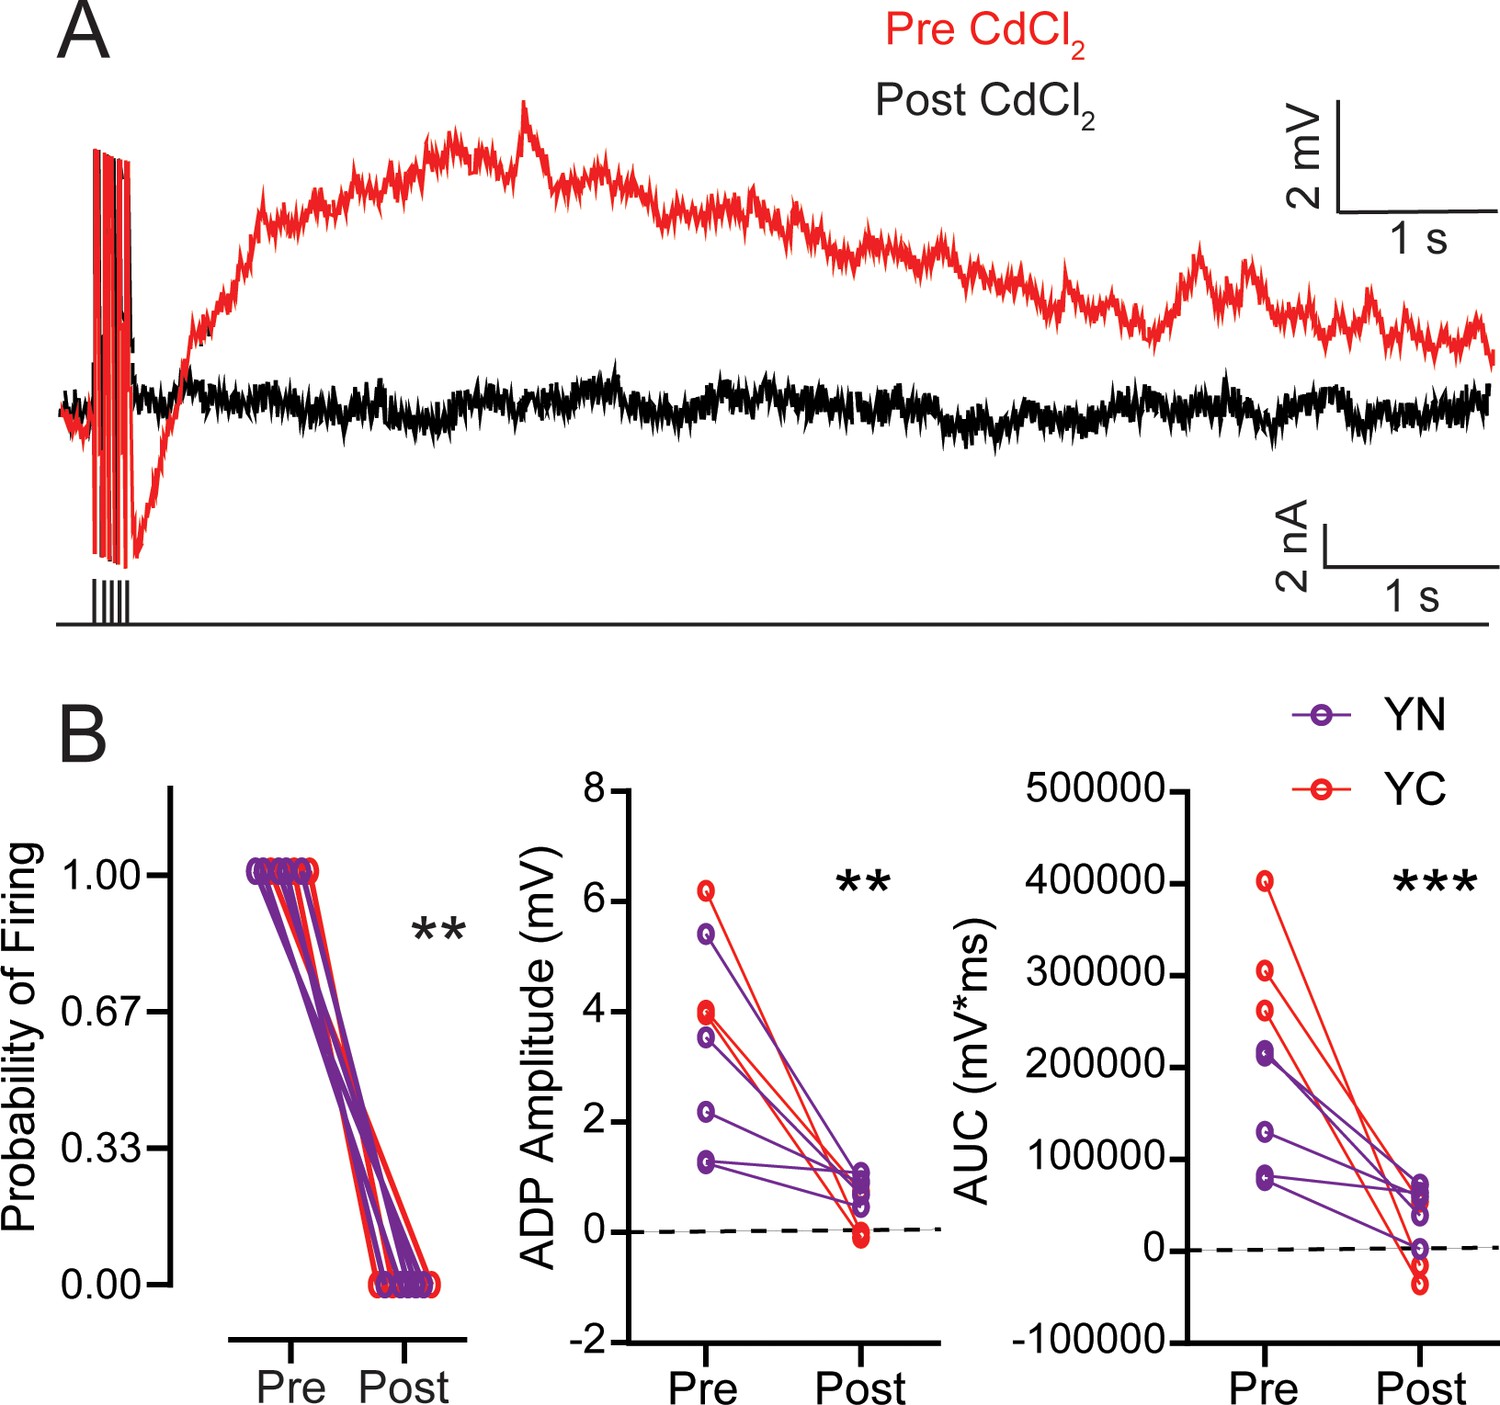
The ADP is Ca2+-dependent and is eliminated by CdCl2 in neurons from both YN and YC animals.
(A) Pre- and post-CdCl2 ADP example traces. ADP is evoked with 250 ms 20 Hz train of current pulses as the membrane potential is held 10 mV more hyperpolarized than spontaneous firing threshold. Black lines underneath the traces the training stimulus. (B) Left, CdCl2 eliminates persistent firing from neurons from both YN (n = 5 neurons) and YC (n = 3) animals. (Wilcoxon, **p=0.0078). Middle, CdCl2 reduces the amplitude of the ADP. (pre-post RM ANOVA, **p=0.0018). Right, CdCl2 reduces the area under the curve of the ADP and PP. (pre-post RM ANOVA, ***p=0.0002). See Table 16. Source data files for the ADP amplitude and AUC is available in Figure 7—source data 1.
-
Figure 7—source data 1
Source data for ADP amplitude and AUC before and after CdCl2.
This excel file contains the values for the ADP amplitude and AUC for cells from YN and YC animals before and after CdCl2 application. Values for ADP peak are in Tab 1. Values for AUC are in Tab 2. Three sweeps were evoked per cell.
- https://cdn.elifesciences.org/articles/56816/elife-56816-fig7-data1-v2.xlsx
Tables
Table 1
Persistent firing probability evoked with a 100 pA, 150 pA, and 200 pA training stimulus with statistical differences between YN and AN.
Related to Figure 1B.
| Group | n | 100 pA (%) | p-value | n | 150 pA (%) | p-value | n | 200 pA (%) | p-Value |
|---|---|---|---|---|---|---|---|---|---|
| YN | 25 | 97.3 ± 2.7 | 18 | 96.3 ± 2.5 | 16 | 85.4 ± 6.1 | |||
| AN | 18 | 72.2 ± 8.6 | vs. YN, 0.0016** | 10 | 56.7 ± 14.1 | vs. YN, 0.0029** | 10 | 66.7 ± 13.2 | vs. YN, 0.2458 |
| Group | 100 pA | 150 pA | 200 pA | ||||||
| Q1 (25%) | Median | Q3 (75%) | Q1 | Median | Q3 | Q1 | Median | Q3 | |
| YN | 1.00 | 1.00 | 1.00 | 1.00 | 1.00 | 1.00 | 0.67 | 1.00 | 1.00 |
| AN | 0.33 | 1.00 | 1.00 | 0.00 | 0.67 | 1.00 | 0.25 | 0.83 | 1.00 |
-
n, number of cells in group; p-value, Mann-Whitney.
Table 2
Persistent firing probability evoked with a 20 Hz current pulses at various stimulus lengths and membrane holding potentials with statistical differences between YN and AN.
Related to Figure 1D, F, H.
| Group | n | 20 Hz, 2 s, 2 mV below (%) | p-Value | n | 20 Hz, 250 ms, 2 mV below (%) | p-Value | n | 20 Hz, 250 ms, 5 mV below (%) | p-Value |
|---|---|---|---|---|---|---|---|---|---|
| YN | 14 | 97.6 ± 2.4 | 22 | 100.0 ± 0.0 | 21 | 39.7 ± 10.2 | |||
| AN | 10 | 66.7 ± 11.1 | vs. YN, 0.0052** | 12 | 66.7 ± 11.6 | vs. YN, 0.0007** | 14 | 16.7 ± 9.7 | vs. YN, 0.1304 |
| Group | 20 Hz, 2s, 2 mV below | 20 Hz, 250 ms, 2 mV below | 20 Hz, 250 ms, 5 mV below | ||||||
| Q1 (25%) | Median | Q3 (75%) | Q1 | Median | Q3 | Q1 | Median | Q3 | |
| YN | 1.00 | 1.00 | 1.00 | 1.00 | 1.00 | 1.00 | 0.00 | 0.00 | 1.00 |
| AN | 0.33 | 0.67 | 1.00 | 0.33 | 0.83 | 1.00 | 0.00 | 0.00 | 0.08 |
-
n, number of cells in group; p-value, Mann-Whitney.
Table 3
Learning curves with statistical differences between YC, YP, AU, and AI.
Related to Figure 2B.
| Group | n | Session 1 (% Late CR’s) | p-Value | Session 5 (% Late CR’s) | p-Value |
|---|---|---|---|---|---|
| YC | 21 | 34.5 ± 4.9 | vs. YP, 0.0035** | 74.3 ± 3.2 | vs. YP, <0.0001*** |
| YP | 19 | 13.6 ± 2.6 | 18.7 ± 3.6 | ||
| AU | 21 | 17.7 ± 2.9 | vs. YC, 0.0266* | 69.9 ± 3.2 | vs. YC, 0.7789 |
| vs. YP, 0.7199 | vs. YP, <0.0001*** | ||||
| AI | 16 | 11.9 ± 2.1 | vs. AU, 0.3710 | 29.1 ± 4.1 | vs. AU, <0.0001*** |
| vs. YC, 0.0011** | vs. YC, <0.0001*** | ||||
| vs. YP, 0.9518 | vs. YP, 0.2567 |
-
n, number of rats in group; p-value, Tukey’s multiple comparisons test.
Table 4
Persistent firing probability evoked with a 20 Hz current pulses at various stimulus lengths and membrane holding potentials with statistical differences between YC, YP, AU, and AI.
Related to Figure 2C, D, E.
| Group | n | 20 Hz, 2 s, 2 mV below (%) | p-Value | n | 20 Hz, 250 ms, 2 mV below (%) | p-Value | n | 20 Hz, 250 ms, 5 mV below (%) | p-Value |
|---|---|---|---|---|---|---|---|---|---|
| YC | 8 | 100.0 ± 0.0 | vs. YP, >0.9999 | 12 | 100.0 ± 0.0 | vs. YP, >0.9999 | 11 | 100.0 ± 0.0 | vs. YP, 0.0063** |
| YP | 8 | 100.0 ± 0.0 | 11 | 100.0 ± 0.0 | 13 | 41.0 ± 10.8 | |||
| AU | 7 | 95.2 ± 4.8 | vs. YC, >0.9999 | 19 | 100.0 ± 0.0 | vs. YC, >0.9999 | 15 | 73.34 ± 9.3 | vs. YC, 0.5802 |
| vs. YP, >0.9999 | vs. YP, >0.9999 | vs. YP, 0.4308 | |||||||
| AI | 11 | 72.7 ± 8.8 | vs. AU, 0.2046 | 18 | 85.19 ± 6.2 | vs. AU, 0.0049** | 16 | 12.5 ± 6.0 | vs. AU, 0.0008** |
| vs. YC, 0.0236* | vs. YC, 0.0188* | vs. YC, <0.0001*** | |||||||
| vs. YP, 0.0236* | vs. YP, 0.0241* | vs. YP, 0.3874 | |||||||
| Group | 20 Hz, 2s, 2 mV below | 20 Hz, 250 ms, 2 mV below | 20 Hz, 250 ms, 5 mV below | ||||||
| Q1 (25%) | Median | Q3 (75%) | Q1 | Median | Q3 | Q1 | Median | Q3 | |
| YC | 1.00 | 1.00 | 1.00 | 1.00 | 1.00 | 1.00 | 1.00 | 1.00 | 1.00 |
| YP | 1.00 | 1.00 | 1.00 | 1.00 | 1.00 | 1.00 | 0.00 | 0.33 | 0.83 |
| AU | 1.00 | 1.00 | 1.00 | 1.00 | 1.00 | 1.00 | 0.67 | 1.00 | 1.00 |
| AI | 0.33 | 0.67 | 1.00 | 0.67 | 1.00 | 1.00 | 0.00 | 0.00 | 0.25 |
-
n, number of cells in group; p-value, Dunn’s multiple comparisons test.
Table 5
Persistent firing probability evoked with a 100 pA, 150 pA, and 200 pA training stimulus with statistical differences between YC, YP, AU, and AI.
Related to Figure 2—figure supplement 1.
| Group | n | 100 pA (%) | p-Value | n | 150 pA (%) | p-Value | n | 200 pA (%) | p-Value |
|---|---|---|---|---|---|---|---|---|---|
| YC | 14 | 100.0 ± 0.0 | vs. YP, >0.9999 | 10 | 100.0 ± 0.0 | vs. YP, >0.9999 | 8 | 100.0 ± 0.0 | vs. YP, >0.9999 |
| YP | 8 | 100.0 ± 0.0 | 4 | 100.0 ± 0.0 | 4 | 100.0 ± 0.0 | |||
| AU | 17 | 100.0 ± 0.0 | vs. YC, >0.9999 | 11 | 81.8 ± 10.4 | vs. YC, >0.9999 | 7 | 95.2 ± 4.8 | vs. YC, >0.9999 |
| vs. YP, >0.9999 | vs. YP, >0.9999 | vs. YP, >0.9999 | |||||||
| AI | 16 | 68.8 ± 10.3 | vs. AU, 0.0012** | 14 | 57.1 ± 8.9 | vs. AU, 0.1846 | 13 | 61.5 ± 11.8 | vs. AU, 0.2366 |
| vs. YC, 0.0024** | vs. YC, 0.0028** | vs. YC, 0.0356* | |||||||
| vs. YP, 0.0164* | vs. YP, 0.0639~ | vs. YP, 0.1836 | |||||||
| Group | 100 pA | 150 pA | 200 pA | ||||||
| Q1 (25%) | Median | Q3 (75%) | Q1 | Median | Q3 | Q1 | Median | Q3 | |
| YC | 1.00 | 1.00 | 1.00 | 1.00 | 1.00 | 1.00 | 1.00 | 1.00 | 1.00 |
| YP | 1.00 | 1.00 | 1.00 | 1.00 | 1.00 | 1.00 | 1.00 | 1.00 | 1.00 |
| AU | 1.00 | 1.00 | 1.00 | 0.67 | 1.00 | 1.00 | 1.00 | 1.00 | 1.00 |
| AI | 0.33 | 1.00 | 1.00 | 0.33 | 0.50 | 1.00 | 0.17 | 0.67 | 1.00 |
-
n, number of cells in group; p-value, Dunn’s multiple comparisons test.
Table 6
Persistent firing probability with statistical differences in young (YC, YP, YN) and aged (AU, AI, AN).
Related to Figure 2—figure supplement 2.
| Group | n | Probability (%) | p-Value |
|---|---|---|---|
| YC | 11 | 100.0 ± 0.0 | |
| YP | 13 | 41.0 ± 10.8 | vs. YC, 0.0062** |
| YN | 21 | 39.7 ± 10.2 | vs. YC, 0.0010** |
| vs. YC, 0.9999 | |||
| Group | n | Probability (%) | p-Value |
| AU | 15 | 73.3 ± 9.3 | |
| AI | 16 | 12.5 ± 6.0 | vs. AU, 0.0003*** |
| AN | 14 | 16.7 ± 9.7 | vs. AU, 0.0009*** |
| vs. YC, 0.9999 |
-
n, number of cells in group; p-value, Dunn’s multiple comparisons test. Persistent firing probability evoked with a 250 ms long 20 Hz training stimulus and membrane holding potential 5 mV more hyperpolarized than spontaneous firing threshold.
Table 7
Mean persistent firing rate, peak firing rate, and onset latency with statistical differences between YN and AN.
Related to Figure 4B, E.
| Group | n | Mean Firing Rate (spikes/sec) | p-Value | Peak Firing Rate (spikes/sec) | Latency to Onset (s) | p-Value |
|---|---|---|---|---|---|---|
| YN | 22 | 5.36 ± 0.54 | 6.45 ± 0.63 | 1.74 ± 0.27 | ||
| AN | 10 | 3.29 ± 0.58 | vs. YN, 0.0281* | 4.20 ± 0.67 | 3.96 ± 1.41 | vs. YN, 0.0347* |
-
n, number of cells in group; p-value, unpaired t-test.
Table 8
Mean persistent firing rate, peak firing rate, and onset latency with statistical differences between YC, YP, AU, AI.
Related to Figure 4D, E.
| Group | n | Mean Firing Rate (spikes/sec) | p-Value | Peak Firing Rate (spikes/sec) | Firing Rate Across Time p-value | Latency to Onset (s) | p-Value |
|---|---|---|---|---|---|---|---|
| YC | 12 | 9.30 ± 0.60 | vs. YP, 0.0042** | 10.92 ± 0.74 | vs. YP, <0.0001*** | 0.67 ± 0.07 | vs. YP, 0.5026 |
| YP | 11 | 6.43 ± 0.65 | 7.76 ± 0.73 | 1.35 ± 0.20 | |||
| AU | 19 | 5.88 ± 0.44 | vs. YC, <0.0001*** | 7.00 ± 0.52 | vs. YC, <0.0001*** | 1.20 ± 0.11 | vs. YC, 0.6059 |
| vs. YP, 0.8783 | vs. YP, 0.0469* | vs. YP, 0.9861 | |||||
| AI | 17 | 4.66 ± 0.42 | vs. AU, 0.2427 | 5.49 ± 0.54 | vs. AU, <0.0001*** | 2.15 ± 0.46 | vs. AU, 0.0711~ |
| vs. YC, <0.0001*** | vs. YC, <0.0001*** | vs. YC, 0.0063** | |||||
| vs. YP, 0.0964~ | vs. YP, <0.0001*** | vs. YP, 0.2743 |
-
n, number of cells in group; p-value, Tukey’s multiple comparisons test.
Table 9
Persistent firing rate with statistical differences in young (YC, YP, YN) and aged (AU, AI, AN).
Related to Figure 4—figure supplement 1.
| Group | n | Mean firing rate (spikes/sec) | p-Value |
|---|---|---|---|
| YC | 12 | 9.30 ± 0.60 | |
| YP | 11 | 6.43 ± 0.65 | vs. YC, 0.0144* |
| YN | 22 | 5.36 ± 0.54 | vs. YC, <0.0001*** |
| vs. YP, 0.4406 | |||
| Group | n | Mean firing rate (spikes/sec) | p-Value |
| AU | 19 | 5.88 ± 0.43 | |
| AI | 17 | 4.66 ± 0.42 | vs. AU, 0.1216 |
| AN | 10 | 3.29 ± 0.58 | vs. AU, 0.0020** |
| vs. AI, 0.1536 |
-
n, number of cells in group; p-value, Tukey’s multiple comparisons test.
Table 10
Postburst AHP (mAHP and sAHP) values with statistical differences between YN and AN.
Related to Figure 5B.
| Group | n | mAHP (mV) | p-Value | sAHP (mV) | p-Value |
|---|---|---|---|---|---|
| YN | 13 | −5.63 ± 0.23 | −3.62 ± 0.26 | ||
| AN | 11 | −6.83 ± 0.51 | vs. YN, 0.0343* | −4.28 ± 0.48 | vs. YN, 0.2167 |
-
n, number of cells in group; p-value, unpaired t-test.
Table 11
Postburst AHP (mAHP and sAHP) values with statistical differences between YC, YP, AU, and AI.
Related to Figure 5D.
| Group | n | mAHP (mV) | p-Value | sAHP (mV) | p-Value |
|---|---|---|---|---|---|
| YC | 12 | −4.33 ± 0.15 | vs. YP, 0.0493* | −2.24 ± 0.17 | vs. YP, 0.1653 |
| YP | 10 | −5.74 ± 0.35 | −3.32 ± 0.28 | ||
| AU | 11 | −5.38 ± 0.22 | vs. YC, 0.1912 | −3.07 ± 0.12 | vs. YC, 0.3590 |
| vs. YP, 0.9016 | vs. YP, 0.9606 | ||||
| AI | 10 | −8.16 ± 0.66 | vs. AU, <0.0001*** | −4.82 ± 0.70 | vs. AU, 0.0092** |
| vs. YC, <0.0001*** | vs. YC, <0.0001*** | ||||
| vs. YP, 0.0004** | vs. YP, 0.0380* |
-
n, number of cells in group; p-value, Tukey’s multiple comparisons test.
Table 12
Postburst AHP amplitude with statistical differences in young (YC, YP, YN) and aged (AU, AI, AN).
Related to Figure 5—figure supplement 1.
| Group | n | mAHP (mV) | p-Value | sAHP (mV) | p-Value |
|---|---|---|---|---|---|
| YC | 12 | −4.33 ± 0.15 | −2.24 ± 0.17 | ||
| YP | 10 | −5.74 ± 0.35 | vs. YC, 0.0011** | −3.32 ± 0.28 | vs. YC, 0.0098** |
| YN | 13 | −5.63 ± 0.23 | vs. YC, 0.0013** | −3.62 ± 0.26 | vs. YC, 0.0005*** |
| vs. YP, 0.9443 | vs. YP, 0.6658 | ||||
| Group | n | mAHP (mV) | p-Value | sAHP (mV) | p-Value |
| AU | 11 | -5.38 ± 0.22 | -3.07 ± 0.12 | ||
| AI | 10 | -8.16 ± 0.66 | vs. AU, 0.0011** | -4.82 ± 0.70 | vs. AU, 0.0394* |
| AN | 11 | -6.83 ± 0.51 | vs. AU, 0.0985~ | -4.28 ± 0.48 | vs. AU, 0.1801 |
| vs. AI, 0.1538 | vs. AI, 0.7068 |
-
n, number of cells in group; p-value, Tukey’s multiple comparisons test.
Table 13
ADP amplitude and AUC of the ADP and PP with statistical differences between YN and AN.
Related to Figure 6B.
| Group | n | ADP Amplitude (mV) | p-Value | AUC (mV*ms) | p-Value |
|---|---|---|---|---|---|
| YN | 19 | 2.53 ± 0.27 | 163800 ± 18081 | ||
| AN | 17 | 1.58 ± 0.23 | vs. YN, 0.0130* | 82080 ± 17108 | vs. YN, 0.0025** |
-
n, number of cells in group; p-value, unpaired t-test.
Table 14
ADP amplitude and AUC of the ADP and PP with statistical differences between YC, YP, AU, and AI.
Related to Figure 6D.
| Group | n | ADP Amplitude (mV) | p-Value | AUC (mV*ms) | p-Value |
|---|---|---|---|---|---|
| YC | 13 | 4.81 ± 0.26 | vs. YP, <0.0001*** | 353696 ± 41070 | vs. YP, 0.0005** |
| YP | 10 | 2.70 ± 0.29 | 166842 ± 22232 | ||
| AU | 8 | 3.32 ± 0.35 | vs. YC, 0.0042** | 219628 ± 30188 | vs. YC, 0.0265* |
| vs. YP, 0.4802 | vs. YP, 0.6918 | ||||
| AI | 12 | 1.43 ± 0.24 | vs. AU, 0.0003** | 80930 ± 17555 | vs. AU, 0.0231* |
| vs. YC, <0.0001*** | vs. YC, <0.0001*** | ||||
| vs. YP, 0.0115* | vs. YP, 0.2119 |
-
n, number of cells in group; p-value, Tukey’s multiple comparisons test.
Table 15
ADP Amplitude and AUC of the ADP and PP with statistical differences in young (YC, YP, YN) and aged (AU, AI, AN).
Related to Figure 6—figure supplement 1.
| Group | n | ADP Amplitude (mV) | p-Value | AUC (mV*ms) | p-Value |
|---|---|---|---|---|---|
| YC | 13 | 4.81 ± 0.26 | 353696 ± 41070 | ||
| YP | 10 | 2.70 ± 0.29 | vs. YC, <0.0001*** | 166842 ± 22232 | vs. YC, 0.0003** |
| YN | 19 | 2.53 ± 0.27 | vs. YC, <0.0001*** | 163800 ± 18081 | vs. YC, <0.0001*** |
| vs. YP, 0.9069 | vs. YP, 0.9969 | ||||
| Group | n | ADP Amplitude (mV) | p-Value | AUC (mV*ms) | p-Value |
| AU | 8 | 3.32 ± 0.35 | 219628 ± 30188 | ||
| AI | 12 | 1.43 ± 0.23 | vs. AU, 0.0002** | 80930 ± 17555 | vs. AU, 0.0004** |
| AN | 17 | 1.58 ± 0.23 | vs. AU, 0.0003** | 82080 ± 17108 | vs. AU, 0.0002** |
| vs. AI, 0.9063 | vs. AI, 0.9990 |
-
n, number of cells in group; p-value, Tukey’s multiple comparisons test.
Table 16
ADP Amplitude and AUC of Young and YC, Pre-Post CdCl2 with statistical differences between pre CdCl2 and post CdCl2.
Related to Figure 7.
| Group | n | ADP Amplitude (mV) pre | ADP Amplitude (mV) post | Pre-Post p-value | AUC (mV*ms) pre | AUC (mV*ms) post | Pre-Post p-value |
|---|---|---|---|---|---|---|---|
| YN | 5 | 2.74 ± 0.79 | 0.81 ± 0.11 | 0.0806~ | 144466 ± 30557 | 47629 ± 12450 | 0.0461* |
| YC | 3 | 4.72 ± 0.74 | 0.22 ± 0.27 | 0.0067** | 323777 ± 41691 | 1014 ± 27220 | 0.0005** |
-
n, number of cells in each group; p-value, pre-post, Sidak’s multiple comparisons test.
Key resources table
| Reagent type (species) or resource | Designation | Source or reference | Identifiers | Additional information |
|---|---|---|---|---|
| Chemical compound, drug | Carbachol | EMD Millipore | Cat#212385 | 10 µM |
| Chemical compound, drug | Cadmium Chloride (CdCl2) | Millipore Sigma | Cat#10108-64-2 | 100 µM |
| Strain, strain background | F1 Hybrid F344 x Brown Norway Rat | National Institutes of Aging | RRID:SCR_007317 | |
| Software, algorithm | LabView 8.20 | National Instruments | RRID:SCR_014325 | |
| Software, algorithm | Prism 8.3.1 | GraphPad | RRID:SCR_002798 | |
| Software, algorithm | Anaconda Navigator 1.9.6 | Python | https://docs.anaconda.com/anaconda/install/ | |
| Software, algorithm | MATLAB R2014b | Mathworks | RRID:SCR_001622 |
Table 17
Passive membrane properties of LEC III pyramidal neurons, separated into YN, AN, YC, YP, AU, and AI.
| Group | RMP (mV) | Rinput (MΩ) | |||
|---|---|---|---|---|---|
| YN | −72.28 ± 1.12 | 54.49 ± 1.39 | |||
| AN | −70.73 ± 0.89 | 60.39 ± 2.91 | |||
| Group | First AP Threshold (mV) | Last AP Threshold (mV) | p-Value | ||
| YN | -41.54 ± 0.33 | -41.63 ± 0.33 | AP Threshold, F1, 379 = 0.6896, p = 0.4068 | ||
| Group, F1, 379 = 8.744, p = 0.003** | |||||
| Group x AP Threshold, F1, 379 = 2.902, p = 0.0893~ | |||||
| AN | -43.40 ± 0.48 | -43.15 ± 0.53 | YN vs. AN First AP Threshold, p = 0.0028** | ||
| Last AP Threshold, p = 0.0178* | |||||
| Group | First AP Half-Width (ms) | Last AP Half-Width (ms) | p-Value | ||
| YN | 1.97 ± 0.04 | 2.00 ± 0.03 | AP Half-Width F1, 379 = 8.761, p = 0.0033** | ||
| Group, F1, 379 = 2.667, p = 0.1033 | |||||
| Group x AP Half-Width F1, 379 = 3.120, p = 0.0781~ | |||||
| AN | 1.83 ± 0.04 | 1.95 ± 0.04 | YN vs AN First AP Half-Width, p = 0.0523~ | ||
| Last AP Half-Width, p = 0.7060 | |||||
| Group | First AP Amplitude (mV) | Last AP Amplitude (mV) | p-Value | ||
| YN | 83.61 ± 0.44 | 80.45 ± 0.43 | Two-Way ANOVA, AP Amplitude F1, 379 = 521.7, p < 0.0001*** | ||
| Group, F1, 379 = 0.001639, p = 0.9677 | |||||
| Group x AP Amplitude F1, 379 = 0.3927, p = 0.5313 | |||||
| AN | 83.49 ± 0.64 | 80.50 ± 0.73 | YN vs AN First AP Amplitude, p = 0.9862 | ||
| Last AP Amplitude, p = 0.9970 | |||||
| Group | First AP dV/dt max (v/s) | Last AP dV/dt max (v/s) | p-Value | ||
| YN | 199.3 ± 3.0 | 175.4 ± 2.9 | dV/dt Max F1, 379 = 385.7, p < 0.0001*** | ||
| Group, F1, 379 = 0.4711, p = 0.4929 | |||||
| Group x dV/dt Max F1, 379 = 0.1451, p = 0.7034 | |||||
| AN | 202.3 ± 4.2 | 179.3 ± 4.6 | YN vs AN First dV/dt Max, p = 0.8083 | ||
| Last dV/dt Max, p = 0.6975 | |||||
| Group | RMP (mV) | Rinput (MΩ) | | ||
| YC | -75.35 ± 0.71 | 55.74 ± 2.53 | |||
| YP | -74.37 ± 0.86 | 57.66 ± 3.70 | |||
| AU | -72.71 ± 0.76 | 59.87 ± 2.27 | |||
| AI | -70.24 ± 1.40 | 59.06 ± 2.95 | |||
| Group | First AP Threshold (mV) | Last AP Threshold (mV) | p-Value | ||
| YC | -37.33 ± 0.40 | -37.39 ± 0.47 | AP Threshold, F1, 643 = 15.71, p < 0.0001*** | ||
| YP | -40.70 ± 0.36 | -41.46 ± 0.35 | Group, F3, 643 = 20.74, p < 0.0001*** | ||
| Group x AP Threshold, F3, 643 = 1.826, p = 0.1412 | |||||
| AU | -40.80 ± 0.35 | -41.10 ± 0.34 | Comparison | First AP | Last AP |
| YC vs YP | p < 0.0001*** | p < 0.0001*** | |||
| YC vs AU | p < 0.0001*** | p < 0.0001*** | |||
| YC vs AI | p < 0.0001*** | p < 0.0001*** | |||
| AI | -40.69 ± 0.39 | -41.17 ± 0.32 | YP vs AU | p = 0.9974 | p = 0.9062 |
| YP vs AI | p > 0.9999 | p = 0.9488 | |||
| AU vs AI | p = 0.9947 | p = 0.9990 | |||
| Group | First AP Half-Width (ms) | Last AP Half-Width (ms) | p-Value | ||
| YC | 2.23 ± 0.06 | 2.32 ± 0.09 | AP Half-Width, F1, 643 = 4.928e-005, p = 0.9944 | ||
| YP | 1.96 ± 0.05 | 1.94 ± 0.04 | Group, F3, 643 = 28.46, p < 0.0001*** | ||
| Group x Half-Width F3, 643 = 1.650, p = 0.1767 | |||||
| AU | 1.82 ± 0.04 | 1.80 ± 0.04 | Comparison | First AP | Last AP |
| YC vs YP | p = 0.0007** | p < 0.0001*** | |||
| YC vs AU | p < 0.0001*** | p < 0.0001*** | |||
| YC vs AI | p < 0.0001*** | p < 0.0001*** | |||
| YP vs AU | p = 0.1239 | p = 0.1198 | |||
| AI | 1.82 ± 0.04 | 1.77 ± 0.03 | YP vs AI | p = 0.1361 | p = 0.0494* |
| AU vs AI | p > 0.9999 | p = 0.9682 | |||
| Group | First AP Amplitude (mV) | Last AP Amplitude (mV) | p-Value | ||
| YC | 80.02 ± 1.11 | 76.10 ± 1.07 | AP Amplitude, F1, 643 = 286.5, p < 0.0001 | ||
| YP | 81.80 ± 0.88 | 78.92 ± 0.82 | Group, F3, 643 = 3.996, p = 0.0078 | ||
| Group x AP Amplitude, F3, 643 = 5.083, p = 0.0017 | |||||
| AU | 83.10 ± 0.66 | 80.27 ± 0.52 | Comparisons | First AP | Last AP |
| YC vs YP | p = 0.5087 | p = 0.1274 | |||
| YC vs AU | p = 0.0404* | p = 0.0019** | |||
| YC vs AI | p = 0.9990 | p = 0.2916 | |||
| AI | 80.18 ± 0.83 | 78.19 ± 0.75 | YP vs AU | p = 0.6715 | p = 0.6391 |
| YP vs AI | p = 0.5082 | p = 0.9233 | |||
| AU vs AI | p = 0.0237* | p = 0.1762 | |||
| Group | First AP dV/dt max (v/s) | Last AP dV/dt max (v/s) | p-Value | ||
| YC | 178.0 ± 5.1 | 151.1 ± 4.6 | AP dV/dt max, F1, 643 = 15.71, p < 0.0001 | ||
| YP | 183.5 ± 5.3 | 163.8 ± 4.6 | Group, F3, 643 = 20.74, p < 0.0001 | ||
| Group x AP dV/dt max, F3, 643 = 1.826, p = 0.1412 | |||||
| AU | 191.0 ± 3.7 | 172.4 ± 2.9 | Comparison | First AP | Last AP |
| YC vs YP | p = 0.8306 | p = 0.2052 | |||
| AI | 176.7 ± 4.2 | 162.0 ± 3.2 | YC vs AU | p = 0.1219 | p = 0.0017** |
| YC vs AI | p = 0.9966 | p = 0.2653 | |||
| YP vs AU | p = 0.5757 | p = 0.4517 | |||
| YP vs AI | p = 0.6563 | p = 0.9888 | |||
| AU vs AI | p = 0.0313* | p = 0.1836 | |||
-
All statistical analyses were first performed with a Two-Way ANOVA. Post hoc multiple comparisons tests performed on behaviorally naïve Young and Aged data were done with Sidak’s tests. Multiple comparisons performed on YC, YP, AU, and AI data were done with Tukey’s tests.
Download links
A two-part list of links to download the article, or parts of the article, in various formats.
Downloads (link to download the article as PDF)
Open citations (links to open the citations from this article in various online reference manager services)
Cite this article (links to download the citations from this article in formats compatible with various reference manager tools)
Persistent firing in LEC III neurons is differentially modulated by learning and aging
eLife 9:e56816.
https://doi.org/10.7554/eLife.56816


