Synergism of type 1 metabotropic and ionotropic glutamate receptors in cerebellar molecular layer interneurons in vivo
- Université de Paris, CNRS, SPPIN - Saints-Pères Paris Institute for the Neurosciences, France
- The Brain Cognition and Brain Disease Institute (BCBDI), Shenzhen Institutes of Advanced Technology, Chinese Academy of Sciences; Shenzhen-Hong Kong Institute of Brain Science-Shenzhen Fundamental Research Institutions, China
- Division of Cerebral Structure, National Institute for Physiological Sciences, The Graduate University for Advanced Studies (Sokendai), Japan
- Institut de Biologie de l’Ecole Normale Superieure (IBENS), Ecole Normale Superieure, CNRS, INSERM, PSL Research University, France
- IST Austria, Austria
Figures
Figure 1 with 1 supplement

Beam activation in the cerebellar cortex of GCaMP3 expressing MLIs in vivo.
(A) Two-photon laser scanning microscopy (2PLSM) image of the outermost cerebellar molecular layer in vivo shows cytoplasmic GCaMP3 and parasagittally aligned MLI neurites in a horizontal plane of focus. (B) Confocal stack projections of sagittal cerebellar slices from mice expressing AAV2/1hSyn.Flex.GCaMP3 on the background of PV-promoter driven CRE recombinase. Left: slice stained with an antibody against calbindin, a protein expressed in PCs and not in MLIs. Note that calbindin positive PCs do not express GCaMP3. Right: slice stained with an antibody against PV, a protein expressed in both PCs and MLIs. Note the colocalization between GCaMP3 and PV positive MLIs. (C) A beam pattern of Cai rise is illustrated by the ΔF/Fo image at the peak of the fluorescence increase evoked in the molecular layer by a 0.5 s long PF stimulation at 100 Hz (horizontal plane of focus) using a bi-polar theta glass pipette as depicted in the cartoon. The highest value for the pseudo-color scale is 100%. (D) Time course of the somatic MLI Cai signals evoked in a representative MLI by 100 Hz PF stimulations of various durations. The arrow indicates the time of stimulation onset. The inset shows an average of pre-stimulus images to illustrate the ROI analyzed. (E) Average peak ΔF/Fo values from 18 somata, normalized to the peak value for 200 ms trains at 100 Hz.
Figure 1—figure supplement 1
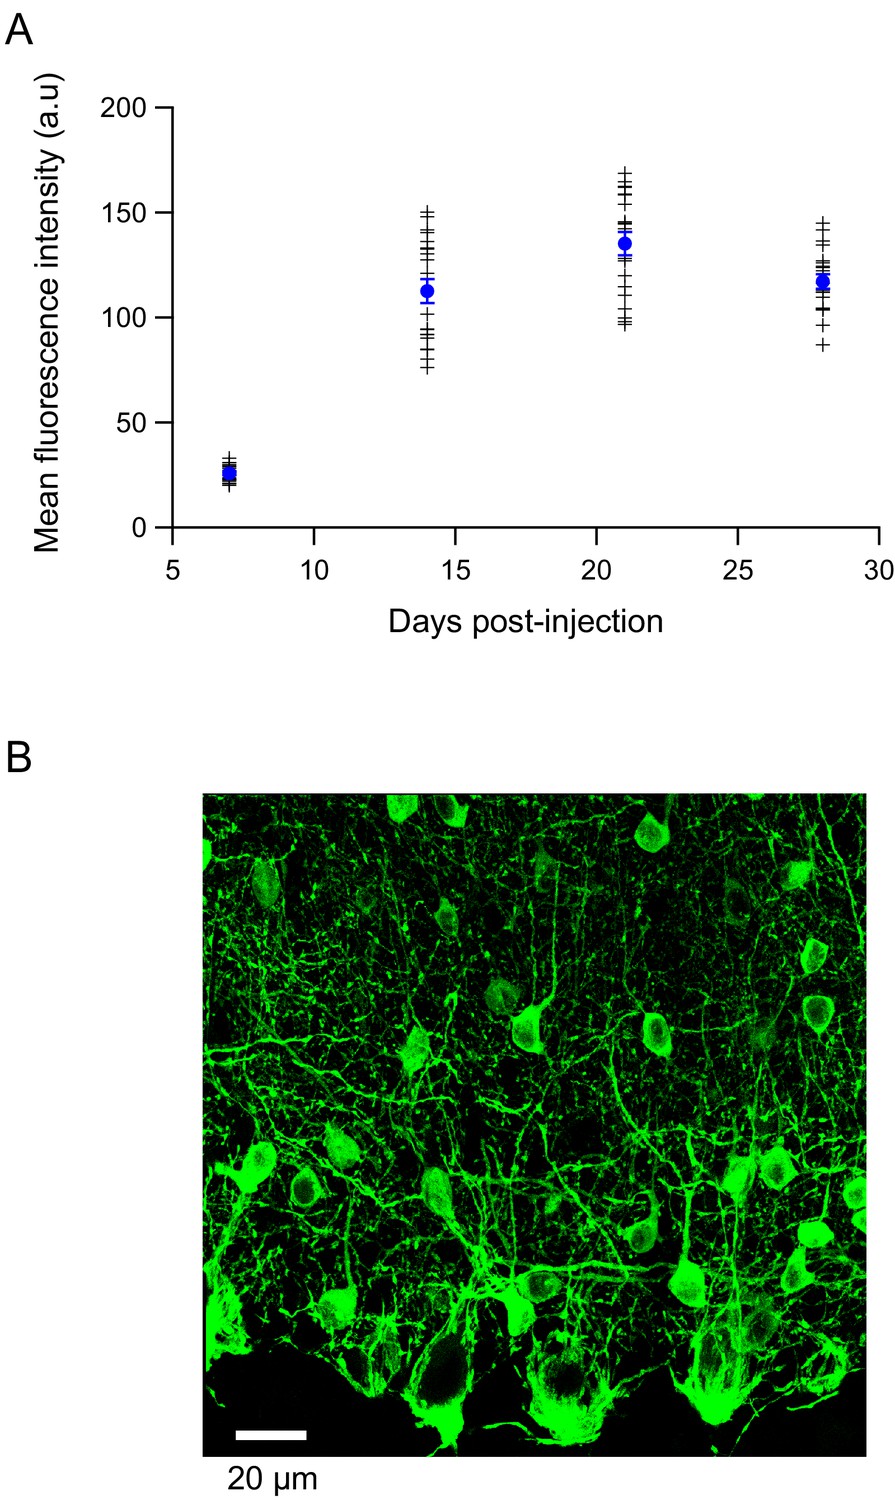
Expression of various GCaMP proteins in the cerebellar cortex.
(A). The time course of GCaMP3 expression in the cerebellar cortex of adult Pvalb-Cre mice was followed in slices processed for confocal microscopy. Two mice were processed for each time point. The mean fluorescence intensity of individual MLIs somata is given by + symbols. Blue circles: mean ± s.e.m. Confocal excitation and detection parameters were kept constant for all measurements. Symbols correspond to individual somata, and the filled circle corresponds to the mean. (B). Using the same hsyn promoter as for GCaMP3, the expression of GCaMP5 is also restricted to MLIs, as seen in the confocal stack for a sagittal slice from a PN 45 mouse.
Figure 2
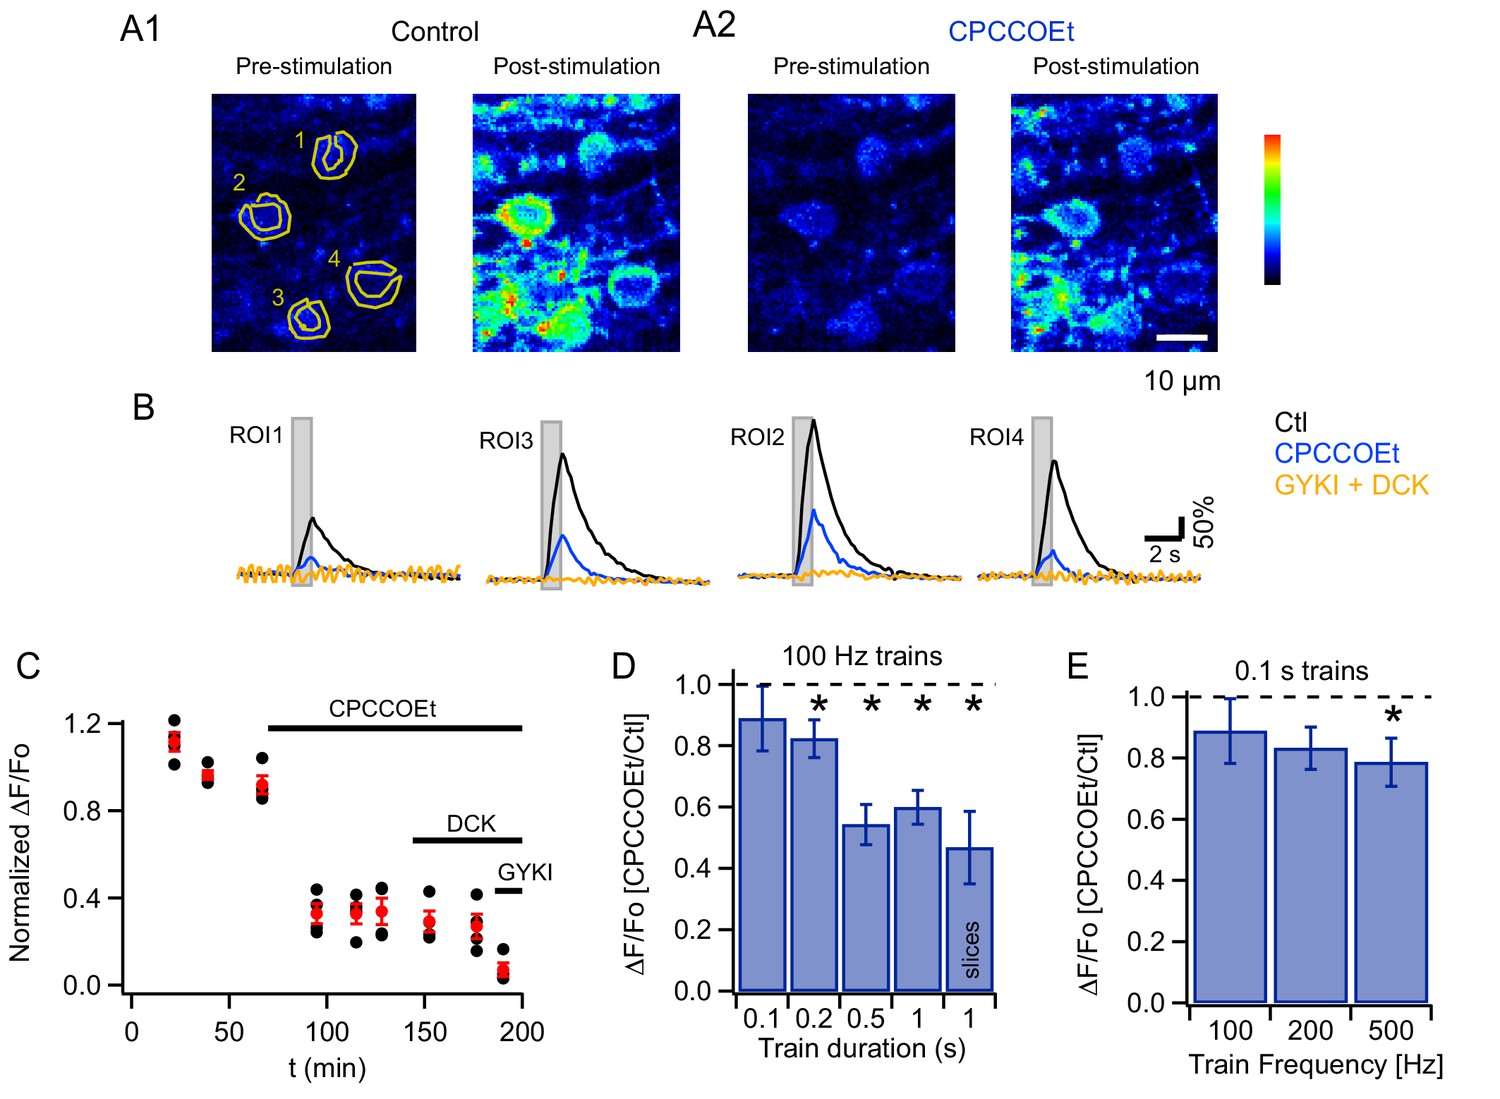
mGluR1s contribute to PF-evoked MLI somatic Cai rises.
(A) Pharmacology of MLI Cai rises reported by GCaMP3 following PF stimulation. 2PLSM images at rest and at the peak of the response to PF stimulation (100 Hz for 1 s) in vivo in control (A1) and in CPCCOEt (A2). The pseudocolor scale in the images is expressed in Hz, calculated from the number of photons acquired during 10 μs intervals. The highest counts are 2.1 MHz. Panel B shows ΔF/Fo traces for the 4 ROIs drawn in the pre-stimulus image, in control (black), in 100 μM CPCCOEt (blue) and after further addition of 300 μM GYKI53655 and 100 μM DCK (yellow). (C) Temporal evolution of the peak Cai rise for the experiment shown in B (black: individual cells; red: mean ± sem). (D) Ratios of peak ΔF/Fo amplitudes in CPCCOEt over control for 100 ms (n = 20), 200 ms (n = 18), 500 ms (n = 16) and 1 s (n = 21) trains of stimuli at 100 Hz in vivo and for 1 s stimulation at 100 Hz in vitro (n = 9). Two-tailed p values from Wilcoxon tests are: 0.03, 9.2 × 10⁻⁵, 4.8 × 10⁻⁶ for 200 ms, 500 ms and 1 s trains in vivo and 0.008 for 1 s trains in vitro. Data from GCaMP3 and GCaMP5 expressing mice. (E) Ratios of ΔF/Fo peak amplitudes in CPCCOEt over control for 100 ms trains applied at different frequencies (n = 20; two-tailed p value from Wilcoxon test for 500 Hz: 0.04). Data from GCaMP5 expressing mice. The 100 Hz, 0.1 s bin is derived from the same data set as that used for the first bin in panel D.
Figure 3 with 2 supplements
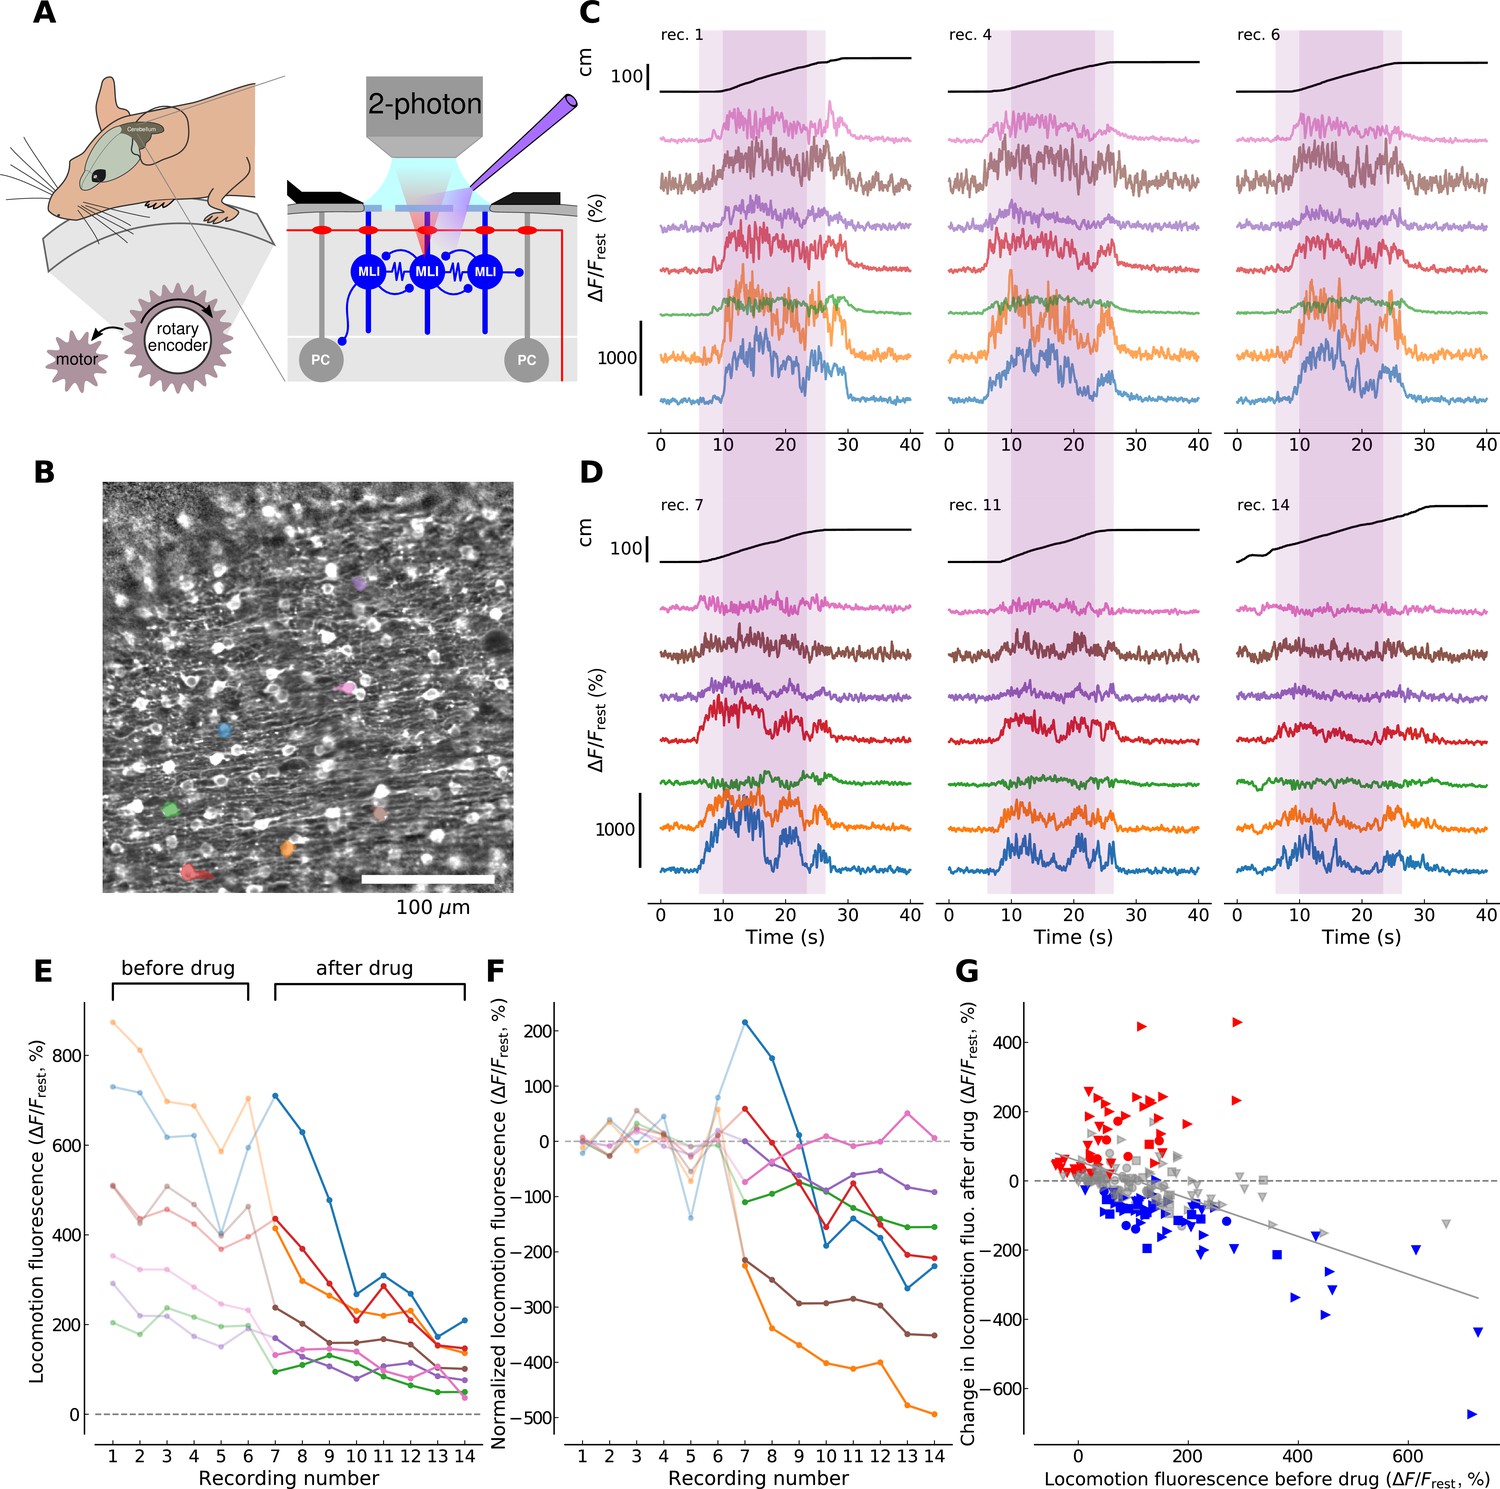
mGluR1s contribute to large-amplitude, locomotion-related Ca2+ activity in MLIs in the medial cerebellum.
(A) Illustration of the forced locomotion experiment with simultaneous calcium imaging of MLIs. Mice can walk freely but the treadmill is motorized during a 20 s period, corresponding to the area shaded in purple in C and D between 6 and 26 s (dark purple corresponds to the 15 s maximal speed motorization period between 10 and 25 s of the recordings). At the right, a simplified circuit diagram of the cerebellar molecular and Purkinje cell layer illustrating craniotomy, 2 photon scanning and drug delivery. (B) Horizontal view of viral-mediated GCaMP3 expression in MLIs of a Pvalb-Cre mouse. Example ROIs are colored (see panels C,D,E,F). (C) Ca2+ responses during three non-consecutive locomotion recordings (recording number upper left; recordings repeated every 2–4 min, see Materials and methods). Top black traces show the distance traveled by the mouse during the recordings. Bottom traces show fluorescence for 7 randomly chosen example ROIs corresponding to individual cell bodies (see color-coded regions in B). The time period used for analysis is shaded in dark purple. (D) Same depiction as in (C) but after the application of CPCCOEt. (E) Calcium responses before and after CPCCOEt application. The 75th percentile of the fluorescence trace during the maximal-speed locomotion period [10, 25] s, dark purple shaded region in (C,D) is shown as a function of the recording number. For this example mouse (animal #2), 6 recordings before- and 8 after drug delivery were performed. (F) Calcium activity normalized to pre-drug baseline. The pre-drug decay in fluorescence was subtracted from all points per ROI (see Materials and methods for details). Data for the same ROIs is shown in the same color in panels (B-F). Data points before CPCCOEt application are in pale color, data after drug delivery in dark color. (G) Change in fluorescence with CPCCOEt vs. pre-drug baseline data from all animals (Nanimals = 4) and ROIs (NROIs = 313). The change in fluorescence is shown as a function of the pre-drug baseline fluorescence during locomotion. Data from each animal is plotted with the same symbols. The color of each symbol indicates whether a significant increase (red, p<0.01, T-test), decrease (blue, p<0.01, T-test) or no change (gray) has been observed when comparing baseline locomotion fluorescence with fluorescence after CPCCOEt application (see Materials and methods for more details). The linear regression on all points yields a correlation of −0.547 with p-value<0.0001, explaining 30.0% of the variance in the data.
Figure 3—figure supplement 1
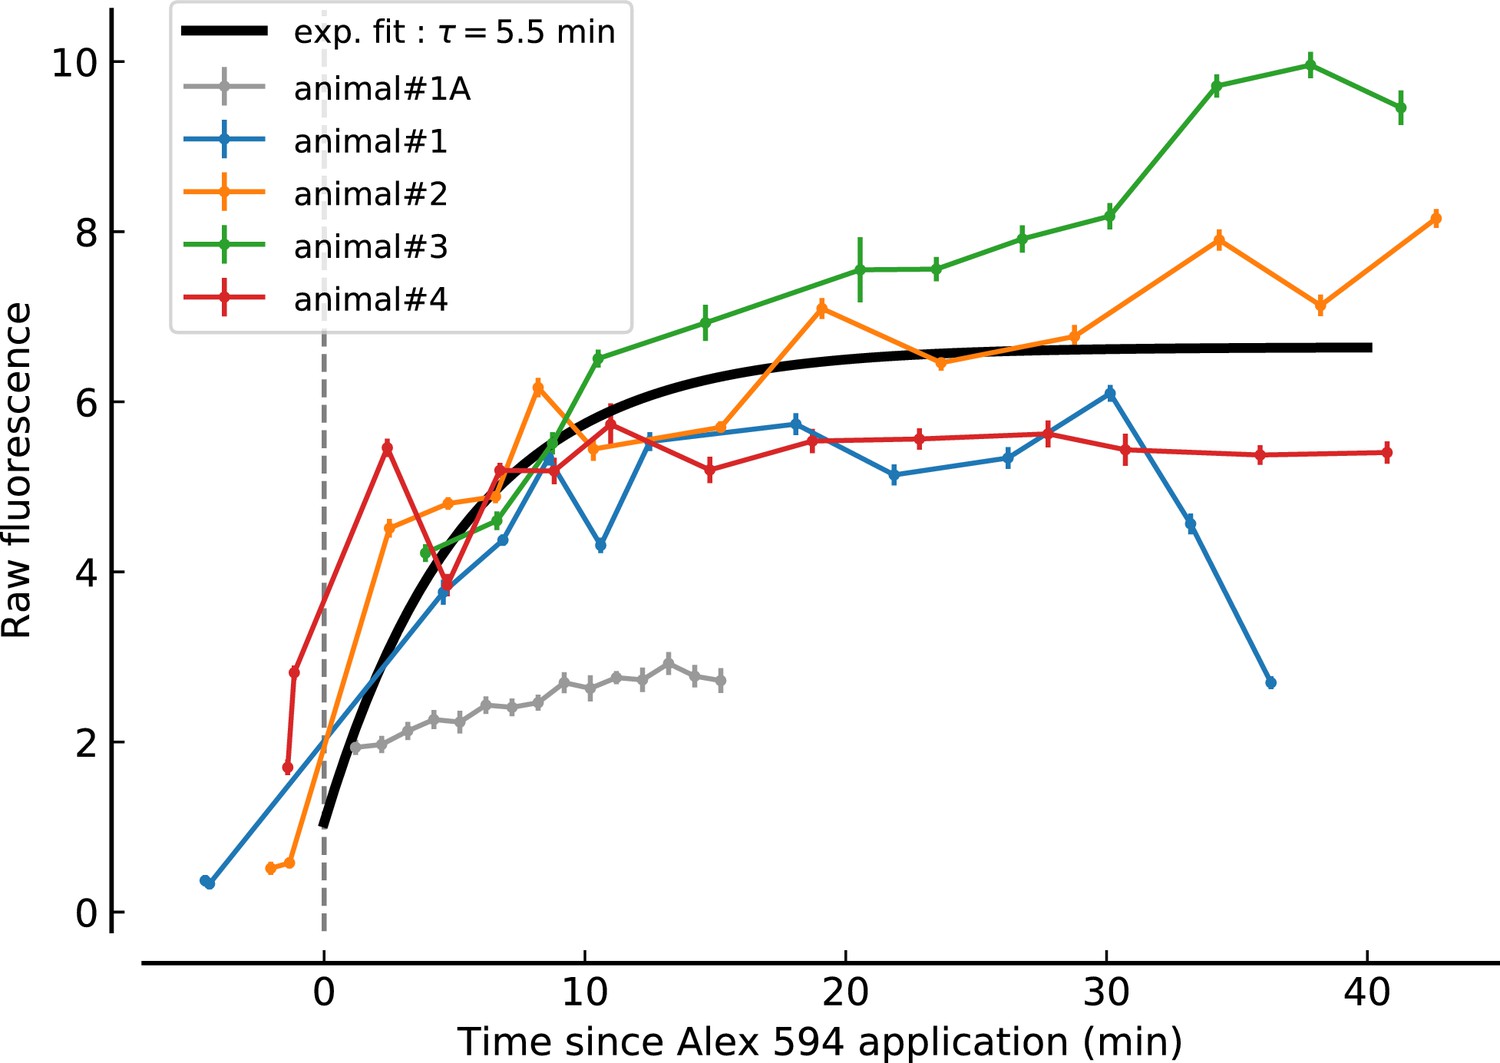
Summary of Alexa 594 fluorescence changes related to drug application for all animals.
Raw Alexa 594 fluorescence is shown as function of time since application at t = 0 min. 50 μM Alexa was added to the drug-containing ACSF to assess the dynamics of drug diffusion in the recorded brain area. Each animal is depicted by a different color. Note that the recording of animal#1A was excluded from the analysis due to the inefficiency of drug application in the area of interest as reported by in impaired increases in Alexa fluorescence (gray points and line). A single exponentially increasing function (black line) was fitted to the data for t > 0 and starting at the average pre-application fluorescence average across all animals. Each recording point comprises 100 images recorded at 30 Hz of a 400 × 400 μm field of view and pixel size of 0.78 × 0.78 μm. Data-points display average and standard deviation of the image stack fluorescence values.
Figure 3—figure supplement 2

Comparison of fluorescence fluctuations and level during the recordings at 820 nm excitation wavelength with respect to the runs at 910 nm.
(A) Ratio of fluorescence standard deviations (STD) during the locomotion period (t∈(10,25 s) between recordings at 820 and 910 nm laser excitation wavelength. Individual ratios are calculated for ROIs which have been recorded, aligned and matched (>30% overlap, see Materials and methods) between the two laser excitation conditions. The box-plots (median: orange; quartiles: box; range of data excluding outliers: whiskers) summarize the ratios for all ROIs recorded in one animal. (B) Same depiction as in (A) but for ratio of fluorescence 75th percentiles during the locomotion period (t∈(10,25 s) between recordings at 820 and 910 nm laser excitation wavelength.
Figure 4

Synergy between iGluRs and mGluR1s in adult MLIs.
(A) A mixture of 300 μM GYKI53655 and 100 μM DCK blocked somatic Cai rises under various PF stimulation protocols in vivo. (B) Ratios between peak amplitudes of ΔF/Fo in the blockers over control (n = 6 in each condition). (C,D) GCaMP3 imaging of PF-induced Cai rises in 2 somata and 4 putative neurites in vivo shows no difference between control (black traces) and addition of 40 μM IEM 1460 (yellow traces).
Figure 5
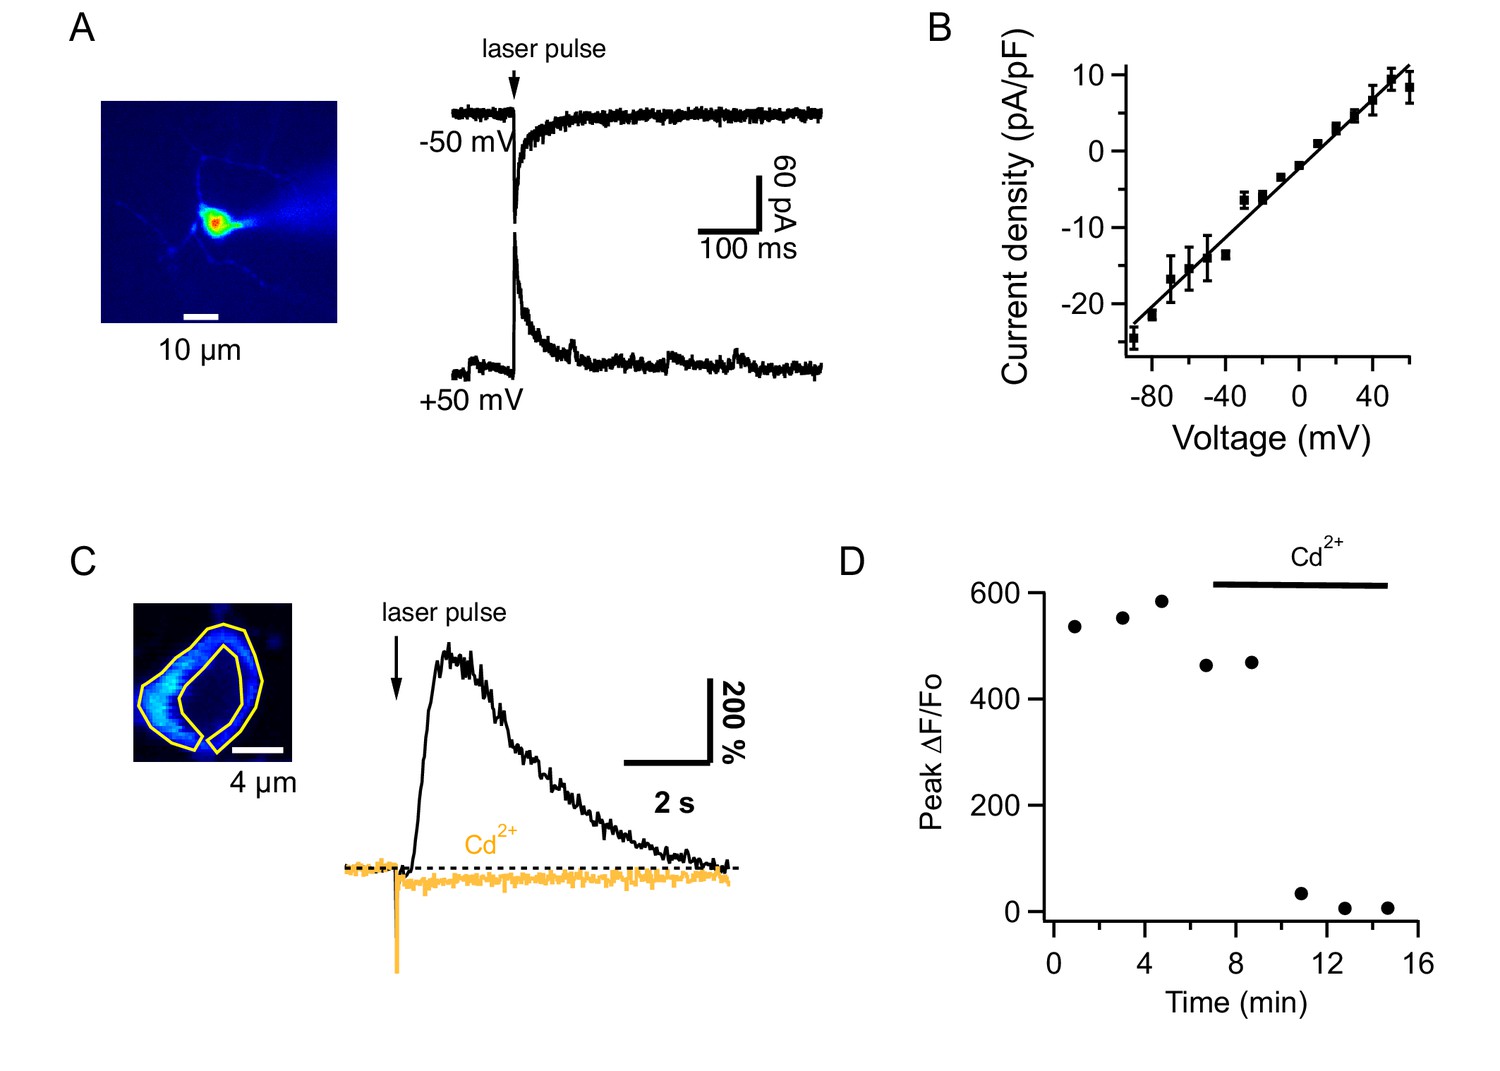
Glutamate uncaging from MLIs in slices.
(A) MLI currents evoked by MNI-glutamate uncaging in a slice of an adult mouse at different holding potentials in the presence of 100 μM intracellular spermine. (B) The I-V curve from 7 MLIs shows no rectification. (C) Left: Image of an MLI expressing GCaMP6s with ROI drawn over the cytosol. Right: ΔF/Fo signals evoked by MNI glutamate uncaging in control saline (black) and after addition of 100 μM CdCl2 to the solution bathing the slice (orange). (D) Temporal evolution of ΔF/Fo signals for the MLI shown in C.
Figure 6
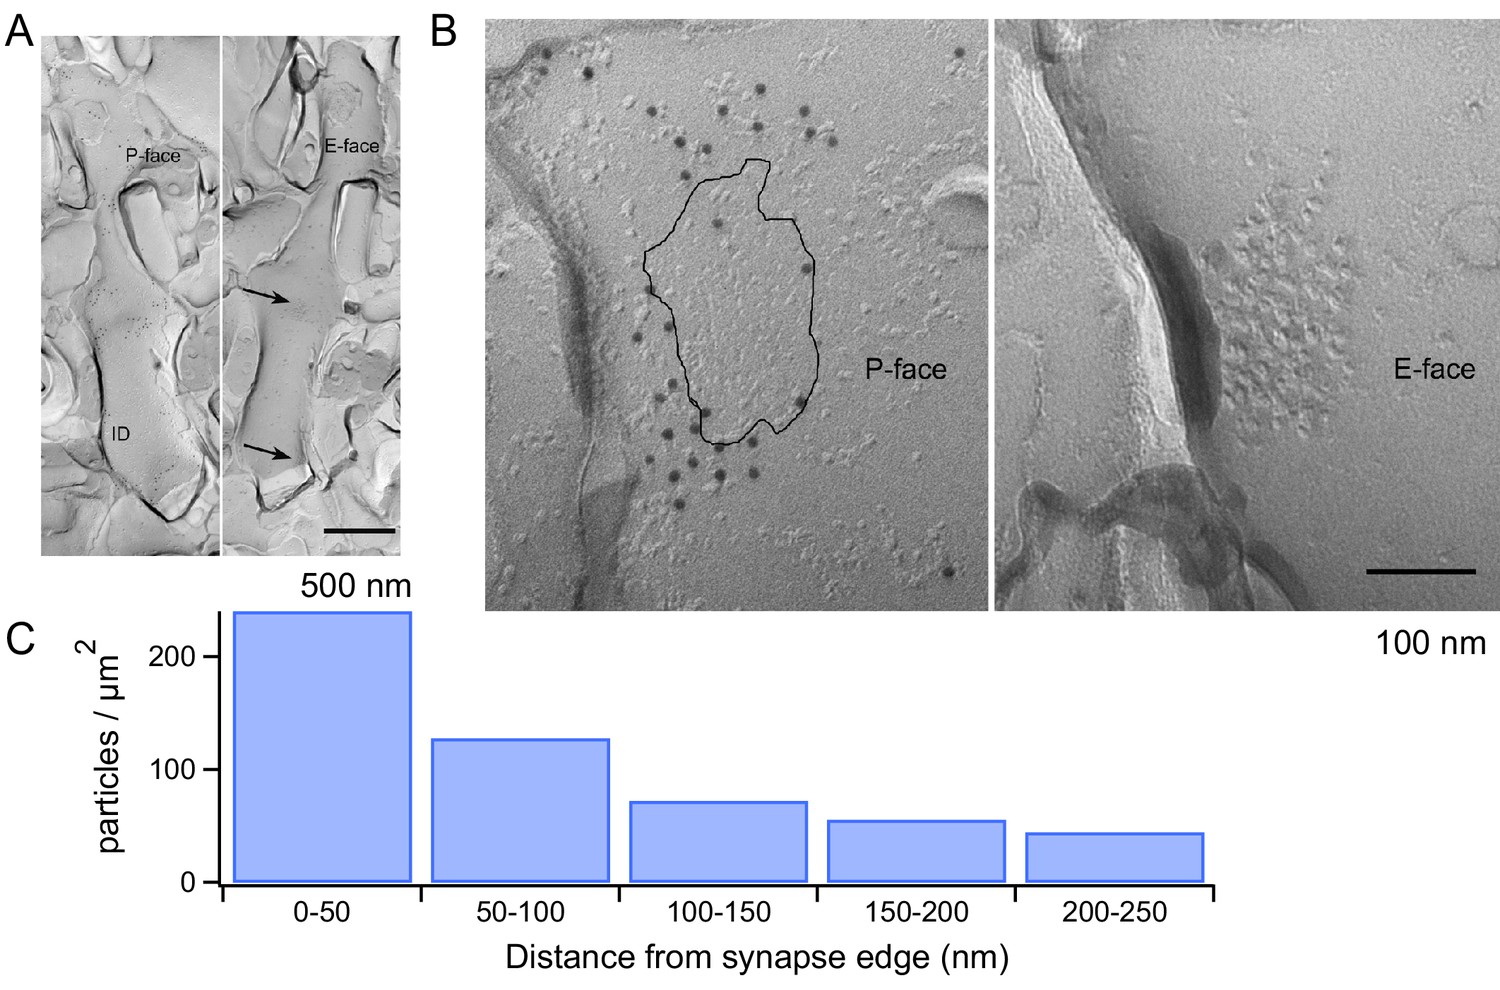
mGluR1 distribution at PF-MLI synapses.
(A) Low magnification electron micrographs show MLI dendrites in mirror replicas with mGluR1α labeling (10 nm gold particles) on the protoplasmic face (P-face) and intra-membrane particle clusters (arrows) indicating glutamatergic postsynaptic sites on the exoplasmic face (E-face). Scale bar, 500 nm. (B) Immunogold labeling of freeze-fracture replicas shows mGluR1α on the P-face concentrated close to the PF-MLI postsynaptic site (black line) identified by intramembrane particle (IMP) clusters on the corresponding E-face. Scale bar, 100 nm. (C) Immunogold particle density as a function of distance from the synapse edge. A similar trend was found in replicas from 2 other animals, in which 241 and 191 particles were analyzed.
Additional files
Download links
A two-part list of links to download the article, or parts of the article, in various formats.
Downloads (link to download the article as PDF)
Open citations (links to open the citations from this article in various online reference manager services)
Cite this article (links to download the citations from this article in formats compatible with various reference manager tools)
Synergism of type 1 metabotropic and ionotropic glutamate receptors in cerebellar molecular layer interneurons in vivo
eLife 9:e56839.
https://doi.org/10.7554/eLife.56839


