Alterations in the intrinsic properties of striatal cholinergic interneurons after dopamine lesion and chronic L-DOPA
- Department of Psychiatry, Columbia University Medical Center, United States
- Department of Neurology, Grossman School of Medicine, New York University, United States
Figures
Figure 1 with 3 supplements
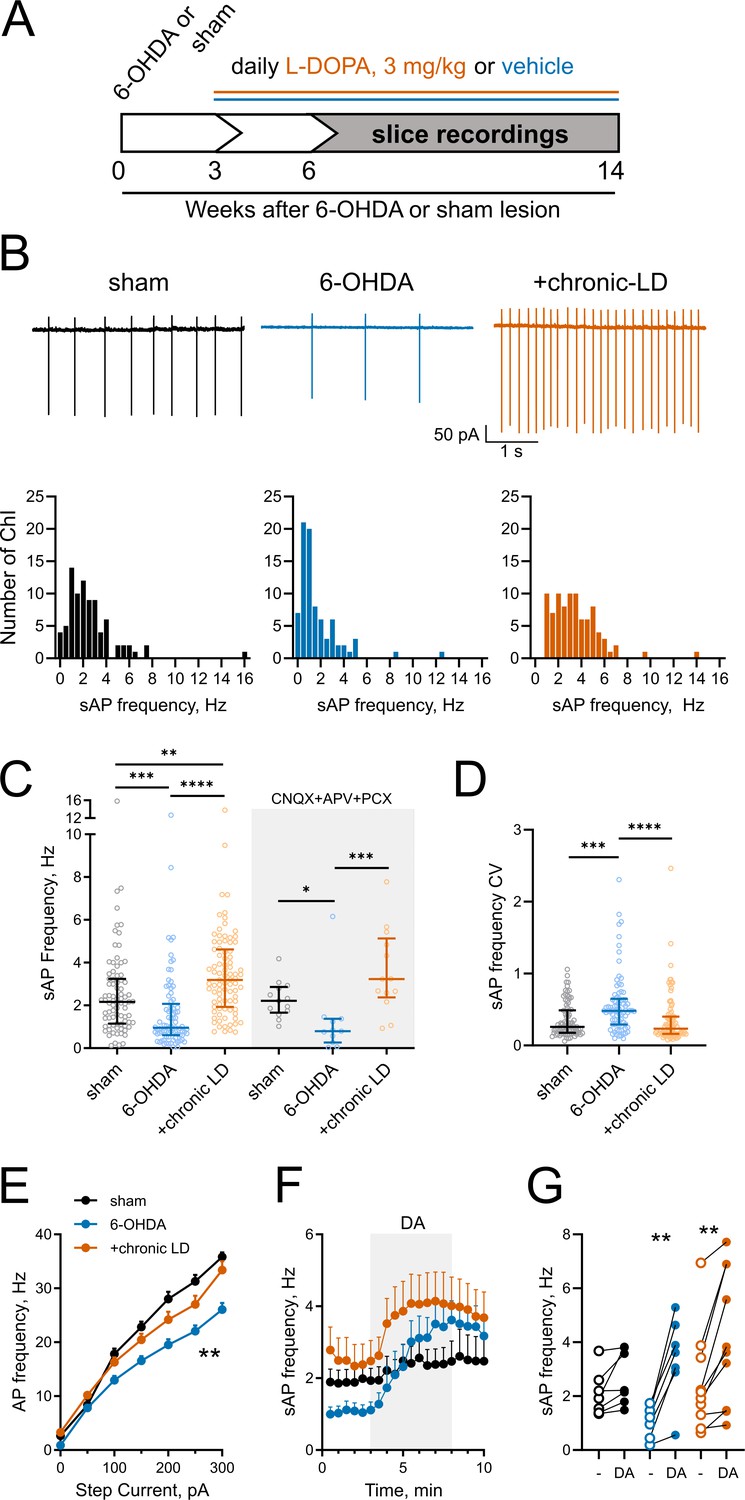
Changes in ChI spontaneous firing frequency induced by DA depletion followed by chronic L-DOPA treatment.
(A) DA lesion and chronic L-DOPA treatment paradigm. 3–4 weeks after unilateral 6-OHDA lesion, mice were randomly divided into two groups to receive either saline or L-DOPA. Experimental groups included sham: mice with vehicle injection into the MFB, 6-OHDA: mice with MFB lesions injected with daily IP saline, and chronic LD: MFB-lesioned mice treated with 3 mg/kg L-DOPA IP once daily. Electrophysiological slice recordings were carried out 3–11 weeks after the initiation of L-DOPA or saline injections. (B) Representative cell-attached recordings and distributions of average (per cell) instantaneous spontaneous action potential frequency (sAP) of ChIs from sham-lesioned (n = 83 neurons/26 mice), 6-OHDA-lesioned (n = 81 neurons/29 mice), and 6-OHDA-lesioned mice treated with chronic LD (n = 87 neurons/25 mice). Scale bars are 1 s and 50 pA. (C) Dot plots of spontaneous cell activity in the absence (same as in B) and the presence of synaptic blockers CNQX (10 µM), APV (25 µM) and picrotoxin (PCX) (25 µM). Number of recordings with synaptic blockers: sham n = 13 neurons/3 mice, 6-OHDA n = 11 neurons/3 mice, chronic-LD 13 neurons/3 mice. (D) Coefficient of variation (CV) of instantaneous sAP frequencies in sham, 6-OHDA, and chronic LD groups (same N as in B). For C and D, line denotes median, error bars show interquartile range, p<0.05 (*), p<0.01 (**), p<0.001 (***), or p<0.0001 (****) by Kruskal-Wallis test with Dunn’s multiple comparison test; (E) The number of evoked action potentials following current injection was decreased in ChIs from 6-OHDA lesioned mice but restored to sham levels after chronic L-DOPA treatment. p<0.01 (**), 6-OHDA vs. the two other groups by two-way ANOVA with Tukey’s post-hoc test; sham n = 11 neurons/4 mice, 6-OHDA n = 16 neurons/5 mice, chronic-LD n = 18 neurons/5 mice. (F) Averaged perforated-patch recordings of sAP in ChIs following 30 µM DA perfusion in the presence of synaptic blockers. Sham n = 7 neurons/3 mice, 6-OHDA n = 7 neurons/2 mice, chronic-LD n = 10 neurons/3 mice. (G) Changes in average sAP frequencies in individual cells before and after DA exposure. (same N as in F). p<0.01 (**) by paired t-test.
-
Figure 1—source data 1
Individual neuron data and statistics for all panels and figure supplements.
- https://cdn.elifesciences.org/articles/56920/elife-56920-fig1-data1-v3.xlsx
Figure 1—figure supplement 1
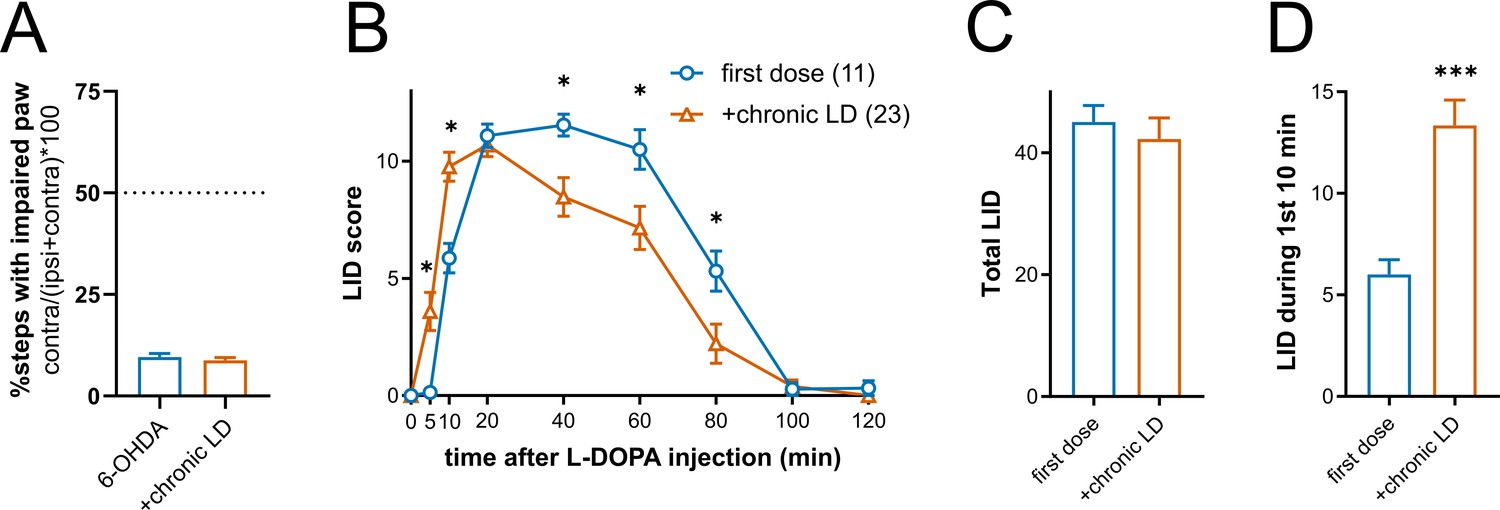
Expression of L-DOPA-induced dyskinesia (LID) in 6-OHDA-lesioned mice.
(A) All 6-OHDA-lesioned mice developed contralateral front paw stepping deficits, p<0.0001 vs. 50% for both groups, Wilcoxon signed rank test. There was no difference in stepping deficit between the mice assigned to the 6-OHDA-only or chronic L-DOPA groups, p=0.5467 by Mann-Whitney test; 6-OHDA n = 21 mice, chronic-LD n = 30 mice. (B) Time course of LID expression following single injection of L-DOPA (3 mg/kg) either as the first dose or after chronic administration of L-DOPA. First dose n = 11 mice, chronic-LD n = 23 mice; p<0.0001 for time x treatment interaction by two-way ANOVA, (*) p<0.05 between first dose vs. chronic administration at the same time point after L-DOPA injection by Bonferroni post-hoc test. (C) Total LID was not different between the groups, p=0.2946 by Mann-Whitney test. (D) LID expression occurred sooner after L-DOPA injection in mice that received chronic L-DOPA, p=0.0002, Mann-Whitney test.
Figure 1—figure supplement 2

Burst-pause activity in ChIs.
The number and duration of bursts and pauses were quantitated using the robust Gaussian surprise method. (A–F) Firing patterns of ChIs from sham (n = 83 neurons/26 mice), 6-OHDA (n = 81 neurons/29 mice, and chronic-LD (n = 87 neurons/25 mice) groups. (G–L) Firing patterns of ChIs in untreated mouse brain slices (n = 17 neurons/6 mice), those treated with 1 μM ZD7288 and 1 nM apamin (n = 8 neurons/3 mice) or the same concentration of apamin alone (n = 10 neurons/3 mice). p<0.05 (*), p<0.01 (**), p<0.001 (***), p<0.0001 (****) by Kruskal-Wallis test with Dunn’s multiple comparison. Burst duration (C and I) and pause duration (F and L) were analyzed only in neurons exhibiting bursts and pauses: sham n = 66, 75; 6-OHDA n = 52, 64; chronic-LD n = 80, 85; untreated n = 17, 16; ZD+apamin n = 6, 8; apamin n = 10, 10 (bursts, pauses). Blockade of HCN and SK currents largely reproduced changes in firing patterns observed in the 6-OHDA and chronic LD groups. Also note that number of bursts and pauses was not different between any groups when bursts or pauses were normalized to the number of action potentials (B,H,E,K), suggesting that the expression of bursts and pauses is related to the change in the firing rate.
Figure 1—figure supplement 3
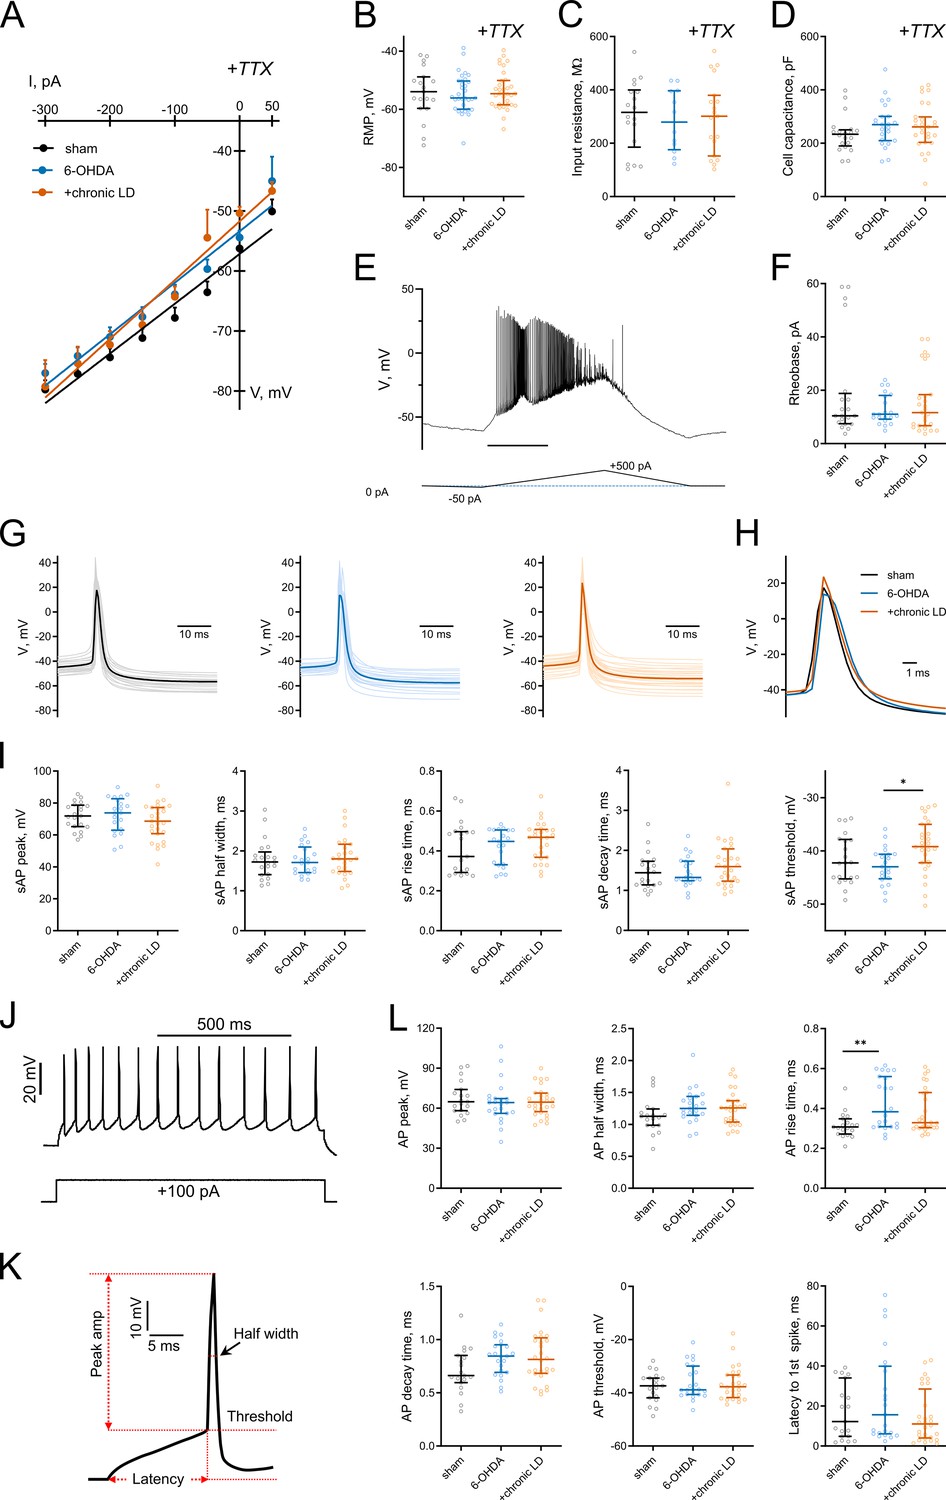
Basic electrophysiological characteristics in ChIs from control, 6-OHDA, and chronic LD mice.
(A) Voltage-current dependence, (B) resting membrane potential, (C) input resistance, (D) membrane capacitance and (F) rheobase were unchanged in 6-OHDA and chronic-LD groups. (E) Ramp protocol for rheobase determination. Recordings in A-D were recorded in whole-cell mode in the presence of 1 µM TTX (n = 12–34 neurons/4–9 mice per group). (G) Representative and (H) averaged traces and shape characteristics (I) of sAPs from the three experimental groups (n = 21–27 neurons/8–10 mice per group). (J) Current protocol (lower) and representative trace (upper) of action potentials evoked by 100 pA current injection. (K, L) Shape characteristics of action potentials evoked by 100 pA current injection (n = 19–28 neurons/8–11 mice per group). p<0.05 (*) or p<0.01 (**) by Kruskal-Wallis test with Dunn’s multiple comparison analysis. Exact n for each figure are listed in Figure 1—source data 1.
Figure 2
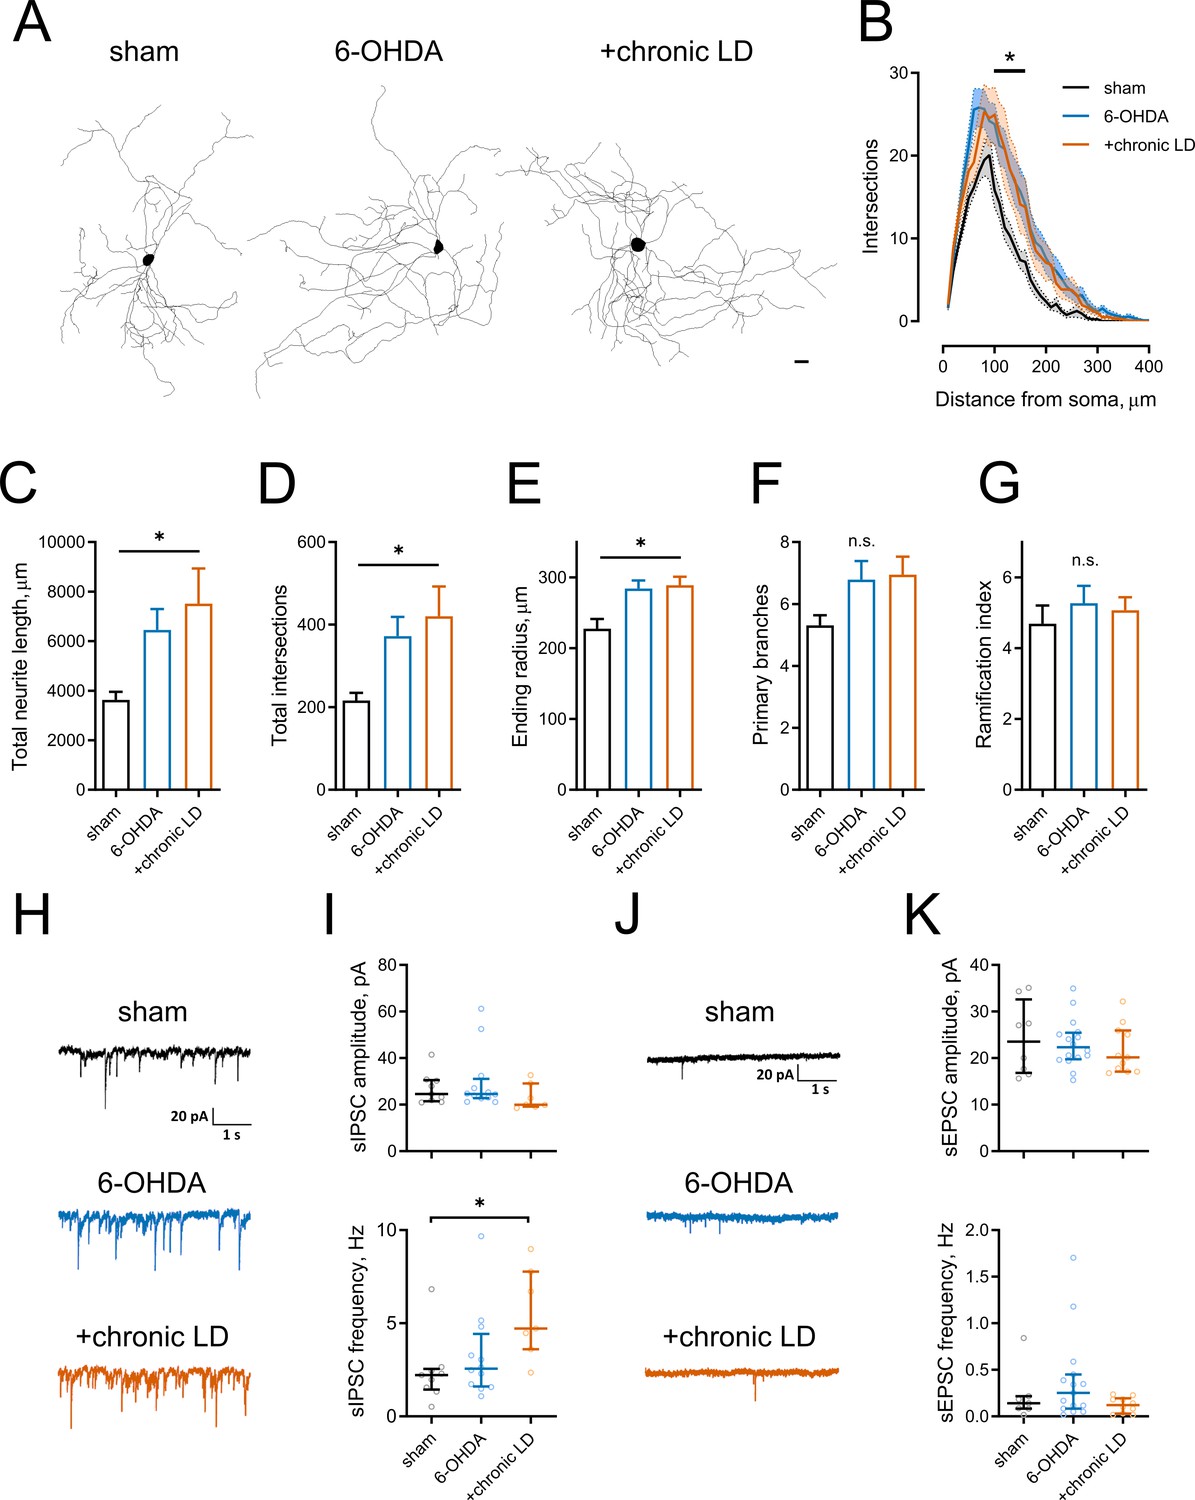
Morphological parameters and synaptic inputs in ChIs from control, 6-OHDA lesioned and chronic LD mice.
(A–G) Sholl analysis of ChI morphology. Cells were filled with biocytin during physiological recordings, fixed, and imaged for biocytin labeling by confocal microscopy. (A) Representative maximum projection images from three dimensional reconstructions of ChIs, scale bar = 20 μm. (B) Sholl analysis of reconstructed ChIs, solid line denotes mean intersections at indicated distance from soma, shaded area shows SEM, p<0.05 (*) for sham vs. 6-OHDA and sham vs. chronic LD, Dunnett’s multiple comparison test following two-way ANOVA, p=0.0074 for interaction between treatment group and distance from soma. (C–G) DA lesion caused significant increase in total dendrite length (C), total number of intersections (D) and ending radius (E), whereas the number of primary dendrites (F) and ramification index (G) were similar between the groups, p<0.05 (*) 6-OHDA and +chronic-LD vs. Sham, Kruskal-Wallis test with Dunn’s multiple comparison. For A-G sham n = 13 neurons/7 mice, 6-OHDA n = 28 neurons/14 mice, chronic-LD n = 19/10 mice. (H and J) Representative traces of spontaneous inhibitory postsynaptic currents (sIPSCs) and excitatory postsynaptic currents (sEPSCs) of ChIs from sham, 6-OHDA and chronic LD mice. (I) Amplitudes of sIPSCs were similar, but their frequency was increased in chronic L-DOPA group. Sham n = 9 neurons/5 mice, 6-OHDA n = 12 neurons/6 mice, chronic-LD n = 7 neurons/3 mice. p<0.05 (*) by Kruskal-Wallis test followed by Dunn’s multiple comparison test. (K) There were no changes in amplitude or frequency of sEPSCs. Sham n = 8 neurons/4 mice, 6-OHDA n = 16 neurons/7 mice, chronic-LD n = 11 neurons/6 mice.
-
Figure 2—source data 1
Individual neuron data and statistics for all panels.
- https://cdn.elifesciences.org/articles/56920/elife-56920-fig2-data1-v3.xlsx
Figure 3
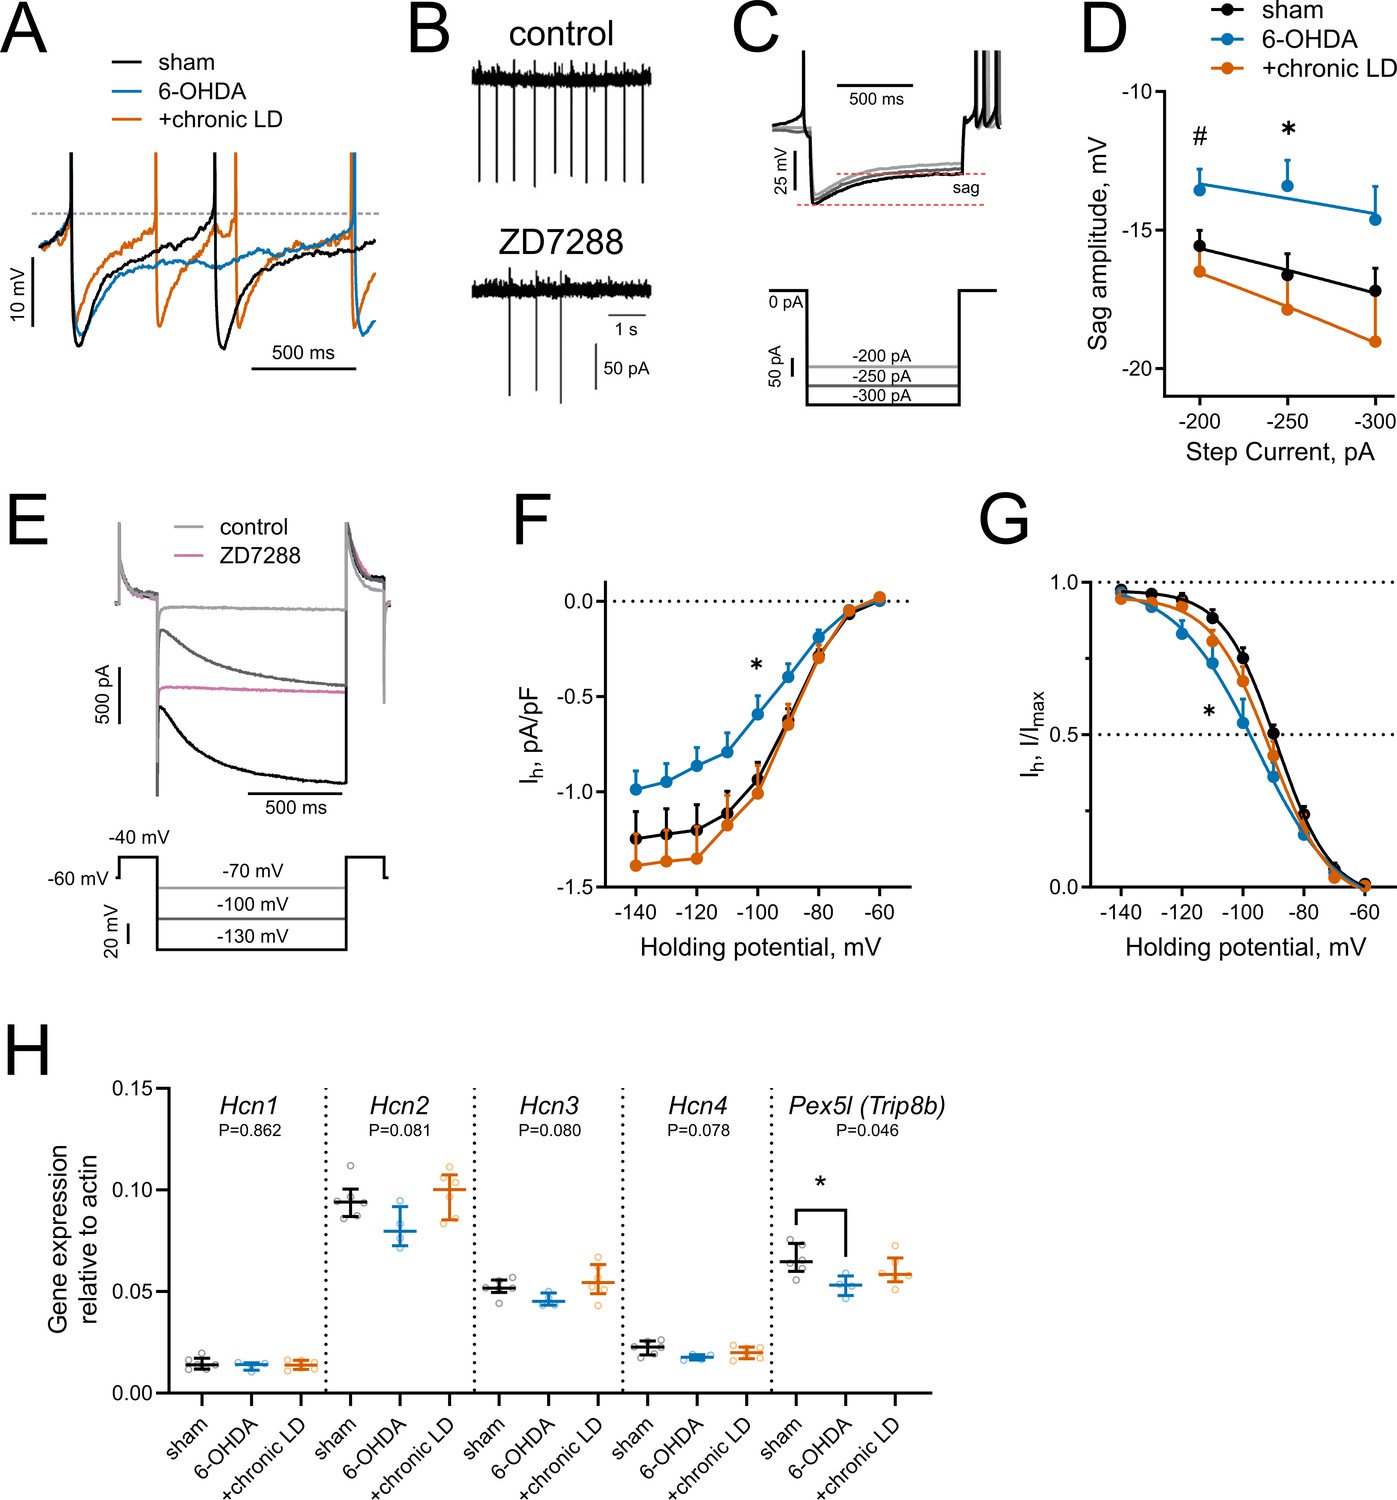
HCN-mediated currents are decreased by 6-OHDA lesion.
(A) Representative perforated-patch recordings of sAP from sham, 6-OHDA and +chronic-LD groups. Dotted line represents a threshold potential, which was similar between the groups. Note the markedly slower rate of cell depolarization after the action potential in the ChIs from 6-OHDA group and decreased amplitude of the AHP in a neuron from the +chronic-LD group. (B) Representative cell-attached recordings of ChI activity before and after treatment with HCN channel blocker ZD7288 (25 µM). (C) Current-clamp protocol (lower) and representative recordings (upper) showing voltage sag, a characteristic of HCN channel activation. (D) Quantification of sag amplitude at different current steps. Sham n = 39 neurons/18 mice, 6-OHDA n = 23 neurons/11 mice, chronic-LD n = 30 neurons/12 mice; p<0.05 (*) for 6-OHDA vs. two other groups, p<0.05 (#) 6-OHDA vs. chronic-LD at indicated current by Tukey’s multiple comparisons test following repeated measures two-way ANOVA. (E) Voltage-clamp protocol (lower) and representative ZD7288-sensitive (Ih) current (upper). (F) Ih density was decreased in ChIs from DA-depleted mice. Sham n = 11 neurons/6 mice, 6-OHDA n = 12 neurons/6 mice, chronic-LD n = 13 neurons/7 mice; p<0.05 (*) for sham vs. 6-OHDA at −100 mV by Tukey’s multiple comparison following repeated measures two-way ANOVA. (G) Boltzmann fits of normalized Ih densities. (Same N as in F); p<0.05 (*) for V50 values of sham vs. 6-OHDA by Tukey’s multiple comparison following one-way ANOVA. (H) ChI-specific gene expression of Hcn1-4 isoforms and Pex5l (Trip8b) measured by RT-qPCR from striatal mRNA immunoprecipitated from Chat-Cre:Rpl22HA (ribotag) mice treated as indicated. Target mRNA levels were normalized to β-actin. Sham n = 6 samples/20 mice, 6-OHDA n = 4 samples/17 mice, chronic-LD n = 6 samples/22 mice; P-values on graphs are for Kruskal-Wallis test, p<0.05 (*) with Dunn’s multiple comparisons test.
-
Figure 3—source data 1
Individual neuron data and statistics for all panels.
- https://cdn.elifesciences.org/articles/56920/elife-56920-fig3-data1-v3.xlsx
Figure 4
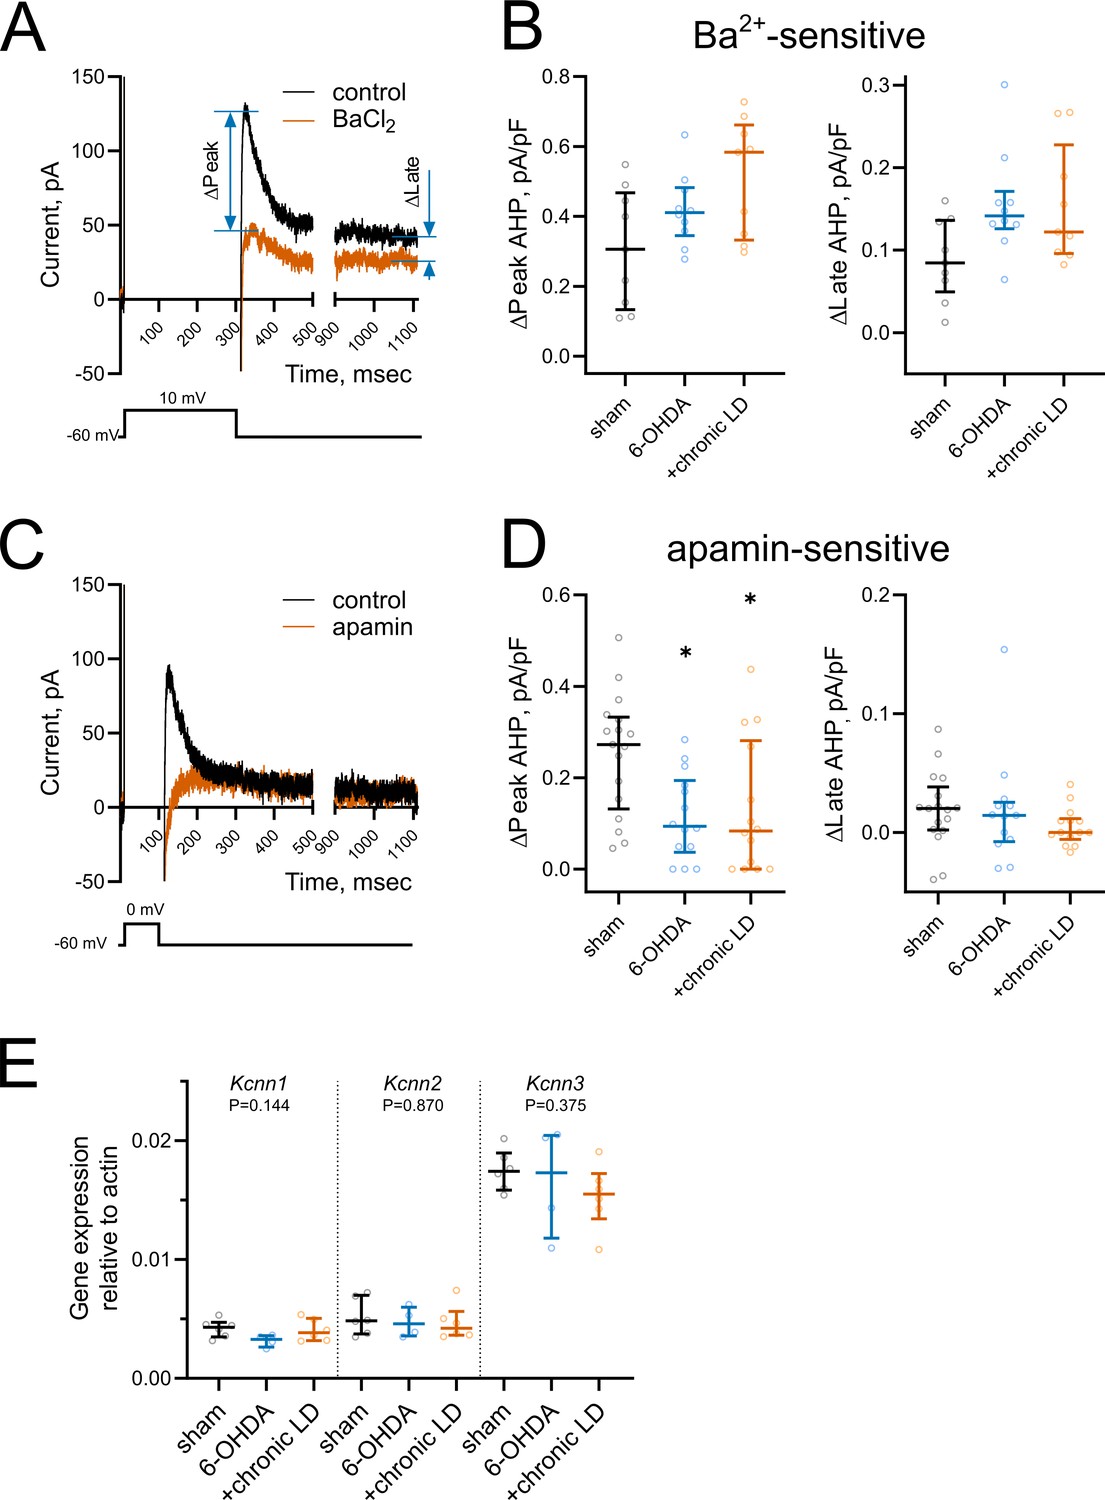
Changes in medium and slow afterhyperpolarization (AHP) currents.
(A and C) Representative voltage-clamp recording of (A) Ba2+-sensitive and (C) apamin-sensitive AHP currents before and after drug application (upper), and corresponding voltage protocols (lower). (B) BaCl2 (200 µM) blocked both peak and late phases of the current but the magnitude of the changes was similar in all groups. Sham n = 9 neurons/3 mice, 6-OHDA n = 10 neurons/3 mice, chronic-LD n = 9 neurons/3 mice. (D) Using a depolarization protocol to recruit primarily mAHP currents, apamin (100 nM) decreased the peak current amplitude without altering the late stage of the AHP current. Sham n = 17 neurons/5 mice, 6-OHDA n = 14 neurons/4 mice, chronic-LD n = 14 neurons/4 mice; p<0.05 (*), Kruskal-Wallis test with Dunn’s multiple comparison. (E) ChI-specific gene expression of Kcnn1-3 (SK1-3) isoforms measured by RT-qPCR as in Figure 3H. Target mRNA levels were normalized to β-actin. There were no significant differences between the groups by Kruskal-Wallis test; sham n = 6 samples/20 mice, 6-OHDA n = 4 samples/17 mice, chronic-LD n = 6 samples/22 mice.
-
Figure 4—source data 1
Individual neuron data and statistics for all panels.
- https://cdn.elifesciences.org/articles/56920/elife-56920-fig4-data1-v3.xlsx
Figure 5
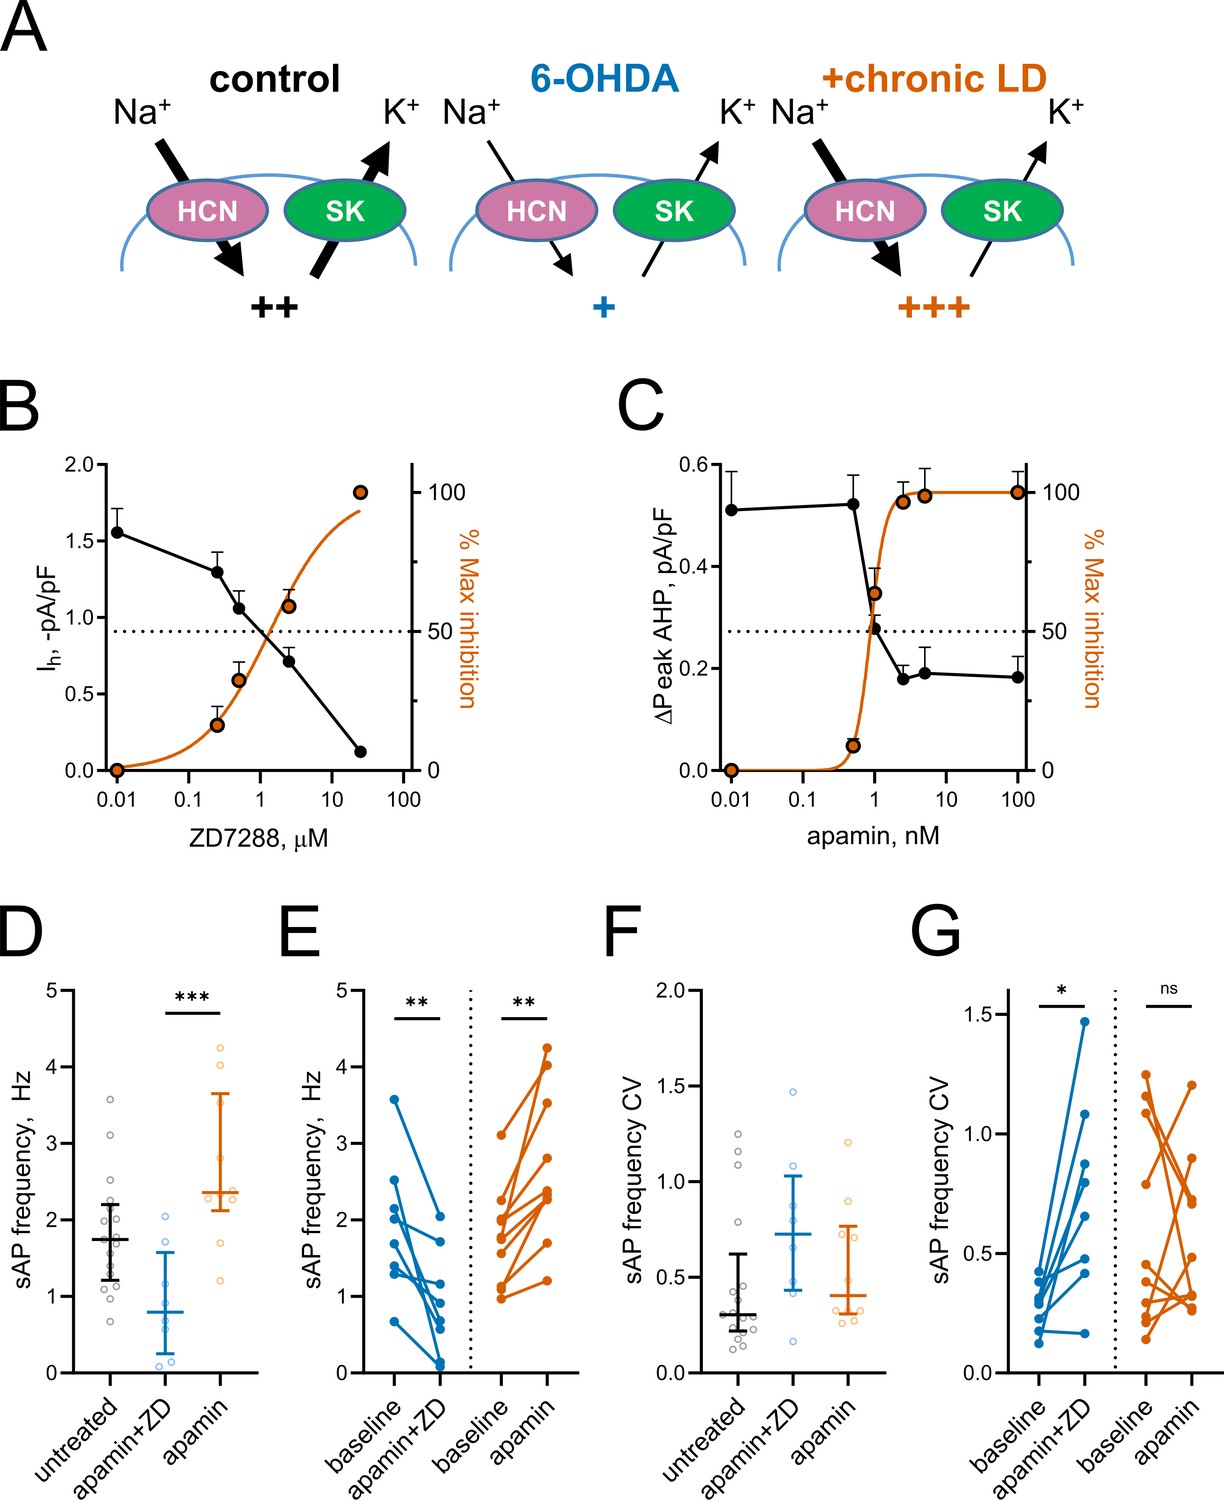
Partial inhibition of HCN and SK channels is sufficient to mimic changes in ChI activity after lesion and chronic L-DOPA treatment.
(A) Proposed changes in HCN and SK currents in ChIs from different treatment groups and their effect on spontaneous firing rates (+). (B) Dependence of Ih density (as measured on Figure 3E) on ZD7288 concentration. The orange curve represents fit of the data with the equation Y = 100(XSlope)/(IC50Slope + XSlope). Hill slope and IC50 are 0.9 and 1.4 µM, correspondingly; n = 8 neurons/2 mice. (C) Dependence of mAHP current density (as measured on Figure 4C) on apamin concentration. Hill slope and IC50 are 4 and 0.9 nM, correspondingly; n = 6 neurons/2 mice.(D–G) Partial SK and HCN channel blockade reproduced changes in the sAP rate and coefficient of variation of 6-OHDA and +chronic-LD groups. Although on average the decrease and increase in sAP frequency caused by apamin+ZD and apamin alone, respectively, did not reach statistical significance (D), apamin+ZD reliably decreased and apamin alone increased baseline sAP firing rate in individual ChIs (E). Likewise, the differences in the median coefficient of variation did not reach statistical significance (F), however, apamin+ZD increased CV over baseline for most ChIs, whereas apamin alone did not change the baseline CV (G). Untreated n = 17 neurons/6 mice, apamin+ZD n = 8 neurons/3 mice, apamin n = 10 neurons/3 mice; In panel D, p<0.001 (***) by Kruskal-Wallis test with Dunn’s multiple comparisons. In panels E and G, p<0.05 (*) and p<0.01 (**), Wilcoxon matched-pairs signed rank test.
-
Figure 5—source data 1
Individual neuron data and statistics for all panels.
- https://cdn.elifesciences.org/articles/56920/elife-56920-fig5-data1-v3.xlsx
Tables
Key resources table
| Reagent type (species) or resource | Designation | Source or reference | Identifiers | Additional information |
|---|---|---|---|---|
| Strain, strain background (Mus musculus MF) | C57BL/6J mouse | Jackson Laboratory | IMSR Cat# JAX:000664, RRID:IMSR_JAX:000664 | |
| Genetic reagent (Mus musculus MF) | Chat-Cre; Tg(Chat-cre)GM24Gsat/Mmucd | GENSAT | RRID:MMRRC_017269-UCD | Colony maintained in-house |
| Genetic reagent (Mus musculus MF) | Ribotag; B6N.129-Rpl22tm1.1Psam/J | Jackson Laboratory | IMSR Cat# JAX:011029, RRID:IMSR_JAX:011029 | Colony maintained in-house |
| Chemical compound, drug | 6-OHDA ; 6-hydroxydopamine hydrobromide | Sigma Aldrich | Cat#:H-116 | |
| Chemical compound, drug | Desipramine hydrochloride | Sigma Aldrich | Cat#:D-3900 | |
| Chemical compound, drug | L-DOPA; L-3,4-dihydroxyphenylalanine methyl ester hydrochloride | Sigma Aldrich | Cat#:D-1507 | |
| Chemical compound, drug | Benserazide hydrochloride | Sigma Aldrich | Cat#:D-7283 | |
| Chemical compound, drug | TTX; tetrodotoxin citrate | Tocris | Cat#:1069 | |
| Chemical compound, drug | ZD7288 | Tocris | Cat#:1000 | |
| Chemical compound, drug | apamin | Tocris | Cat#:1652 | |
| Chemical compound, drug | CNQX; CNQX disodium salt | Tocris | Cat#:1045 | |
| Chemical compound, drug | AP5; DL-AP5 | Tocris | Cat#:0105 | |
| Chemical compound, drug | PCX; picrotoxin | Tocris | Cat#:1128 | |
| Chemical compound, drug | QX 314 bromide | Tocris | Cat#:1014 | |
| Chemical compound, drug | biocytin | Sigma-Aldrich | Cat#:B4261 | |
| Chemical compound, drug | dopamine; dopamine hydrochloride | Sigma-Aldrich | Cat#:H8502 | |
| Chemical compound, drug | BaCl2 | Sigma-Aldrich | Cat#:449644 | |
| Chemical compound, drug | gramicidin | Sigma-Aldrich | Cat#:G5002 | |
| Chemical compound, drug | streptavidin-DyLight-633 conjugate | Thermo Scientific | Cat:21844 | |
| Software, algorithm | WinWCP | University of Strathclyde, UK | RRID:SCR_014713 | http://spider.science.strath.ac.uk/sipbs/software_ses.htm |
| Software, algorithm | Pclamp10 | Molecular Devices | RRID:SCR_011323 | |
| Software, algorithm | Igor Pro 6 | WaveMetrics | RRID:SCR_000325 | |
| Software, algorithm | Mini Analysis | Synaptosoft | RRID:SCR_002184 | |
| Software, algorithm | Matlab 2016a, Matlab 2019a | MathWorks | RRID:SCR_001622 | |
| Software, algorithm | GraphPad Prism v8 | GraphPad | RRID:SCR_002798 |
Additional files
Download links
A two-part list of links to download the article, or parts of the article, in various formats.
Downloads (link to download the article as PDF)
Open citations (links to open the citations from this article in various online reference manager services)
Cite this article (links to download the citations from this article in formats compatible with various reference manager tools)
Alterations in the intrinsic properties of striatal cholinergic interneurons after dopamine lesion and chronic L-DOPA
eLife 9:e56920.
https://doi.org/10.7554/eLife.56920


