Genetic variation in the social environment affects behavioral phenotypes of oxytocin receptor mutants in zebrafish
- Instituto Gulbenkian de Ciência, Portugal
- Weizmann Institute of Science, Israel
- ReMedy-International Research Agenda Unit, Centre of New Technologies, University of Warsaw, Poland
- ISPA – Instituto Universitário, Portugal
- Champalimaud Research, Portugal
Figures
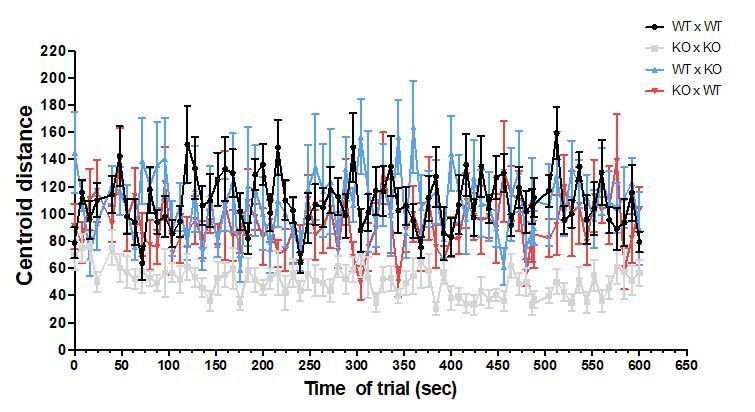
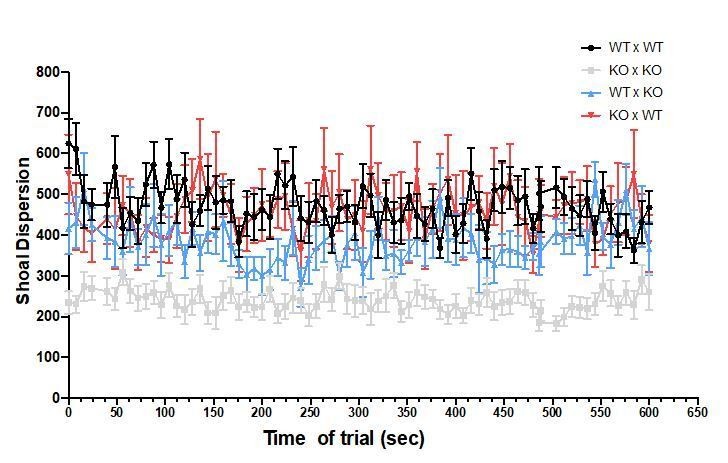
Figure 1

Genetic variation in the social environment affects zebrafish social behavior.
The contribution of the individual genotype (Gi), the genotype of conspecifics in the social group (Gs) and the interaction between the two (GixGs) to the expression of behavioral phenotypes in zebrafish was assessed by raising oxytocin receptor mutant fish and wild types (focal fish marked with *) in shoals of either mutants or wild types (A). Social preference, measured by the time fish spend near a shoal vs. empty in a choice test (B, upper panel), showed a marginally significant effect of Gs (C; Source data file Figure 1—source data 1). Social habituation, which consisted on a consecutive social preference test exhibited a GixGs effect (D; Source data file Figure 1—source data 2). Social recognition, measured as the discrimination between a novel and a familiar conspecific (E, upper panel), shows a pure G effect (F; Source data file Figure 1—source data 3). Social integration, measured as distance to the centroid of the shoal (G), showed a GixGs effect (H; Source data file Figure 1—source data 4). Social influence, measured by the cohesion of the remaining shoal members (I), also showed a marginally significant GixGs effect (J; Source data file Figure 1—source data 5). Heatmaps show the spatial distribution of a representative oxtr(+/+) individual fish raised in a oxtr(+/+) group, during the entire trial, for both social preference (B, lower panel) and social recognition (E, lower panel). Data is presented as mean ± standard error of the mean (SEM). Sample sizes are nine for heterogeneous groups (i.e. focal individual with different genotype from the remaining individuals in the shoal; mutant focal in WT shoals and WT focal in mutant shoals) and 15 for homogeneous groups (i.e. focal individual with the same genotype of the remaining individuals in the shoal; mutant focal in mutant shoals and WT focal in WT shoals). Different letters indicate significant differences (p<0.05) between treatments as assessed by Tukey post-hoc tests following a two-way ANOVA (D,H,J; see Table 1). An asterisk indicates a Gi main effect in F.
-
Figure 1—source data 1
Effects of individual and conspecifics genotype on Social Preference.
- https://cdn.elifesciences.org/articles/56973/elife-56973-fig1-data1-v1.xlsx
-
Figure 1—source data 2
Effects of individual and conspecifics genotype on social habituation.
- https://cdn.elifesciences.org/articles/56973/elife-56973-fig1-data2-v1.xlsx
-
Figure 1—source data 3
Effects of individual and conspecifics genotype on social recognition.
- https://cdn.elifesciences.org/articles/56973/elife-56973-fig1-data3-v1.xlsx
-
Figure 1—source data 4
Effects of individual and conspecifics genotype on social integration.
- https://cdn.elifesciences.org/articles/56973/elife-56973-fig1-data4-v1.xlsx
-
Figure 1—source data 5
Effects of individual and conspecifics genotype on social influence.
- https://cdn.elifesciences.org/articles/56973/elife-56973-fig1-data5-v1.xlsx
Author response image 1
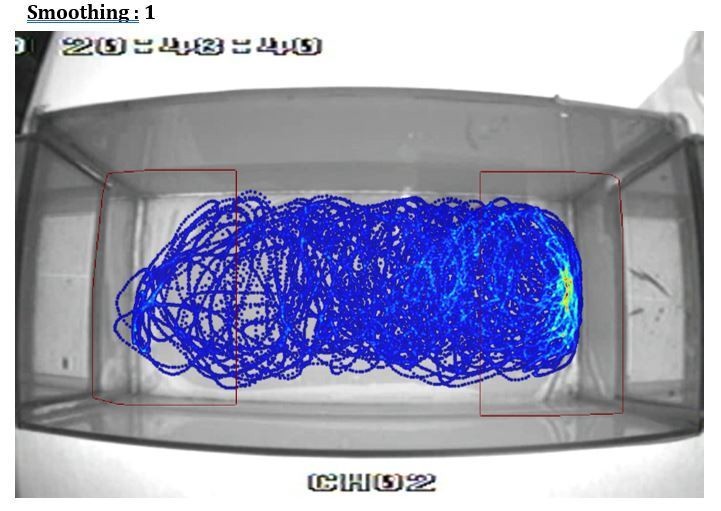
Author response image 2
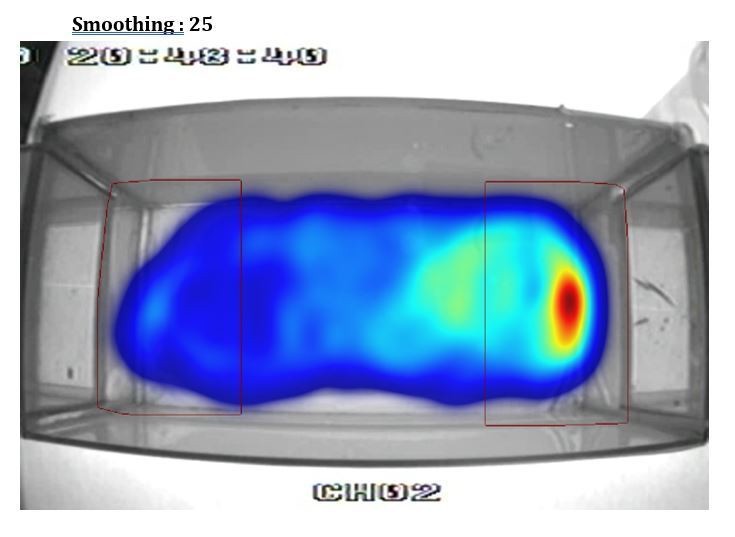
Author response image 3

Author response image 4

Author response image 5
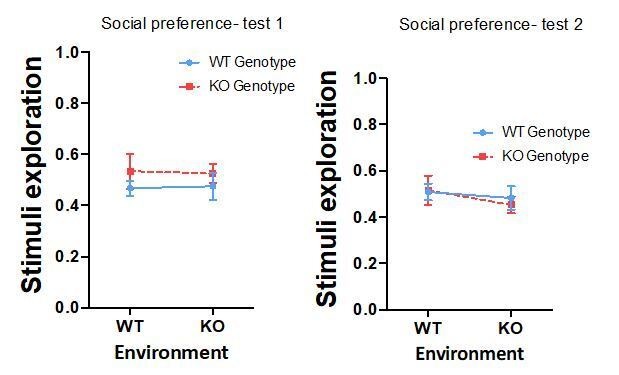
Author response image 6
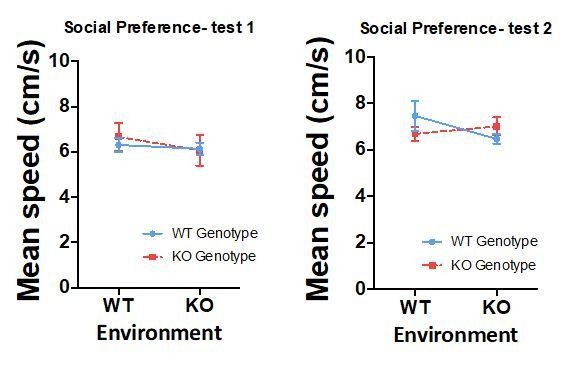
Author response image 7
Author response image 8
Tables
Table 1
Effect of genotype of the focal individual (Gi), genotype of conspecifics present in its social environment (Gs) and the interaction between the two (GixGs) on zebrafish social behavior was assessed using a two-way ANOVA.
~ indicates marginally significant, *p<0.05, **p<0.01, ***p<0.001. (Source data files Figure 1—source datas 1–5).
| Social preference | |||||
|---|---|---|---|---|---|
| d.f. | Mean squares | F | Significance | Partial η2 | |
| Gi | 1 | 0.023 | 1.731 | 0.195 | 0.038 |
| Gs | 1 | 0.050 | 3.788 | 0.058~ | 0.079 |
| Gi x Gs | 1 | 0.001 | 0.049 | 0.825 | 0.001 |
| Error | 44 | 0.013 | |||
| Habituation | |||||
| d.f. | Mean squares | F | Significance | Partial η2 | |
| Gi | 1 | 0.058 | 13.927 | 0.001 ** | 0.240 |
| Gs | 1 | 0.008 | 1.936 | 0.171 | 0.042 |
| Gi x Gs | 1 | 0.024 | 5.642 | 0.022 * | 0.114 |
| Error | 44 | 0.004 | |||
| Social recognition | |||||
| d.f. | Mean squares | F | Significance | Partial η2 | |
| Gi | 1 | 0.213 | 7.600 | 0.008 ** | 0.147 |
| Gs | 1 | 0.005 | 0.189 | 0.666 | 0.004 |
| Gi x Gs | 1 | 0.001 | 0.041 | 0.841 | 0.001 |
| Error | 44 | 0.028 | |||
| Social group integration | |||||
| d.f. | Mean squares | F | Significance | Partial η2 | |
| Gi | 1 | 39.486 | 24.370 | <0.001 *** | 0.356 |
| Gs | 1 | 12.565 | 7.755 | 0.008 ** | 0.150 |
| Gi x Gs | 1 | 12.811 | 7.907 | 0.007 ** | 0.152 |
| Error | 44 | 1.620 | |||
| Social group dispersion | |||||
| d.f. | Mean squares | F | Significance | Partial η2 | |
| Gi | 1 | 174.366 | 4.309 | 0.044 * | 0.089 |
| Gs | 1 | 657.221 | 16.240 | <0.001 *** | 0.270 |
| Gi x Gs | 1 | 122.980 | 3.039 | 0.088 | 0.065 |
| Error | 44 | 40.469 | |||
Key resources table
| Reagent type (species) or resource | Designation | Source or reference | Identifiers | Additional information |
|---|---|---|---|---|
| Genetic reagent, TL (Danio rerio) | oxtr mutant line | Nunes et al., 2020 | ZDB-ALT-190830–1 | |
| Commercial assay or kit | NucleoSpin Tissue | MACHEREY-NAGEL | # 740952.50 | For oxtr mutant genotyping |
| Sequence-based reagent | sense 5’-TGCGCGAGGAAAACTAGTT-3’ | Sigma | For oxtr mutant genotyping | |
| Sequence-based reagent | antisense 5’-AGCAGACACTCAGAATGGTCA-3’ | Sigma | For oxtr mutant genotyping | |
| Software, , algorithm | SPSS 25.0 | SPSS | RRID:SCR_002865 | |
| Software, , algorithm | Imagej (Fiji) | Schindelin et al., 2012 | RRID:SCR_003070 | |
| Software, , algorithm | Ethovision XT 11.5 | Noldus Technology | www.noldus.com/ethovision | |
| Software, , algorithm | GraphPad Prism version 6.0 c | GraphPad software, San Diego, California, USA | www.graphpad.com | |
| Other | B and W mini surveillance camera | Henelec 300B | Acquisition rate of 30 fps | |
| Other | Webcameras | Logitech HD C525 | Acquisition rate of 30 fps |
Additional files
Download links
A two-part list of links to download the article, or parts of the article, in various formats.
Downloads (link to download the article as PDF)
Open citations (links to open the citations from this article in various online reference manager services)
Cite this article (links to download the citations from this article in formats compatible with various reference manager tools)
Genetic variation in the social environment affects behavioral phenotypes of oxytocin receptor mutants in zebrafish
eLife 9:e56973.
https://doi.org/10.7554/eLife.56973


