Periprotein lipidomes of Saccharomyces cerevisiae provide a flexible environment for conformational changes of membrane proteins
- Department of Biochemistry, University of Groningen Groningen Biomolecular Sciences and Biotechnology Institute, Netherlands
- Division of Rheumatology, Inflammation and Immunity Brigham and Women's Hospital, Harvard Medical School, United States
- Department of Medicine, Harvard Medical School, United States
Figures
Figure 1 with 4 supplements
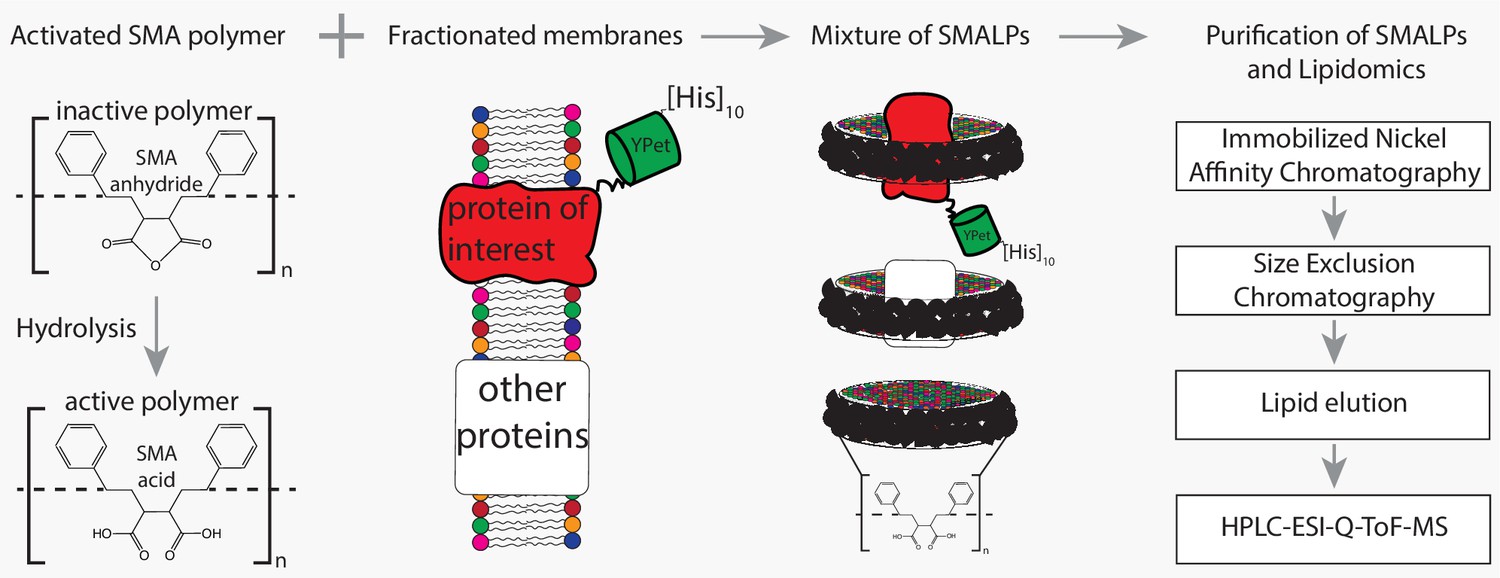
Flowchart of SMALP isolation and lipidome analysis.
Hydrolysis of SMA-anhydride gives SMA acid. Combining SMA with fractionated membranes results in SMALPs in which SMA (black ribbon) has encapsulated lipids and proteins. The initial mixture consists of SMALPs containing the protein of interest (red), other proteins (white box) or no protein at all. Purification of protein-specific SMALPs is done by Immobilized Nickel Affinity Chromatography (IMAC) and Size-Exclusion Chromatography (SEC). Next, lipids associated with SMALPs are determined by reversed-phase high-performance liquid chromatography (HPLC) coupled with electrospray ionization (ESI)-quadrupole-time-of-flight (Q-ToF) mass spectrometry (MS).
Figure 1—figure supplement 1

Negative stain Cryo-EM of SMALPs.
SMALPs containing Lyp1-Ypet were visualized by negative stain cryo-EM. Scale bar is indicated on top left. The white box highlights one SMALP, which is approximately 10 nm.
Figure 1—figure supplement 2

Microscopy images of strains used in this study.
(A) Brightfield images depict S. cerevisiae visualized with visible light. (B) Proteins of interest are visualized by a Green Fluorescent Protein (Ypet) fused to Lyp1, Can1, Sur7 or Pma1. MCC = Micro Compartment of Can1; MCP = Micro Compartment of Pma1. Eisosomal protein Pil1 is visualized by a Red Fluorescent Protein (mCherry) and co-localizes with proteins in the MCC. B. Membrane protein trapping mechanism as designed by Rothbauer et al. (2008) and used by Gournas et al. (2018). GFP binding protein (GBP) is fused to Sur7, and Lyp1 and Can1 are fused to GFP. Upon interaction between GBP and GFP, Can1 and Lyp1 are trapped in the MCC/Eisosome.
Figure 1—figure supplement 3
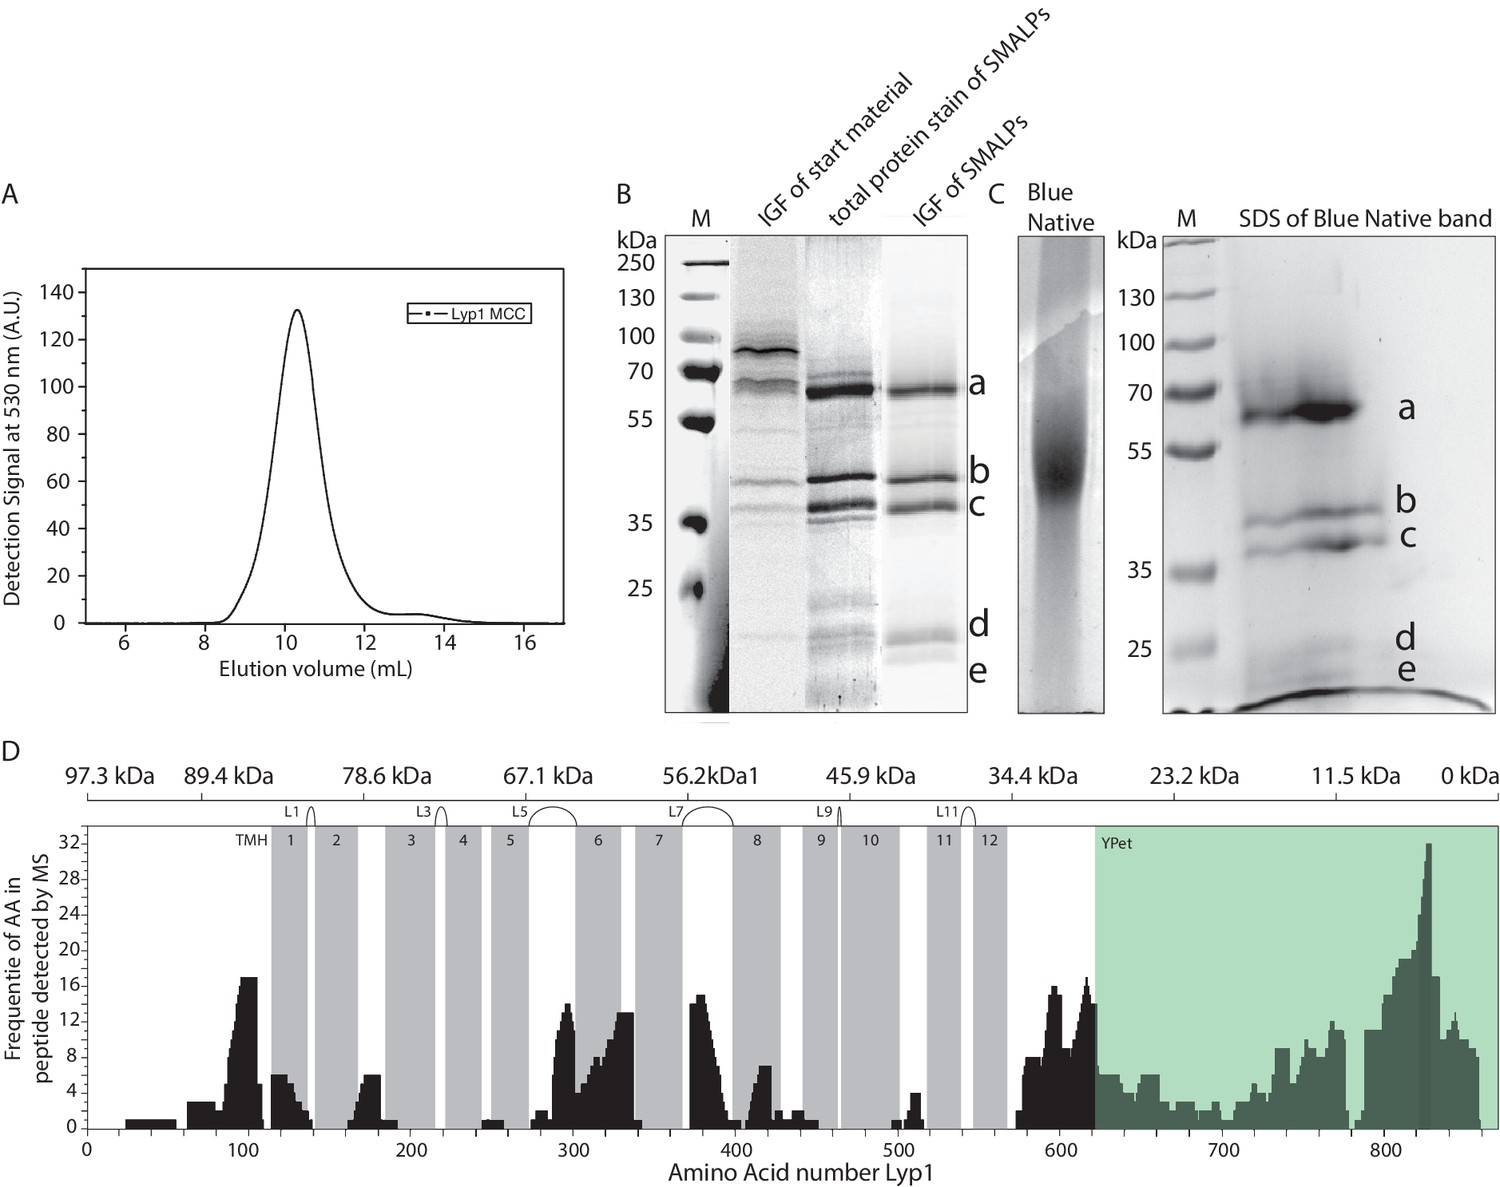
Polyacrylamide gel electrophoresis and mass spectrometry analysis of Lyp1-Ypet SMALPs.
(A) Fluorescence Size-Exclusion Chromatography profile of Lyp1-Ypet SMALPs on a Superdex 200/30 GL column. (B) SDS-PAGE and (C) Blue Native-PAGE of Lyp1Ypet-SMALPs. M = Marker, IGF = In Gel Fluorescence of Ypet. Corresponding bands in SDS-PAGE and 2D native-denaturing gel electrophoresis are indicated by a-e. (D) Peptide coverage of Lyp1Ypet-SMALPs measured by Mass Spectrometry. TMH = Trans Membrane Helix, Gray bars indicate the position of each TMH. Extracellular loops are indicated as Lx, where x = the loop number. The top scale indicates the molecular weight of randomized protein fractions in kDa (kiloDalton) starting from the C-terminal YPet, highlighted in green.
Figure 1—figure supplement 4
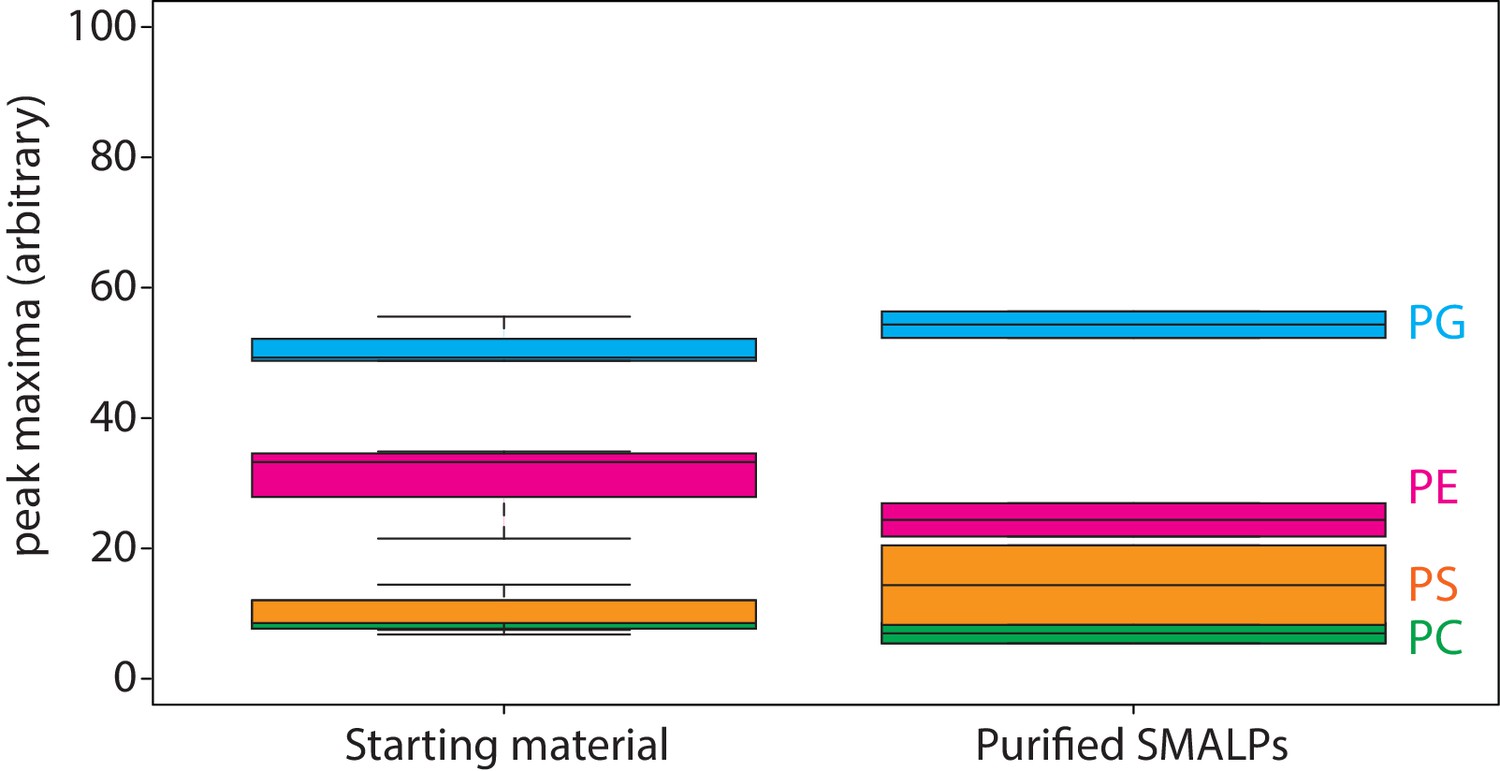
Lipid analysis by mass spectrometry of proteo-liposomes.
Boxplot of peak areas of mass spectra corresponding to POPE, POPG, POPS and POPC, present in starting material and purified SMALPs. Two-letter abbreviation and color-coding: PC = phosphatidylcholine (green), PE = phosphatidylethanolamine (magenta), PS = phosphatidylserine (orange) and PG = phosphatidylglycerol (blue). Line within boxplot represents the median. Top and bottom represent the first and third quartile, respectively. Error bars are the minimal and maximal value. Number of experiments = 3 experimental replicates.
Figure 2 with 1 supplement
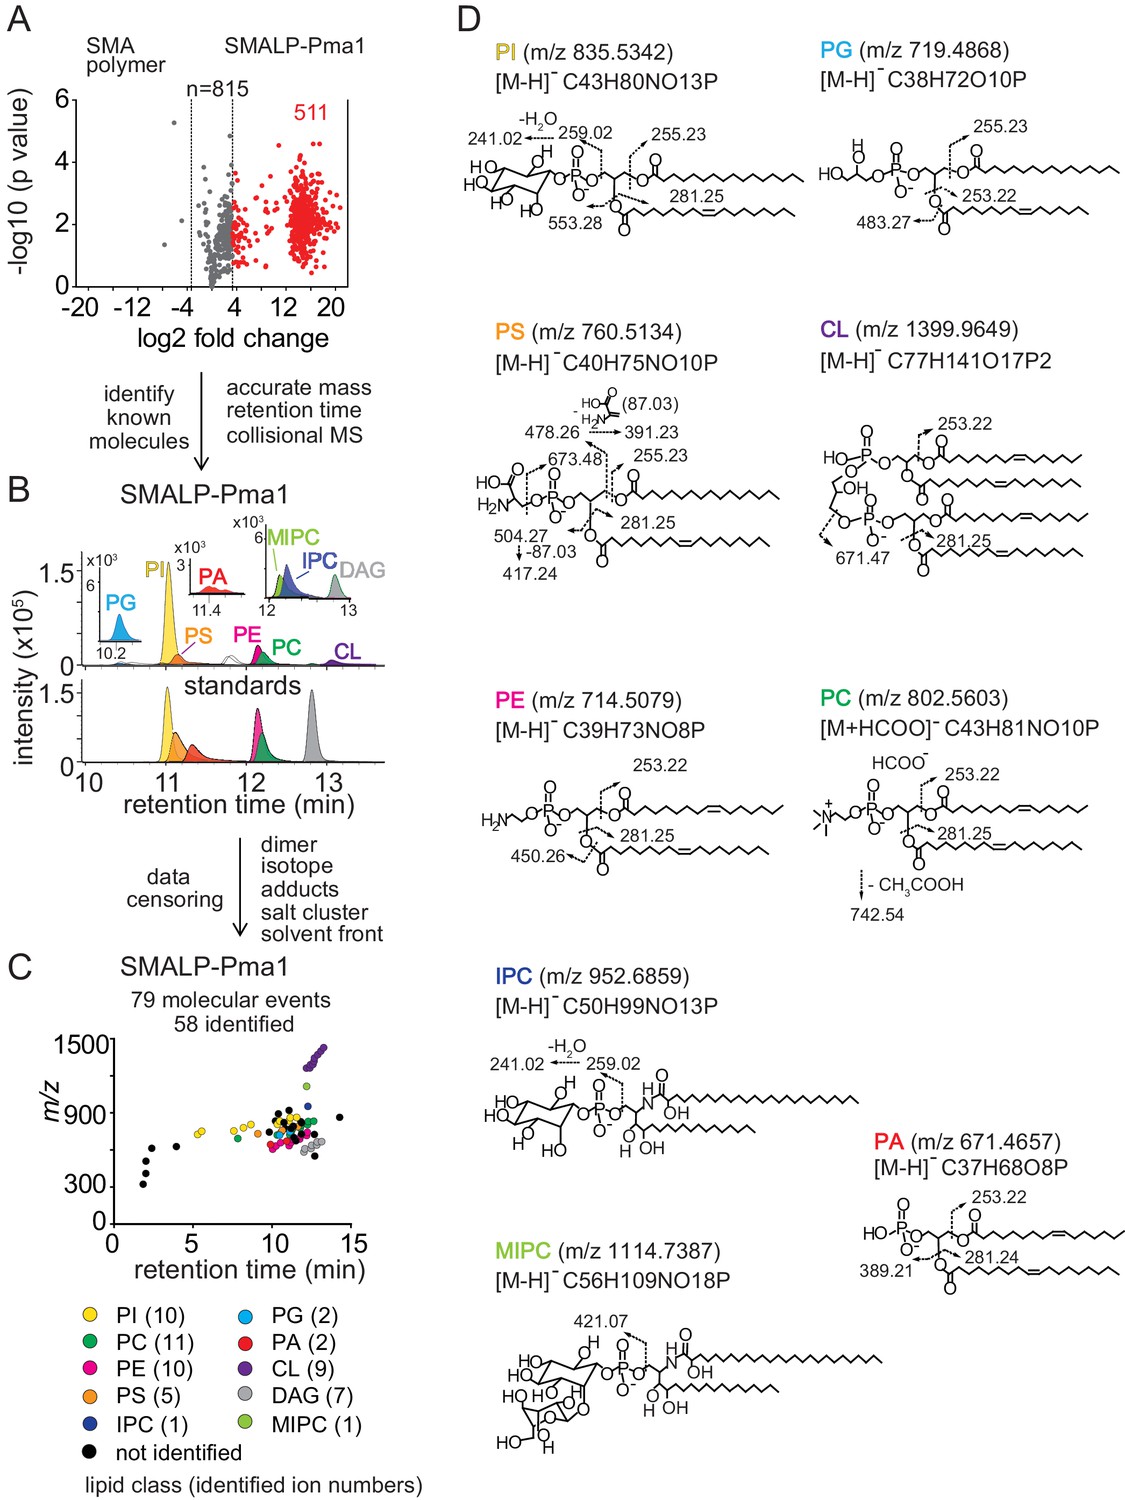
Lipidomics of SMALPs.
(A) Three independently purified samples of SMALP-Pma1 obtained from yeast cells were subjected to lipid extraction, and 1 µM of the input protein was used to normalize lipid input for the reversed phase HPLC-QToF-ESI-MS in the negative ion mode. Ions were considered enriched for the SMALP-Pma1 when the intensity was at least 10-fold higher compared to the control. (B–C) Common lipids, including PI, PC, PS, PE, PG, PA, CL, DAG, IPC, and MIPC, were found based on the accurate mass, retention time or collisional MS pattern match to the synthetic standards. Chain length and unsaturation analogs were identified, whereas the redundant ions such as isotopes, lipid dimers, alternate adducts, and salt clusters were removed from the enriched ion pool. (D) Negative mode CID-MS from each lipid class identified diagnostic fragments. Molecular variants with altered chain length and unsaturation within each class were deduced based on mass intervals corresponding to CH2 or H2 hydrogens (not shown).
Figure 2—figure supplement 1

Lipidomics of SMALP-Sur7.
(A) Three independently purified samples of SMALP-Sur7 were subjected to lipid extraction, normalization to 1 µM of the input protein and subjected to reversed phase HPLC-QToF-ESI-MS in the negative ion mode. Among 548 ions detected the molecules were considered altered (red) when the signal changed 10-fold. P values were corrected using the Bonferroni method. (B) Using triage methods outlined in Figure 2, we culled 36 ions with high intensity and lacking redundant detection as isotopes or alternate adducts, whose retention times are shown. Among these, 36 of ions were identified in 7 lipids classes using CID-MS and authentic standards. The number of lipids identified in each class is indicated in the parentheses.
Figure 3 with 1 supplement
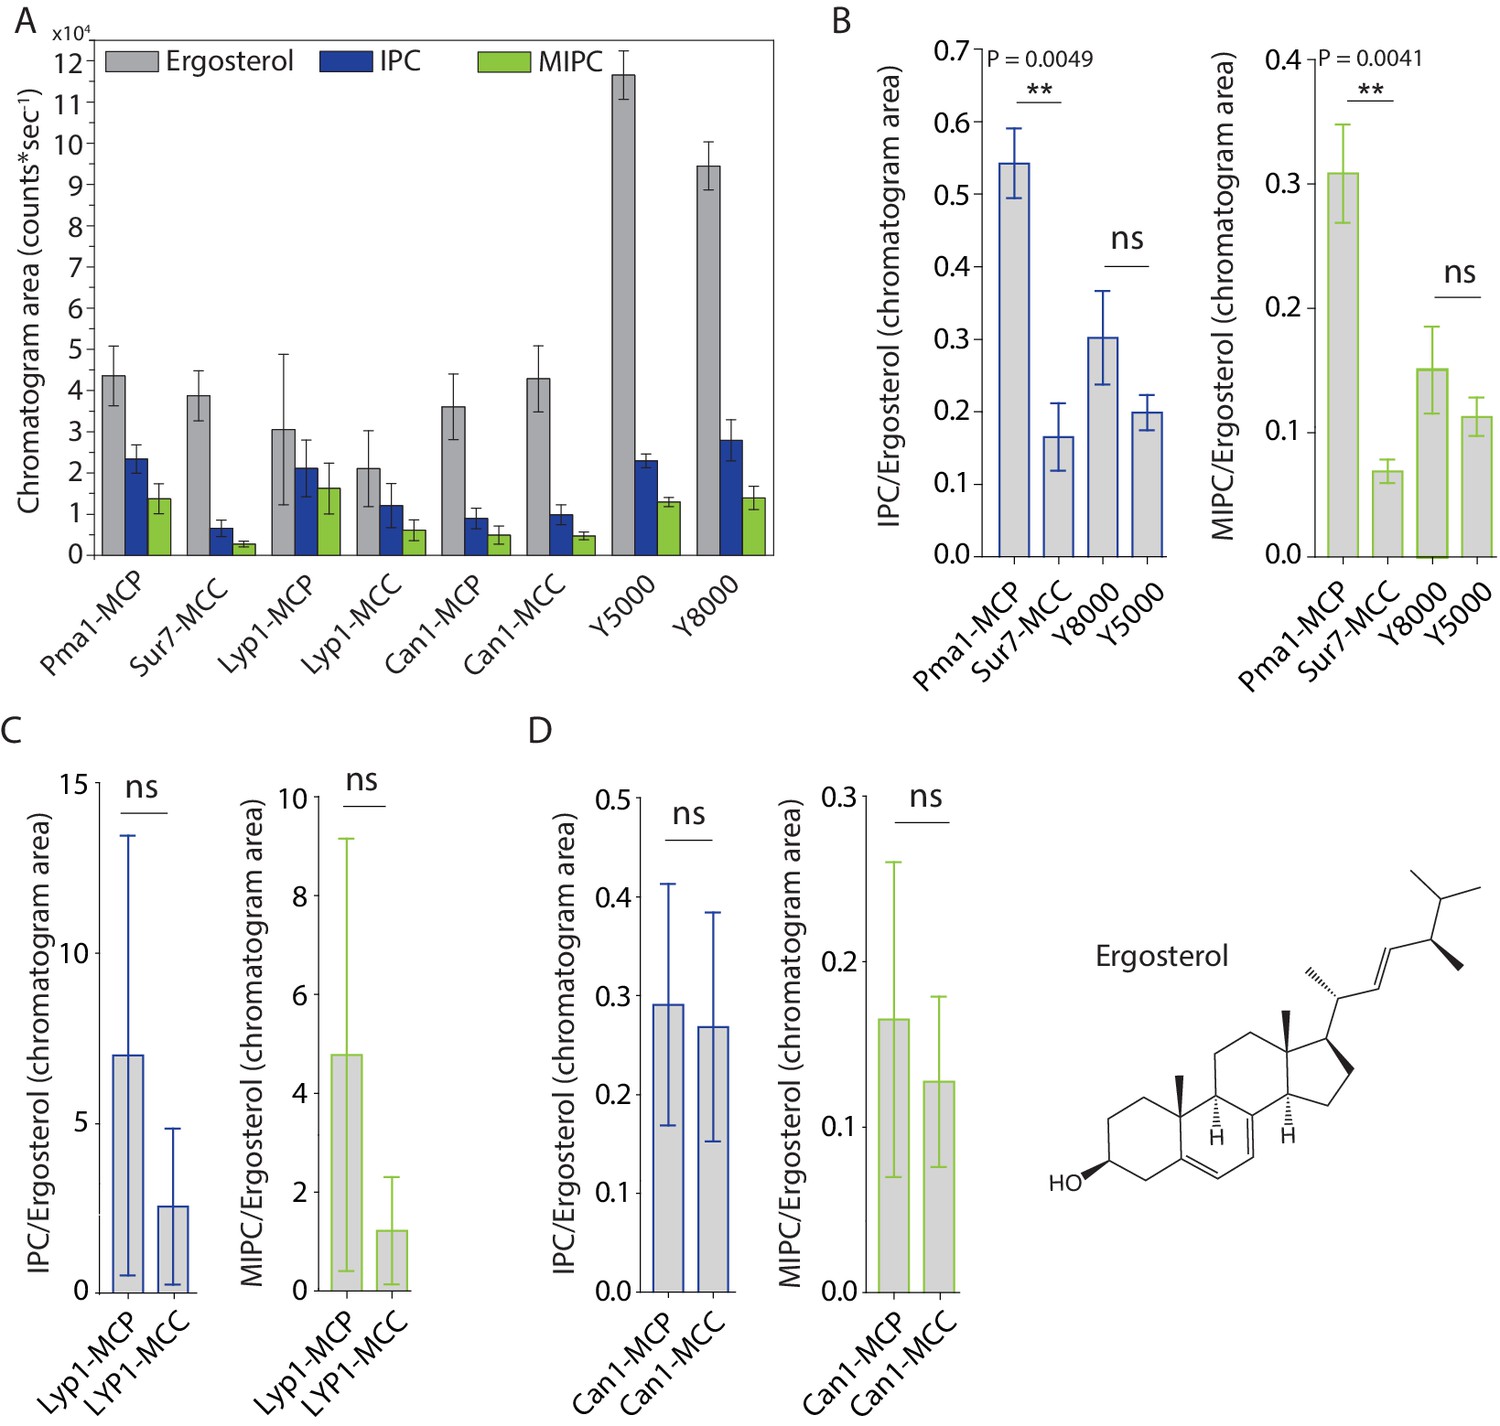
Peak areas and ratios of ergosterol over sphingolipids.
(A) Peak areas measured in triplicate with standard error of the mean of the indicated lipid classes are shown according to protein markers that define membrane domains. Ratio of IPC/Ergosterol and ratio of MIPC/Ergosterol for (B) Pma1, Sur7, Y8000 and Y5000, for (C) Lyp1 purified from the MCP and MCC and for (D) Can1 purified from the MCP and MCC. The data are presented as mean +/- standard error. P value was calculated using Student’s t-test. **, p<0.005, ns = not significant.
-
Figure 3—source data 1
Lipidomics for Panel A-D.
- https://cdn.elifesciences.org/articles/57003/elife-57003-fig3-data1-v2.xlsx
Figure 3—figure supplement 1

Filipin staining of S. cerevisiae.
Images of S. cerevisiae cells strain Y5000, obtained with visible light (brightfield), showing MCC/eisosomes by 488 nm laser excitation of the MCC marker Sur7-Ypet; ergosterol is visualize by 365 nm excitation of Filipin III.
Figure 4 with 2 supplements
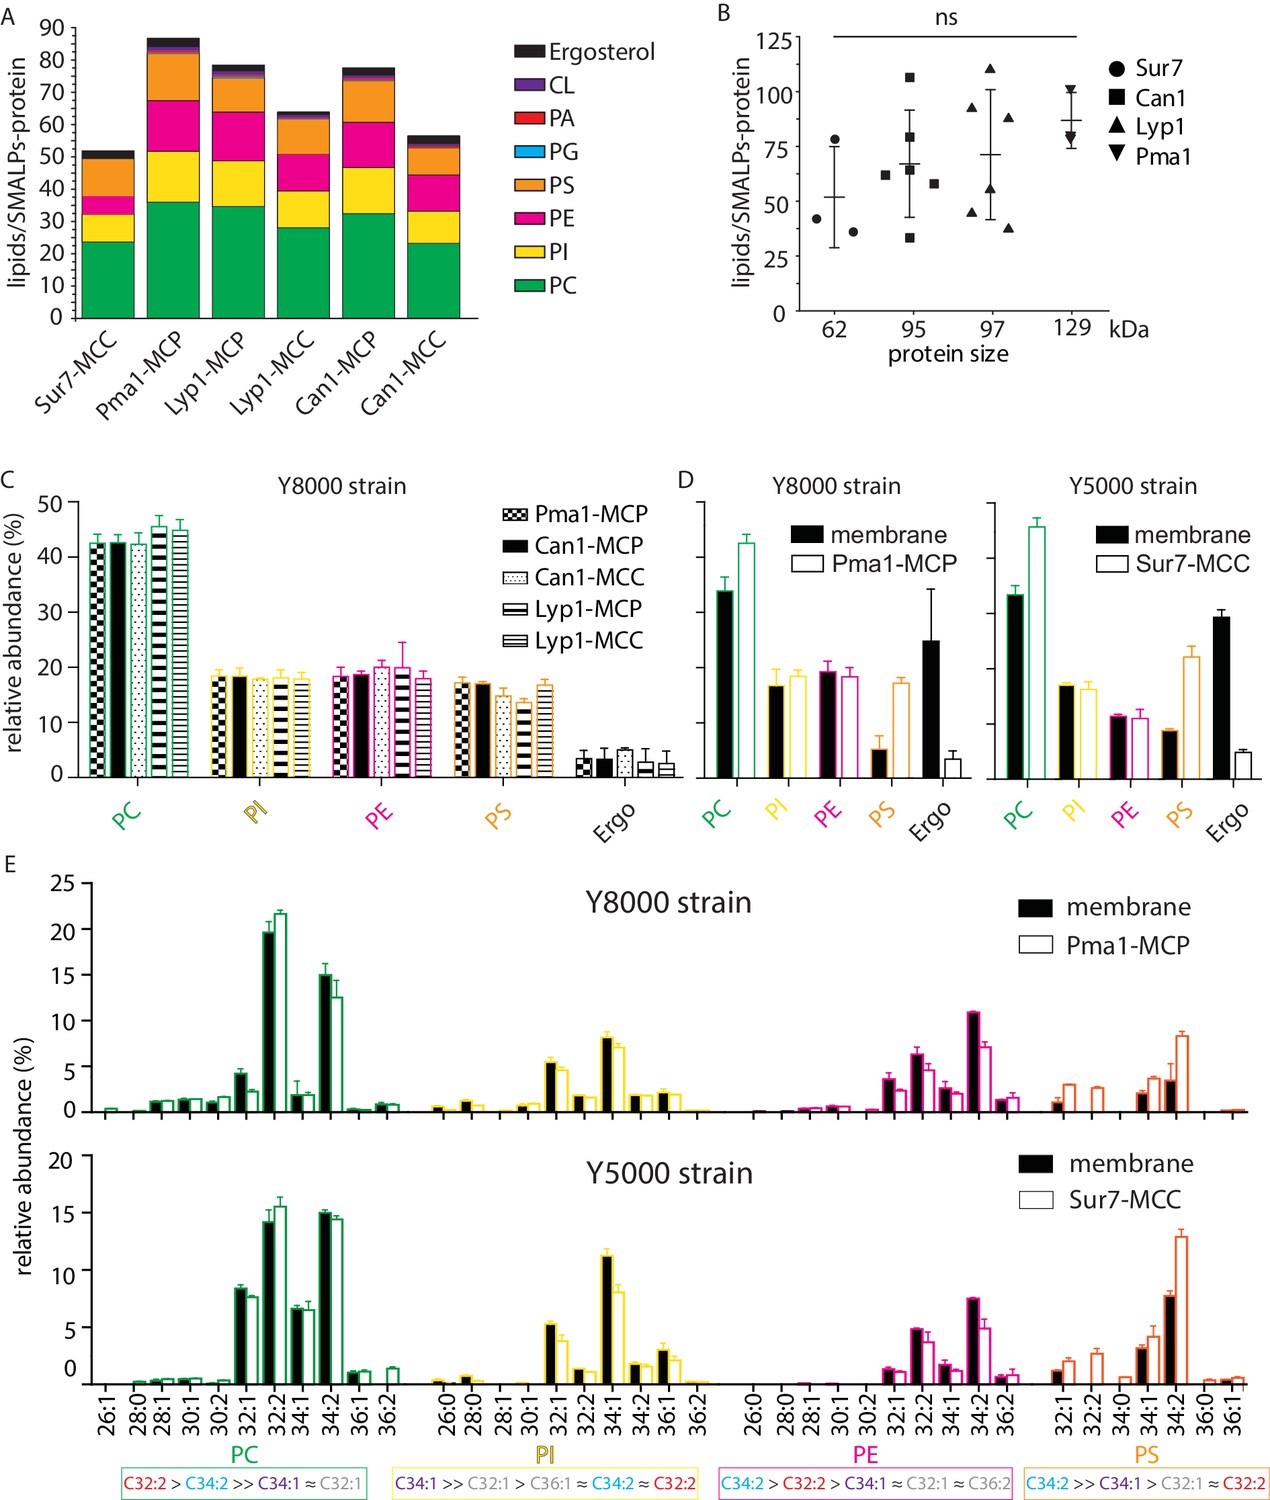
Phospholipids of SMALPs.
(A) Number of lipid species per SMALP. (B) Total number of lipids per SMALP for each protein plotted against molecular weight of the protein, excluding the YPet moiety. (C) Relative abundance per lipid class for each SMALP. (D) Relative abundance of lipids for total plasma membrane extracts of Y8000- and Y5000-strain. (E) Phospholipid composition of the MCP and MCC. C = carbon, 1stnumber = cumulative length of two acyl chains, 2nd number = cumulative number of double bonds of two acyl chains. Phospholipid two-letter abbreviations, including color-coding: PC = PhosphatidylCholine, PE = PhosphatidylEthanolamine, PS = PhosphatidylSerine and PI = PhosphatidylInositol. Number of biological replicate experiments (n) = 3; error bars are Standard Error of the Mean (SEM).
-
Figure 4—source data 1
Lipidomics for Panel A-E.
- https://cdn.elifesciences.org/articles/57003/elife-57003-fig4-data1-v2.xlsx
Figure 4—figure supplement 1

Mass spectrometry-based quantitation using external and internal standards.
(A) For each standard, a series of known concentrations were prepared and analyzed by HPLC-MS. The ion chromatogram peak areas from known concentrations were used to generate external standard curves for determining the concentrations of the extracted lipids using linear curve fitting, and non-linear curve fitting for values with zone suppression. (B) Lipid concentrations from SMALPs were estimated using the external standard curve fitting as indicated. (C) Lipid concentrations were also quantified using internal standards by the method of standard addition. Briefly, the lipid extracts were spiked with known concentrations of the synthetic standard, which has the same total fatty acyl chain length and number of unsaturation as compared to the lipid of interest. The ion chromatogram peak areas were plotted against the concentrations of the synthetic standard and extrapolated to the X-axis. (D) The conversion factors were defined as the ratio of the estimated quantity obtained from the external standard fitting to that from the standard addition method. The conversion factors are 0.71, 0.79, 0.63, 0.35, and 0.73 for PI, PC, PE, PS, and ergosterol, respectively. Final mass values are reported according to the estimated amount from the internal standard curve for one lead lipid in each class. The data are presented as mean ± standard deviation of triplicate measurements (SD).
Figure 4—figure supplement 2
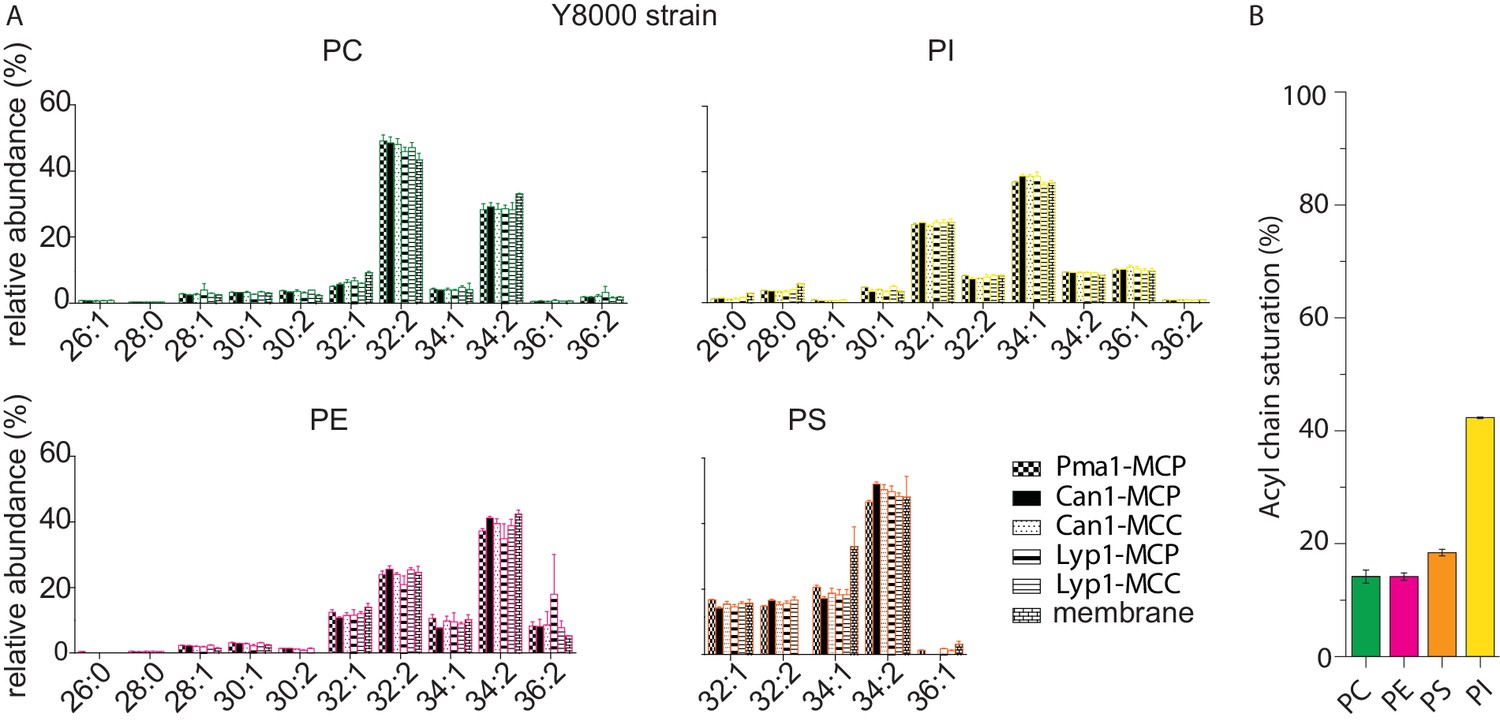
Phospholipid composition of SMALP and membrane samples.
(A) Relative abundance of each phospholipid species as a function of acyl chain type for protein-SMALPs. Lyp1-MCC and Can1-MCC refer to SMALPs that have been obtained from proteins trapped in the MCC, using a GFP binding protein fused to the MCC resident Sur7. Lyp1-MCP and Can1-MCP refer to SMALPs that have been obtained from proteins that are not trapped in the MCC and thus correspond to MCP but a minor fraction from the MCC is present. (B) Total acyl chain saturation (%)/phospholipid species.
Figure 5
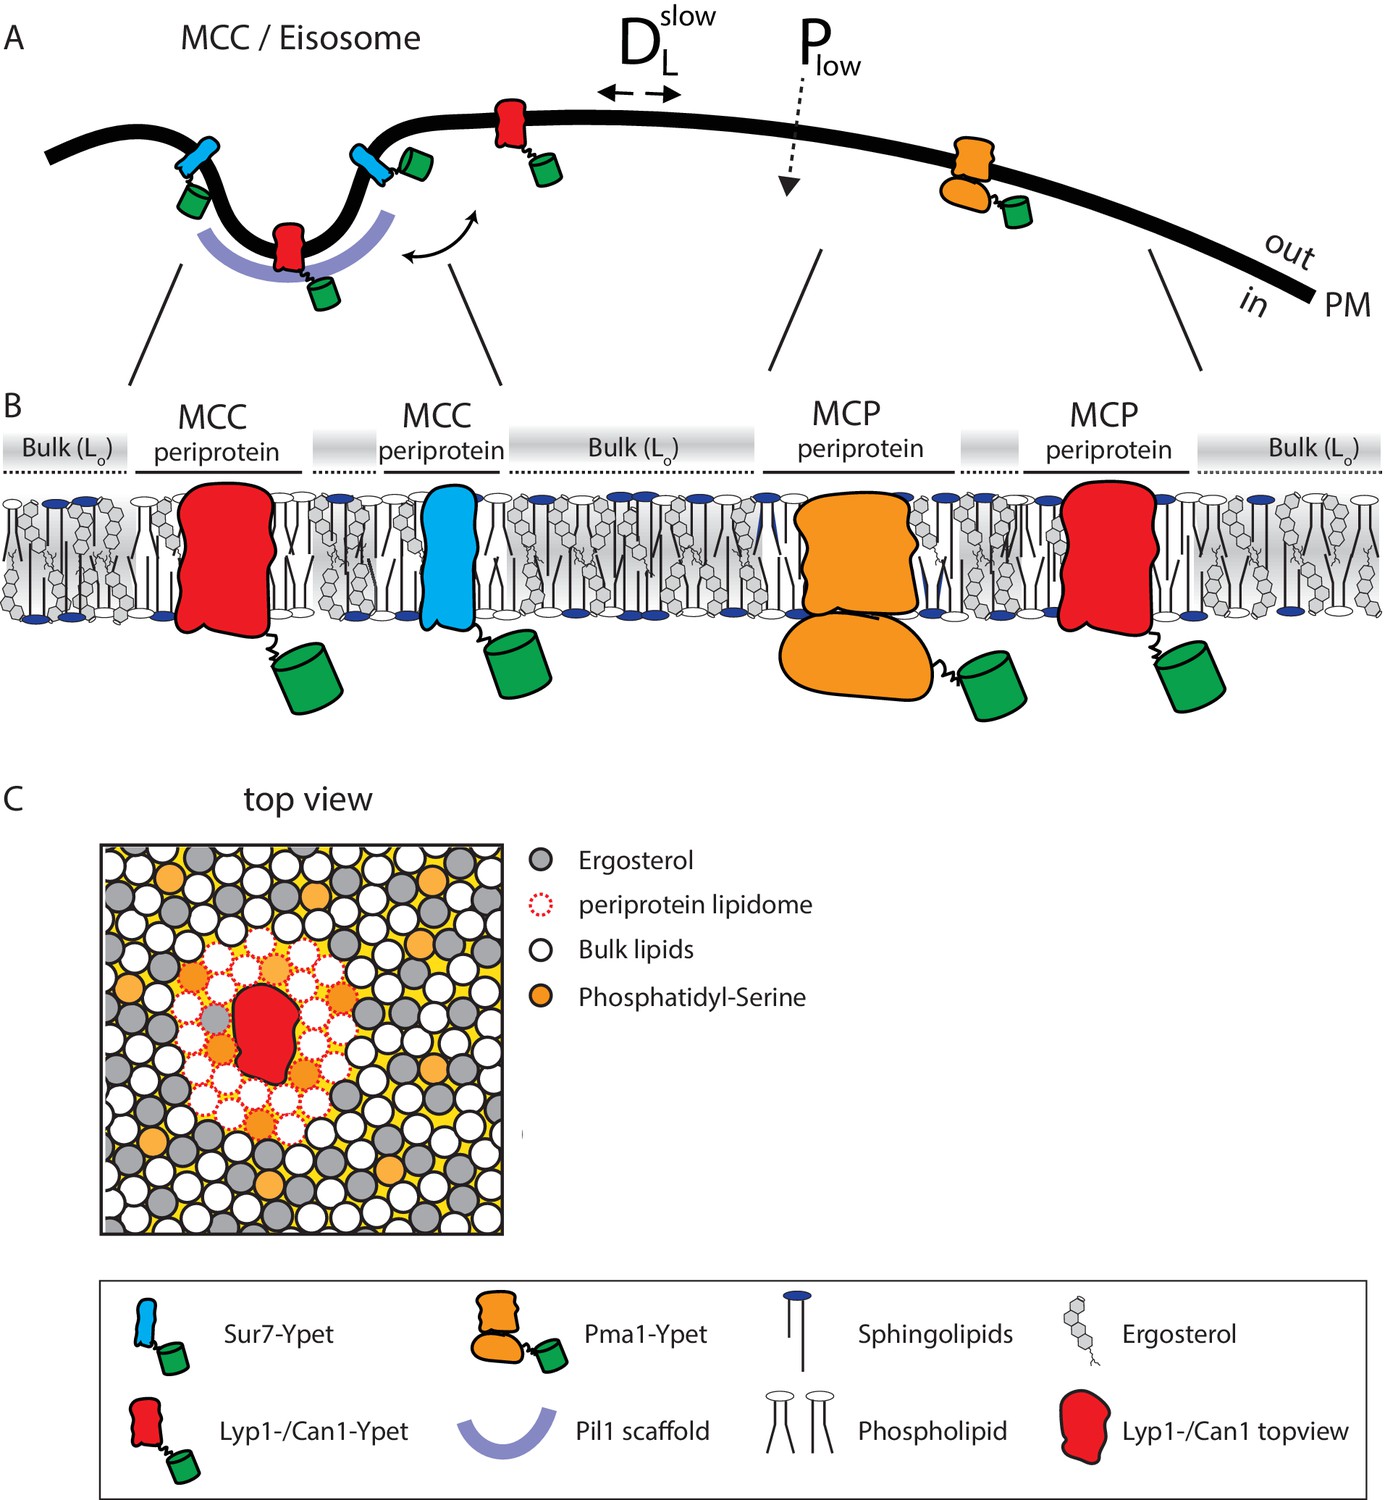
Model of the yeast plasma membrane.
(A) The MCC/Eisosome is stabilized by a scaffold of Pil1 molecules. Sur7 strictly resides at the rim of the MCC/Eisosome, while Lyp1 and Can1 can diffuse in and out. Pma1 cannot enter the MCC/eisosome and resides in the MCP. (B) Schematic representation of the lipid composition of the MCC/Eisosome and the MCP based on the periprotein lipidome detected for Sur7 and Pma1, respectively. Here, phospholipids and ergosterol are similar, but sphingolipids are enriched in the MCP. The Bulk membrane is enriched in ergosterol and represent lipids excluded from the periprotein lipidome. (C) Top view of part of the plasma membrane showing Lyp1 or Can1 enriched in phosphatidylserine and depleted in ergosterol as periprotein lipidome; the proteins surrounded by these periprotein lipidome diffuse very slowly in the bulk of lipids which is in a highly ordered state due to the high fraction of ergosterol. DLslow = slow lateral diffusion of proteins, Plow = low permeability of solutes, Lo = liquid ordered, PM = plasma membrane.
Figure 6
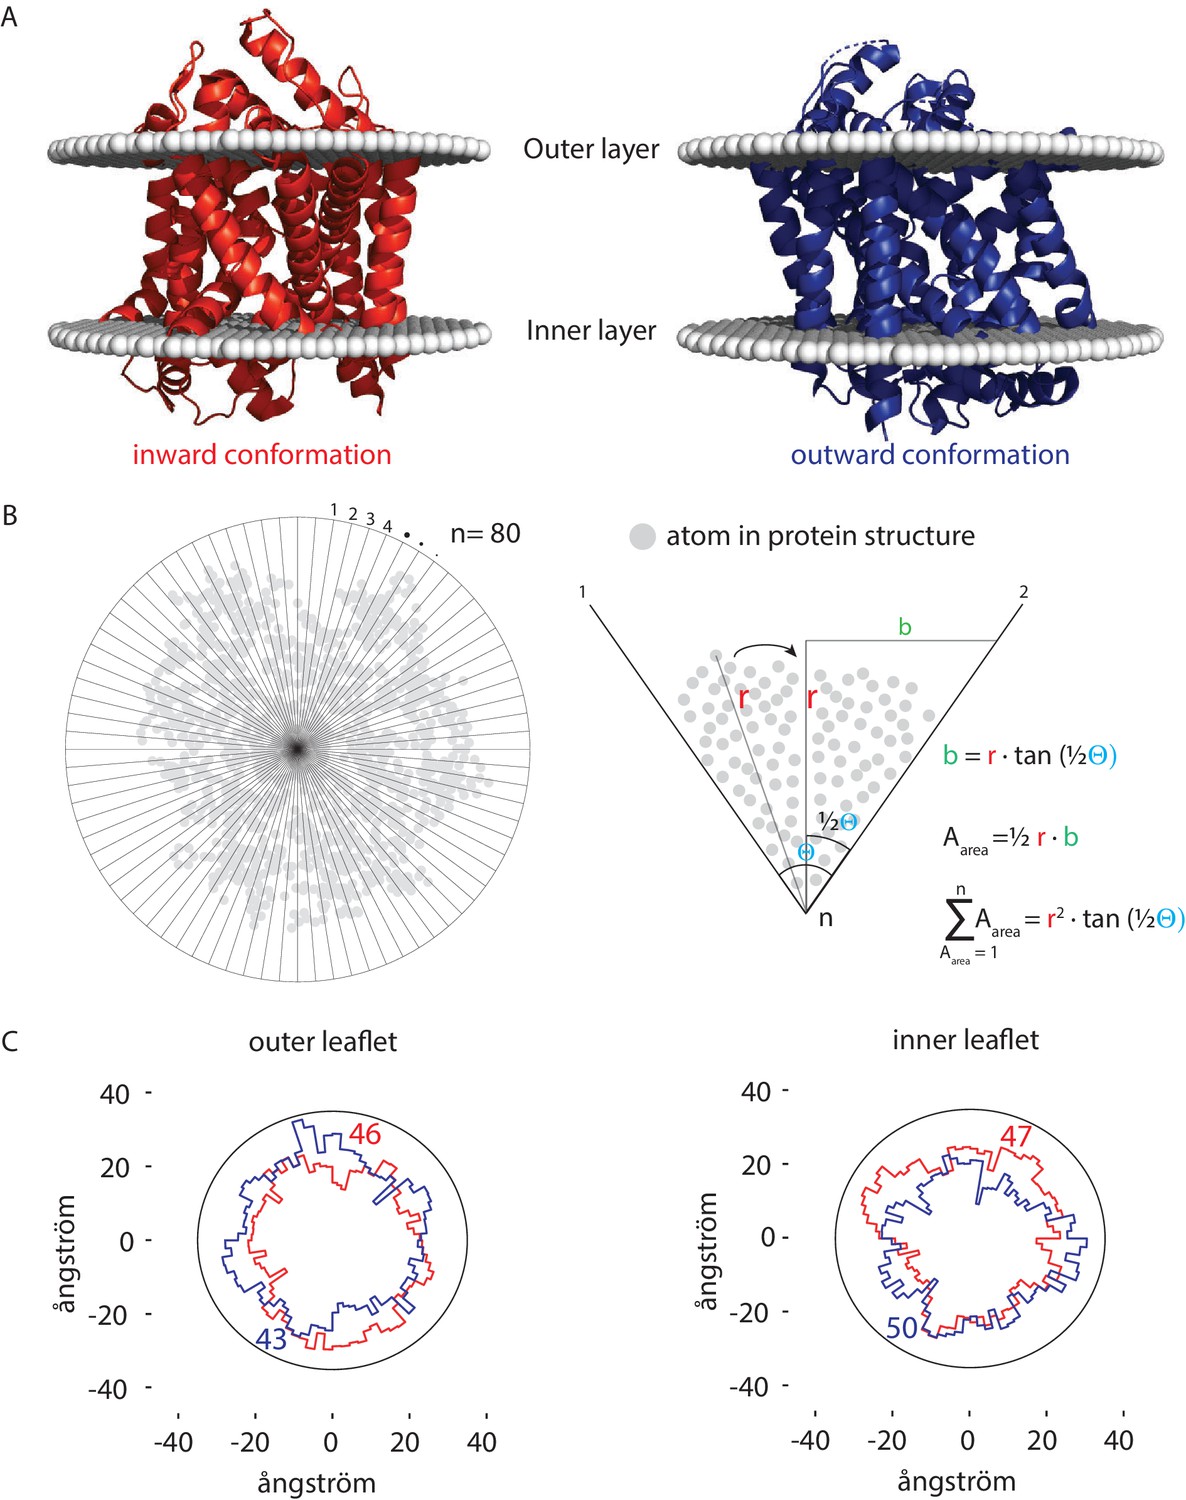
Number of lipids in inner- and outer-leaflet for the inward and outward conformation of LeuT.
(A) X-ray structures of LeuT in the inward (red) and outward conformation (purple) were positioned in a lipid bilayer by the OPM database (Lomize et al., 2012). The OPM database positions proteins in a lipid bilayer by minimizing its transfer energy from water to membrane. (B) Left panel: top view of the protein. Areas at the bilayer-water interface were calculated by numerical integration using equation: . For this, a polar coordinate system from the center of the protein was developed (n = 80), resulting in an angle (θ) of 4.5° between each coordinate. Right panel: details of the analysis. The distance (r) was determined from the most distant atom between two polar coordinates. This distance was applied at ½ θ. From distance r on ½ θ, a perpendicular line was drawn (b), resulting in a right-angled triangle for which the surface area can be calculated using the tangent, ½ θ and r. The area was calculated for each of the 80 polar coordinates and summated to acquire the total surface area of the protein. (C) Shown are top view projections of the area occupied by the inward (red) and outward (purple) conformation of LeuT; both projections were overlaid for the outer leaflet (left) and inner leaflet (right). We have drawn a circle of 70 ångström in diameter, which represents 1–2 lipid shells based on an average area per lipid of 0.471 nm2 (Monje-Galvan and Klauda, 2015). Finally, the number of lipids in the outer- and inner-leaflet were calculated from the difference in surface area of the circle and the protein surface.
Tables
Key resources table
| Reagent type (species) or resource | Designation | Source or reference | Identifiers | Additional information |
|---|---|---|---|---|
| Gene (Saccharomyces cerevisiae) | LYP1 | Uniprot ID 32487 | ||
| Gene (Saccharomyces cerevisiae) | CAN1 | Uniprot ID 04817 | ||
| Gene (Saccharomyces cerevisiae) | PMA1 | Uniprot ID 05030 | ||
| Gene (Saccharomyces cerevisiae) | SUR7 | Uniprot ID 54003 | ||
| Strain, strain background (Saccharomyces cerevisiae) | Y8000 ura3-Δ1 | DOI: 10.1073/pnas.1719462115 | ||
| Strain, strain background (Saccharomyces cerevisiae) | Y8001/Lyp1 MCP | DOI: 10.1073/pnas.1719462115 | ||
| Strain, strain background (Saccharomyces cerevisiae) | Y8001/Lyp1 ura3-Δ1, pJK2001 | DOI: 10.1073/pnas.1719462115 | ||
| Strain, strain background (Saccharomyces cerevisiae) | Y8002/Can1 ura3-Δ1, pJK2002 | DOI: 10.1073/pnas.1719462115 | ||
| Strain, strain background (Saccharomyces cerevisiae) | Y8003/Pma1 ura3-Δ1, pJK2003 | DOI: 10.1073/pnas.1719462115 | ||
| Strain, strain background (Saccharomyces cerevisiae) | Y10001/Lyp1 Sur7p-GBP, Pil1-mCherry, can1-Δ1, gap1-Δ1, ura3-Δ1, pJK2001 | DOI: 10.1073/pnas.1719462115 | ||
| Strain, strain background (Saccharomyces cerevisiae) | Y10002/Can1 Sur7p-GBP, Pil1-mCherry, can1-Δ1, gap1-Δ1, ura3-Δ1, pJK2002 | DOI: 10.1073/pnas.1719462115 | ||
| Strain, strain background (Saccharomyces cerevisiae) | Y5000/Sur7 ura3-Δ1, Sur7p-Ypet | This Paper | Description can be found in section ‘Yeast strains and plasmids’ and in Supplementary file 1. Strain can be obtained from the lab of Bert Poolman. | |
| Recombinant DNA reagent | pJK2001 (plasmid) CEN-ARS, pGal_Lyp1p-Ypet_RGShis10, ura3 | This paper | Lyp1 Fused to Ypet under the control of GAL1 promoter. Description can be found in section ‘Yeast strains and plasmids’ and in Supplementary file 1. Strain can be obtained from the lab of Bert Poolman. | |
| Recombinant DNA reagent | pJK2002 (plasmid) CEN-ARS, pGal_Can1p-Ypet_RGShis10, ura3 | This paper | Can1 Fused to Ypet under the control of GAL1 promoter Description can be found in section ‘Yeast strains and plasmids’ and in Supplementary file 1. Strain can be obtained from the lab of Bert Poolman. | |
| Recombinant DNA reagent | pJK2003 (plasmid) CEN-ARS, pGal_Pma1p-Ypet_RGShis10, ura3 | This paper | Pma1 Fused to Ypet under the control of GAL1 promoter Description can be found in section ‘Yeast strains and plasmids’ and in Supplementary file 1. Strain can be obtained from the lab of Bert Poolman. | |
| Commercial assay or kit | User cloning | NEB, UK | USER enzyme Catalog # M5505S | |
| Other | SMA | Polyscope, NL | Xiran-SZ30010 | Styrene Maleic Acid anhydride polymer |
| Other | Ni-Sepharose resin | GE healthcare, US | Ni sepharose high performance |
Additional files
-
Supplementary file 1
All strains and plasmids used in this study.
- https://cdn.elifesciences.org/articles/57003/elife-57003-supp1-v2.docx
-
Supplementary file 2
Lipids identified by targeted lipidomic analysis.
Based on the ions identified from both SMALP-Pma1 and SMALP-Sur7. Other SMALPs: Lyp1-MCP, Lyp1-MCC, Can1-MCP, and Can1-MCC. Values are expressed as pmol lipid per 10 pmol protein. Chromatography peak areas used in our calculations are given for ergosterol and the sphingolipids IPC and MIPC. Phospho- (PC, PI, PE, PS, PG, PA, CL) and sphingolipids (IPC and MIPC) are reported as negative ions, which were shown in Figure 2D. Ergosterol is reported as a positive ion (protonated).
- https://cdn.elifesciences.org/articles/57003/elife-57003-supp2-v2.docx
-
Transparent reporting form
- https://cdn.elifesciences.org/articles/57003/elife-57003-transrepform-v2.docx
Download links
A two-part list of links to download the article, or parts of the article, in various formats.
Downloads (link to download the article as PDF)
Open citations (links to open the citations from this article in various online reference manager services)
Cite this article (links to download the citations from this article in formats compatible with various reference manager tools)
Periprotein lipidomes of Saccharomyces cerevisiae provide a flexible environment for conformational changes of membrane proteins
eLife 9:e57003.
https://doi.org/10.7554/eLife.57003


