Sleep spindles mediate hippocampal-neocortical coupling during long-duration ripples
- School of Psychology and Centre for Human Brain Health, University of Birmingham, United Kingdom
- Donders Institute for Brain, Cognition and Behaviour, Radboud University Medical Centre, Netherlands
- Department of Epileptology, University of Bonn, Germany
Figures
Figure 1
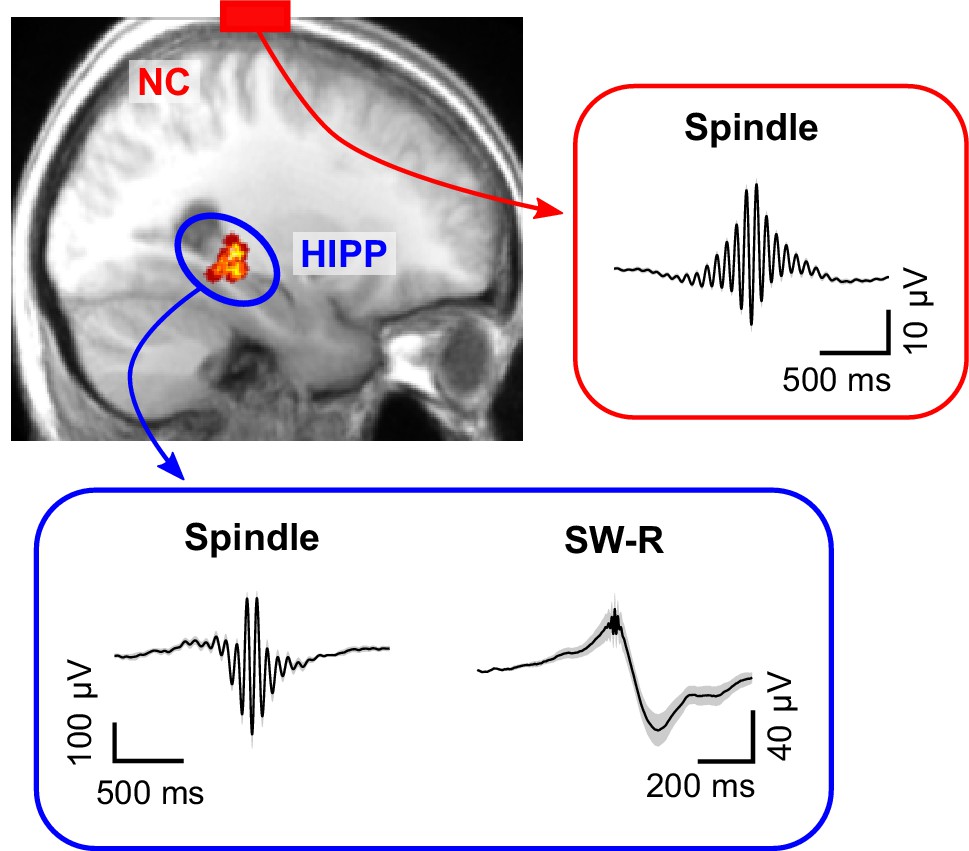
Cortical sleep spindles and hippocampal spindles and SW-Rs.
Top left: heat map illustrating the position of individual contacts across all patients within the hippocampus overlaid on a sagittal slice of the mean structural MRI. Right and bottom insets show the grand average (± SEM) spindle and sharp-wave ripple waveforms across all patients in neocortex (red, NC) and hippocampus (blue, HIPP).
Figure 2 with 1 supplement
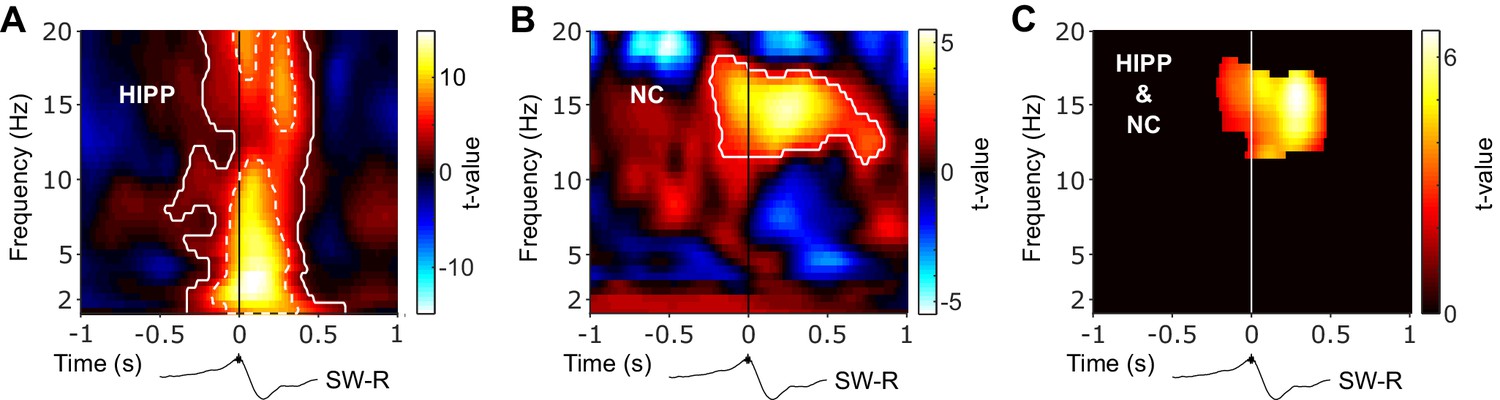
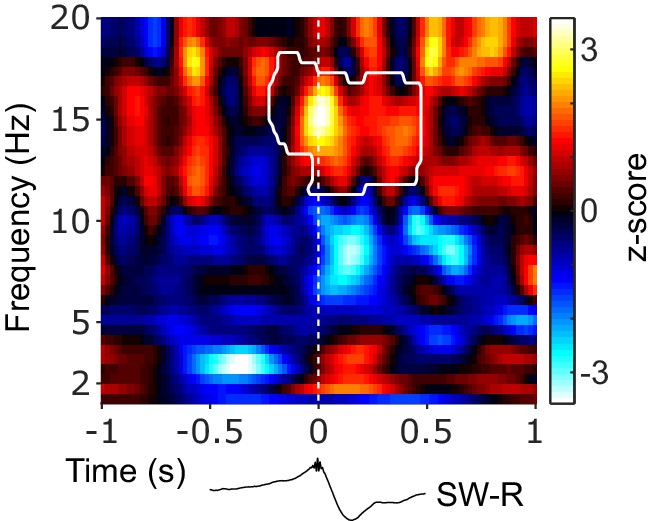
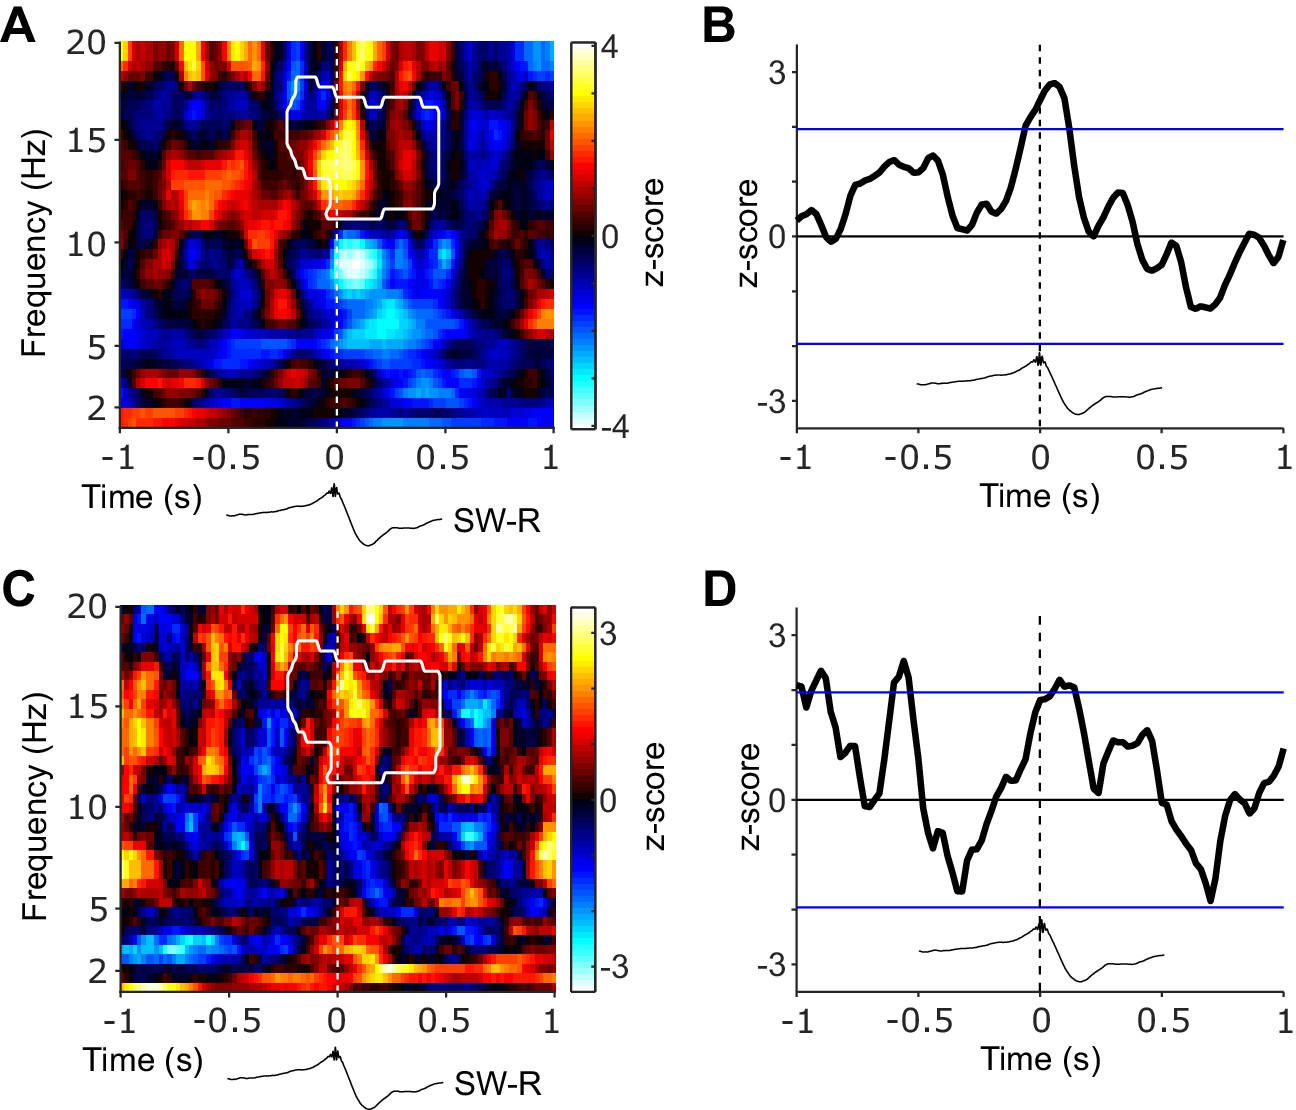
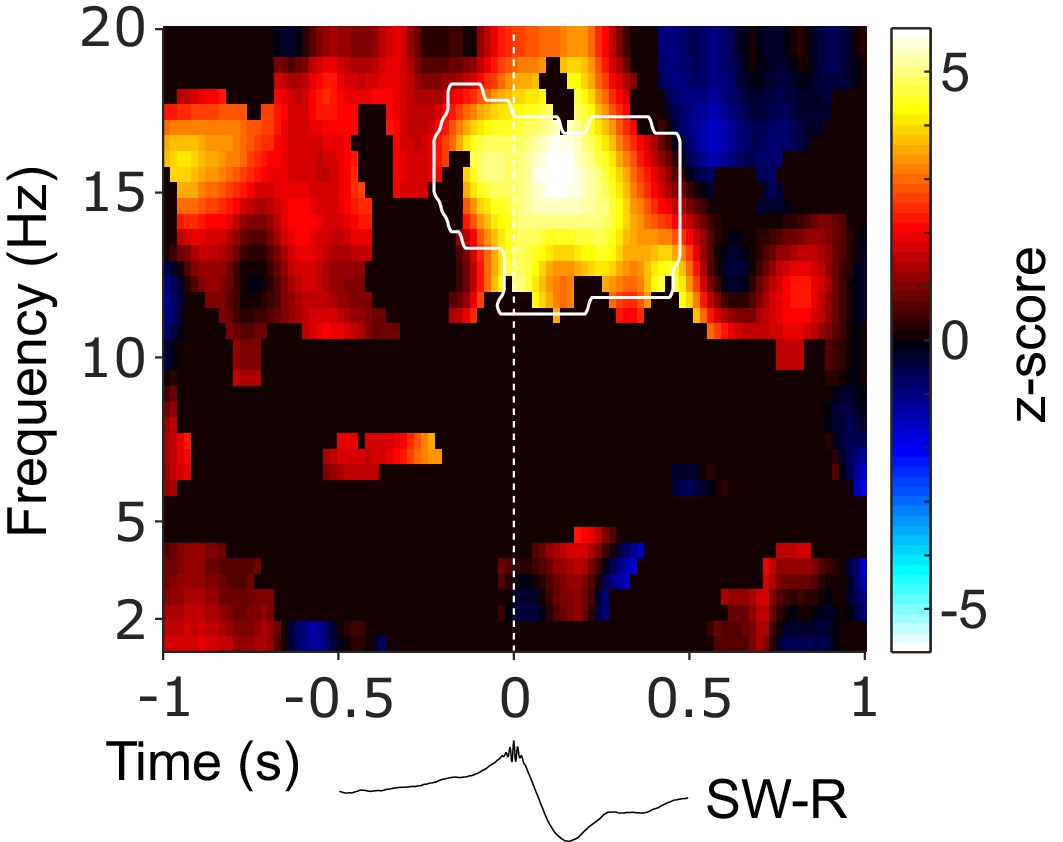
Hippocampal and neocortical spindle activity coincides during SW-Rs.
Statistical maps (t-values) contrasting ripple-locked vs. control TFRs within HIPP (A) and NC (B). Hot colors indicate power increases around SW-Rs, whereas cold colors indicate relative power decreases. White contours mark significant clusters obtained from a cluster-based permutation procedure. (C) Significance mask derived from the overlap of significant clusters between NC and HIPP. Color represents the mean t-value from the corresponding statistical masks. Black traces below TFRs illustrate the timing of power changes relative to SW-Rs. Of note, dashed white contours in (A) represent significant clusters based on a highly conservative statistical threshold (cluster alpha-level α = 10−11) to further illustrate the distinct 3 Hz sharp-wave and 12–20 Hz spindle clusters.
Figure 2—figure supplement 1
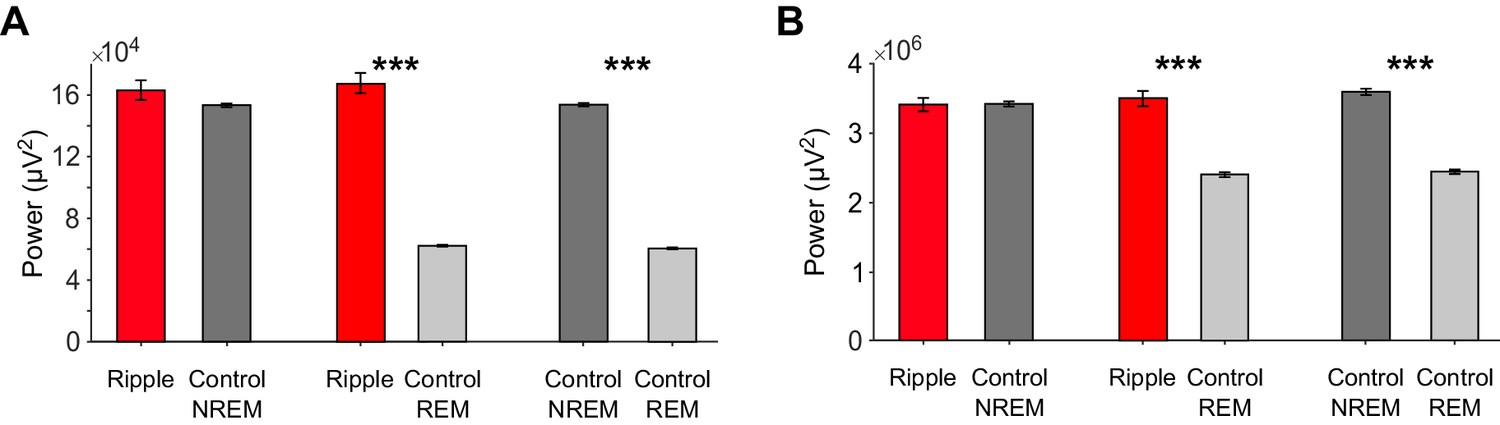
Power in the Slow Oscillation (SO) band.
Mean (± SEM) SO power (1–1.5 Hz) averaged across ±1 s around ripples (red) or across matched control events from NREM (dark gray) or REM (light gray) sleep for NC (A) and HIPP (B). Statistical assessment consisted of three comparisons: ripple-locked SO power vs. NREM control events (left), ripple-locked SO power vs. REM control events (middle) and NREM control events vs. REM control events (right). *** denote significant differences, p<0.001. Results reveal high levels of SO power during NREM sleep relative to REM sleep, with no additional increase around hippocampal ripples.
Figure 3 with 3 supplements
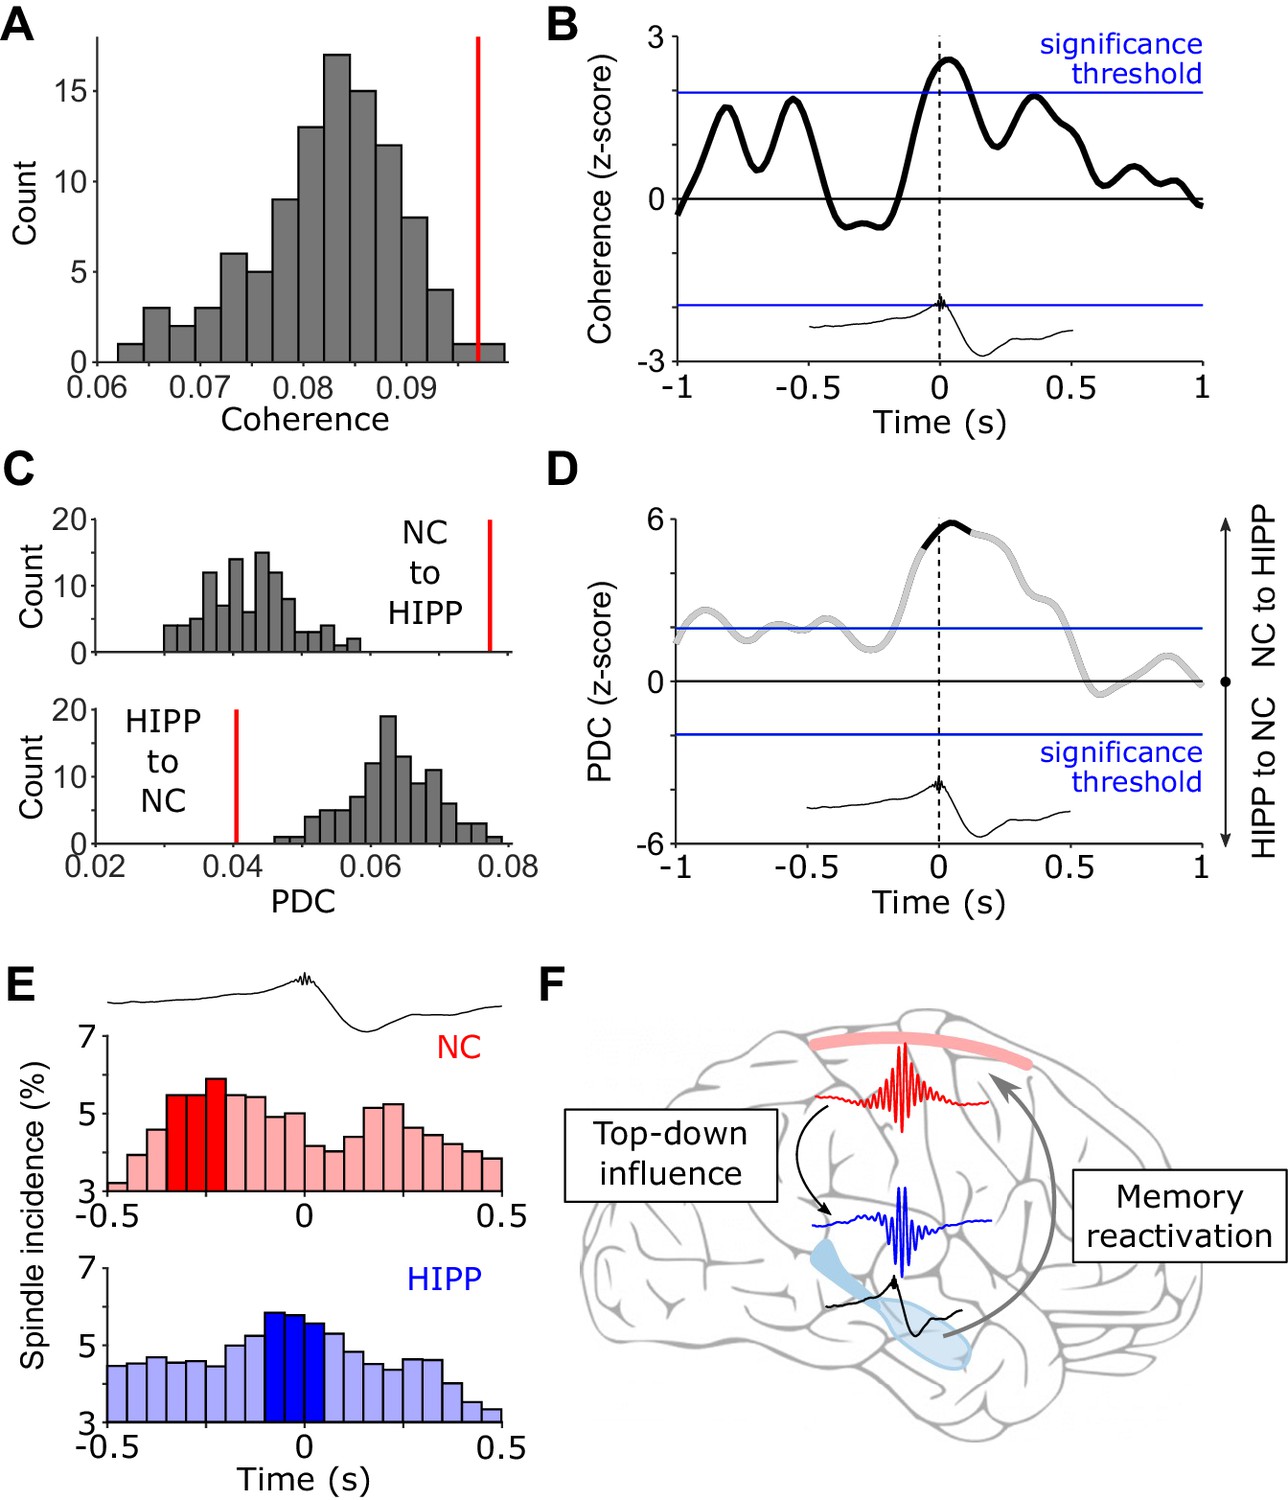
(Directional) Cortical-hippocampal communication via spindles.
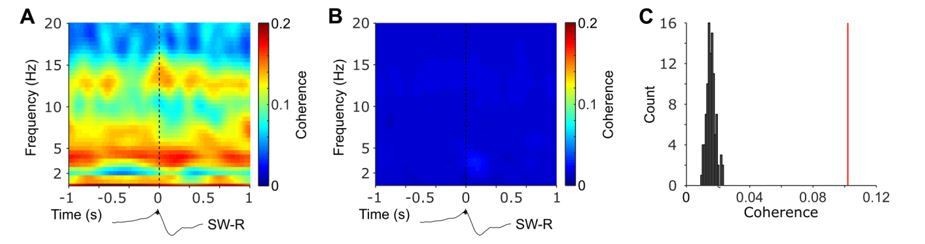
(A) HIPP-NC coherence. The red line depicts the observed coherence between HIPP and NC in the cluster of concurrent increases in spindle power around HIPP SW-Rs (see Figure 2C). Histogram depicts the distribution of individual coherence values for 100 sets of control events. (B) Time-resolved HIPP-NC coherence for the 12–16 Hz spindle range transformed into a z-score with respect to the control events. Blue lines indicate standard significance thresholds (z = 1.96). Time 0 denotes HIPP SW-Rs. (C) Partial directed coherence (PDC). Red vertical lines represent directional influence from NC to HIPP (top) or directional influence from HIPP to NC (bottom) in the cluster of concurrent increases in spindle power around HIPP SW-Rs (Figure 2C). Histograms depict distribution of individual PDC values for 100 sets of control events. (D) Time course of difference between z-transformed NC - > HIPP and HIPP - > NC influence in the 12–16 Hz spindle range. Positive values signify a cortical influence in the 12–16 Hz spindle range on HIPP and vice versa for negative values. Black-colored sections correspond to time intervals with significant spectral coherence shown in (B). Blue lines mark standard significance thresholds (z = 1.96). (E) Peri-event histograms of spindle onsets in NC (top) and HIPP (bottom) within a ± 0.5 s time window around SW-Rs (time = 0 s, top trace). Dark colored bars indicate significant time bins, resulting from comparison with ripple-free control events (z > 1.96). (F) Schematic illustrating the hypothesized spindle-mediated cortical-hippocampal dialogue around SW-Rs: First, sleep spindles mediate a top-down influence from NC to HIPP. In HIPP, sleep spindles in turn coordinate the occurrence of SW-Rs on a fine temporal scale. SW-Rs are linked to the reactivation of relevant memory traces, thought to be distributed to neocortical sites for long-term storage (Klinzing et al., 2019).
Figure 3—figure supplement 1
Mutual cortical-hippocampal connectivity around SW-Rs.
Statistical map (z-scores) contrasting ripple-locked and ripple-free control coherence between NC and HIPP from 1 to 20 Hz and −1 to 1 s around SW-Rs. White contour line outlines the significant cluster of concurrent increase in spindle power in NC and HIPP (Figure 2C). Black trace below illustrates the timing relative to HIPP SW-Rs.
Figure 3—figure supplement 2
Amplitude- and phase-based cortical-hippocampal connectivity.
(A) Statistical map (z-scores) contrasting ripple-locked and ripple-free control connectivity based on the orthogonalized power correlation. White contour line outlines the significant cluster of concurrent increase in spindle power in NC and HIPP (Figure 2C). Black trace below illustrates the timing relative to HIPP SW-Rs. (B) Time-resolved NC-HIPP power correlation for the 12–16 Hz spindle range were transformed into a z-score with respect to the control events. Blue lines indicate standard significance thresholds (z = 1.96). Time 0 denotes HIPP SW-Rs. (C) Statistical map (z-scores) contrasting ripple-locked and ripple-free control connectivity assessed via phase-locking value (PLV). White contour line outlines the significant cluster of concurrent increase in spindle power in NC and HIPP (Figure 2C). Black trace below illustrates the timing relative to HIPP SW-Rs. (D) Time-resolved NC-HIPP PLV for the 12–16 Hz spindle range transformed into a z-score with respect to the control events. Blue lines indicate standard significance thresholds (z = 1.96). Time 0 denotes HIPP SW-Rs.
Figure 3—figure supplement 3
Directed cortical-hippocampal connectivity around SW-Rs.
Statistical map (z-score), masked with positive spectral coherence (Figure 2—figure supplement 1), depicting the difference in PDC between NC->HIPP and HIPP->NC time-locked to ripples in comparison to control events. Hot colors indicate a top-down influence from NC to HIPP, whereas cold colors indicate a reversed directional influence from HIPP to NC. White contour line outlines the significant cluster of concurrent increase in spindle power in NC and HIPP (Figure 2C). Black trace below illustrates the timing relative to HIPP SW-Rs.
Figure 4

Cortical-hippocampal communication is enhanced during long ripples.
(A) Top: histogram of ripple durations pooled across all patients. Red vertical lines indicate the average cut-offs for short (mean ± SEM duration=0.046 ± 0.001 s) and long ripple events (mean ± SEM duration=0.059 ± 0.002 s), based on patient-specific tertiles (short ripples: first tertile; long ripples: third tertile). Bottom: Grand average rippled-locked time-frequency representations (TFRs) as well as example traces (raw and filtered between 80 and 120 Hz) exemplifying short and long ripples. Color bar represents percentage change to a pre-event baseline from −2 to −1.5 s. (B) Statistical maps (t-values vs. control events) for neocortical TFRs (NC) locked to short (left) or long (right) hippocampal ripples. Hot colors indicate power increases around SW-Rs, whereas cold colors indicate relative power decreases. White contours mark significant clusters obtained from a cluster-based permutation procedure (p<0.05, corrected). (C) Time course of partial directed coherence (PDC; z-transformed vs. control events) in the 12–16 Hz spindle range locked to short (gray) and long (black) ripples. Positive values signify a cortical to hippocampal information flow and vice versa for negative values. Blue lines mark standard significance thresholds (z = 1.96; p<0.05).
Author response image 1
Time-frequency resolved NC-HIPP coherence obtained for observed ripple events (A) and after shuffling the corresponding NC-intervals and averaged across 100 realizations (B).
(C) HIPP-NC coherence determined for the cluster of concurrent spindle power around HIPP SW-Rs (see Figure 2). The red line depicts the observed coherence, whereas the histogram depicts the distribution of individual coherence values obtained from the 100 sets of shuffled data.
Tables
Table 1
Sleep architecture.
Mean ± SEM proportion of sleep stages S1, S2, slow wave sleep (SWS) and rapid eye movement (REM) sleep relative to the total time spent asleep.
| Mean | SEM | |
|---|---|---|
| S1 (%) | 22.8 | 4.6 |
| S2 (%) | 44.0 | 3.3 |
| SWS (%) | 16.4 | 2.6 |
| REM (%) | 16.8 | 2.2 |
| Total sleep time (min) | 427.6 | 29.0 |
Table 2
Properties of sleep spindles and sharp-wave ripples.
Patient-specific count and density (events per minute) of algorithmically detected spindles and sharp-wave ripples (SW-Rs) as well as the corresponding mean (± SEM) across participants. Note that event densities reflect number of events relative to artifact-free NREM time, resulting in possibly different densities despite similar event counts.
| Spindle count | Spindle density (per min) | |||||
|---|---|---|---|---|---|---|
| Patient | NC | HIPP | NC | HIPP | SW-R count | SW-R density (per min) |
| 1 | 1440 | 1296 | 6.3 | 6.4 | 135 | 0.7 |
| 2 | 1243 | 571 | 5.5 | 4.3 | 107 | 0.8 |
| 3 | 1703 | 1725 | 5.5 | 5.9 | 116 | 0.4 |
| 4 | 1074 | 978 | 3.0 | 3.1 | 626 | 2.0 |
| 5 | 1427 | 625 | 5.4 | 2.4 | 206 | 0.8 |
| 6 | 1001 | 691 | 4.0 | 3.9 | 153 | 0.9 |
| 7 | 903 | 1975 | 3.3 | 6.7 | 403 | 1.5 |
| 8 | 1004 | 892 | 4.9 | 4.5 | 400 | 2.1 |
| 9 | 2079 | 2038 | 6.2 | 6.0 | 518 | 1.6 |
| 10 | 1120 | 840 | 6.3 | 4.3 | 245 | 1.4 |
| 11 | 494 | 739 | 4.7 | 7.0 | 208 | 2.0 |
| 12 | 448 | 417 | 5.6 | 6.3 | 44 | 0.7 |
| 13 | 1339 | 406 | 5.6 | 2.0 | 45 | 0.2 |
| 14 | 1899 | 1555 | 6.5 | 6.1 | 542 | 2.1 |
| Mean | 1226.7 | 1053.4 | 5.2 | 4.9 | 267.7 | 1.2 |
| SEM | 125.9 | 150.6 | 0.3 | 0.4 | 50.0 | 0.2 |
Table 3
MNI coordinates of the included electrode contacts.
For three patients, no MRI was available.
| MNI coordinates | |||
|---|---|---|---|
| Patient | X | Y | Z |
| 1 | −26 | −29 | -8 |
| 2 | |||
| 3 | |||
| 4 | 26 | −28 | -7 |
| 5 | |||
| 6 | 27 | −29 | -3 |
| 7 | −25 | −28 | 0 |
| 8 | −33 | −33 | -2 |
| 9 | 27 | −31 | -9 |
| 10 | 28 | −35 | -7 |
| 11 | −29 | −38 | -9 |
| 12 | 29 | −31 | 3 |
| 13 | 32 | −30 | -1 |
| 14 | −28 | −34 | -5 |
Additional files
Download links
A two-part list of links to download the article, or parts of the article, in various formats.
Downloads (link to download the article as PDF)
Open citations (links to open the citations from this article in various online reference manager services)
Cite this article (links to download the citations from this article in formats compatible with various reference manager tools)
Sleep spindles mediate hippocampal-neocortical coupling during long-duration ripples
eLife 9:e57011.
https://doi.org/10.7554/eLife.57011


