Antagonistic effects of intraspecific cooperation and interspecific competition on thermal performance
- Biodiversity Research Center, Academia Sinica, Taiwan
- Institute of Ecology and Evolutionary Biology, College of Life Science, National Taiwan University, Taiwan
- Department of Ecology, Evolution and Environmental Biology, Columbia University, United States
- Center for Integrative Animal Behavior, Columbia University, United States
Figures
Figure 1 with 2 supplements
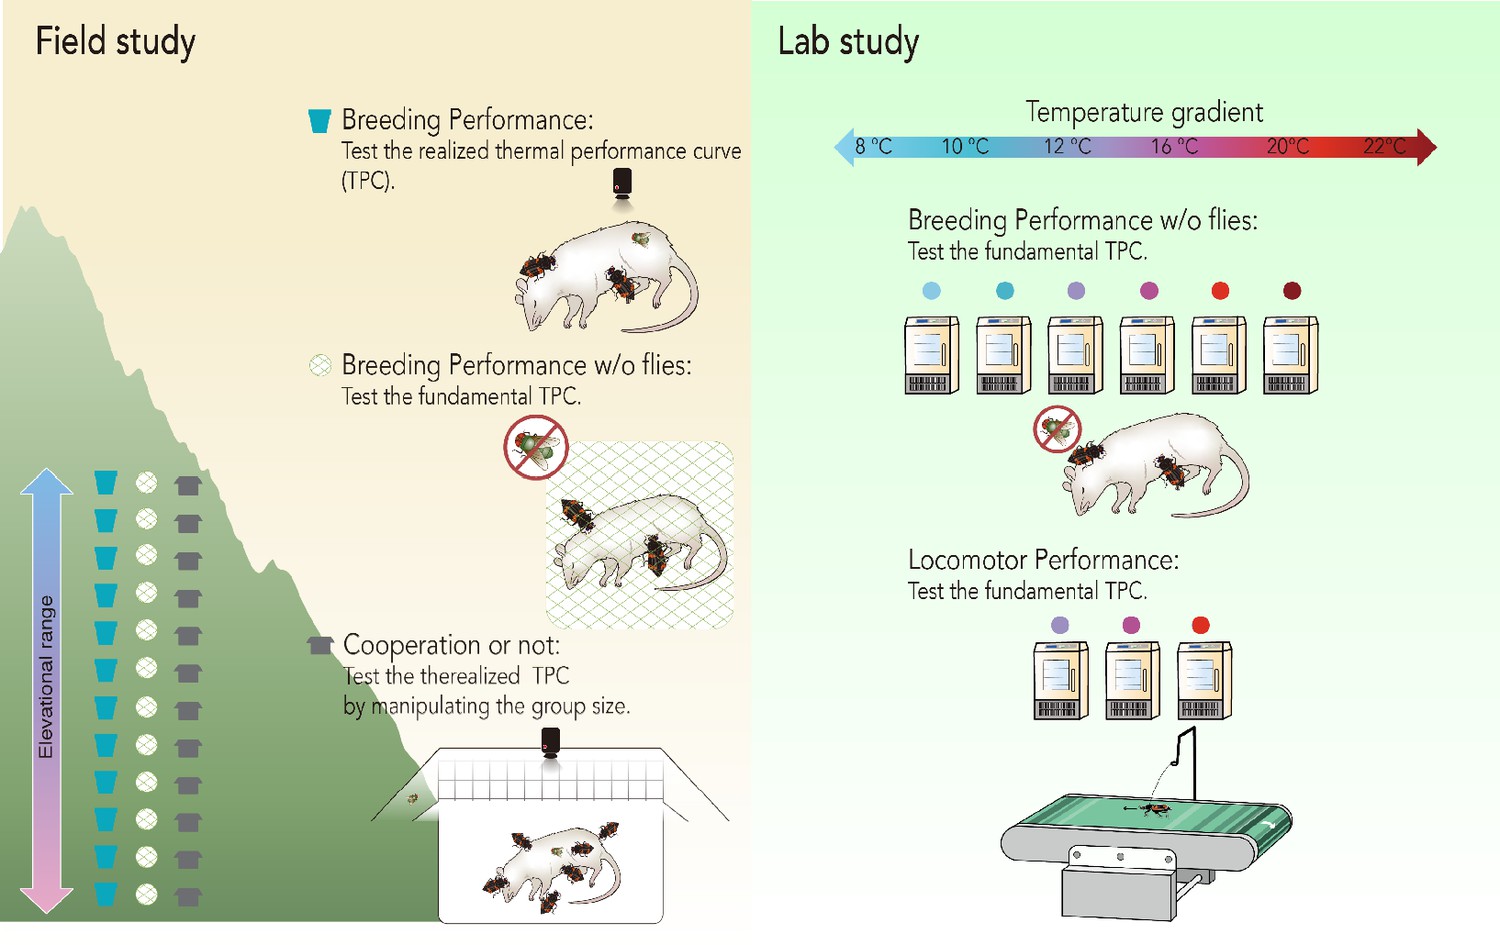
A summary of the experiments used to investigate N. nepalensis’s fundamental and realized thermal performance curves (TPCs).
We examined locomotor and breeding performance in the lab and field without competitors to determine the fundamental TPC. We examined breeding performance in the field in the presence of interspecific competitors to determine the realized TPC. We also manipulated group size in the field to determine how cooperation influenced the realized TPC. The results of these experiments are depicted in Figures 3–5.
Figure 1—figure supplement 1

The relationship between fundamental and realized thermal performance curves between two competing species.
(a) Fundamental and (b) realized thermal performance curves (TPC) when a high temperature specialist species (blue lines) competes with a low temperature generalist species (orange lines). Toptimal represents the optimal temperature of the TPCs, as shown by vertical dashed lines. The horizontal dashed line represents the relative performance of the two species, which are equal to each other.
Figure 1—figure supplement 2
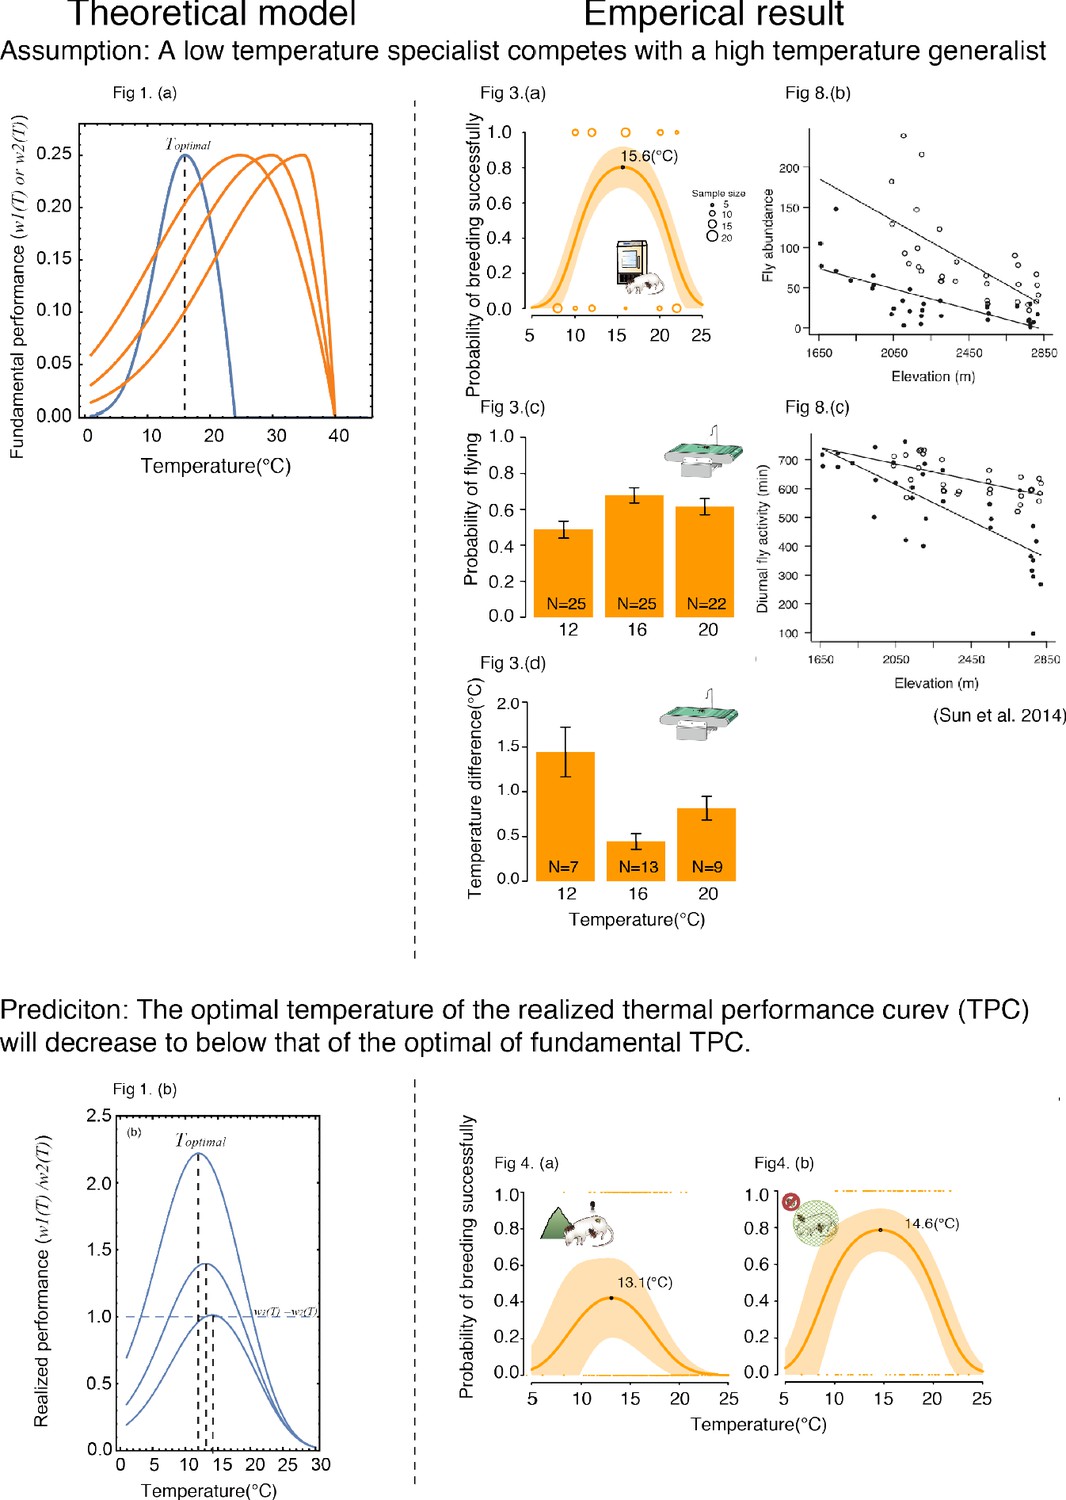
A summary of the theoretical and empirical data.
Figure 2
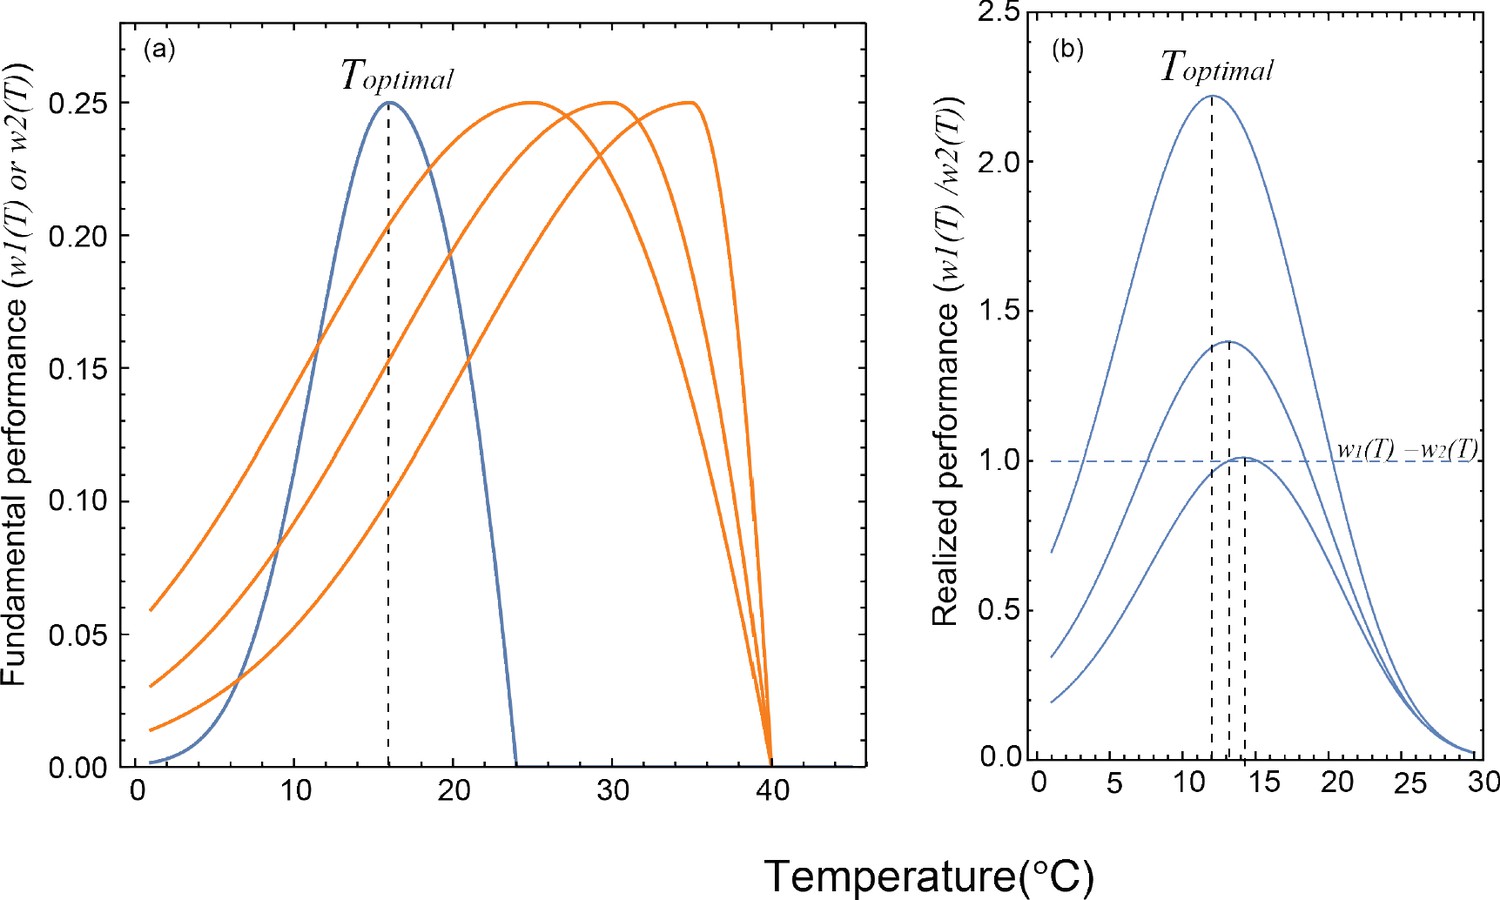
The (a) fundamental thermal performance curves (TPCs) used in the theoretical model to generate (b) the predicted realized TPCs.
Blue lines represent the TPCs of the low temperature specialist species, whereas orange lines depict the high temperature generalist species. Toptimal indicates the optimal temperature of the realized TPCs, as shown by vertical dashed lines. The horizontal dashed line represents the relative performance of the two species, which are equal to each other.
Figure 3
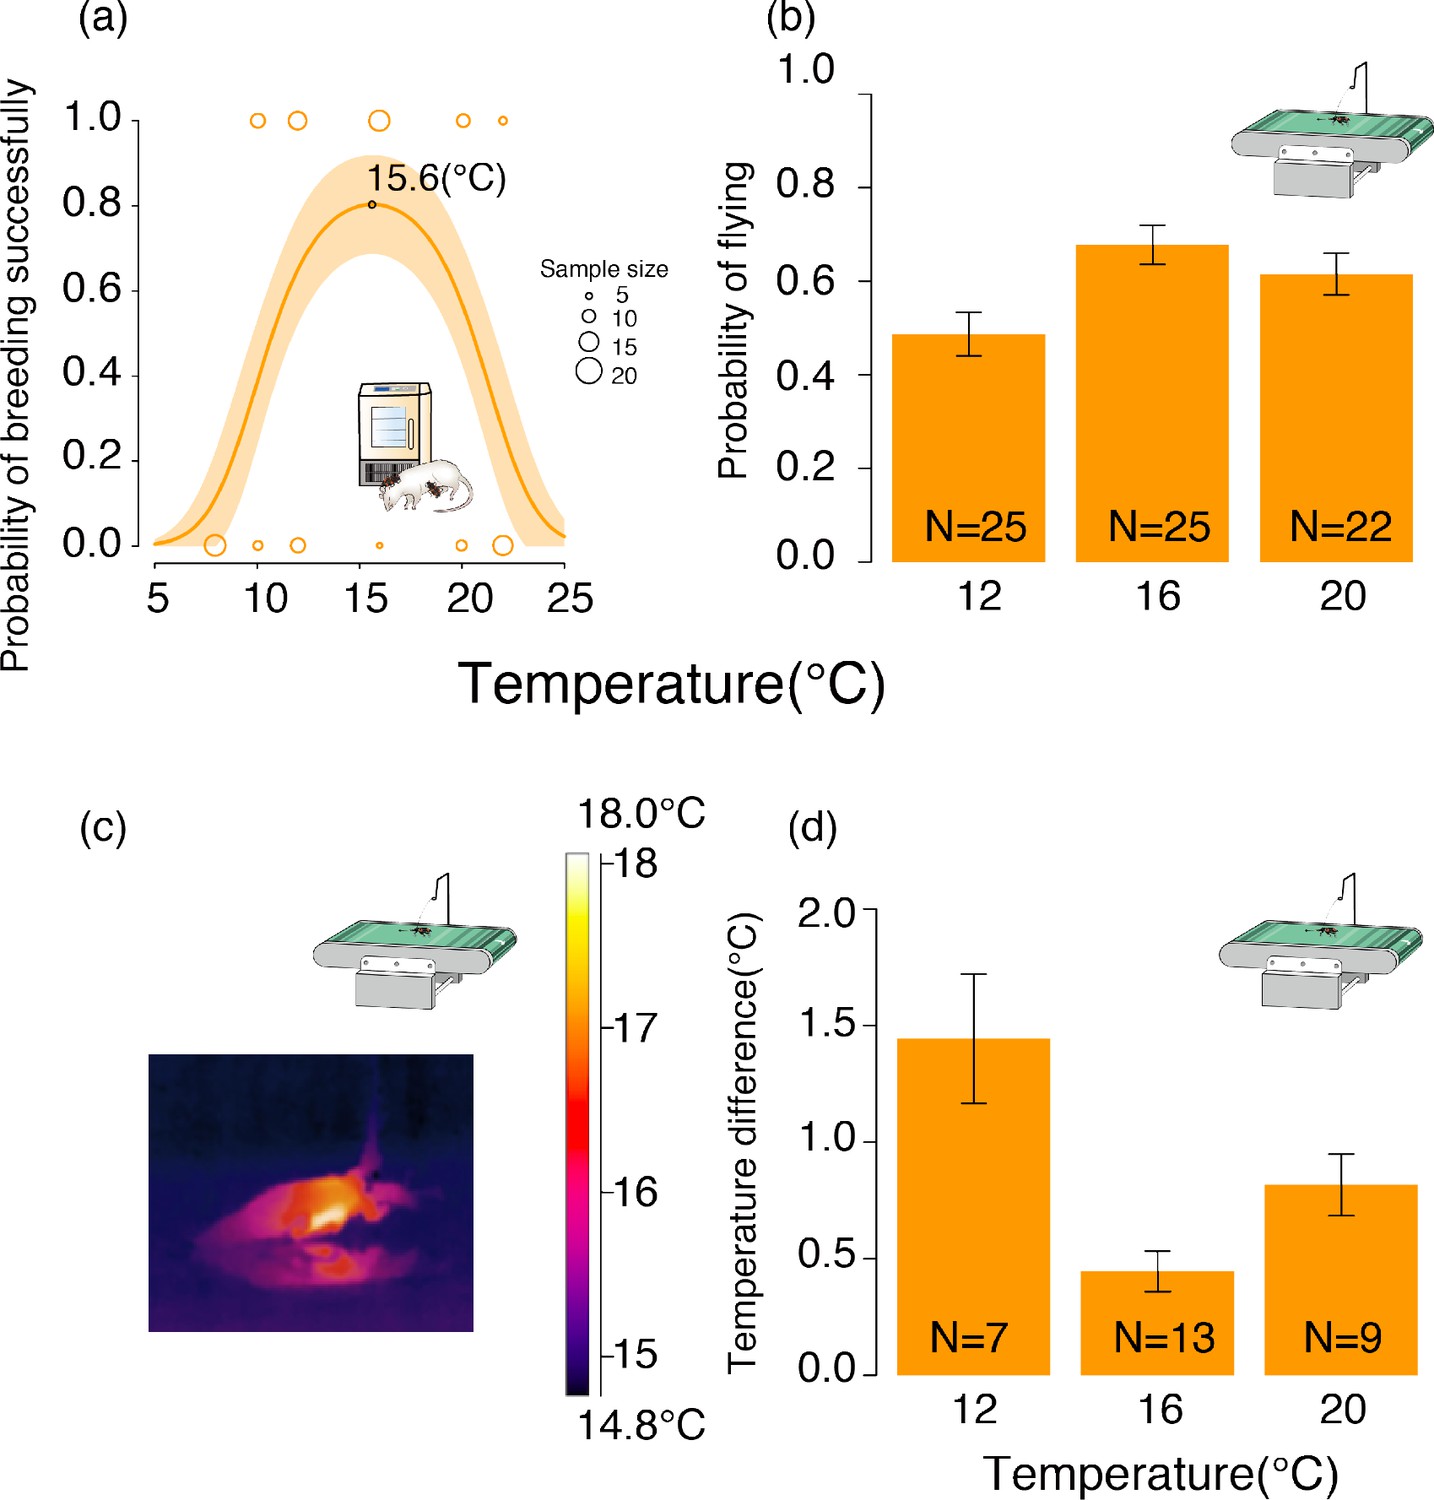
The fundamental thermal performance curve (TPC) of N. nepalensis represented by the relationship between the probability of breeding successfully and temperature in the lab.
(a) The probability of breeding successfully at different temperatures in the lab in the absence of competitors. The shaded orange area depicts the 95% confidence interval. The optimal temperature of the TPC, which is calculated by taking the derivative of the regression line, is indicated (χ²2 = 26.29, p < 0.001, n = 117). (b) The probability of flying in the three different ambient temperature conditions (χ²2 = 13.22, p = 0.001, n = 72) (c) Infrared thermal image of N. nepalensis running on the treadmill, and (d) the temperature difference between the body temperature of beetles that started flying and the ambient temperature in the three temperature conditions while beetles were running on the treadmill at a stable speed of 150 cm/min (χ²2 = 23.18, p < 0.001, n = 29).
Figure 4
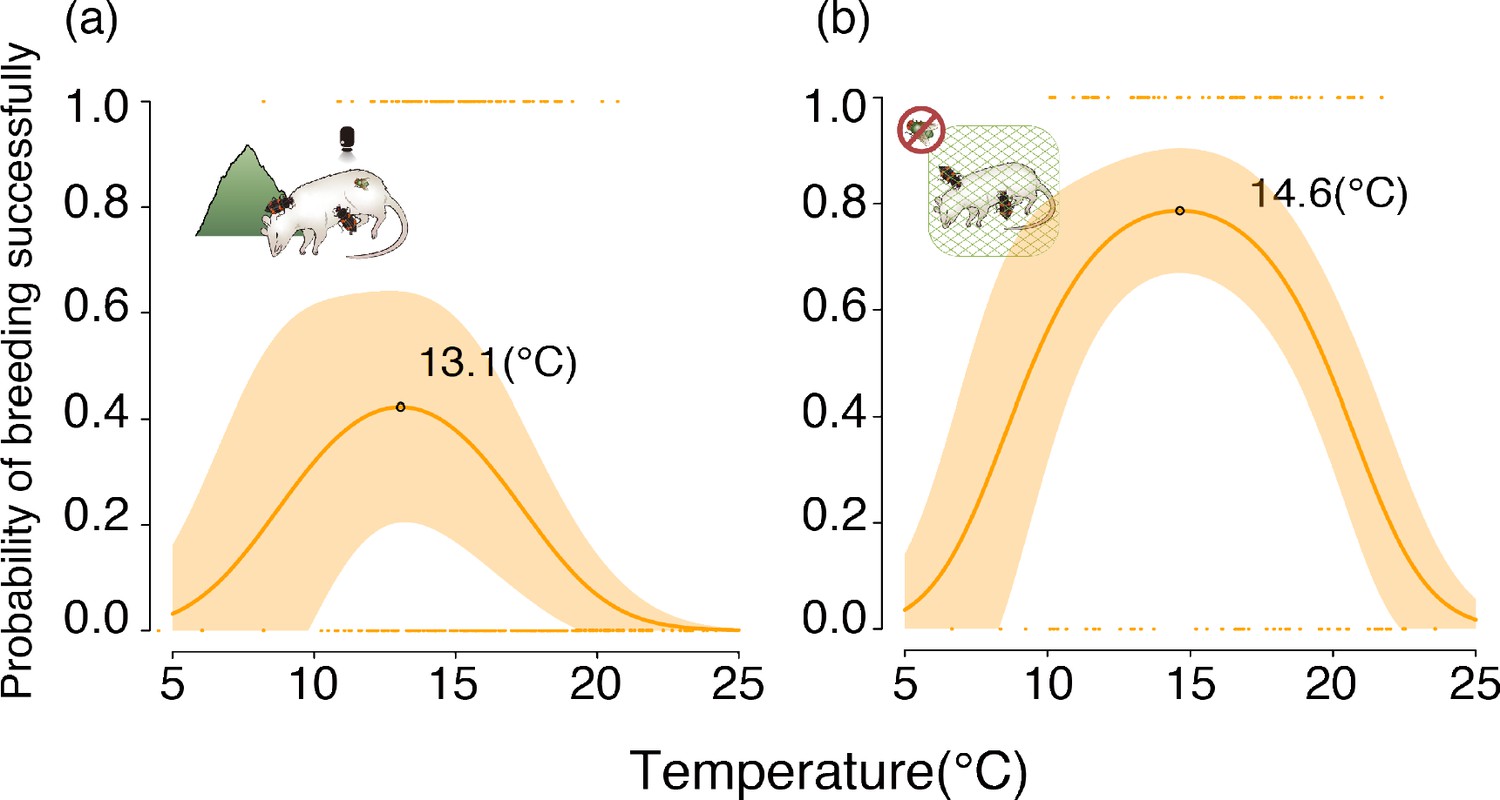
Realized thermal performance curves of N. nepalensis represented by the relationship between the probability of breeding successfully and temperature in the field.
The probability of breeding successfully along the temperature gradient (a) with the potential for interspecific competition (χ²2 = 16.56, p < 0.001, n = 343) and (b) in the absence of interspecific competition. The shaded orange area depicts the 95% confidence interval (χ²2 = 16.08, p < 0.001, n = 175). The optimal temperatures of the TPCs, which were calculated by taking the derivatives of the regression lines, are indicated. Pictures correspond to experiments detailed in Figure 1.
Figure 5

Realized thermal performance curves of N. nepalensis represented by the relationship between the probability of breeding successfully and temperature in the group size treatment (orange circles, orange line) and the solitary control (blue circles, blue line).
The shaded areas depict 95% confidence intervals (group size ×temperature interaction, χ22 = 6.84, p = 0.033, n = 328; for large groups χ22 = 9.40, p = 0.009, n = 162; for small groups, χ22 = 18.42, p < 0.001, n = 166). The optimal temperatures of the TPCs, which were calculated by taking the derivatives of the regression lines, are indicated. Pictures correspond to experiments detailed in Figure 1.
Additional files
-
Source code 1
Statistical source code.
- https://cdn.elifesciences.org/articles/57022/elife-57022-code1-v2.zip
-
Source code 2
Mathematica code of the theoretical model.
- https://cdn.elifesciences.org/articles/57022/elife-57022-code2-v2.zip
-
Transparent reporting form
- https://cdn.elifesciences.org/articles/57022/elife-57022-transrepform-v2.docx
Download links
A two-part list of links to download the article, or parts of the article, in various formats.
Downloads (link to download the article as PDF)
Open citations (links to open the citations from this article in various online reference manager services)
Cite this article (links to download the citations from this article in formats compatible with various reference manager tools)
Antagonistic effects of intraspecific cooperation and interspecific competition on thermal performance
eLife 9:e57022.
https://doi.org/10.7554/eLife.57022


