Dynamic encoding of social threat and spatial context in the hypothalamus
- Epigenetics & Neurobiology Unit, EMBL Rome, European Molecular Biology Laboratory, Italy
- EMBL and Heidelberg University, Faculty of Biosciences, Germany
- Masters Course in Biomedical Engineering, Faculty of Civil and Industrial Engineering, Sapienza University, Italy
Figures
Figure 1 with 2 supplements
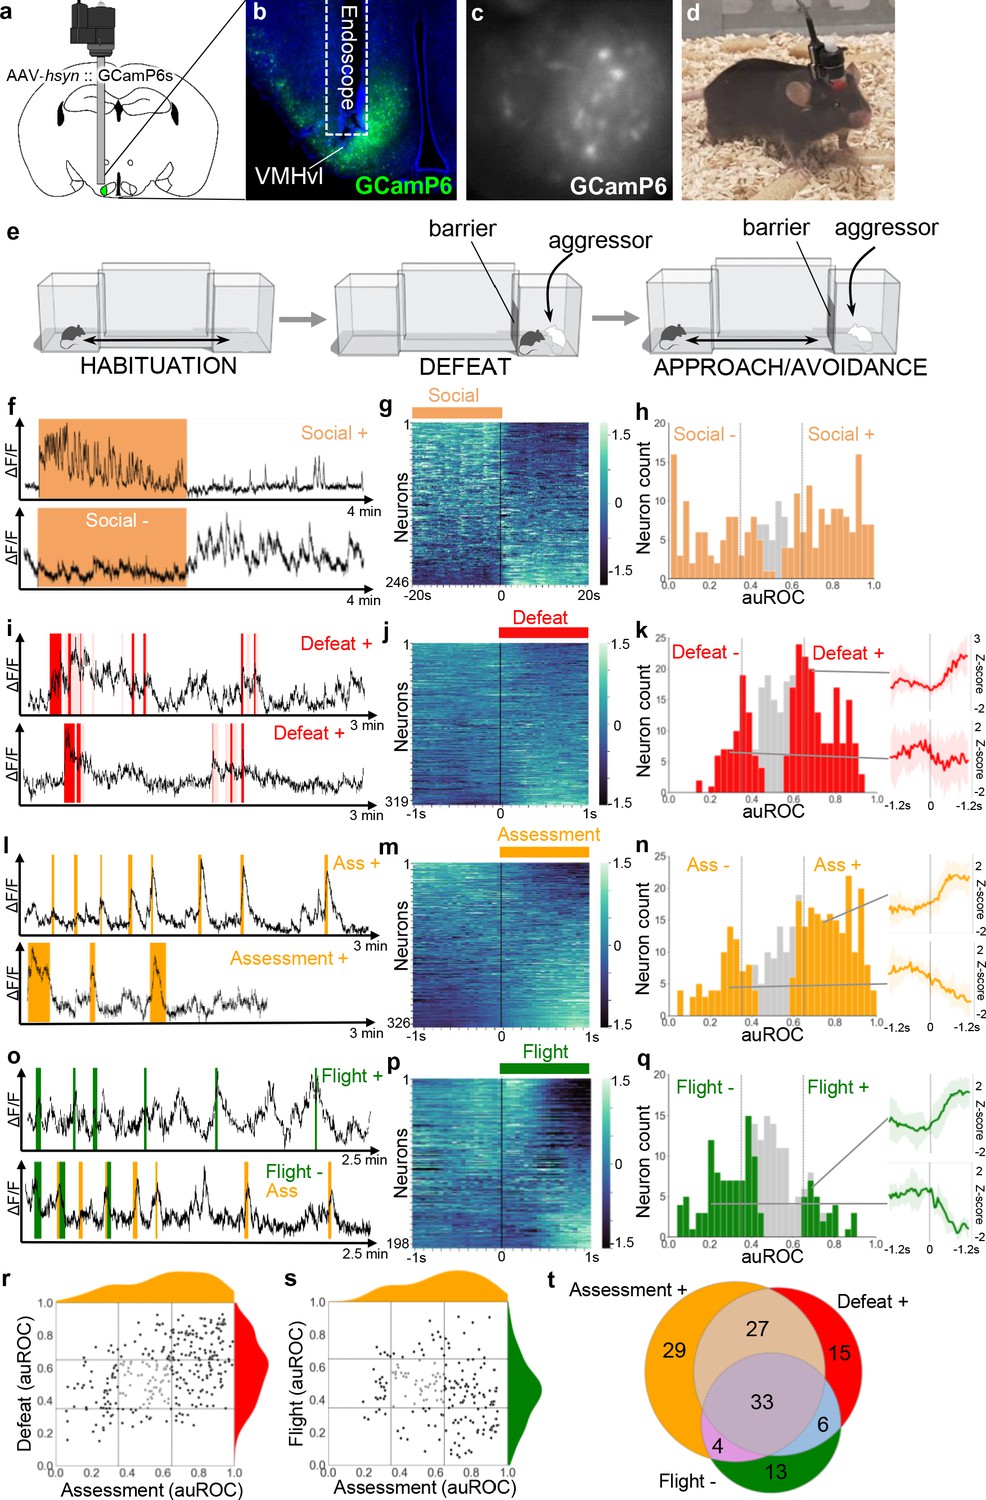
VMHvl encodes social threat.
(a–d) Microendoscopy was used to image single unit calcium activity in VMHvl neurons of awake behaving mice expressing GCaMP6s. (c) Representative processed endoscope image used to extract relative changes in fluorescence (ΔF/F) for putative single neurons. (e, left) Mice were housed in a home chamber for several days during which time they were given access to a corridor and far chamber for 15 min each day. (e, middle) On the defeat day the mouse was enclosed into the far chamber and an aggressor was introduced who repeatedly attacked the mouse. (e, right) Subsequently, the barrier was opened and the defeated mouse exhibited approach and avoidance behavior toward the far chamber. (f, i, l, o) Activity traces of representative neurons showing increased (+) or decreased (-) signal during specific behaviors (color), light red in i represents mixed defense/upright behavior). (g, j, m, p) Summary of activity of all neurons across the onset or offset of each behavior. (h, k, n, q) Histogram of area under the receiver operator curve (auROC) for all neurons with significantly responding neurons indicated in color and average z-score ± SD (N = 5–12) traces of representative significant positive and negative responding neurons shown at right (p<0.05). Vertical lines in histogram indicate high (0.65) and low (0.35) cut-off for scoring positively responding neurons. (r, s) Correlation of neuron auROC scores across behaviors. Distributions are shown outside the axes. (t) Overlap of Defeat+, Assessment+, and Flight- neurons (N = 4) during the subsequent approach-avoidance phase (f–h). Other neurons (79/246, 32%, Social-) showed the opposite pattern, with unaltered or decreased activity during the social defeat phase and increased activity during the approach-avoidance phase (f–h). Although it appeared that Social- neurons might represent two distinct populations, one that decreased and another that remained unchanged during the social defeat phase, it was not possible to statistically distinguish them. A smaller set of neurons showed changes in activity that were time-locked to individual defeat events (117/319, 36%, Defeat+; 36/319, 11%, Defeat-) when the intruder attacked the experimental animal (i–k). These findings are consistent with earlier cFos and bulk calcium imaging studies (Motta et al., 2009; Sakurai et al., 2016; Wang et al., 2019) and confirm that VMHvl is strongly recruited during social defeat.
Figure 1—figure supplement 1
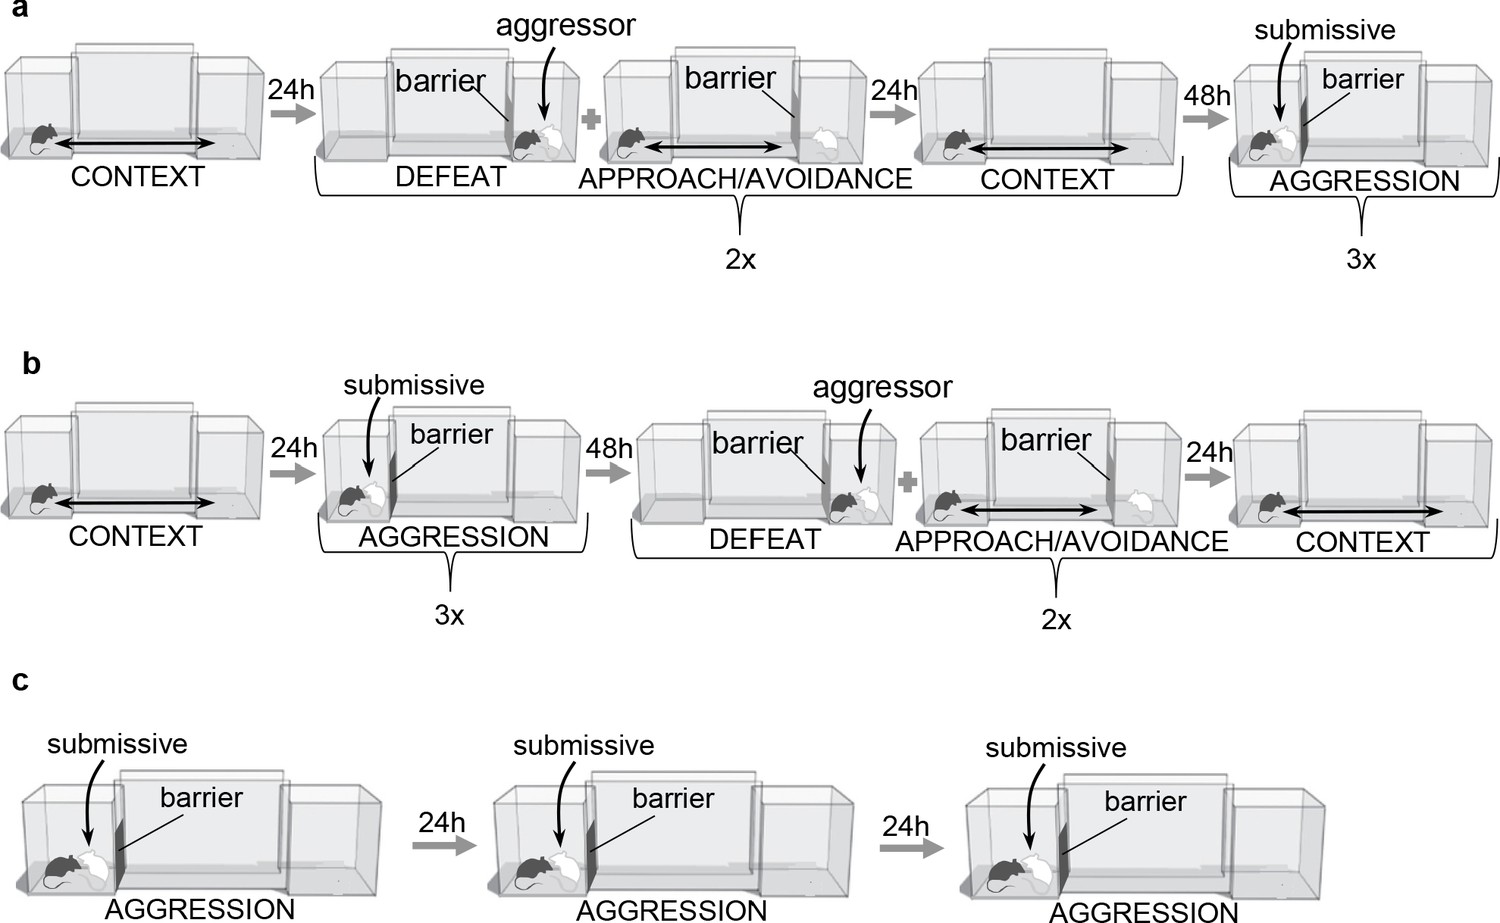
Complete behavioral paradigms.
Graphic depicting complete behavioral paradigm in (a) forward and (b) reverse order. (c) Aggression behavioral paradigm On the aggression day a BALB/c intruder was introduced into closed home chamber for 10 min after which the intruder was removed. Procedure was repeated for three days.
Figure 1—figure supplement 2
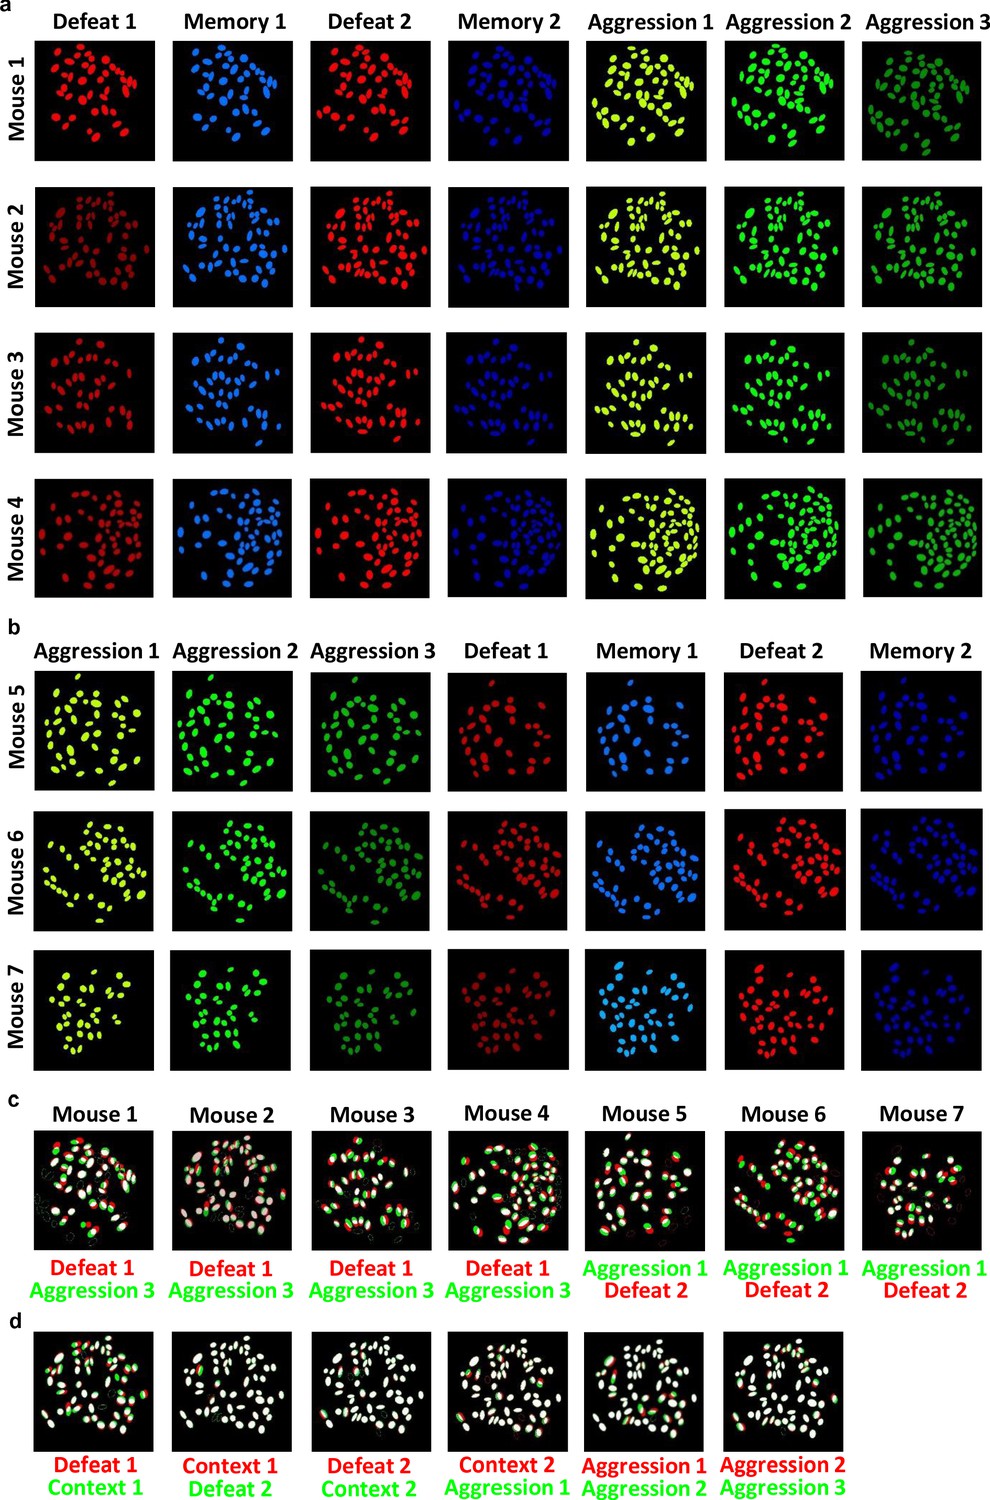
Spatial filter maps from all days of calcium imaging.
(a) Spatial filter maps from all the recording days for defeat-first group. (b) Spatial filter maps from all the recording days for reverse group. (c) Overlap between filters from first and last day of recording for each mouse. (d) Illustration of matching process of spatial filter maps on day-to-day basis for a representative mouse from start to end of recording period.
Figure 2 with 3 supplements

Dynamic encoding of spatial context in VMHvl.
(a) In vivo calcium endoscopy was carried out in mice subjected to (left, middle) social defeat and then exposed again to (right) the defeat context one day later. (b, e) Activity traces of representative neurons showing increased (+) signal when the mouse enters the far or home chamber (dark color) or its immediately adjacent part of the corridor (light color). (c, f) Summary of activity of all neurons across the transition into the far or home chamber. (d, g) Histogram of area under the receiver operator curve for all neurons with significantly responding neurons indicated in color and average z-score traces ± SD (N = 9–10) of representative significant positive and negative responding neurons shown at right (p<0.05). Vertical lines in histogram indicate high (0.65) and low (0.35) cut-off for scoring positively responding neurons. (h–k) Correlation of neuron auROC scores between chambers and/or behavior. Distributions are shown outside the axes. (l, o) Overlap of Far chamber+, Home+, Assessment+, and Defeat+ neurons (N = 7). (m, p) LDA plot of neuron ensemble activity for a representative mouse in the home, far chamber, or corridor. Each data point represents a frame of calcium imaging data projected onto the first two linear discriminants. (n, q) Average distances between clusters of frames representing neuron ensemble activity for all mice (*p<0.05, **p<0.01, pre vs post - > F hr distance p=0.0075, t = 2.997, df = 9; F-C distance: p=0.005, t = 3.252, df = 9, H-C distance: p=0.037, t = 2.0213, df = 9). (r–u) Histograms of area under the receiver operator curve for all neurons with significantly responding neurons indicated in color. Vertical lines indicate high (0.65) and low (0.35) cut-off for scoring positively responding neurons. (m, n, r, t) Habituation phase before social defeat, and (p, q, s, u) context phase after social defeat (N = 4).
Figure 2—figure supplement 1
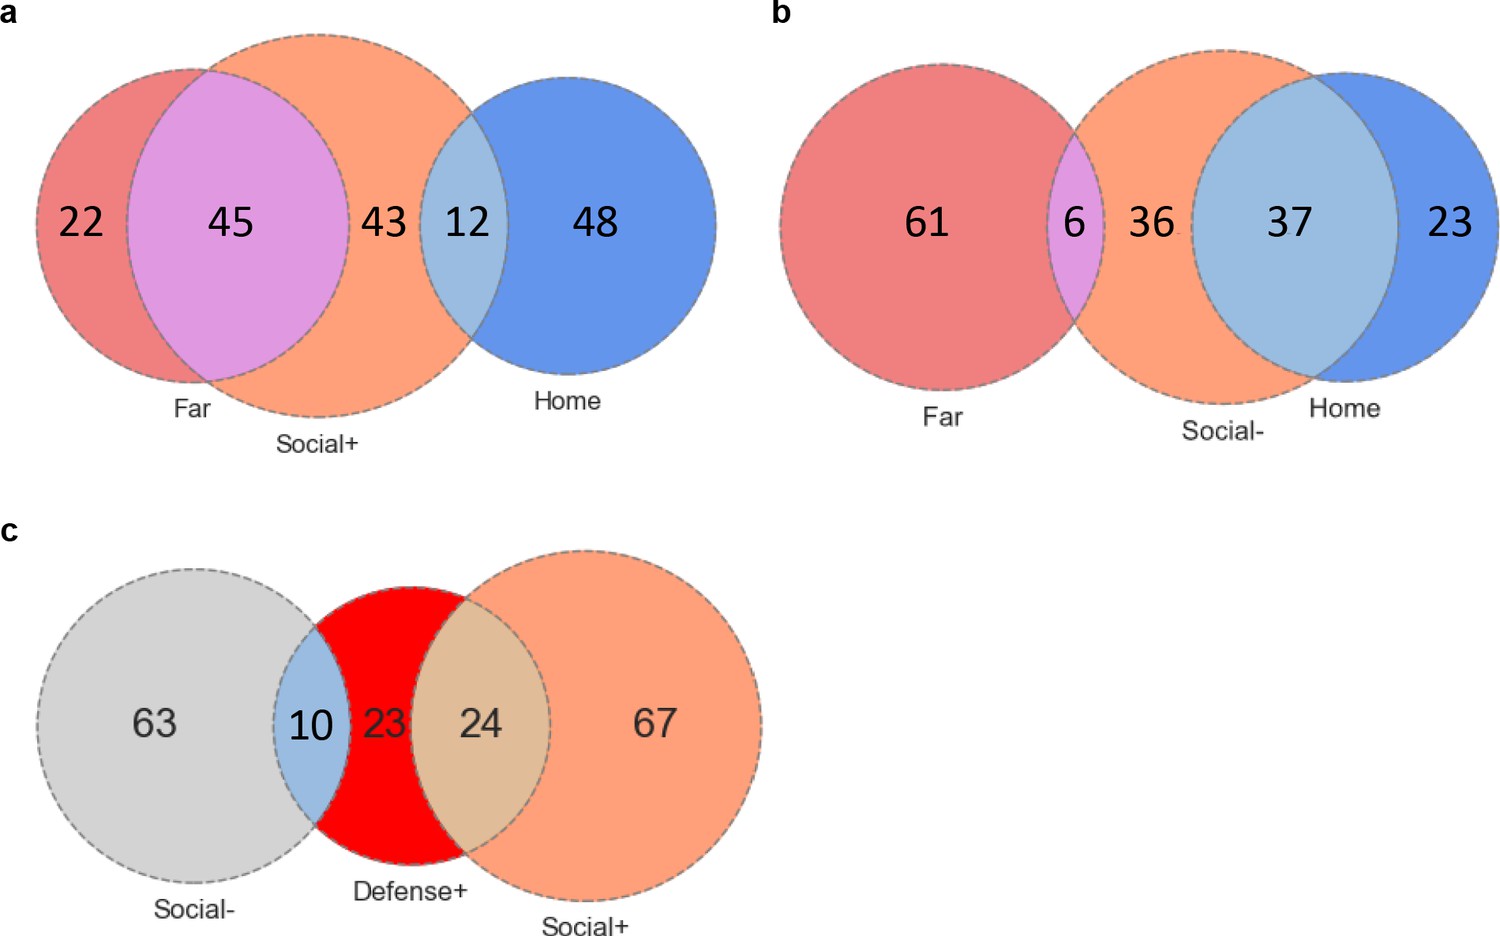
Overlap between social neurons.
Venn diagrams showing overlap between: (a) Social+, home+ and far-chamber+ neurons, (b) Social-, home+ and far-chamber+ neurons, (c) Social+, social- and defense+ neurons.
Figure 2—figure supplement 2
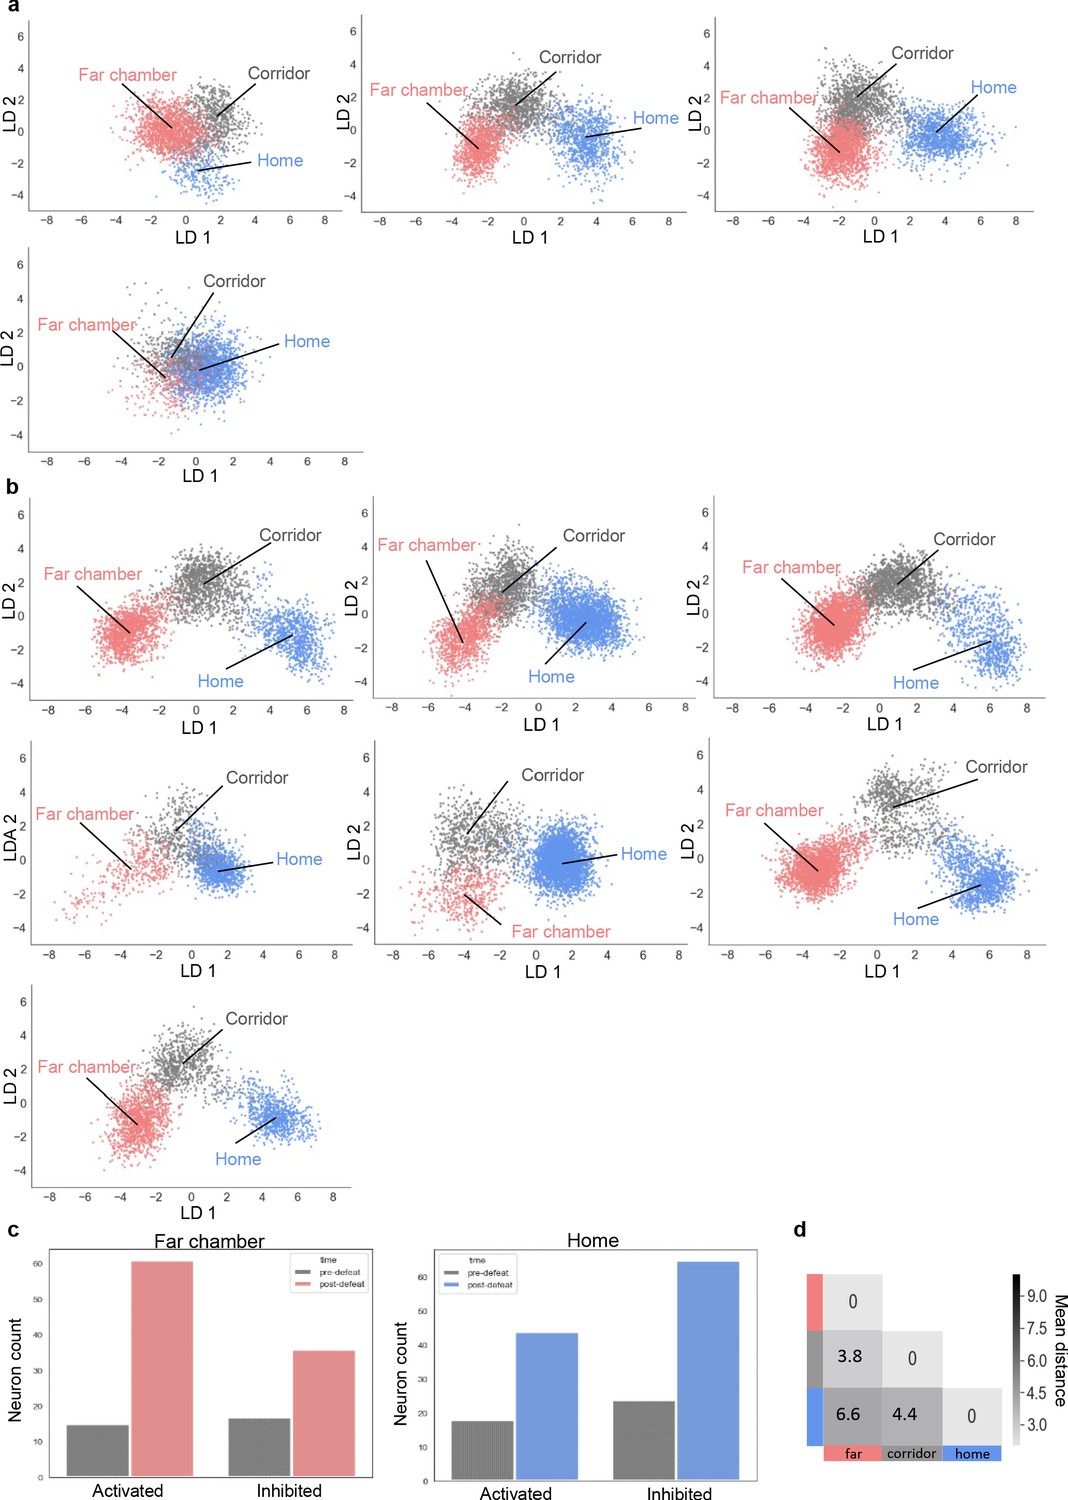
Representation of territory before and after defeat for all mice.
(a–b) LDA plots of neuron ensemble activity for all mice in the home, far chamber, or corridor (a) before defeat (b) after defeat. Note that data for the first mouse in panel a and b is the same as in Figure 2m and Figure 2p respectively. Each data point represents a frame of calcium imaging data projected onto the first two linear discriminants. (c) Bar plots showing the number of positive (Activated) and negative (Inhibited) responding (0.35 > auROC > 0.65) neurons in the far chamber and home chamber before and after defeat (N = 4). (d) Average distances between clusters of neuron ensemble data between home, corridor and far-chamber for Esr1+ mice (N = 2; colors refer to episodes in a).
Figure 2—figure supplement 3
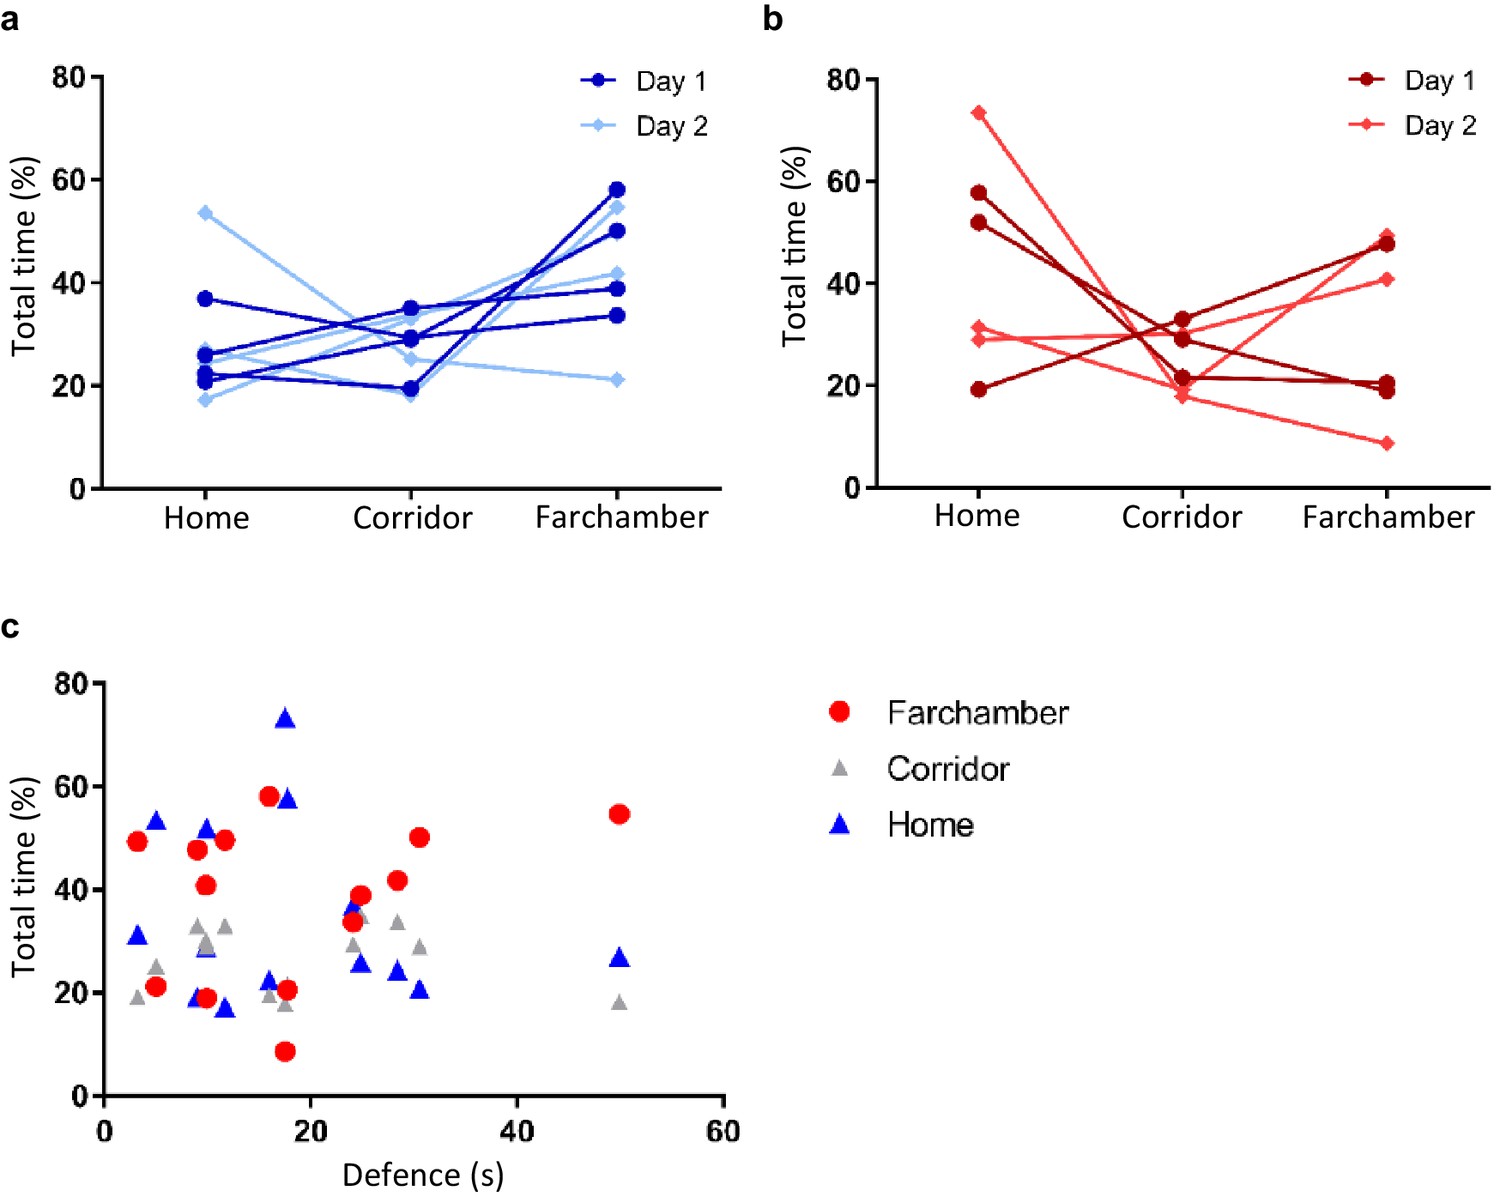
Comparison of time spent in different chambers during memory day.
(a) Plot showing time spent in different chambers by defeat-first group on both context days. (b) Plot showing time spent in different chambers by reverse group on both context days. (c) Plot showing no correlation between defense time and time spent in any of the chambers (spearman r: defense vs far-chamber r = 0.1956, p>0.05; defense vs home r = −0156, p>0.05; defense vs corridor r = 0.0418, p>0.05).
Figure 3
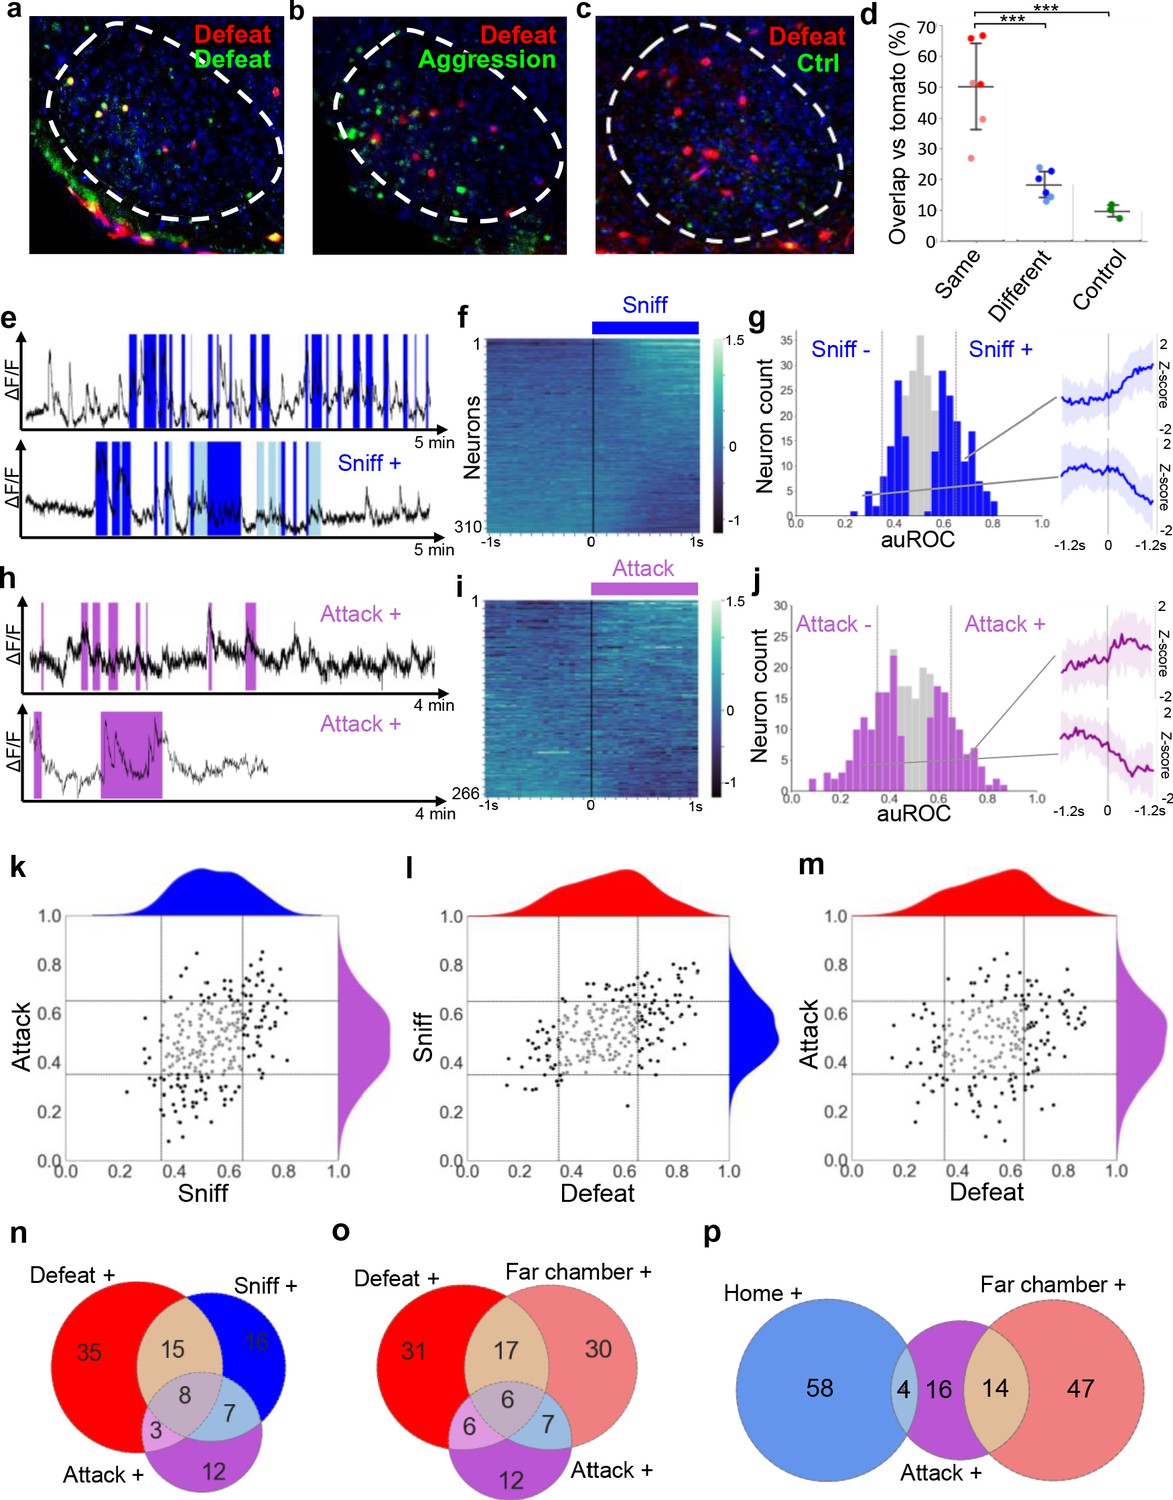
Overlapping encoding of social defense and aggression.
(a–c) Representative images of cFos-tagged (red) and cFos-immunolabeled (green), and double labelled (yellow) cells in brain sections from mice subjected sequentially to social defeat and aggression in a counterbalanced manner. (d) Average percentage overlap of defeat and aggression recruited cFos+ cells as revealed by the difference between cFos+ overlap for same, different, or control behaviors (dark red: Defeat-Defeat, dark blue: Defeat-Aggression, green: Defeat-Control; light red: Aggression-Aggression, light blue: Aggression-Defeat; Same vs. Different, p=0.0005 N=6; Same vs. Control, p=0.0004, N = 3–6; Different vs. Control, p=0.4969, N = 3–6, F = 20.889; bars represent SD). (e, h) Activity traces of representative neurons showing increased (+) signal during close social investigation (Sniff+, dark blue; ano-genital sniffing, light blue) and aggression (Attack+). (f, i) Summary of activity of all neurons across the onset of behavior. (g, j) Histogram of area under the receiver operator curve for all neurons with significantly responding neurons indicated in color and average z-score traces ± SD (N = 22–34) of representative significant positive and negative responding neurons shown at right (p<0.05). Vertical lines in histogram indicate high (0.65) and low (0.35) cut-off for scoring positively responding neurons. (k–m) Correlation of neuron auROC scores among aggression behaviors and between aggression and defense behaviors. Distributions are shown outside the axes. (n–p) Overlap of aggression, defense, and territory-related neurons (N = 5).
Figure 4 with 3 supplements
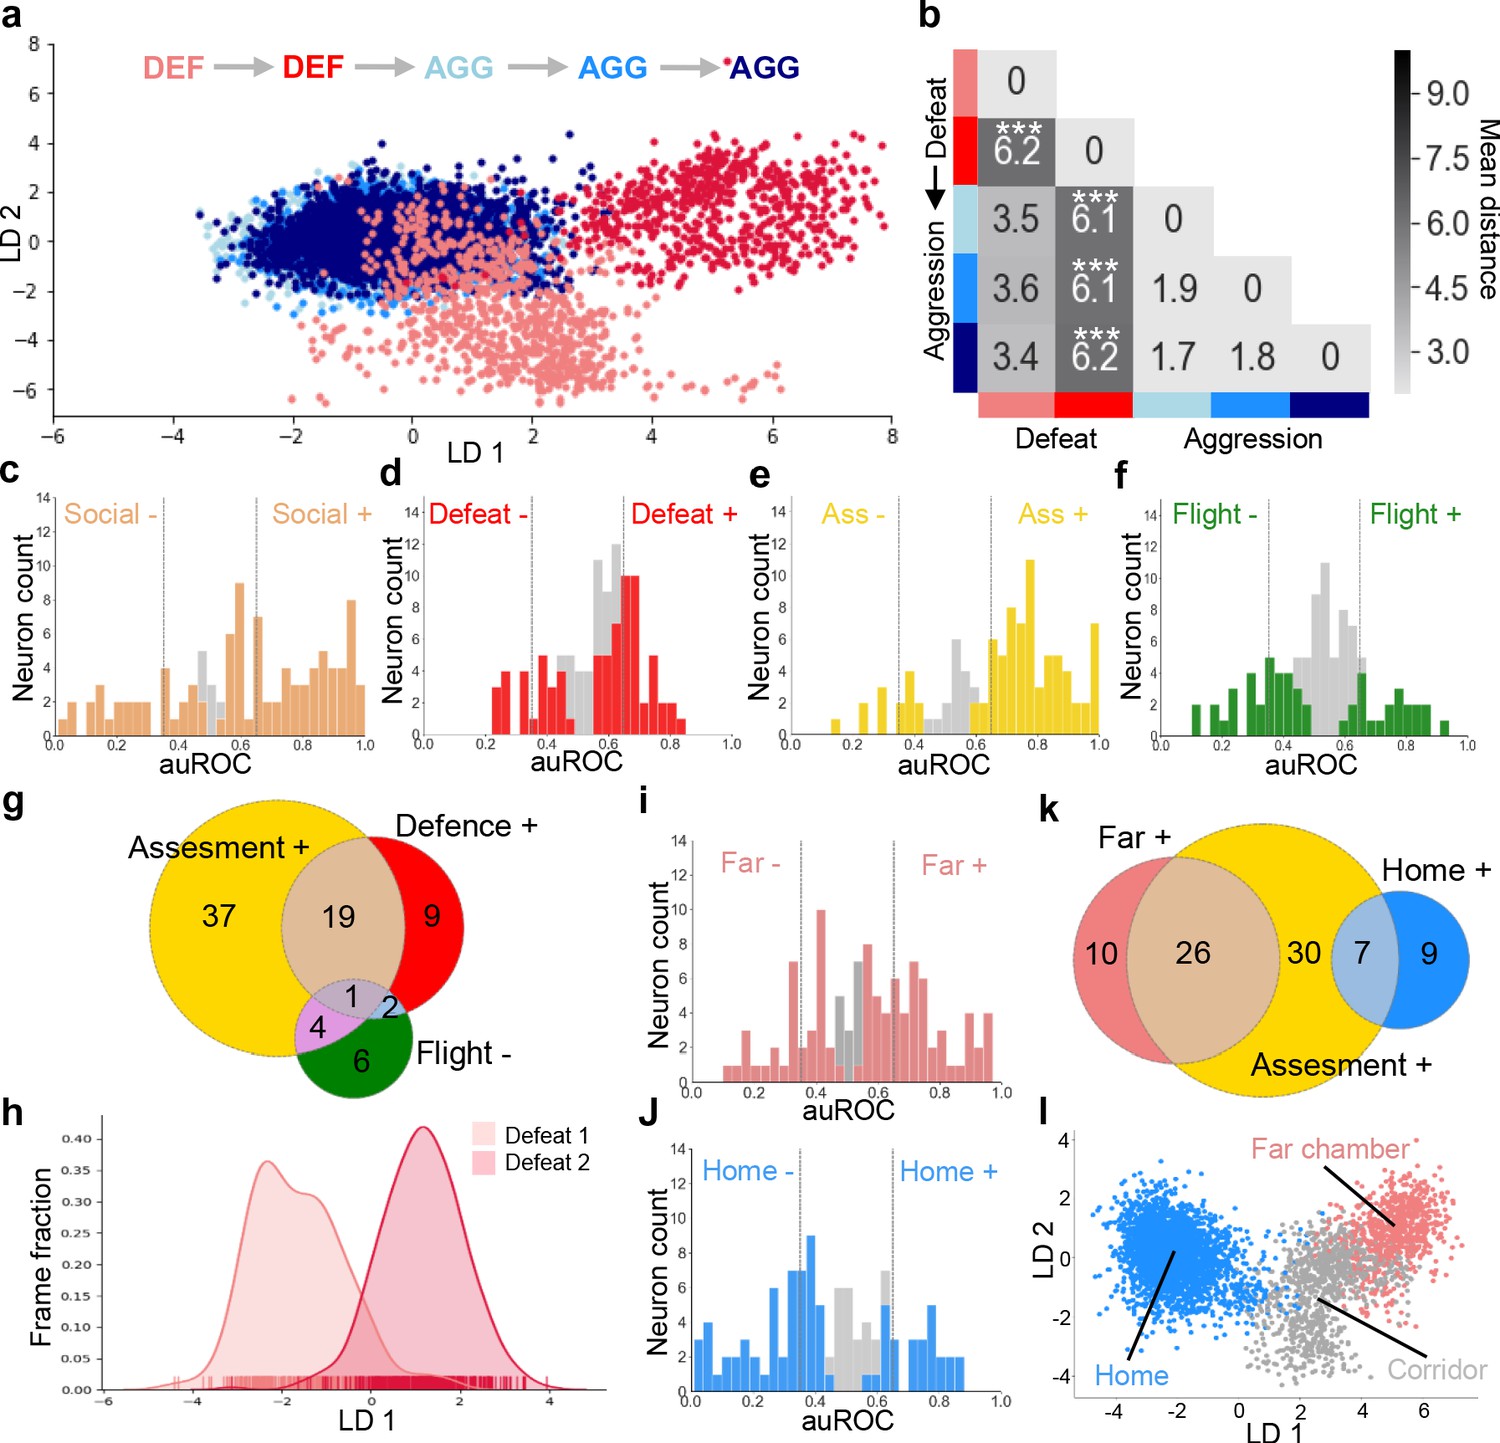
Social defeat remodels VMHvl activity.
(a) LDA plot of neuron ensemble activity for a representative mouse during repeated defeat and aggression episodes. Each data point represents a frame of calcium imaging data projected onto the first two linear discriminants. (b) Average distances between clusters of neuron ensemble data between defeat and aggression episodes for all mice during forward order testing (N = 4; colors refer to episodes in a; *p<0.05, **p<0.01, ***p<0.001; distance between D1 and D2 vs distances between aggression: p=0.0002; distance between D2 vs aggressions p=0.0001; distance between D1 vs aggressions p=0.055; ANOVA F = 16.93, p=0.0001). Next, microendoscopy was used to image single unit calcium activity in VMHvl Esr1+ neurons of awake behaving mice expressing GCaMP6s during social defeat and post-defeat avoidance as done before in the general population of VMHvl neurons. (c–f) Histogram of area under the receiver operator curve (auROC) for all Esr1+ neurons with significantly responding units indicated in color. Vertical lines in histogram indicate high (0.65) and low (0.35) cut-off for scoring positively responding neurons. (g) Overlap of Defeat+, Assessment+, and Flight- neurons (N = 78). Finally, in vivo calcium endoscopy was carried out in Esr1+ neurons of mice subjected to social defeat and then exposed again to the defeat context one day later. (h–i) Histogram of area under the receiver operator curve for all Esr1+ neurons with units showing significant responding to the (h) far or (i) home chamber indicated in color. Vertical lines in histogram indicate high (0.65) and low (0.35) cut-off for scoring positively responding neurons. (j) Overlap of Assessment+, Far chamber+, and Home- neurons (N = 82). (k) LDA plot of Esr1+ neuron ensemble activity for a representative mouse in the home, far chamber, or corridor. Each data point represents a frame of calcium imaging data projected onto the first two linear discriminants. (l) LDA plot of Esr1+ neuron ensemble activity for a representative mouse during sequential defeat episodes. Each data point represents a frame of calcium imaging data projected onto the first linear discriminant.
Figure 4—figure supplement 1
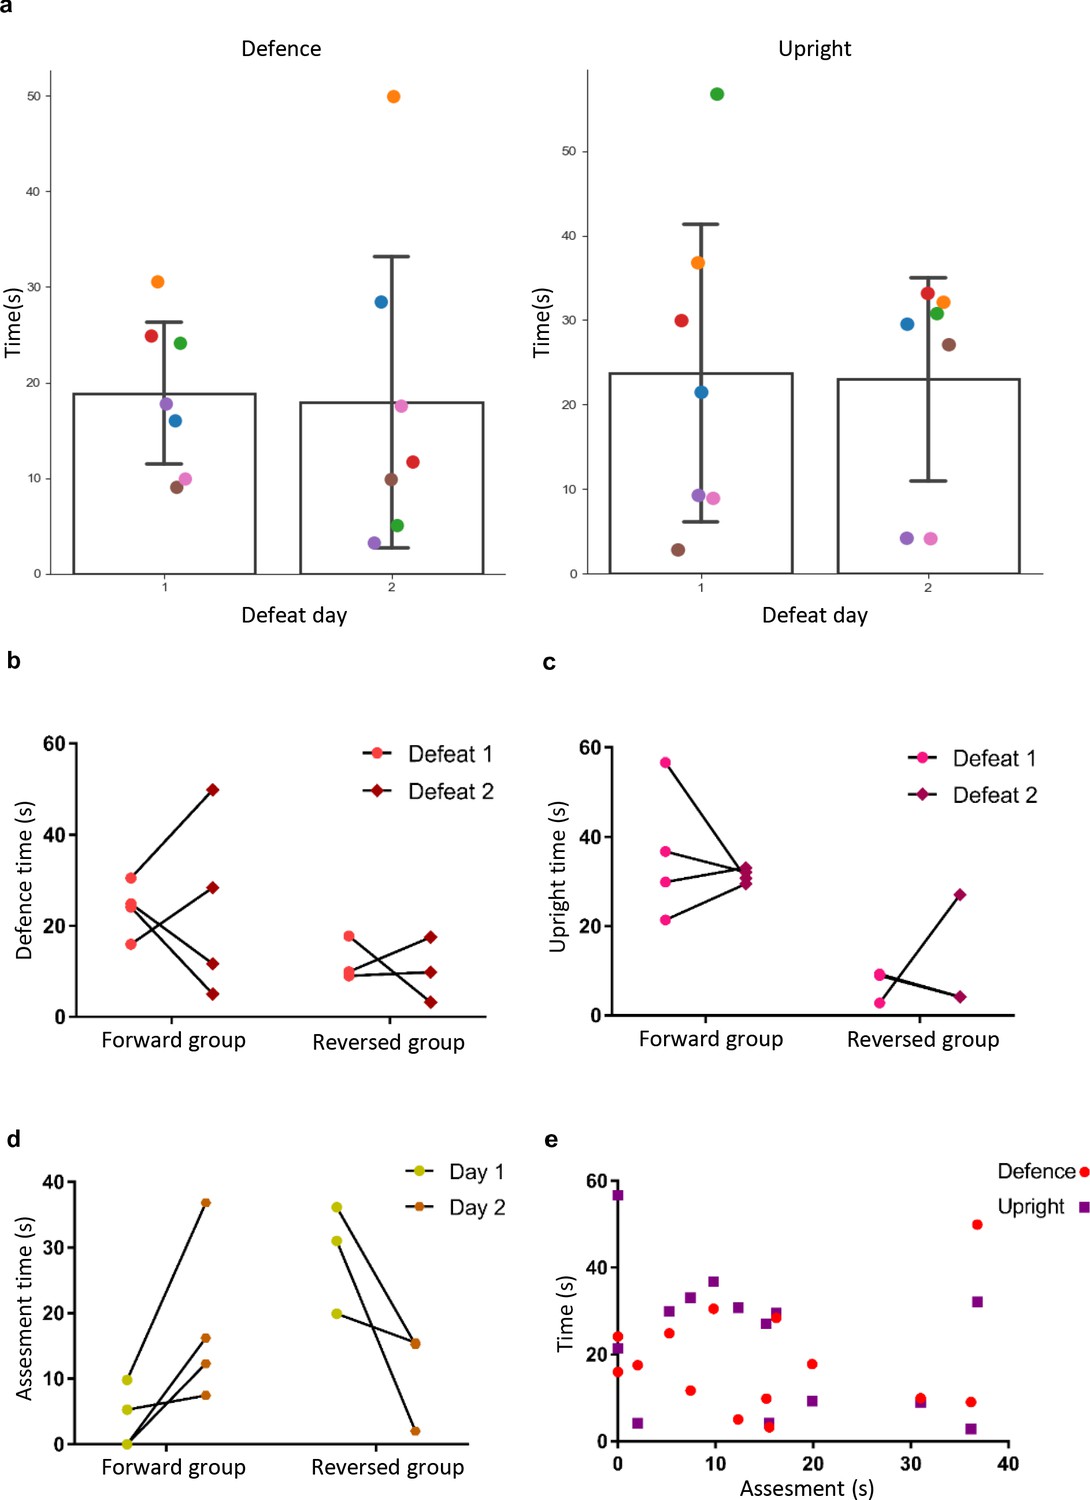
Comparison of behavior between days and groups.
(a) Plots showing time spend defending and in upright position for all mice during defense days 1 and 2 (p>0.05) revealing no difference between the days. (b) Plot showing comparison of defense time between defeat-first and reversed groups (ANOVA group factor: p>0.05; day factor: p>0.05; interaction: p>0.05). (c) Plot showing comparison of upright time between defeat-first and reversed groups (ANOVA group factor: p=0.0014, F = 19.22; day factor: p>0.05; interaction: p>0.05). (d) Plot showing comparison of assessment time between defeat-first and reversed groups (ANOVA group factor: p>0.05; day factor: p>0.05; interaction p=0.0078, F = 11.01). (e) Plot showing no correlation between assessment time and defeat (spearman r = −0.0748, p>0.05) and assessment and upright (spearman r = −0.3278, p>0.05).
Figure 4—figure supplement 2

Representation of defeat and aggression states in LD space for all mice.
(a–b) LDA plots of neuron ensemble activity for all mice during repeated defeat and aggression episodes in (a) forward order and (b) reverse order of behavior. Inset indicates order of defeat and aggression episodes. Each data point represents a frame of calcium imaging data projected onto first two linear discriminants. Note that data for the first mouse in panel a is the same as in Figure 4a. (c) Average distances between clusters of neuron ensemble data between defeat and aggression episodes for all mice during reverse order testing (N = 3; colors refer to episodes in b).
Figure 4—figure supplement 3
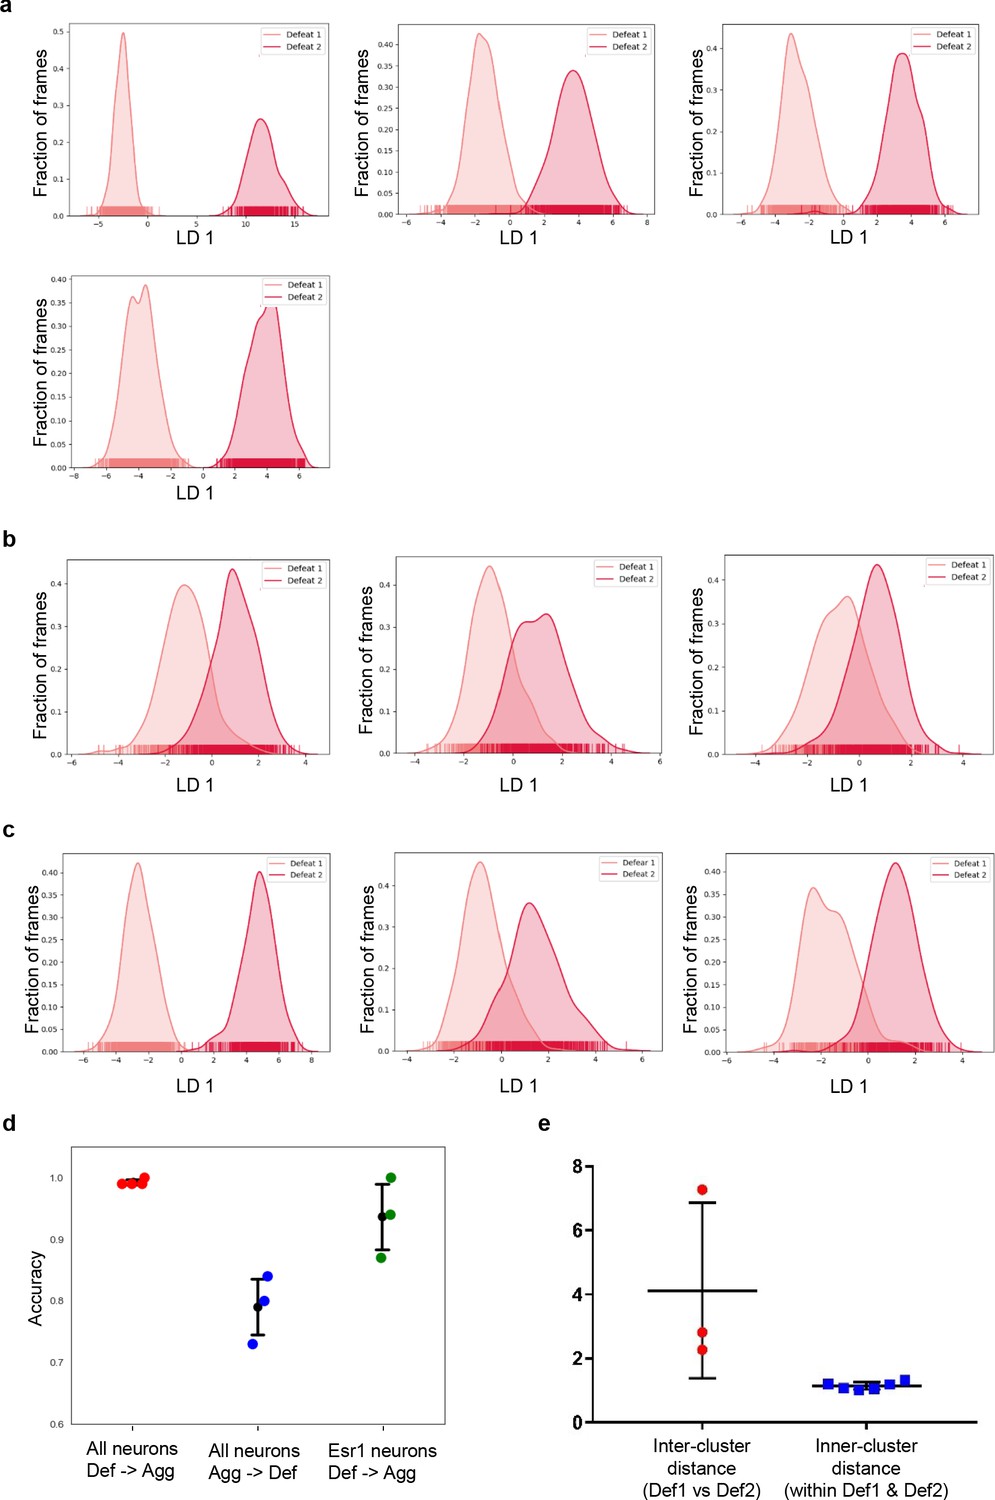
Representation of defeat day 1 and defeat day 2 in LD space for all mice and esr1+ mice.
LDA plots of neuron ensemble activity for all mice during sequential defeat episodes. Each data point represents a frame of calcium imaging data projected onto the first linear discriminant (a) forward order mice (b) reverse order mice (c) esr1+ mice. (d) LDA classifier prediction accuracy between defeat day 1 and defeat day 2 for forward, reverse and esr1+ groups. (e) Comparison between inner and inter-cluster distance for defeat 1 and defeat 2 of Esr1+ mice (t test, p=0.0241, t = 2.868, df = 7). Note that data for the last panel in c is the same as in Figure 4l.
Figure 5
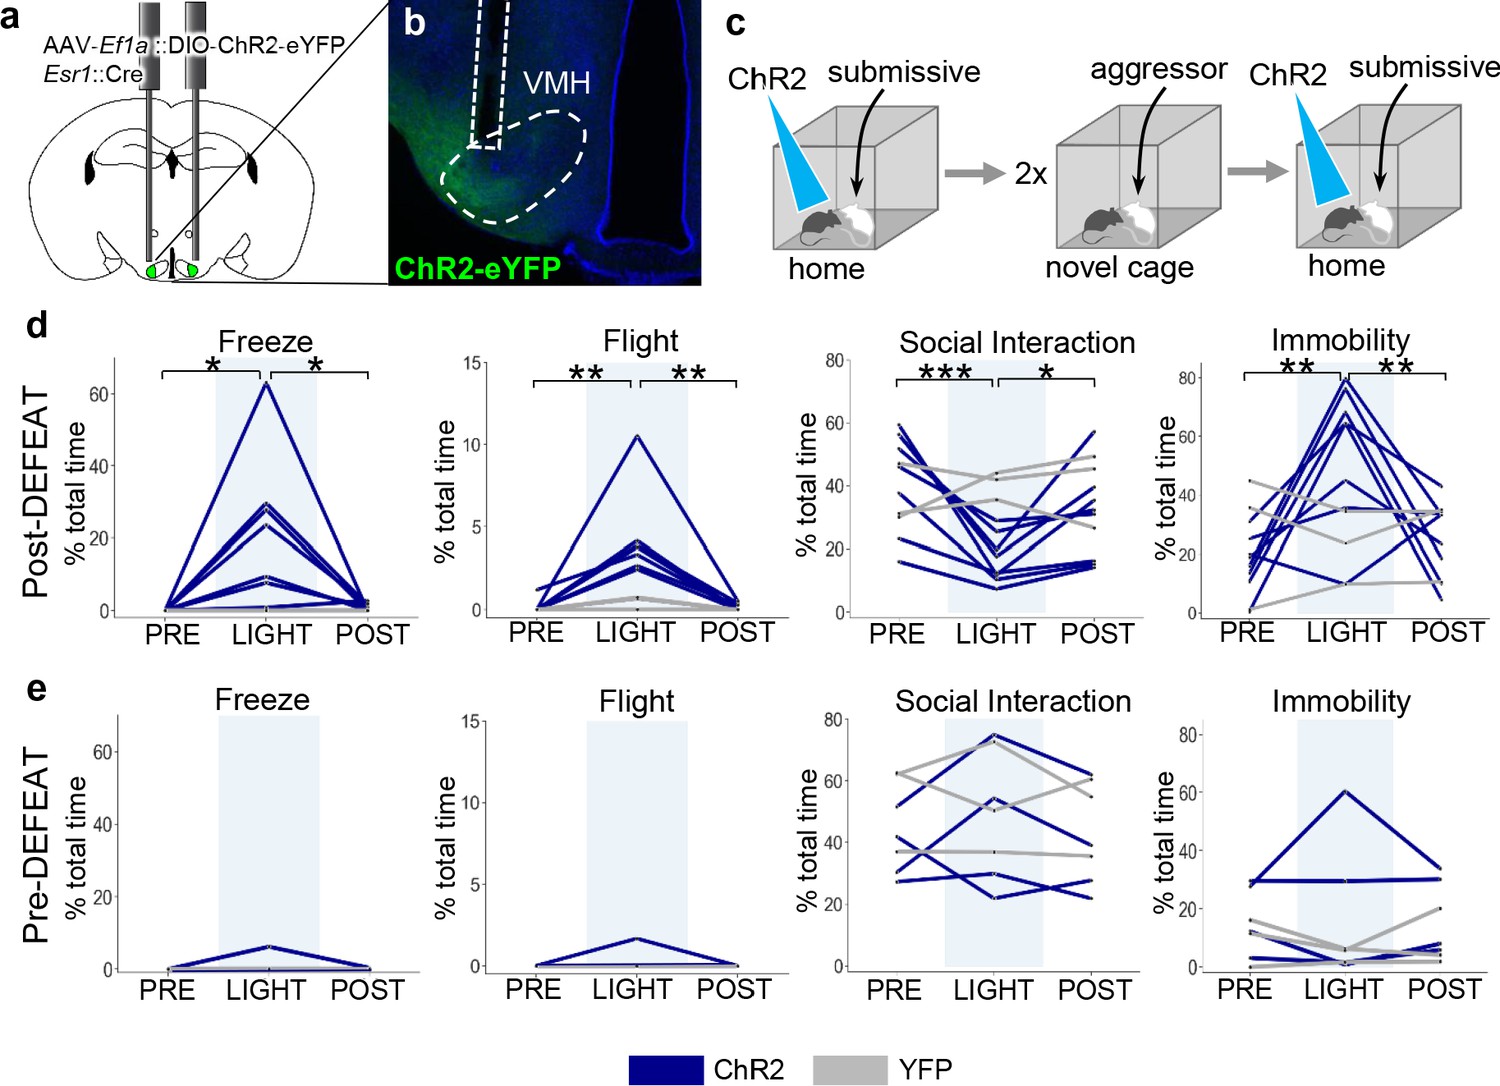
Social defeat remodels VMHvl function.
(a–b) Optogenetic stimulation of Esr1+ neurons following local delivery of AAV-Ef1a::FLEX-ChR2-eYFP into the VMHvl of Esr1::Cre mice. (c) Mice were stimulated intermittently (20 Hz, 20 ms pulse, 30 s ON) following the introduction of a subordinate mouse into the home cage before (Pre-Defeat) and/or after (Post-Defeat) two episodes of social defeat in the far chamber. (d–e) Trial-averaged (N = 4–5 trials) behavioral measures before (Pre, 30 s), during (Light, 30 s), and after (Post, 30 s) optogenetic stimulation of Esr1+ neurons in VMHvl during either the (Blue – mice expressing ChR2; Grey – control mice expressing YFP) (d) Post-Defeat or (e) Pre-Defeat episodes (N = 3–7, *p<0.05, **p<0.01, ***p<0.001; Pre-defeat: Freezing – ANOVA F = 1, p=0.42, Flight – ANOVA F = 1, p=0.42, Interaction – ANOVA F = 0.68, p=0.54, Immobility – ANOVA F = 0.25, p=0.79; Post-defeat: Freezing – ANOVA F = 7.1, p=0.0075, Tukey’s: Pre vs Light p=0.013, Light vs Post p=0.017, Pre vs Post p=0.99, Flight – ANOVA F = 13.8, p=0.0005, Tukey’s: Pre vs Light p=0.0012, Light vs Post p=0.0012, Pre vs Post p=0.10, Interaction – ANOVA F = 19.15, p=0.0001, Tukey’s: Pre vs Light p=0.0001, Light vs Post p=0.019, Pre vs Post p=0.021, Immobility – ANOVA F = 11.2, p=0.0012, Tukey’s: Pre vs Light p=0.0014, Light vs Post p=0.0083, Pre vs Post p=0.63).
Videos
Video 1
Assessment+ cell close to stimulus.
Video 2
Assessment+ cell far from stimulus.
Video 3
Post-defeat optogenetic activation of Esr1+ neurons in VMHvl.
Tables
Key resources table
| Reagent type (species) or resource | Designation | Source or reference | Identifiers | Additional information |
|---|---|---|---|---|
| Strain, strain background (M. musculus) | C57BL/6J | Charles River | RRID:IMSR_JAX:000664 | |
| Strain, strain background (M. musculus) | CD-1 | Charles River | RRID:IMSR_CRL:022 | |
| Strain, strain background (M. musculus) | BALB/c | EMBL | Internal mouse colony at EMBL Rome | |
| Genetic reagent (M. musculus) male | Esr1:Cre | Jackson Laboratory | RRID:IMSR_JAX:017913 | |
| Genetic reagent (M. musculus) male | cFos::CreERT2 | Jackson Laboratory | RRID:IMSR_JAX:021882 | |
| Genetic reagent (M. musculus) male | RC::LSL-tdTomato | Jackson Laboratory | RRID:IMSR_JAX:007914 | |
| Antibody | goat polyclonal anti-cFos SC-52G | Santa Cruz | RRID:AB_2629503 | |
| Chemical compound, drug | 4-hydroxytamoxifen 70% z-isomer | Sigma | H6278 CAS: 68392-35-8 | |
| Strain, strain background (M. musculus) | AAV-EF1a-DIO-hChR2(E123T/T159C)-EYFP | UNC Vector Core | ||
| Strain, strain background (M. musculus) | AAV-EF1a-DIO-EYFP | UNC Vector Core | ||
| Strain, strain background (M. musculus) | AAV5-CAG::Flex-GCaMP6s | Penn Vector Core | ||
| Strain, strain background (M. musculus) | AAV5-hSyn::GCaMP6s | Penn Vector Core | ||
| Software, algorithm | ImageJ | https://imagej.nih.gov/ij/ | RRID:SCR_003070 | |
| Software, algorithm | TurboReg | http://bigwww.epfl.ch/thevenaz/turboreg/ | RRID:SCR_014308 | Thevenaz et al., 1998 |
| Software, algorithm | Observer XT11 | Noldus | https://www.noldus.com/observer-xt-animal | |
| Software, algorithm | Prism 5 | Graphad | RRID:SCR_002798 | https://www.graphpad.com |
| Software, algorithm | V2.2 Radiant | Plexon | https://plexon.com/products/plexbright-4-channel-optogenetic-controller-radiant-v2/ | |
| Software, algorithm | Salomon Coder | https://solomon.andraspeter.com/ | Behaviour coding software | |
| Software, algorithm | scikit-learn | https://scikit-learn.org | RRID:SCR_002577 | Pedregosa et al., 2012 |
Additional files
-
Supplementary file 1
Table showing number of ROIs for each mouse that were assessed for the indicated behavior.
Territory includes both Home and Far chamber cells.
- https://cdn.elifesciences.org/articles/57148/elife-57148-supp1-v1.docx
-
Transparent reporting form
- https://cdn.elifesciences.org/articles/57148/elife-57148-transrepform-v1.pdf
Download links
A two-part list of links to download the article, or parts of the article, in various formats.
Downloads (link to download the article as PDF)
Open citations (links to open the citations from this article in various online reference manager services)
Cite this article (links to download the citations from this article in formats compatible with various reference manager tools)
Dynamic encoding of social threat and spatial context in the hypothalamus
eLife 9:e57148.
https://doi.org/10.7554/eLife.57148


