Gain of channel function and modified gating properties in TRPM3 mutants causing intellectual disability and epilepsy
- Laboratory of Endometrium, Endometriosis and Reproductive Medicine, Department of Development and Regeneration, Belgium
- Laboratory of Ion Channel Research, VIB-KU Leuven Center for Brain and Disease Research, Belgium and Department of Molecular Medicine, Belgium
Figures
Figure 1 with 2 supplements
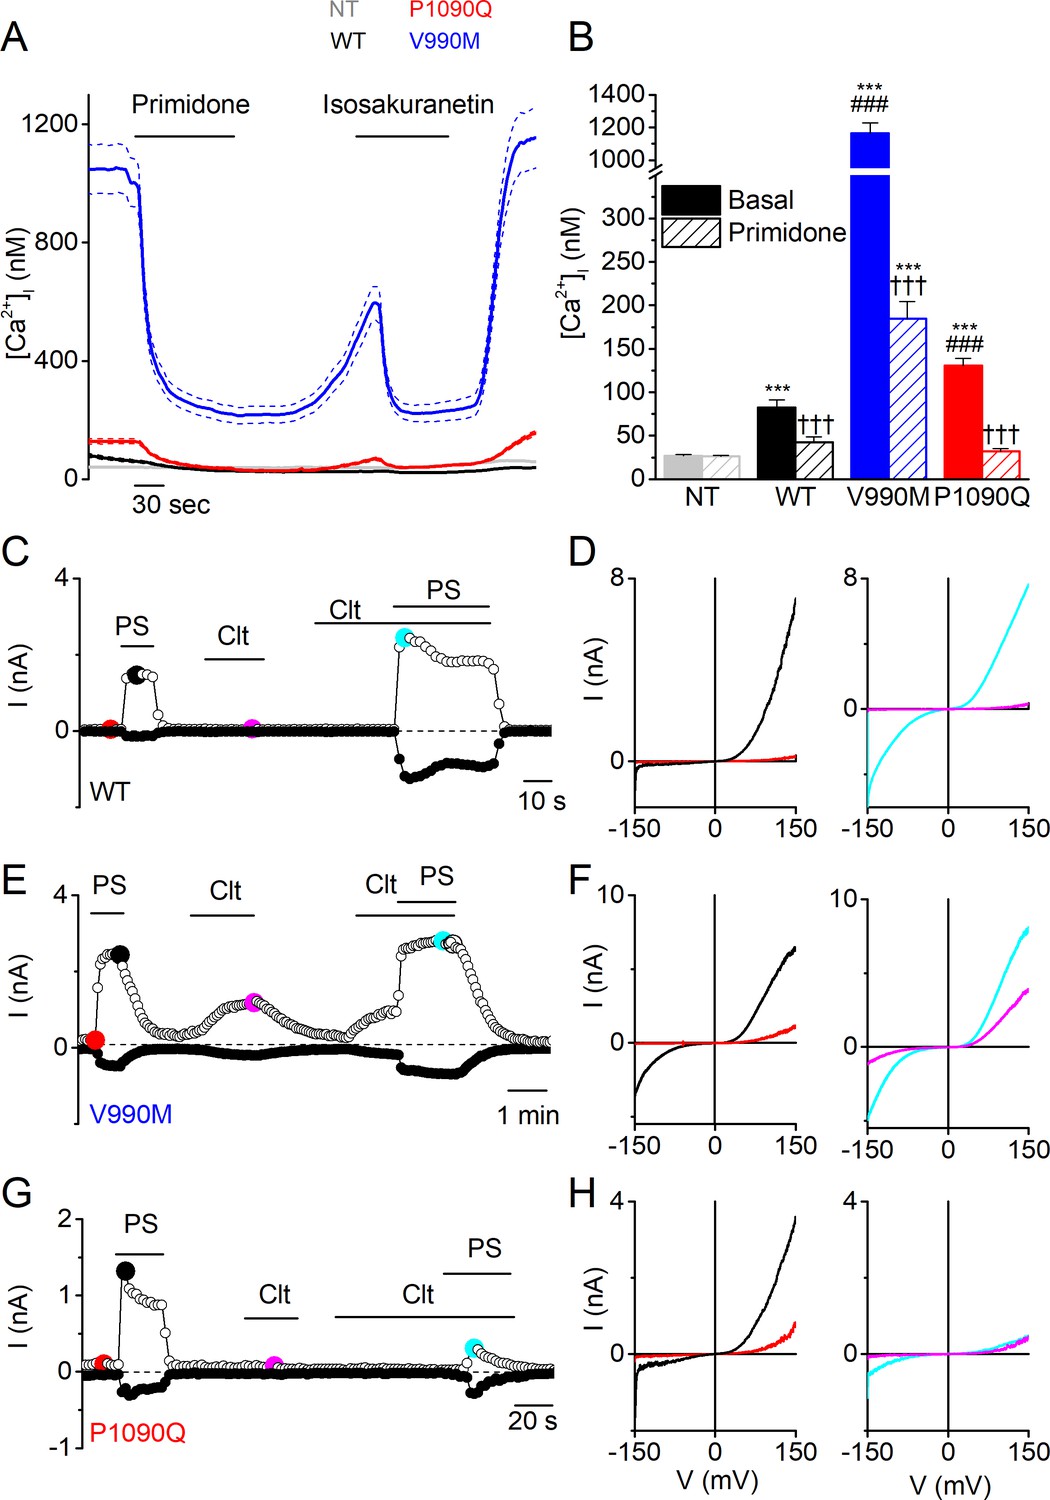
Elevated basal activity in HEK293T cells expressing TRPM3 DEE mutants.
(A) Time course of intracellular calcium concentrations ([Ca2+]i) (± SEM) upon application of the TRPM3 inhibitors primidone (100 µM) and isosakuranetin (50 µM) for WT (n = 230), P1090Q (n = 163) and V990M (n = 79) transfected HEK293T cells, and non-transfected (NT) cells (n = 93) (N = 3 independent experiments). (B) Basal intracellular calcium concentrations in the absence (full bars) and presence of primidone (open bars). Data are represented as mean ± SEM, using a Kruskal-Wallis ANOVA with Dunn’s posthoc test, where ***=versus NT; ###=versus basal WT; †††=versus basal of the same mutant/WT. For WT: ***p=7.5×10⁻⁵, ††† p=9.4×10⁻⁶; for V990M: ***p=1.6×10−60, ###: p=1.4×10−42, ††† p=7.3×10⁻¹¹; for P1090Q: ***p=1.5×10⁻¹⁹, ###: p=4.9×10⁻⁷, ††† p=1.6×10⁻¹⁹.(C, E and G) Amplitude of currents at a holding potential of +80 mV and –80 mV (measured with voltage ramps) upon application of PS (40 µM), Clt (10 µM) and co-application of PS and Clt for WT (n = 10) (C), V990M (n = 7) (E) and P1090Q (n = 9) (G). (D, F and H) Current-voltage relationships at the time points indicated in (C), (E) and (G).
Figure 1—figure supplement 1
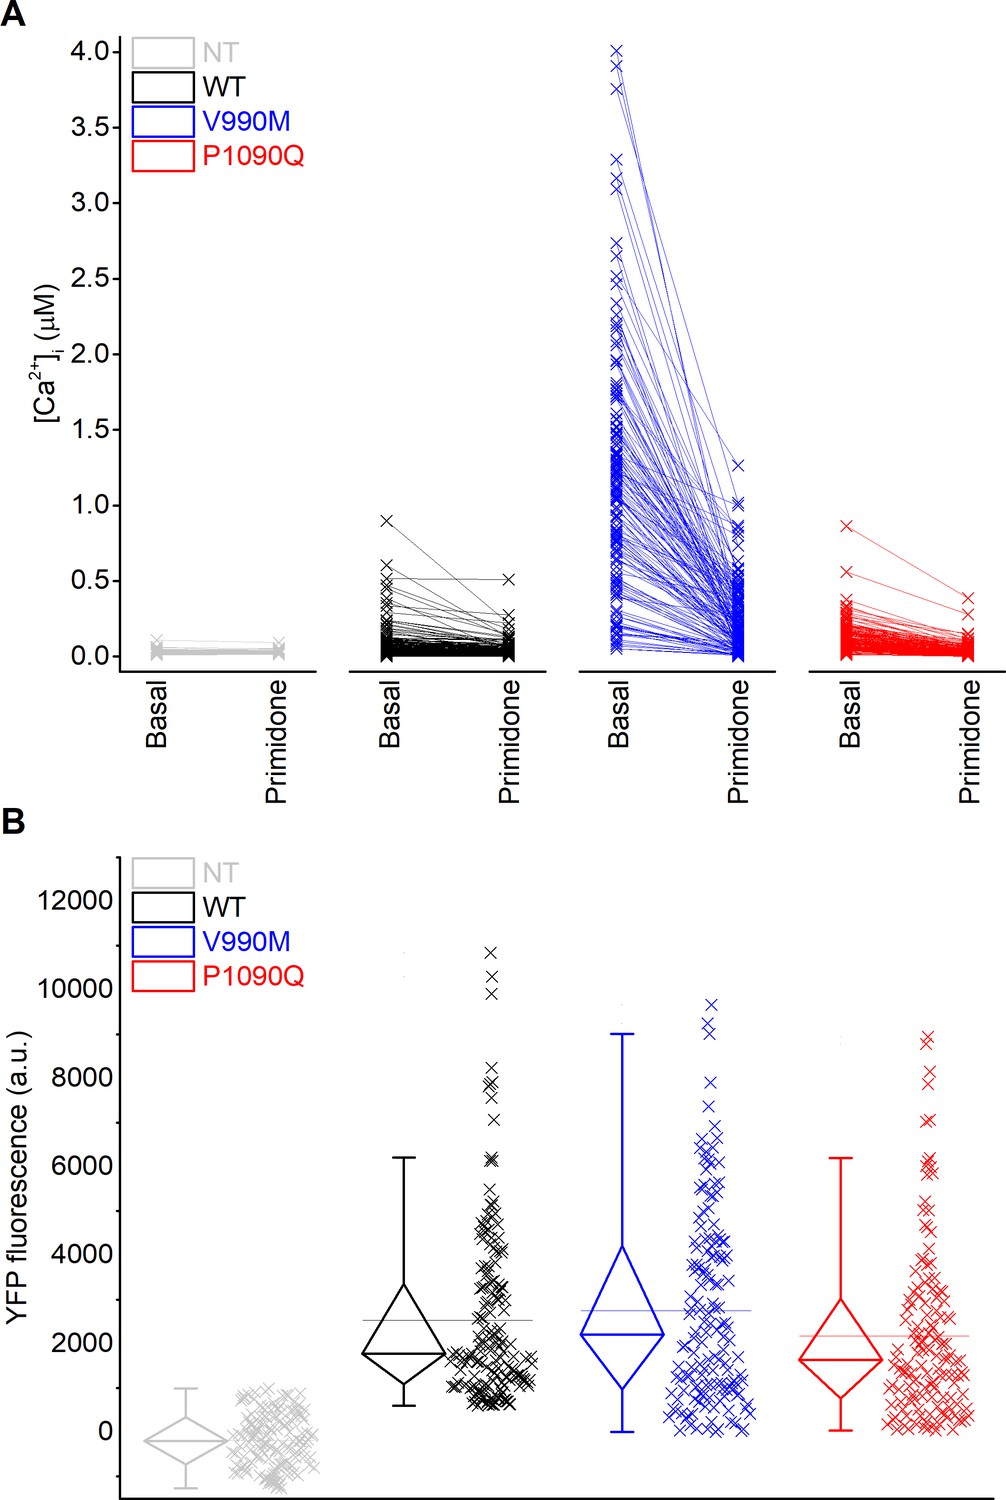
Increased basal intracellular calcium concentrations in DEE mutants that are not linked to increased expression levels of DEE mutants.
(A) Intracellular calcium concentrations of individual HEK293 cells before and after stimulation by primidone (100 µM). Non-transfected cells (grey), TRPM3 WT (black), V990M (blue) and P1090Q (red) transfected cells. (B) YFP fluorescence intensity signal for non-transfected, TRPM3 WT (black), V990M (blue) and P1090Q (red) transfected HEK293 cells. Individual data points are displayed, along with box plots showing the median, first and third quartiles, and outliers as whiskers.
Figure 1—figure supplement 2
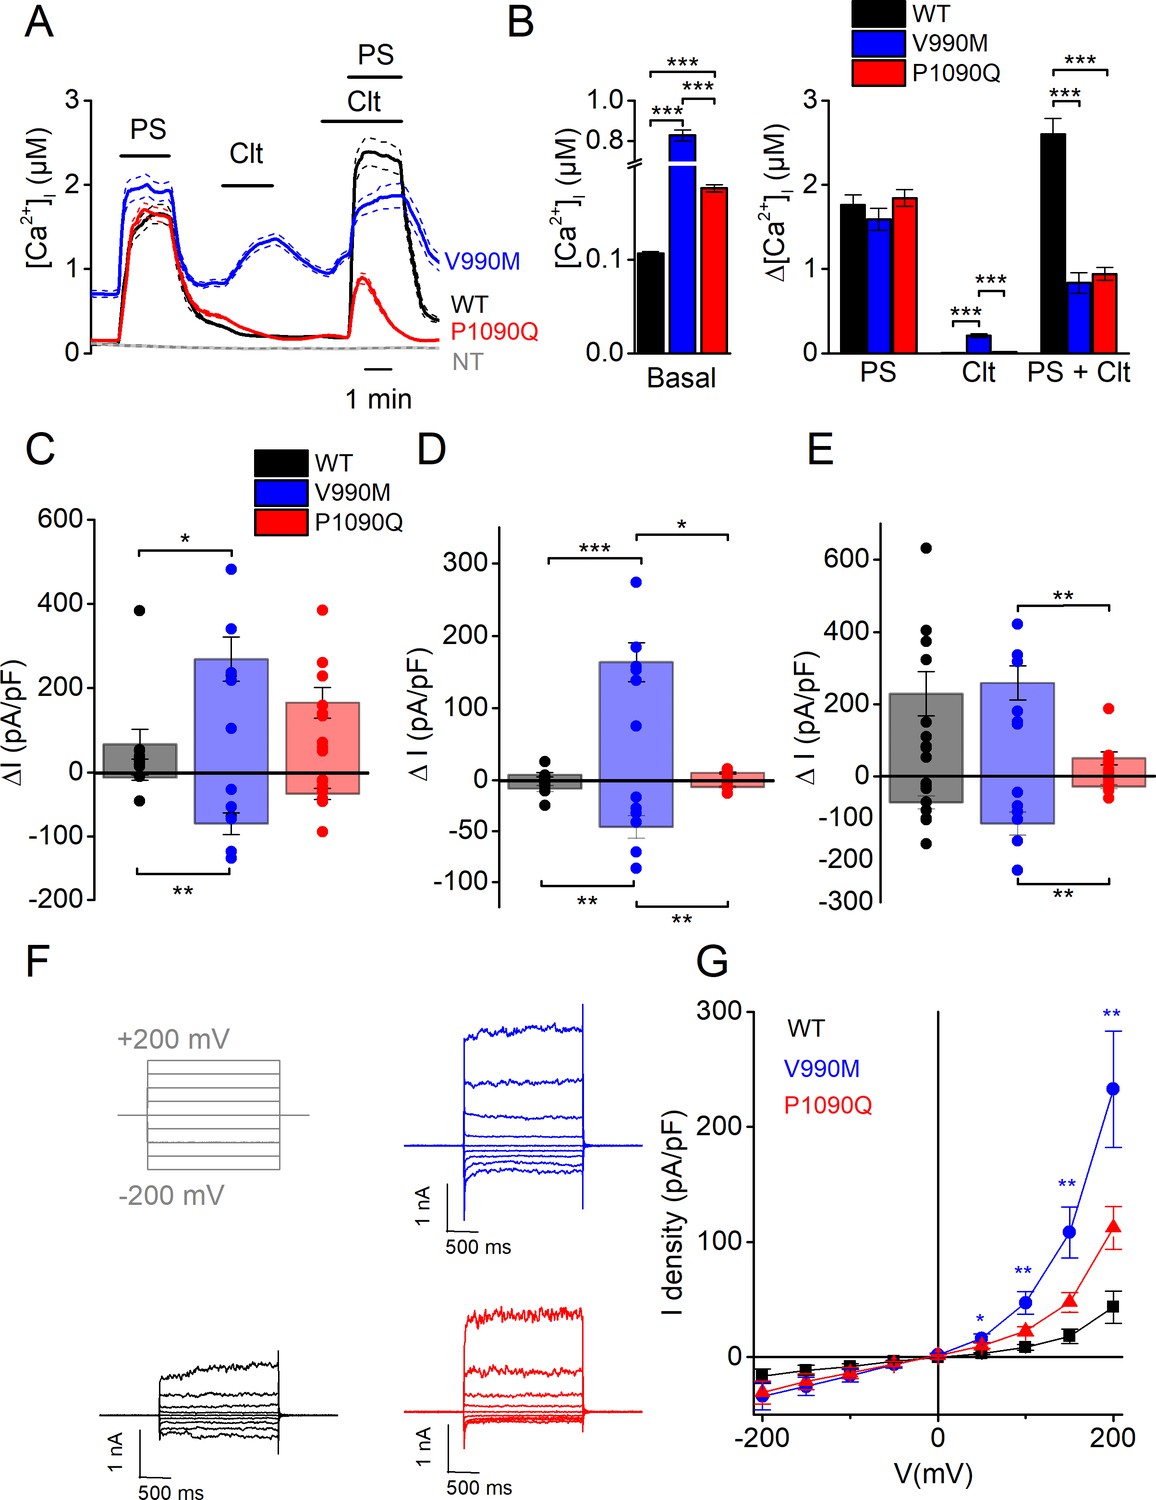
Biophysical characterization of the V990M and P1090Q substitution in hTRPM3 indicate the substitutions as a gain of function mutation.
(A) Time course of calcium concentrations (± SEM) upon application of PS (40 µM), Clt (10 µM) and co-application of PS and Clt for WT (n = 294), V990M (n = 196) and P1090Q (n = 624) transfected cells. (B) Basal [Ca2+]i (WT versus V990M: p<10−110; WT versus P1090Q: p=7.4×10−63 and V990M versus P1090Q; p=2.7×10−107) (left) and calcium amplitudes when applying PS (WT versus V990M: p=0.08; WT versus P1090Q: p=1 and V990M versus P1090Q: p=0.21), Clt (WT versus V990M: p=4.5×10⁻³³; WT versus P1090Q: p=1.4×10⁻²² and V990M versus P1090Q; p=1.3×10⁻⁶) and co-application of PS and Clt (WT versus V990M: p=4.0×10⁻³³; WT versus P1090Q: p=1.4×10−52 and V990M versus P1090Q; p=1) (right) for WT, V990M and P1090Q transfected cells. (C–E) Current densities at a holding potential of +80 mV and –80 mV (measured with voltage ramps) upon application of PS (40 µM) (For +80 mV, WT versus V990M: p=0.004, WT versus P1090Q: p=0.038 and V990M versus P1090Q: p=0.95. For −80 mV, WT versus V990M: p=3.3×10⁻⁴, WT versus P1090Q: p=0.028 and V990M versus P1090Q: p=0.39) (C), Clt (10 µM) (For +80 mV, WT versus V990M: p=7.6×10⁻⁴, WT versus P1090Q: p=0.038 and V990M versus P1090Q: p=0.95. For −80 mV, WT versus V990M: p=3.3×10⁻⁴, WT versus P1090Q: p=0.69 and V990M versus P1090Q: p=0.02) (D) and co-application of PS and Clt (For +80 mV, WT versus V990M: p=1, WT versus P1090Q: p=0.011 and V990M versus P1090Q: p=0.004. For −80 mV, WT versus V990M: p=0.32, WT versus P1090Q: p=0.22 and V990M versus P1090Q: p=0.005) (E). (F) Representative whole-cell TRPM3 currents recorded during voltage steps ranging from −200 mV to +200 mV, separated by steps of +50 mV for WT (black), V990M (blue) and P1090Q (red) transfected cells. (G) Current density-voltage relationship for WT (n = 5), V990M (n = 6) and P1090Q (n = 7) transfected cells (+50 mV: WT versus V990M (p=0.012), WT versus P1090Q (p=0.22) and V990M versus P1090Q (p=0.21); +100 mV: WT versus V990M (p=0.003), WT versus P1090Q (p=0.32) and V990M versus P1090Q (p=0.034); +150 mV: WT versus V990M (p=0.002), WT versus P1090Q (p=0.35) and V990M versus P1090Q (p=0.019); +200 mV: WT versus V990M (p=0.004), WT versus P1090Q (p=0.33) and V990M versus P1090Q (p=0.039). Kruskal-Wallis ANOVA with Dunn’s posthoc test for panel B-E. One-way ANOVA with Tukey’s posthoc test for panel G. Data are represented as mean ± SEM with scatter plot of the individual cells for panel C-E.
Figure 2 with 1 supplement
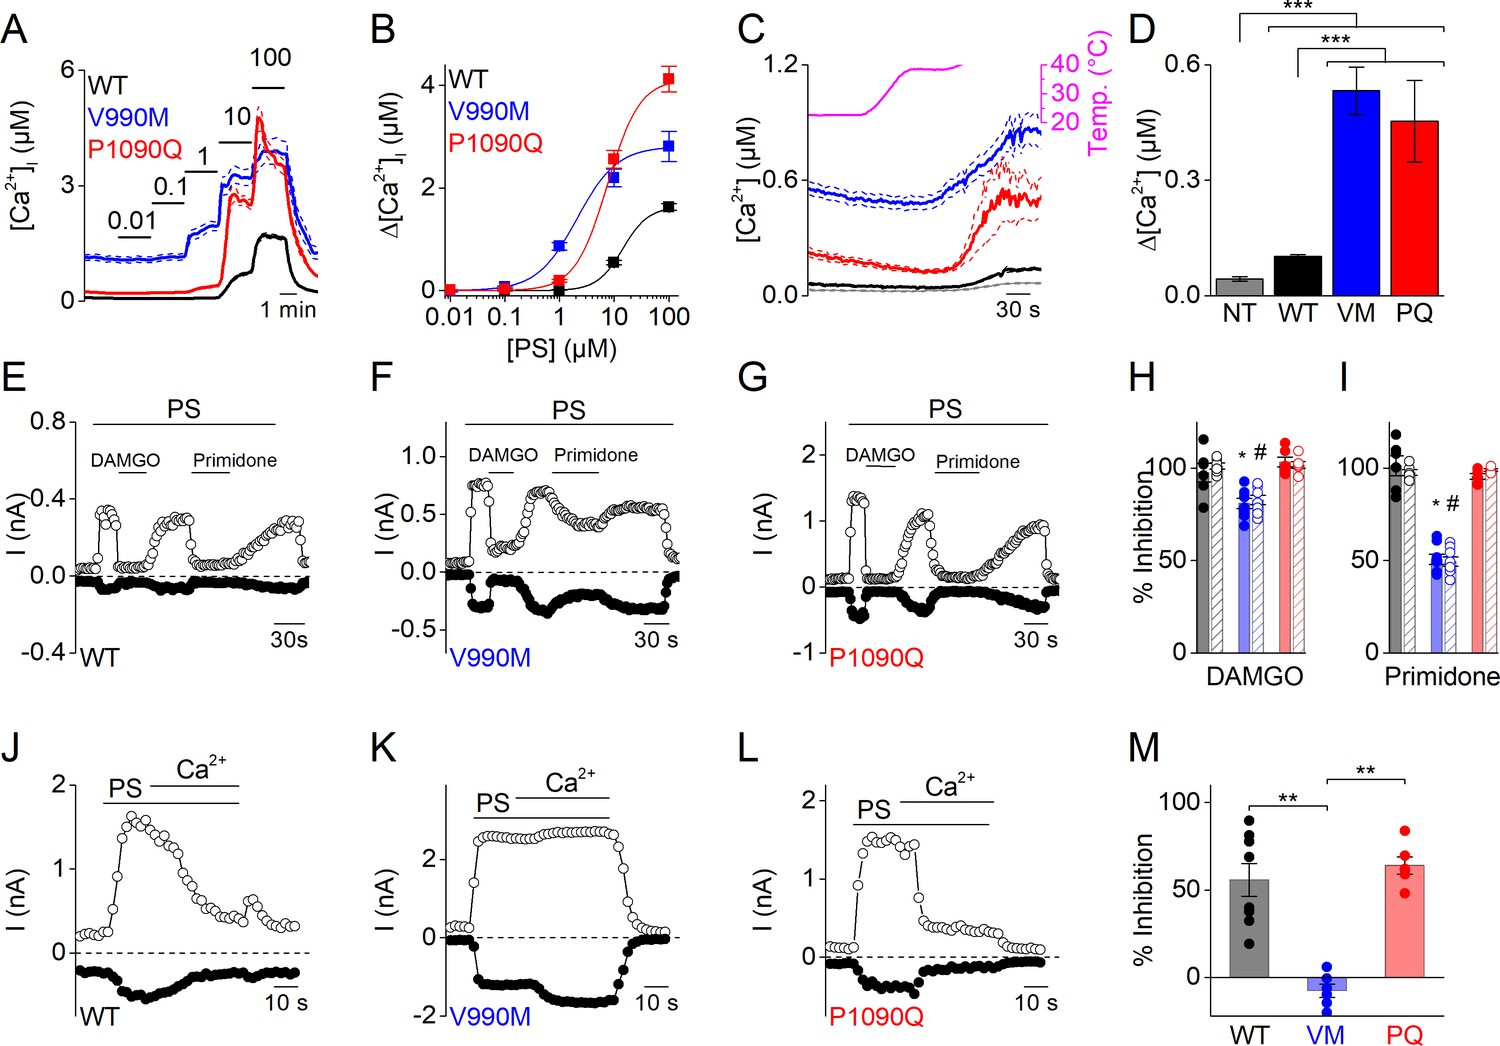
Altered sensitivity of DEE mutants for thermal stimulation and pharmacological modulation.
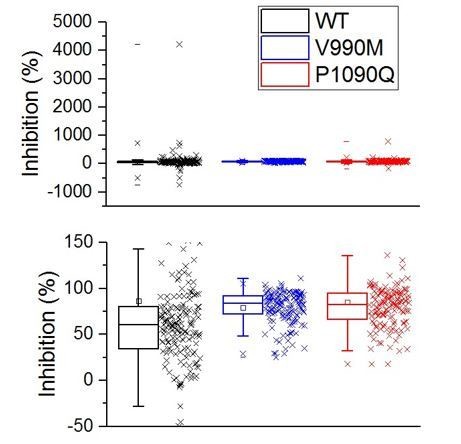
(A) Time course of [Ca2+]i (± SEM) upon application of the TRPM3 agonist PS in stepwise increasing dose (0.01–100 µM) for WT (n = 615), V990M (n = 130) and P1090Q (n = 196) (N = 3 independent experiments). (B) PS concentration-response curves for WT (EC50 = 14.3 ± 5.8 µM), V990M (EC50 = 2.1 ± 0.4 µM), and P1090Q (EC50 = 7.5 ± 1.4 µM). (C) Time course of [Ca2+]i for NT (gray, n = 46), WT (black, n = 148), V990M (blue, n = 259) and P1090Q (red, n = 271) when applying a heat ramp (magenta). Analysis of 3 independent experiments, where the data are represented as mean ± SEM. (D) Corresponding amplitudes of the temperature response, represented as mean ± SEM, using a Kruskal-Wallis ANOVA with Dunn’s posthoc test (***). WT, V990M and P1090Q transfected cells had a significant larger amplitude compared to NT cells (p=4.6×10⁻⁵, p=2.5×10⁻²² and p=1.2×10⁻²², respectively). V990M and P1090Q transfected cells had a significant larger amplitude compared to WT cells (p=8.3×10⁻¹⁴ and p=2.8×10⁻¹⁴). The amplitudes of P1090Q and V990M were not significantly different (p=1). (E–G) Amplitude of currents at +80 mV and –80 mV (measured during voltage ramps) upon application of PS (40 µM) with co-application of the µ-opioid receptor agonist DAMGO (1 µM) or the TRPM3 inhibitor primidone (25 µM) for WT (n = 6) (E), V990M (n = 8) (F) and P1090Q (n = 6) (G), in cells co-expressing the µ-opioid receptor. (H–I) Percentage inhibition of PS-induced currents upon application of DAMGO (+80 mV: WT versus V990M (p=3.4×10⁻⁵), WT versus P1090Q (p=0.98) and V990M versus P1090Q (p=2.3×10⁻⁵); −80 mV: WT versus V990M (p=0.01), WT versus P1090Q (p=0.54) and V990M versus P1090Q (p=8.7×10⁻⁴). (H) And primidone (+80 mV: WT versus V990M (p=0), WT versus P1090Q (p=0.88) and V990M versus P1090Q (p=0); −80 mV: WT versus V990M (p=0), WT versus P1090Q (p=0.52) and V990M versus P1090Q (p=6.1×10⁻⁸. (I) For WT (black), V990M (blue) and P1090Q (red). The filled and shaded bars represent the current inhibition at −80 mV and +80 mV, respectively. A Kruskal-Wallis ANOVA with Dunn’s posthoc test was used. Data are represented as mean ± SEM and scatter plots for each individual cell. (J–L) Amplitude of currents at +80 mV and –80 mV (measured during voltage ramps) upon application of PS (40 µM) in the presence of 1 mM extracellular calcium for WT (n = 8) (J), V990M (n = 6) (K) and P1090Q (n = 6) (L). (M) Percentage inhibition upon calcium application for WT, V990M (VM) and P1090Q (PQ) (mean ± SEM and scatter plots for each individual cell). **: A Kruskal-Wallis ANOVA with Dunn’s posthoc test was used, where the amplitude of V990M transfected cells compared to WT and P1090Q transfected cells were significantly different (p=0.009 and p=0.005, respectively). The amplitudes of P1090Q and WT transfected cells were not significantly different (p=1).
Figure 2—figure supplement 1
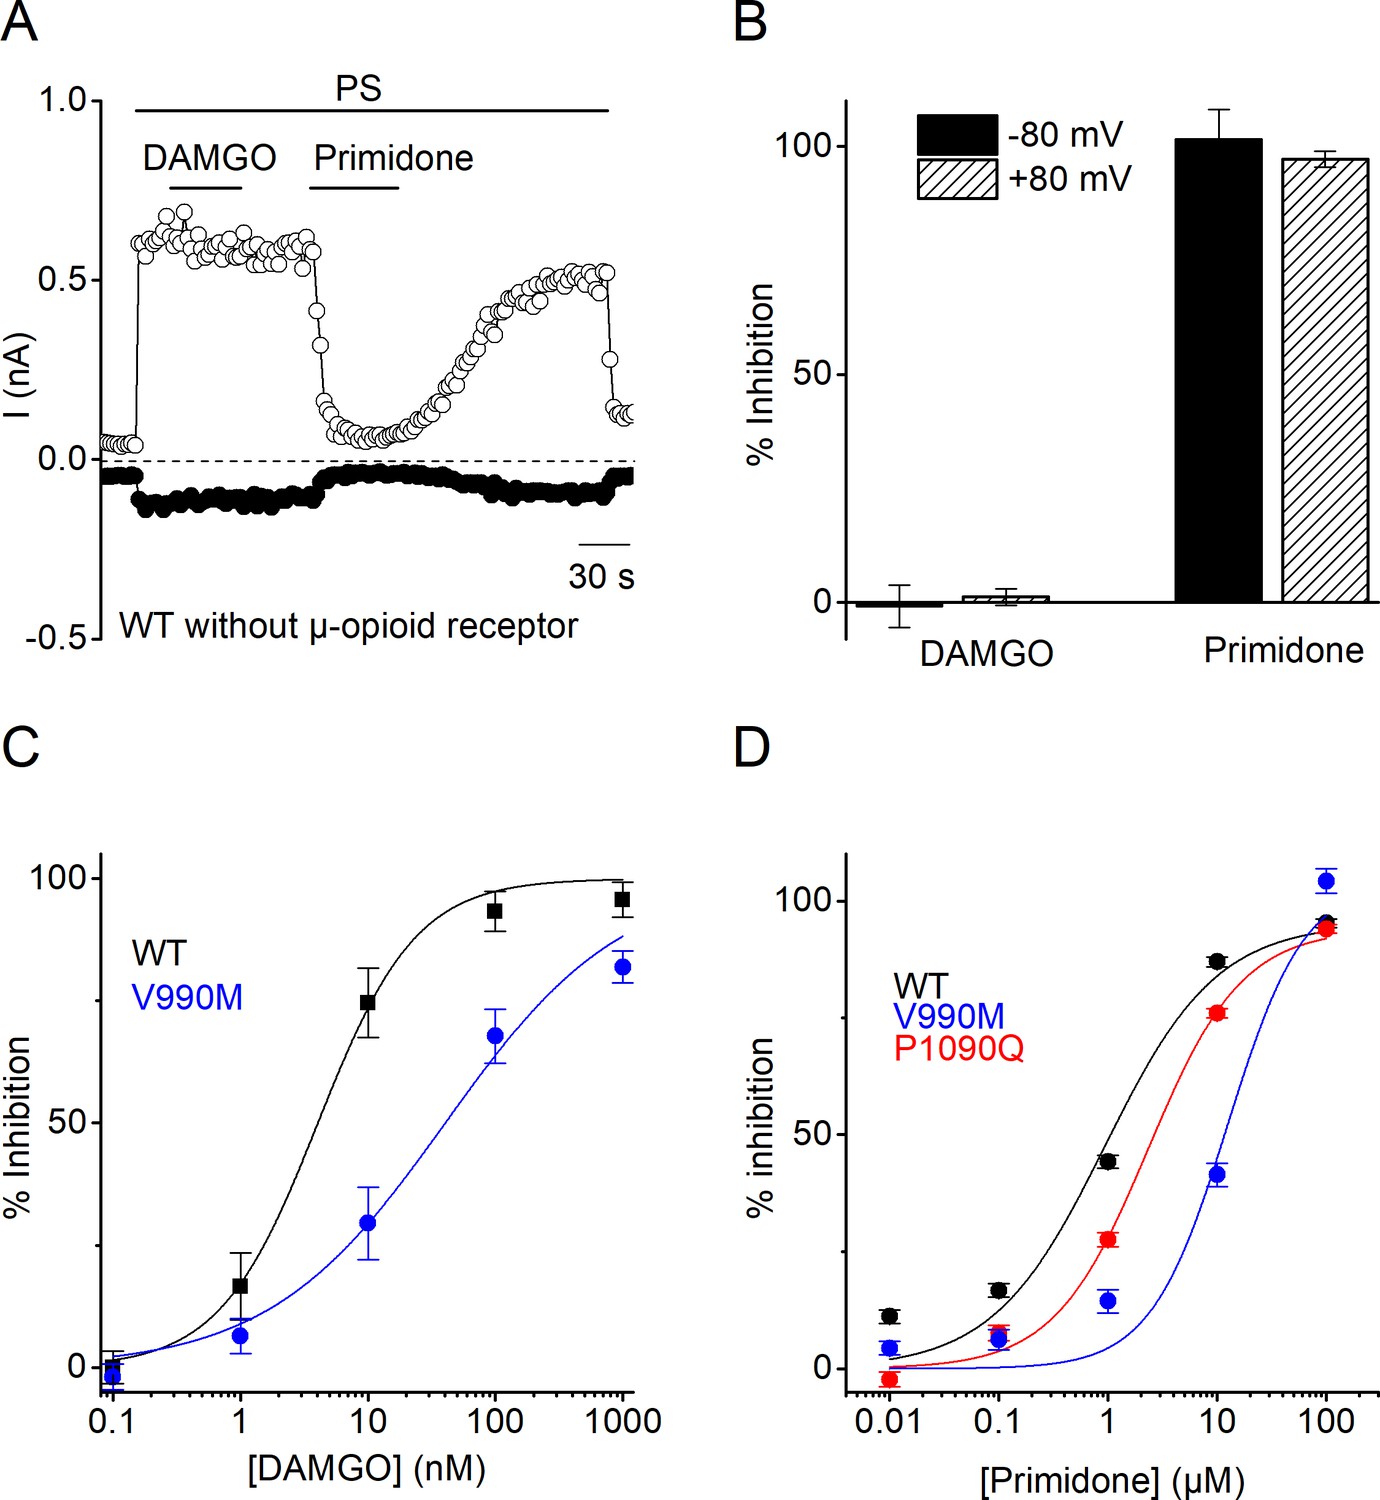
Characterization of DAMGO and primidone block on PS-induced currents.
(A) Amplitude of currents at a holding potential of +80 mV and –80 mV (measured with voltage ramps) upon application of PS (40 µM) with co-application of the µ-opioid receptor agonist DAMGO (1 µM) and the TRPM3 inhibitor primidone (25 µM) for WT hTRPM3 transfected cells (n = 5). (B) Percentage inhibition of PS-induced currents at holding potential of +80 mV and –80 mV upon application of DAMGO and primidone for WT hTRPM3 cells. (C) DAMGO concentration-response curve for WT (IC50 = 4.0 ± 0.6 nM) and V990M (IC50 = 40 ± 10 nM) hTRPM3 co-transfected cells with µ-opioid receptors (n = 5). (D) Primidone concentration-response curve for WT (IC50 = 940 ± 250 nM; n = 526), V990M (IC50 = 12.5 ± 3.7 µM; n = 498) and P1090Q (IC50 = 2.3 ± 0.3 µM; n = 538) hTRPM3 transfected cells (N = 3 independent calcium imaging experiments).
Figure 3 with 1 supplement

Altered gating of the alternative pore in V990M (A–C) G-V plots of PS-activated currents for (A) WT (black), (B) V990M (blue) and (C) P1090Q (red).
Currents measured during voltage-steps ranging from −200 mV to +200 mV, separated by steps of +50 mV. Representative currents are shown as insets in each graph; n = 6 for each experiment. (D) Rectification pattern of PS (40 µM) (full circle and line) and PS + Clt (10 µM)-induced (open circle and dashed line) currents for WT, V990M and P1090Q. Data points are derived by plotting the current increase at +150 mV versus the current increases at −150 mV; n ≥ 4 for each dataset. (E) Time course of WT TRPM3 whole-cell currents at ± 150 mV upon application of PS (40 µM) and Lanthanum (La3+; 10 µM) or PS + Clt and La3+. (F) Time course of V990M mutant whole-cell currents at ± 150 mV upon application of PS and La3+. (G) Relative La3+ block calculated from experiments as in E) and F) for WT (black) in presence of PS + Clt (n = 4) and for V990M (blue, n = 8) in presence of PS alone (mean ± SEM and scatter plot for each individual cell). (H) Relative PS-induced currents at −150 mV carried by monomethylammonium (MMA+) in WT (black), V990M (blue) and P1090Q (red). MMA+ currents were normalized to the currents carried by Na+; PS (40 µM) and n = 5 for all experiments (mean ± SEM and scatter plot for each individual cell). ** One-way ANOVA with Tukey’s posthoc test (WT versus V990M: p=0.005; WT versus P1090Q: p=0.09 and V990M versus P1090Q: p=0.28).
Figure 3—figure supplement 1
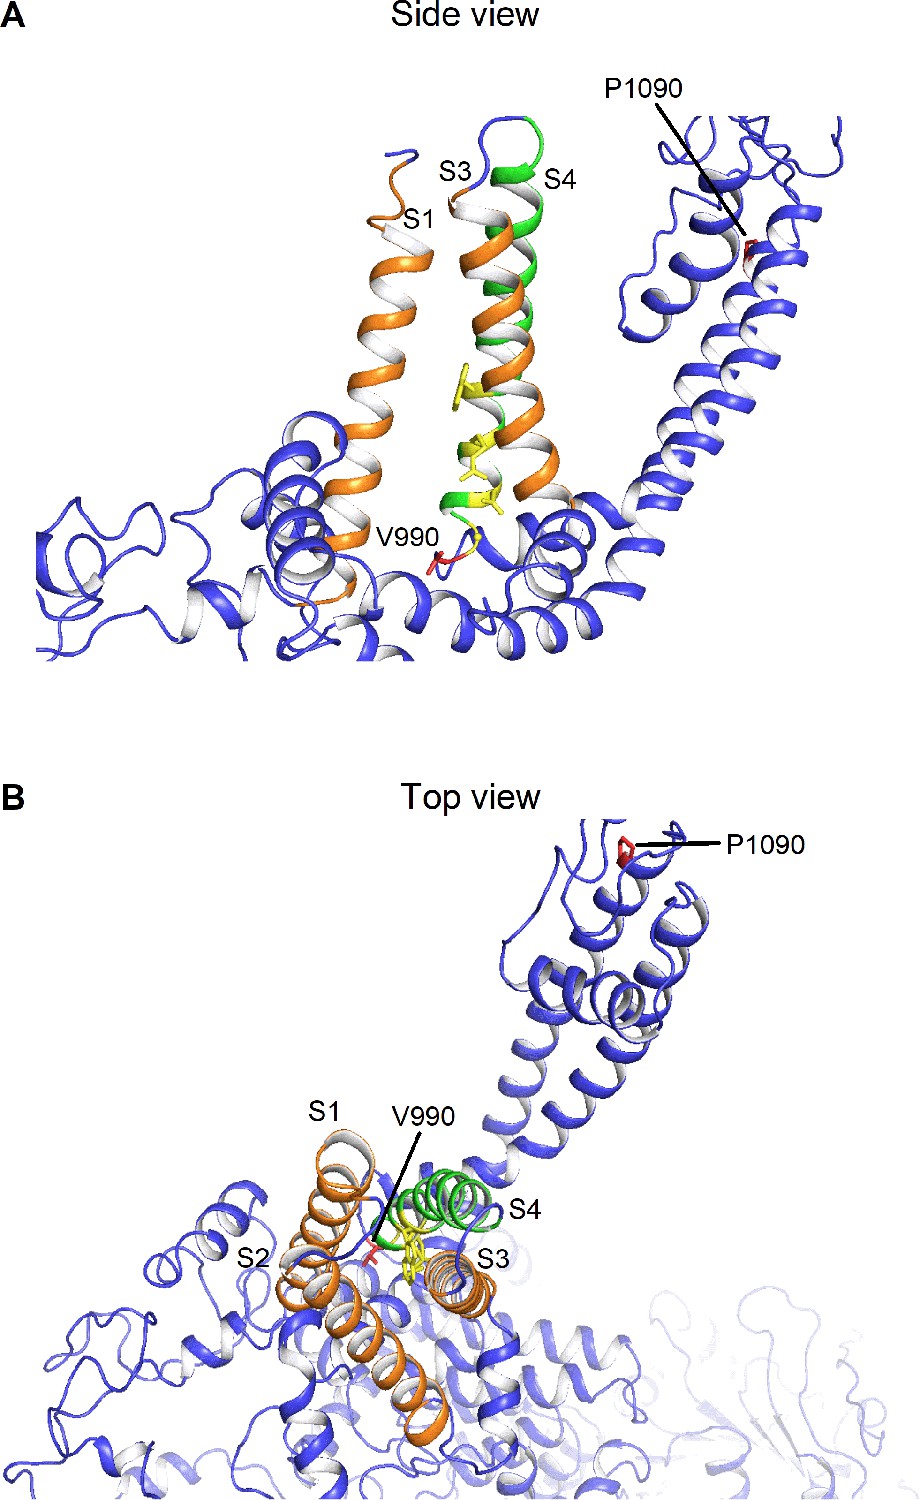
Homology model illustrating the different positions of the DEE mutations Homology model of TRPM3 based on the published cryo-EM structure of TRPM4 (pdb code: 6bcj).
(A) Side view illustrating transmembrane segment (S) S1, S3 (orange) and S4 (green). The yellow colored residues indicate the critical residues for the alternative pore (R1–R4) in S4 and in close proximity the Val at position 990 is indicated in red color. Pro 1090 in the pore domain is indicated in red. (B) Top view illustrating the positions of the different residues V990 and P1090 in red with S1-S3 represented in orange and S4 represented in green.
Figure 4
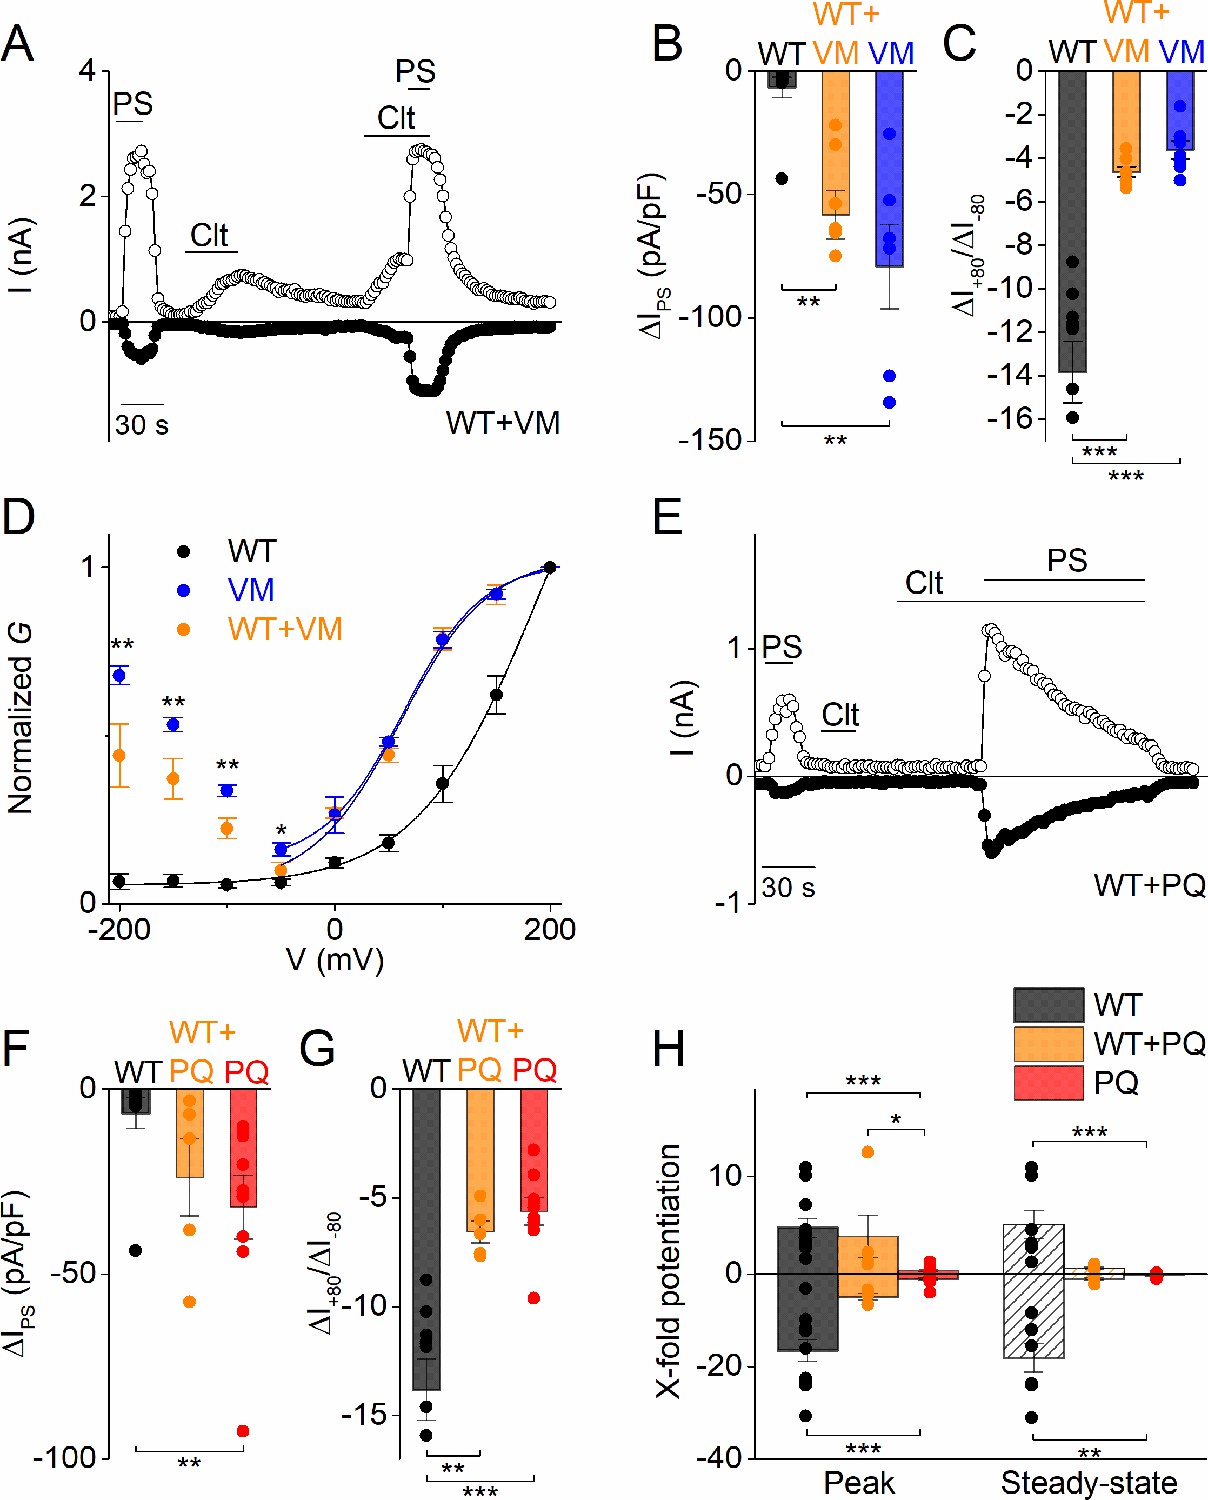
Heterozygous effects of DEE mutants.
(A) Time course of whole-cell currents at ± 80 mV recorded in HEK293T cells transiently co-transfected with WT and V990M mutant DNA (1:1) upon application of PS (40 µM), Clt (10 µM) or PS + Clt. (B) Current densities at a holding potential of −80 mV (measured with voltage ramps) upon application of PS (40 µM) for WT (n = 10) (black), VM (n = 7) (blue) or WT + VM (1:1) (n = 7) (orange). The current densities for WT versus V990M (p=0.002) and for WT versus V990M + WT (p=0.008) were significantly different. The current densities for V990M versus V990M + WT were not significantly different (p=1). (C) Same as in (B) but for current amplitude ratios of +80 mV /-80 mV. The ratios for WT versus V990M (p=2.3×10⁻⁶) and for WT versus V990M + WT (p=1×10⁻⁵) were significantly different. The ratios for V990M versus V990M + WT were not significantly different (p=0.81) (D) G-V plots for PS-activated WT TRPM3 (black), V990M (blue) and WT + V990M (1:1) (orange). Data points were obtained with a step protocol ranging from −200 mV to +200 mV with +50 mV steps; n ≥ 6 for each experiment. (E) Time course of whole-cell currents at ±80 mV recorded in HEK293T cells transiently co-transfected with WT and P1090Q (1:1) upon application of PS (40 µM), Clt (10 µM) or PS + Clt. (F) Similar as in (B) but for WT (n = 10) (black), P1090Q (n = 9) (red) or co-transfected WT + P1090Q (1:1) (n = 5) (orange). The current densities for WT versus P1090Q (p=0.004) were significantly different. The current densities for WT versus P1090Q + WT (p=0.07) and P1090Q versus P1090Q + WT were not significantly different (p=0.55) (G) Similar as in (C) but for WT (n = 10) (black), P1090Q (n = 9) (red) or co-transfected WT + P1090Q (1:1) (n = 5) (orange). The ratios for WT versus P1090Q (p=4.2×10⁻⁵) and for WT versus P1090Q + WT (p=0.001) were significantly different. The ratios for P1090Q versus P1090Q + WT were not significantly different (p=0.86). (H) X-fold potentiation at peak (+80 mV: for WT versus P1090Q (p=3.5×10⁻⁵), WT versus P1090Q + WT (p=1) and P1090Q versus P1090Q + WT (p=0.031); −80 mV: for WT versus P1090Q (p=1.4×10⁻⁵), WT versus P1090Q + WT (p=0.37) and P1090Q versus P1090Q + WT (p=0.13)) and steady-state (+80 mV: for WT versus P1090Q (p=6×10⁻⁴), WT versus P1090Q + WT (p=0.13) and P1090Q versus P1090Q + WT (p=0.35); −80 mV: for WT versus P1090Q (p=0.002), WT versus P1090Q + WT (p=0.064) and P1090Q versus P1090Q + WT (p=0.86)) conditions of Clt-potentiated PS-currents in WT (black), P1090Q (red) or co-transfected with WT + P1090Q (1:1) (orange); n ≥ 4. All bar plots are represented as mean ± SEM and scatter plot for each individual cell. Kruskal-Wallis ANOVA with Dunn’s posthoc test for panel B, F and H. One-way ANOVA with Tukey’s posthoc test for panel C and G. Mann-Whitney test was used for comparison of V990M versus V990M + WT in panel D.
Author response image 1
Tables
Key resources table
| Reagent type (species) or resource | Designation | Source or reference | Identifiers | Additional information |
|---|---|---|---|---|
| Cell line (human) | HEK293T | Dr. S Roper, University of Miami school of medicine Depart. of physiology and biophysics, 4044 Miami FL 33136 | ATCCCRL-3216 | |
| Recombinant DNA reagent | hOPMR1 (plasmid) | Received from Missouri university | Catalogue # OPM10FN00 | In pCDNA3 plasmid. |
| Recombinant DNA reagent | TRPM3 (plasmid) | Received from C Harteneck -Berlin | GenBank: AJ505026.1 | In pCDNA3/V5/his/plasmid tagged with YFP. |
| Recombinant DNA reagent | TRPM3 with V990M mutation (plasmid) | This paper | GenBank: AJ505026.1 modified by V990M mutation | In pCDNA3/V5/his/plasmid tagged with YFP |
| Recombinant DNA reagent | TRPM3 with P1090Q mutation (plasmid) | This paper | GenBank: AJ505026.1 modified by P1090Q mutation | In pCDNA3/V5/his/plasmid tagged with YFP |
| Commercial assay or kit | TransIT-293 Transfection Reagent | Mirus | Catalogue # MIR 2700 | |
| Chemical compound, drug | Pregnenolone Sulfate | Sigma-Aldrich | Catalogue # P162 | TRPM3 agonist |
| Chemical compound, drug | DAMGO | Sigma-Aldrich | Catalogue # E7384 | µ-opioid receptor agonist |
| Chemical compound, drug | Isosakuranetin | Carl Roth | Catalogue # 7498.1 | TRPM3 inhibitor |
| Chemical compound, drug | Clotrimazole | Sigma-Aldrich | Catalogue # C6019 | TRPM3 modulator |
| Chemical compound, drug | Primidone | Sigma-Aldrich | Catalogue # P7295 | TRPM3 inhibitor |
| Chemical compound, drug | Fura-2-acetoxymethyl ester | Alexis Biochemicals | Catalogue # ENZ-52006 | Calcium indicator |
| Software, algorithm | OriginPro 8.6 | OriginLab Corporation, USA | RRID:SCR_014212 | Data analysis and statistical analysis |
| Software, algorithm | IgorPro 6.2 | WaveMetrics, USA | RRID:SCR_000325 | Data analysis |
| Software, algorithm | ImageJ | https://imagej.net/ | RRID:SCR_003070 | Data analysis |
| Software, algorithm | NIS-Elements | Nikon | RRID:SCR_014329 | Acquisition Ca2+-imaging data |
| Software, algorithm | PatchMasterPro | HEKA Elektronik, Lambrecht, Germany | Acquisition patch clamp data |
Additional files
Download links
A two-part list of links to download the article, or parts of the article, in various formats.
Downloads (link to download the article as PDF)
Open citations (links to open the citations from this article in various online reference manager services)
Cite this article (links to download the citations from this article in formats compatible with various reference manager tools)
Gain of channel function and modified gating properties in TRPM3 mutants causing intellectual disability and epilepsy
eLife 9:e57190.
https://doi.org/10.7554/eLife.57190


