WDR90 is a centriolar microtubule wall protein important for centriole architecture integrity
- University of Geneva, Department of Cell Biology, Sciences III, Switzerland
- Laboratory of Biomolecular Research, Division of Biology and Chemistry, Paul Scherrer Institut, Switzerland
- Swiss Light Source, Paul Scherrer Institut, Switzerland
- Institute for Integrative Biology of the Cell (I2BC), CEA, CNRS, Univ. Paris Sud, Université Paris-Saclay, France
- Biozentrum, University of Basel, Switzerland
Figures
Figure 1

POC16/WDR90 is a conserved central core microtubule wall component.
(A) 3D representation of a centriole highlighting the centriolar microtubule wall in light grey and the inner scaffold in yellow. (B) Cryo-EM image of the central core of Paramecium tetraurelia centrioles from which a microtubule triplet map has been generated (Le Guennec et al., 2020). Schematic representation of the inner junction (IJ) between A- and B-microtubules connecting the inner scaffold. (C) Schematic localization of POC16/WDR90 proteins within the IJ based on its similarity to FAP20. Purple: A-microtubule, green: B microtubule, yellow/gold: inner scaffold and stem, orange: DUF667 domain positioned at the IJ. (D) Isolated U-ExM expanded Chlamydomonas centriole stained for POC16 (yellow) and tubulin (magenta), lateral view. Scale bar: 100 nm. (E) Respective lengths of tubulin and POC16 based on D. Average +/- SD: Tubulin: 495 nm +/- 33, POC16: 204 nm +/- 53, n = 46 centrioles from three independent experiments. (F) POC16 length coverage and positioning: 41% +/- 11, n = 46 centrioles from three independent experiments. (G) Expanded isolated Chlamydomonas centriole stained for POB15 (green) and tubulin (magenta), lateral view. Scale bar: 100 nm. (H) Respective length of tubulin and POB15 based on G. Average +/- SD: tubulin = 497 nm +/- 33, POB15 = 200 nm +/- 30, n = 39 centrioles from three independent experiments. (I) POB15 length coverage and positioning: 40% +/- 6, n = 39 centrioles from three independent experiments. (J) Expanded human U2OS centriole stained for WDR90 (yellow) and tubulin (magenta), lateral views. (K) Respective lengths of tubulin and WDR90 based on J. Average +/- SD: Tubulin: 432 nm +/- 62, WDR90: 200 nm +/- 80, n = 35 from three independent experiments. (L) WDR90 length coverage and positioning: 46% +/- 17, n = 35 from three independent experiments. (M) Isolated U-ExM expanded Chlamydomonas centriole stained for tubulin (magenta) and POC16 (yellow) or POB15 (green), top views. Scale bar: 100 nm. (N) Distance between the maximal intensity of tubulin and the maximal intensity of POC16 (orange) or POB15 (green) based on M. Average +/- SD: POC16 = 0 nm +/- 8, POB15 = 12 nm +/- 7. n > 75 measurements/condition from 30 centrioles from three independent experiments. EXT: exterior or the centriole, INT: interior. Mann-Whitney test ****p<0.0001. (O) Expanded U2OS centriole stained for WDR90 (yellow) and tubulin (magenta), or for core proteins POC1B (blue), FAM161A (green), POC5 (yellow) or Centrin (white). Data set from Le Guennec et al., 2020, top views, Scale bars: 100 nm. (P) Distance between the maximal intensity of tubulin and the maximal intensity of WDR90 (orange) or POC1B (blue), FAM161A (green), POC5 (yellow) or Centrin (grey) based on O. Average +/- SD: WDR90 = 2 nm +/- 12, POC1B = 15 nm+/-8, FAM161A = 22 nm+/-5, POC5 = 27 nm +/- 6 and Centrin = 28 nm+/-9. n = 45 measurements/condition from 15 to 30 centrioles per condition from three independent experiments. One-way ANOVA and Holm-Sidak’s multiple comparisons ns p>0.05, **p<0.01, ***p<0.001, ****p<0.0001. (Q) Position of WDR90 relative to the four inner scaffold components placed on the cryo-EM map of the Paramecium central core region (top view) (adapted from Le Guennec et al., 2020).
Figure 2 with 3 supplements
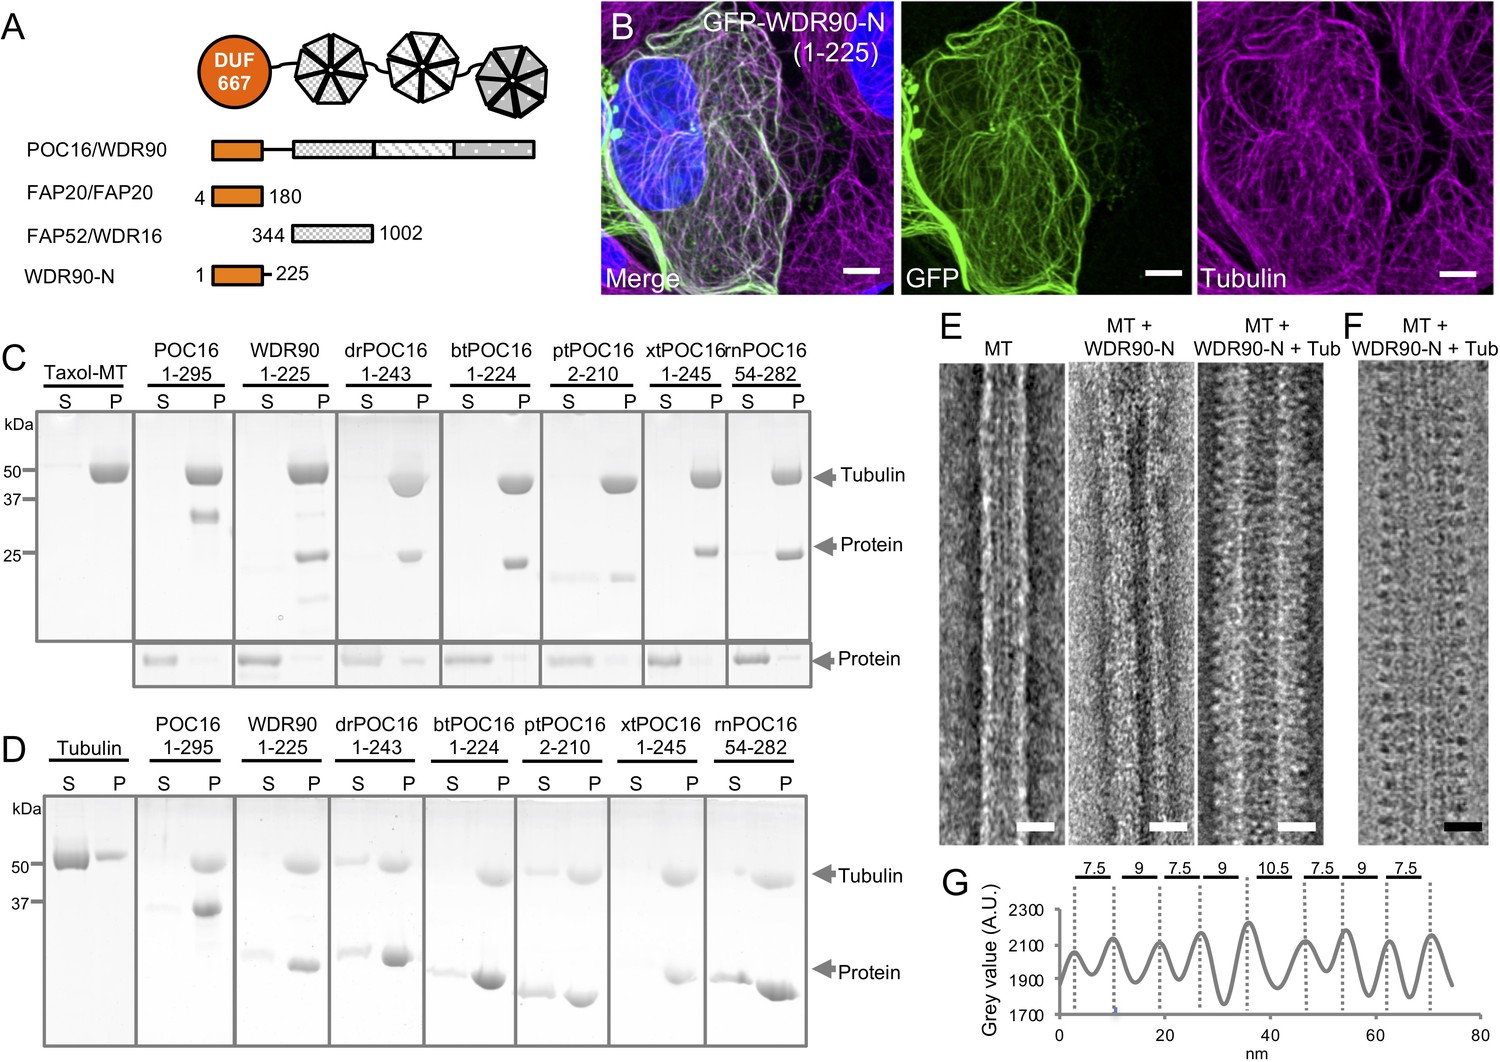
WDR90/POC16-DUF667 directly binds both microtubules and tubulin.
(see also Figure 2—figure supplements 1–3). (A) Schematic of WDR90/POC16 conservation domains with the Chlamydomonas cilia proteins FAP20 and FAP52/WDR16. DUF667 domain is in orange and WD40 repeats are in grey. (B) Human U2OS cells transiently overexpressing GFP-WDR90-N (1-225) stained for GFP (green) and tubulin (magenta). Scale bar: 5 µm. (C, D) Coomassie-stained SDS-PAGE of pelleting assays performed in vitro with taxol-stabilized microtubules (C), and free tubulin (D), in the presence of different recombinant POC16/WDR90-DUF667 protein orthologs (related to Figure 2—figure supplement 1A, B). The solubility of proteins alone was assessed in parallel to the microtubule-pelleting assay. All tested proteins were soluble under the tested condition (bottom panel). (E) Electron micrographs of negatively stained taxol-stabilized microtubules alone (MT) or subsequently incubated with recombinant WDR90-N (1-225) alone (MT + WDR90-N) or in combination with tubulin (MT + WDR90-N + Tub). Scale bar: 25 nm (F) Cryo-electron micrograph of taxol-stabilized microtubules subsequently incubated with recombinant WDR90-N (1-225) and tubulin (MT + WDR90-N + Tub). Scale bar: 25 nm (G) Periodicity of complexed WDR90-N (1-225)-tubulin oligomers bound to the microtubule shown in (F).
Figure 2—figure supplement 1
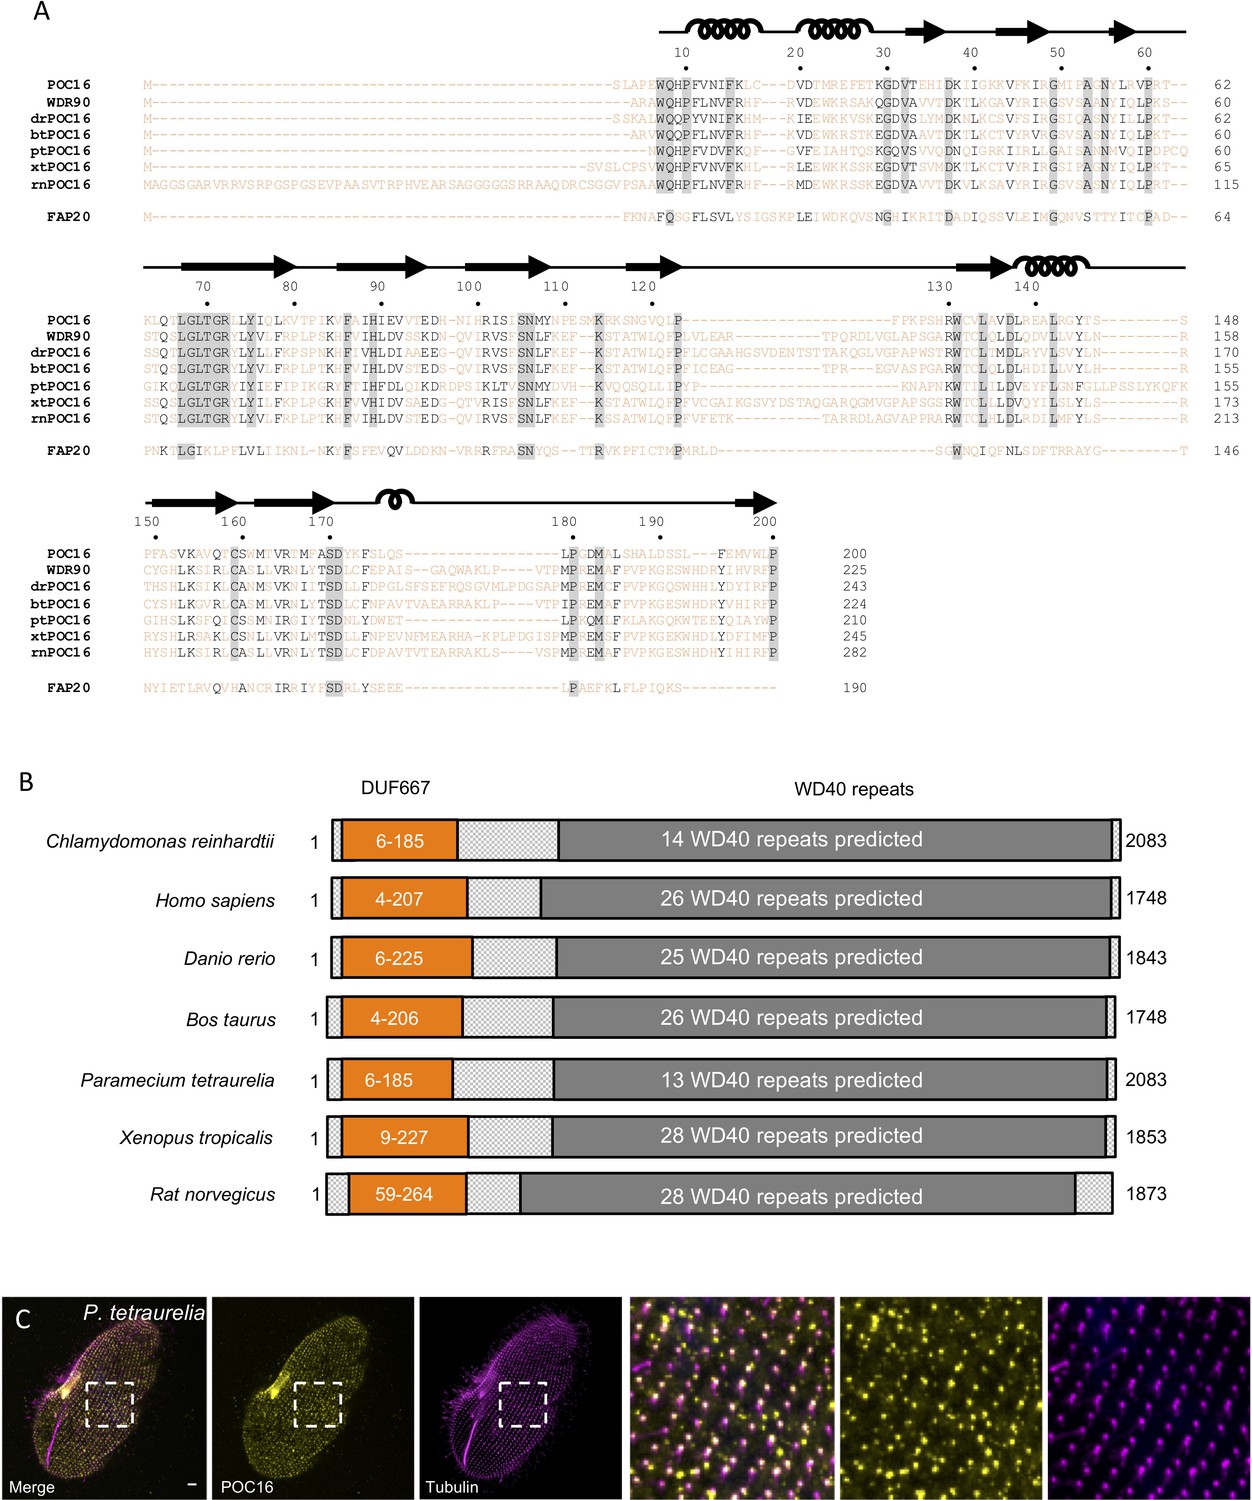
POC16 conservation across species.
(A) POC16 orthologs DUF667 domain amino acids sequence alignment from seven different species: Chlamydomonas reinhardtii POC16(1-200); homo sapiens WDR90(1-225), Danio rerio drPOC16(1-243), Bovine taurus btPOC16(1-224), Paramecium tetraurelia ptPOC16(1-210), Xenopus tropicalis xtPOC16(1-245) and Rat norvegicus rtPOC16(1-282). Note also below the alignment with Chlamydomonas reinhardtii FAP20. The secondary structures α-helices and β-strand are indicated on top of the amino acid sequences. (B) POC16 orthologs domain mapping and conservation. Orange: DUF667 domain. Dark grey: WD40 repeats. (C) Paramecium tetraurelia cell fixed and stained for ptPOC16 (yellow) and tubulin (1D5) (magenta), showing that ptPOC16 is a centriolar component. Scale bare: 10 µm.
Figure 2—figure supplement 2
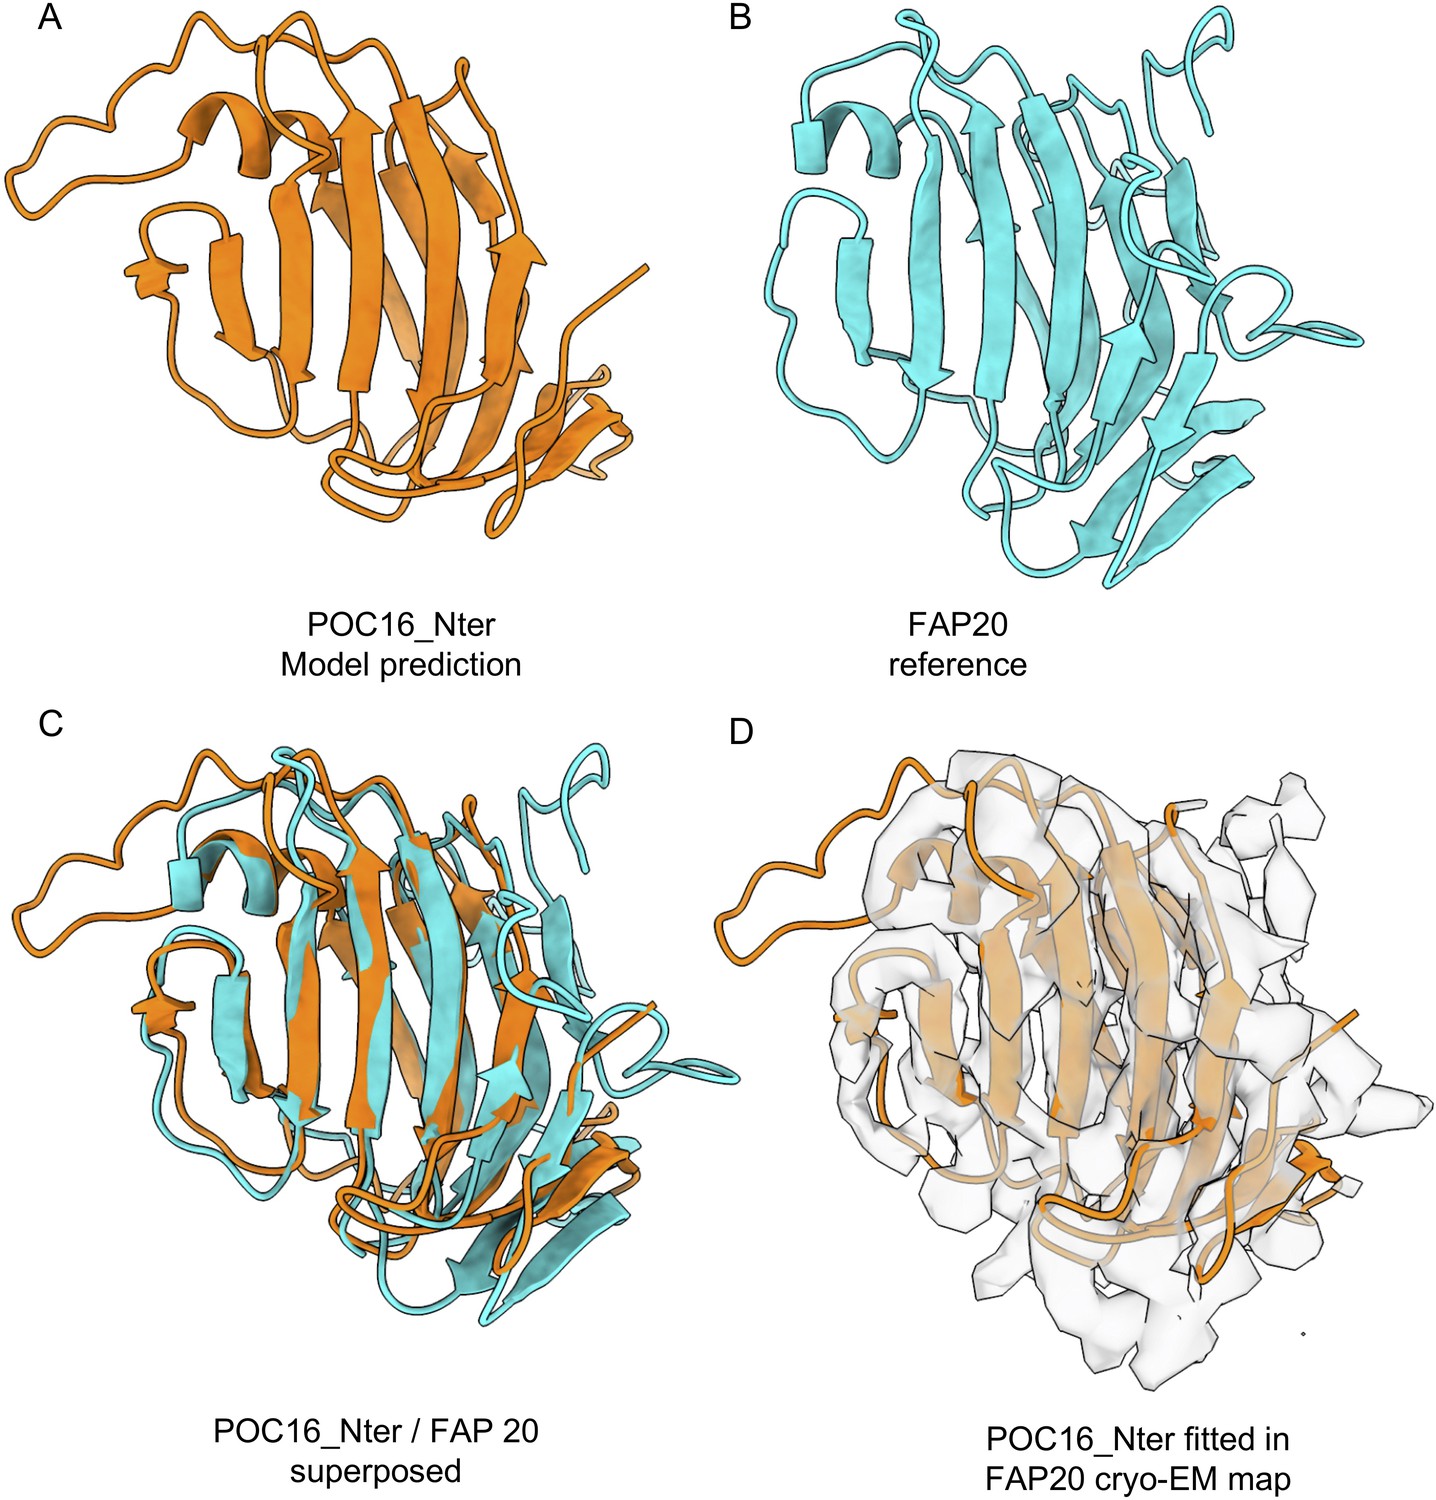
Model prediction of POC16 Nter.
(A) POC16 3D model and (B) FAP20 reference structure model (Khalifa et al., 2020). (C) Fitting of POC16 against FAP20 yielding a RMSD value of 1.6 Angs. (D) Fitting of the POC16 model excluding the flexible loops in the FAP20 cryo-EM electron density map.
Figure 2—figure supplement 3

POC16 and WDR90 bind microtubules.
(A) Human U2OS cells transiently overexpressing GFP-POC16(1-295) stained for POC16 (green) and tubulin (magenta). Scale bars for panels A-E: 5 µm. (B) Human U2OS cells transiently overexpressing at high level mCherry-WDR90-N(1-225), stained for tubulin (green) and mCherry (magenta). (C) Human U2OS cells transiently overexpressing at low level mCherry-WDR90-N(1-225), fixed after 1 hr of cold shock treatment and stained for tubulin (green) and mCherry (magenta). (D) Human U2OS cells transiently overexpressing at high level mCherry-WDR90-N(1-225), fixed after 1 hr of cold shock treatment and stained for tubulin (green) and mCherry (magenta). (E) Human U2OS cells transiently overexpressing GFP-WDR90(FL) stained for GFP (green) and tubulin (magenta). Arrowhead indicates WDR90-decorated microtubules. (F) Electron micrograph of negatively stained in vitro taxol-stabilized microtubules. Scale bar: 25 nm. (G) Electron micrograph of negatively stained in vitro taxol-stabilized microtubules incubated with recombinant POC16(1-295) and free tubulin. Scale bar: 25 nm.
Figure 3 with 2 supplements
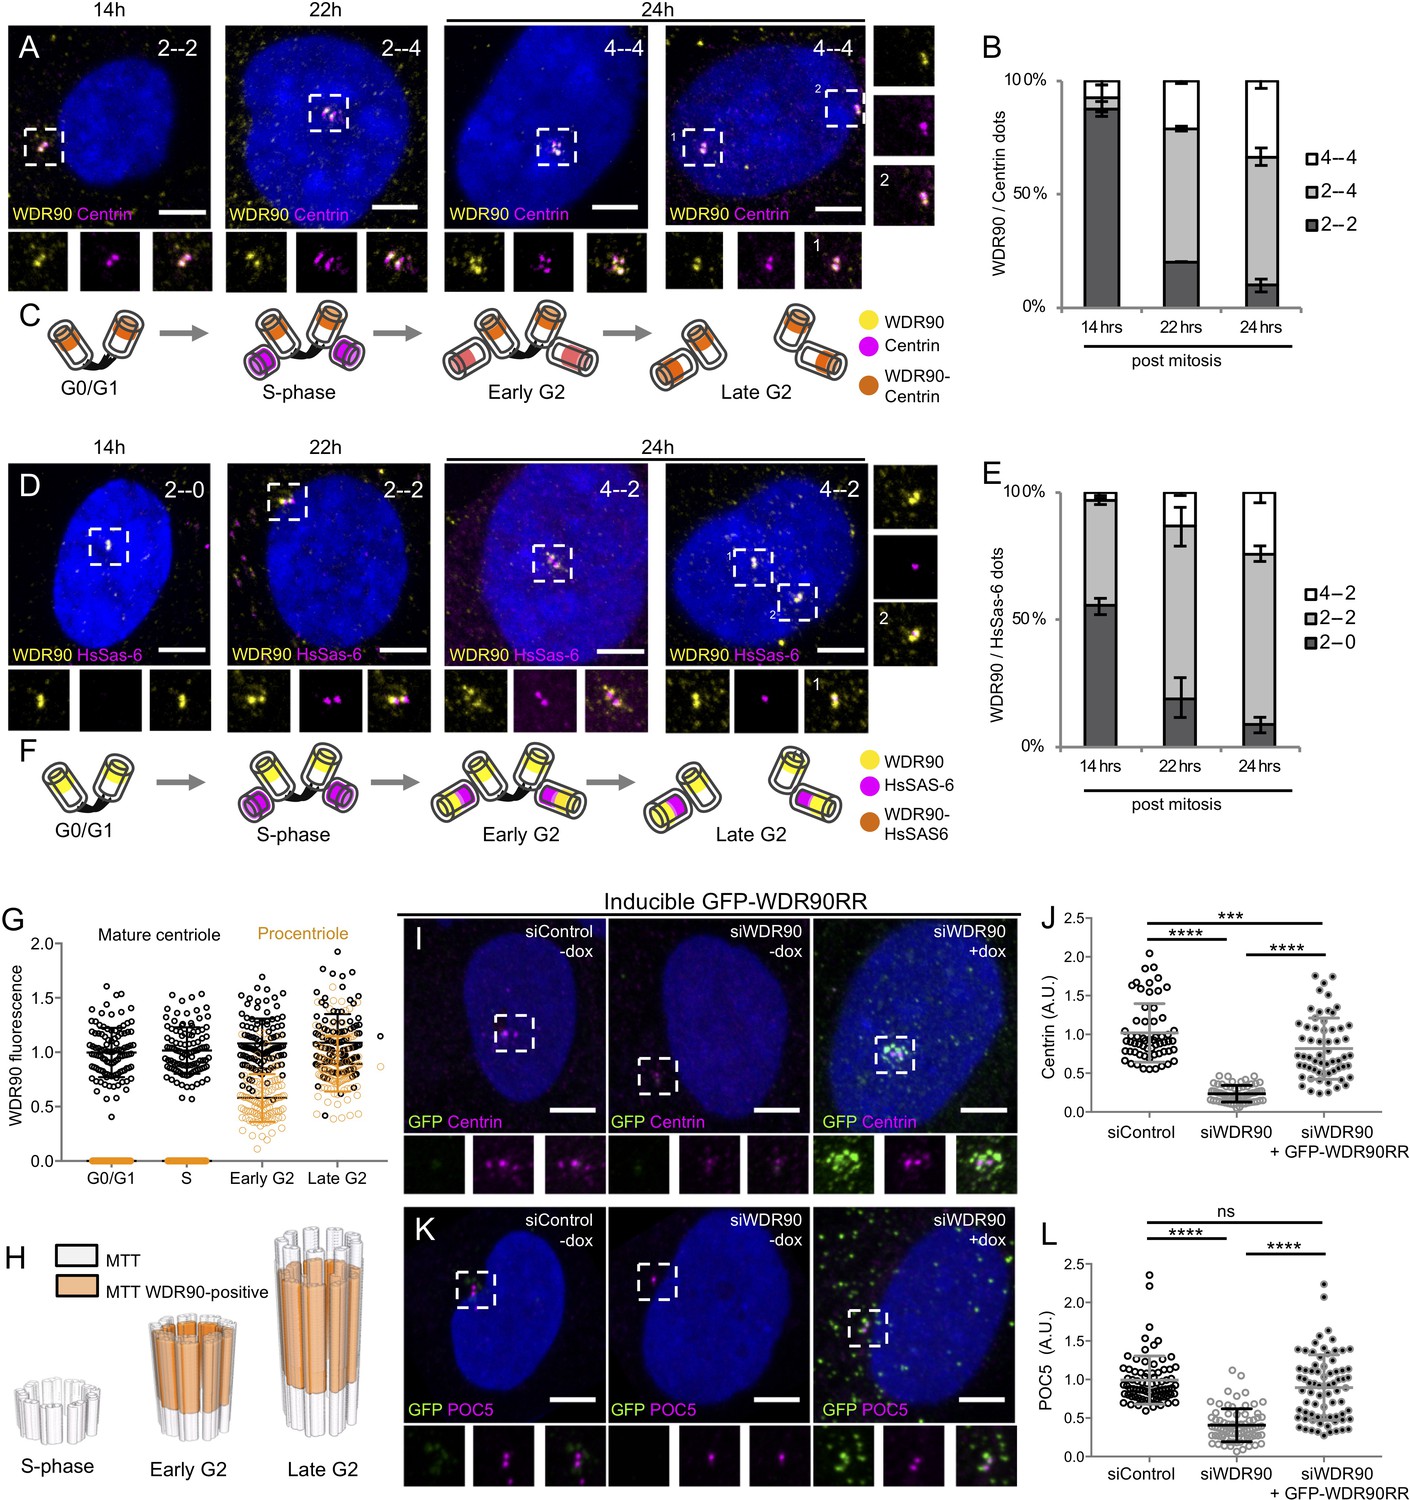
WDR90 is recruited in G2 and is important for Centrin and POC5 recruitment to centrioles (See also Figure 3—figure supplements 1 and 2).
(A) Human RPE1 p53- cells synchronized by mitotic shake-off, fixed at different time points for different cell-cycle stages (related to Figure 3—figure supplement 1A, B) and stained with WDR90 (yellow) and Centrin (magenta). DNA is in blue. Dotted white squares correspond to insets. Numbers on the top right indicate respectively WDR90 and Centrin numbers of dots. Scale bar: 5 µm. (B) Percentage of cells with the following numbers of WDR90/Centrin dots based on A, n = 300 cells/condition from three independent experiments. Average +/- SD: refer to Figure 3—source data 1. (C) Model for WDR90 and Centrin incorporation during centriole biogenesis based on A. (D) Human RPE1 p53- cells synchronized by mitotic shake-off, fixed at different time points for different cell-cycle stages and stained with WDR90 and HsSAS-6. Scale bar: 5 µm. (E) Percentage of cells with the following numbers of WDR90 and HsSAS-6 based on D, n = 300 cells/condition from three independent experiments. Average +/- SD: refer to Figure 3—source data 2. (F) Model for WDR90 and HsSAS-6 incorporation during centriole biogenesis based on D. (G) WDR90 fluorescence intensity at centrioles according to cell cycle progression, n = 45 cells/condition from three independent experiments. Black circle represents WDR90 at mature centrioles, orange circle represents WDR90 at procentrioles. (H) 3D Schematic representation of WDR90 incorporation during centriole biogenesis according to cell cycle progression based on G. (I, K) Human U2OS GFP-WDR90 RNAi-resistant version (GFP-WDR90RR) inducible stable cell line treated with control or wdr90 siRNA and stained for either GFP and Centrin (I) or GFP and POC5 (K) Dotted white squares indicate insets. - and + dox indicates induction of GFP-WDR90RR expression. Scale bar: 5 µm. (J) Centrosomal Centrin fluorescence intensity based on I, n = 60 cells/condition from three independent experiments. Average +/- SD (A.U.): Control – dox = 1.02 +/- 0.4, siWDR90 – dox = 0.23+/- 0.1, siWDR90 + dox = 0.82 +/- 0.4. Statistical significance assessed by one-way ANOVA and Holm-Sidak’s multiple comparisons (***p<0.001, ****p<0.0001). (L) Centrosomal POC5 fluorescence intensity based on K, n = 75 cells/condition from three independent experiments. Average +/- SD (A.U.): Control – dox = 0.99 +/- 0.3, siWDR90 – dox = 0.41+/- 0.2, siWDR90 + dox = 0.89 +/- 0.5. One-way ANOVA and Holm-Sidak’s multiple comparisons (ns p>0.05, ****p<0.0001).
-
Figure 3—source data 1
Percentage of cells with the following number of dots/cell respectively for WDR90 and Centrin.
- https://cdn.elifesciences.org/articles/57205/elife-57205-fig3-data1-v1.docx
-
Figure 3—source data 2
Percentage of cells with the following number of dots/cell respectively for WDR90 and HsSAS-6.
- https://cdn.elifesciences.org/articles/57205/elife-57205-fig3-data2-v1.docx
Figure 3—figure supplement 1
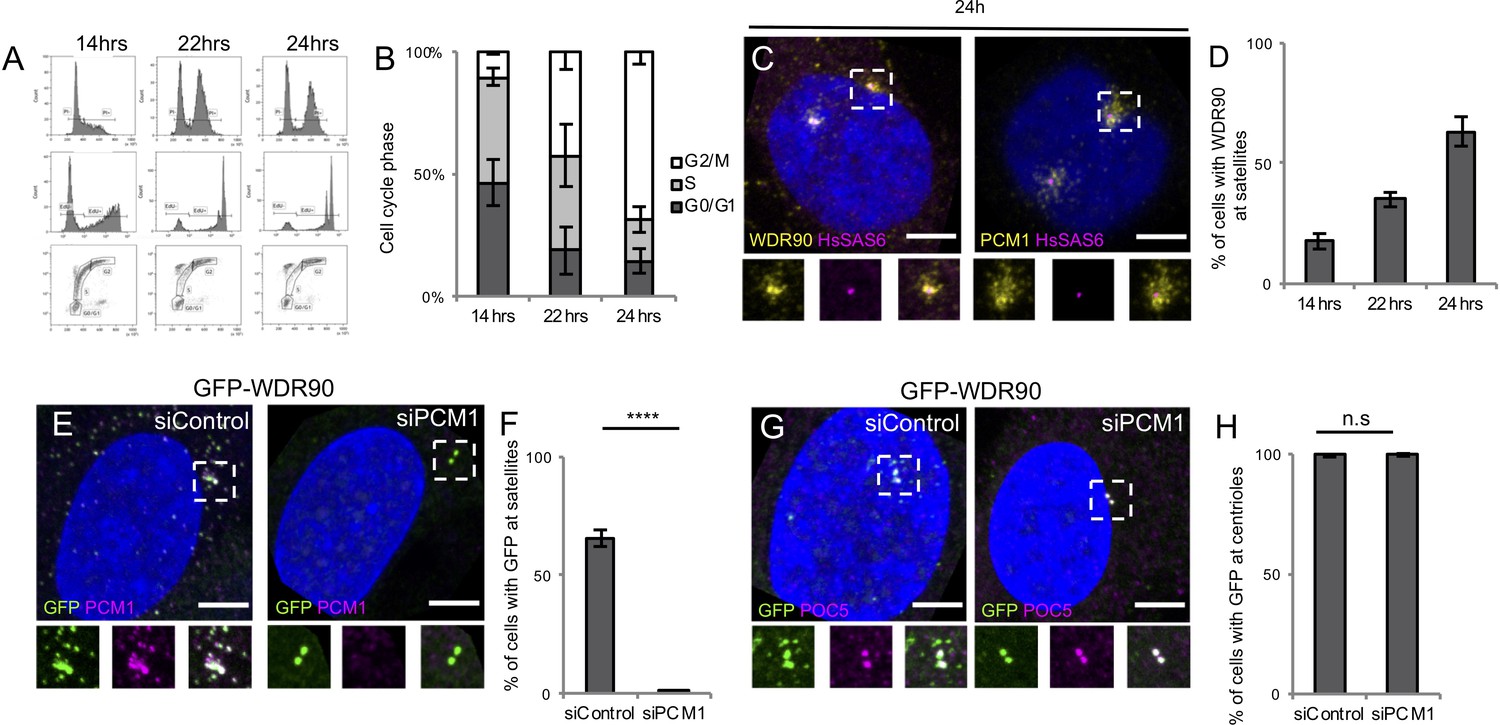
WDR90 is a satellite and centriolar protein.
(A) FACS profiles of RPE1 p53- cells at different time point post mitotic shake-off, plotted based on propidium iodide (PI) and 5-ethynyl-2´-deoxyuridine (EdU) content. Related to Figure 3(A–E). (B) Percentage of cells in G0/G1, S or G2/M phase based on A, n = 25,000 cells/condition from three independent experiments. Average +/- SD: refer to Figure 3—figure supplement 1—source data 1. (C) Human RPE1 p53- fixed 24 hr post-mitotic shake off and stained for WDR90 (yellow) and HsSAS-6 (magenta) or PCM1 (yellow) and HsSAS-6 (magenta). DNA is in blue. Dotted white squares indicate insets. Scale bar: 5 µm. (D) Percentage of cells displaying WDR90 satellite pattern based on C, n = 150 cells/condition from three independent experiments. Average +/- SD: 14 hr: 18% +/- 3, 22 hr: 35% +/- 3, 24 hr: 63% +/- 6. (E) Human U2OS cells expressing GFP-WDR90 treated with control or pcm1 siRNA and stained for GFP and PCM1. Dotted white squares indicate insets. Scale bar: 5 µm. (F) Percentage of cells with GFP-WDR90 at satellites based on F, n = 300 cells/condition from three independent experiments Average +/- SD: siControl: 66% +/- 4, siPCM1: 1% +/- 1. Welch T-test ****p<0.0001. (G) Human U2OS cells expressing GFP-WDR90 treated with control or pcm1 siRNA and stained for GFP and POC5. Scale bar: 5 µm. Dotted white squares indicate insets. (H) Percentage of cells with GFP-WDR90 at centrioles based on G, n = 300 cells/condition from three independent experiments Average +/- SD: siControl: 99% +/- 1, siPCM1: 100% +/- 1. Welch T-test p=0.5185.
-
Figure 3—figure supplement 1—source data 1
Percentage of cells in each phase of the cell cycle according to post-mitotic time point.
- https://cdn.elifesciences.org/articles/57205/elife-57205-fig3-figsupp1-data1-v1.docx
Figure 3—figure supplement 2
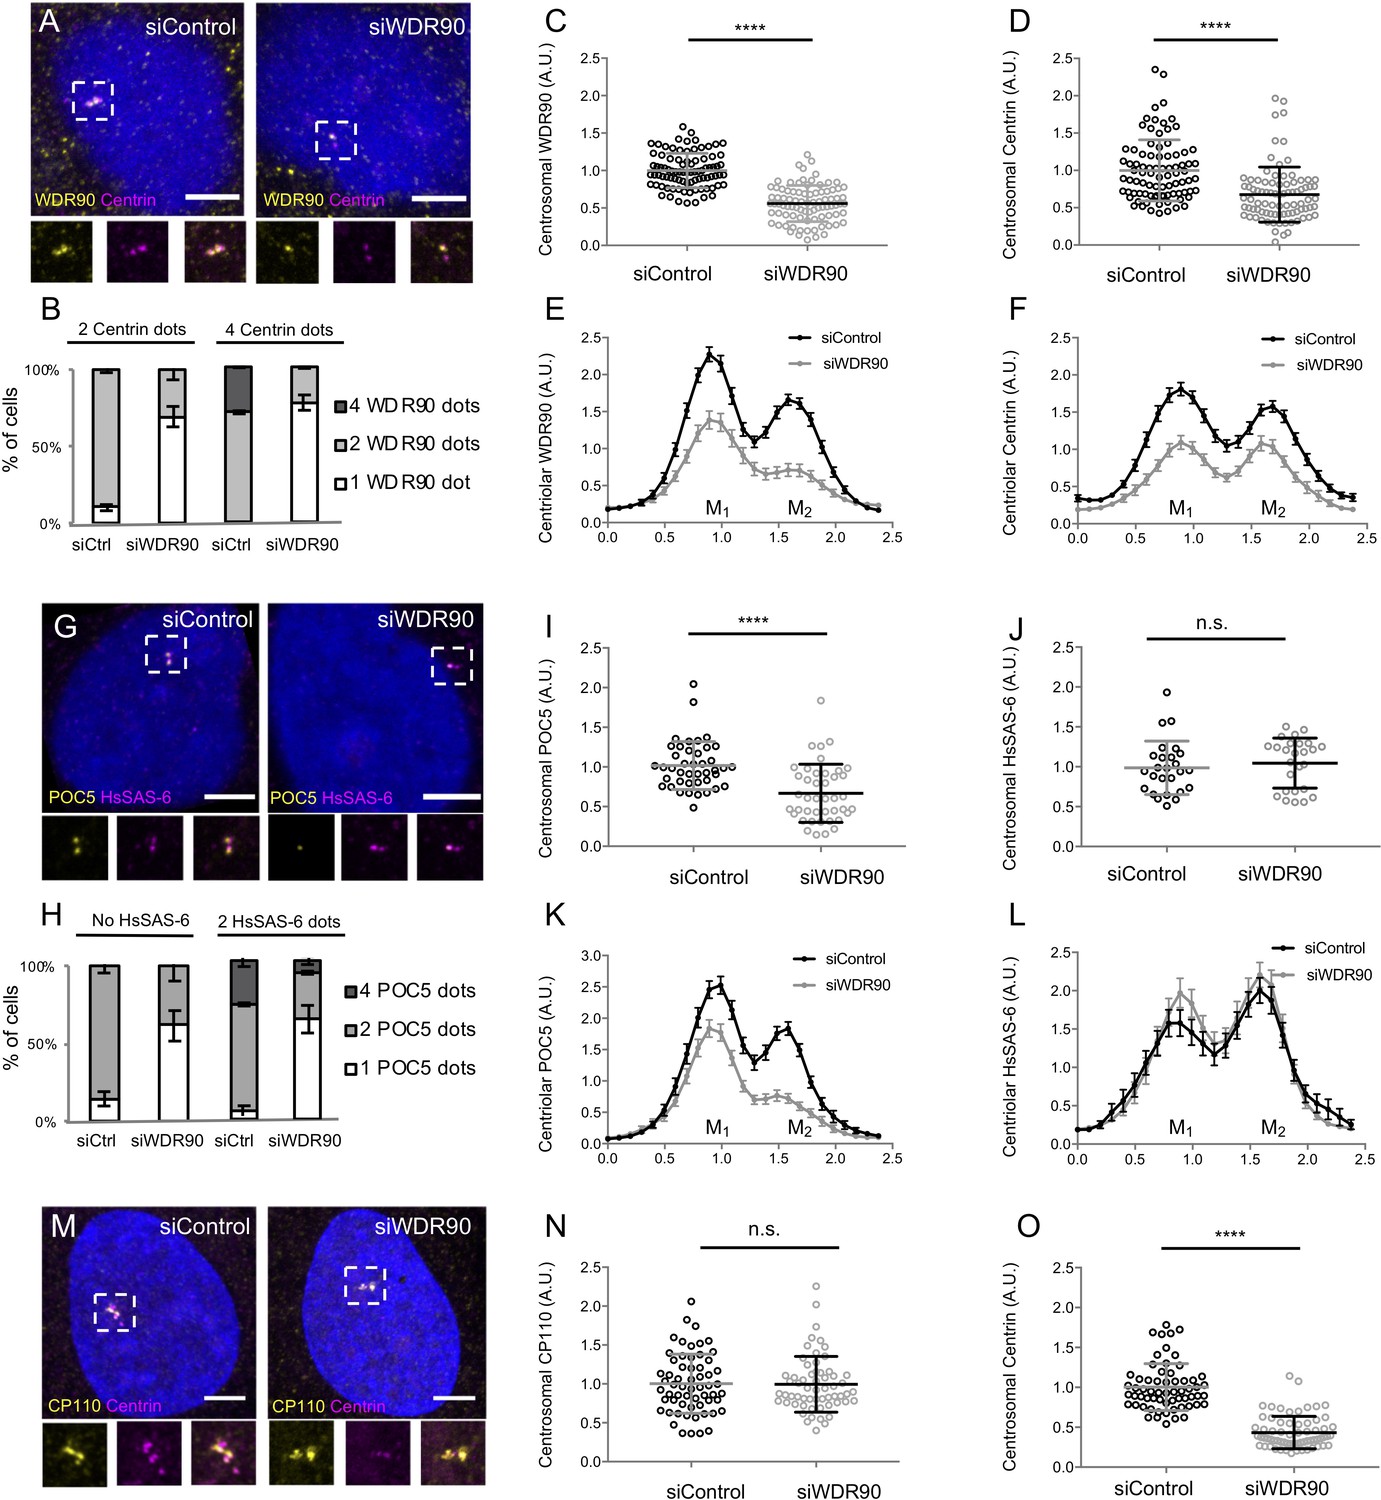
Depletion of WDR90 impairs Centrin and POC5 localization at centrioles.
(A) Human U2OS cell treated with either control or wdr90 siRNA and stained for WDR90 (yellow) and Centrin (magenta). DNA is in blue. Dotted white squares indicate insets. Scale bar: 5 µm. (B) Percentage of cells with the following number of WDR90 dots according to the number of Centrin dots per cell based on A, n = 150 cells/condition from three independent experiments. Average +/- SD: refer to Figure 3—figure supplement 2—source data 1 (C) WDR90 centrosomal intensity based on A, n = 90 cells/condition from three independent experiments. Average +/- SD: siControl: 1 +/- 0.2 (A.U.), siWDR90: 0.56 +/- 0.2 (A.U.). Welch T-test ****p<0.0001. (D) Centrin centrosomal intensity based on A, n = 90 cells/condition from three independent experiments. Average +/- SD: siControl 1 +/- 0.4 (A.U.), siWDR90: 0.68 +/- 0.4 (A.U). Mann-Whitney ****p<0.0001. (E) Plot profiles of WDR90 centriolar intensity based on A, n = 90 cell/condition from three independent experiments. M1 and M2 respectively refer to each mature centriole within pairs. (F) Plot profiles of Centrin centriolar intensity based on A, n = 90 cells/condition from three independent experiments. (G) Human U2OS cell treated with either control or wdr90 and stained for POC5 (yellow) and HsSAS-6 (magenta). DNA is in blue. Dotted white squares indicate insets. Scale bar: 5 µm. (H) Percentage of cells with the following numbers of POC5 dots according to the number of HsSAS-6 dots per cell based on G, n = 150 cells/condition from three independent experiments. Average +/- SD: refer to Figure 3—figure supplement 2—source data 2. (I) POC5 centrosomal intensity based on G, n = 45 cells/condition from three independent experiments. Average +/- SD: siControl 1 +/- 0.3(A.U.), siWDR90: 0.67 +/- 0.4(A.U). Mann-Whitney ****p<0.0001. (J) HsSAS-6 centrosomal intensity based on G, n = 30 cells/condition from three independent experiments. Average +/- SD: siControl 0.99 +/- 0.3 (A.U.), siWDR90: 1 +/- 0.3 (A.U). Mann-Whitney p=0.2551. (K) Plot profiles of POC5 centriolar intensity based on G, n = 45 cells/condition from three independent experiments. (L) Plot profiles of HsSAS-6 centriolar intensity based on G, n = 30 cells/condition from three independent experiments. (M) Human U2OS cell treated with either control or wdr90 siRNA and stained for CP110 (yellow) and Centrin (magenta). DNA is in blue. Dotted white squares indicate insets. Scale bar: 5 µm. (N) CP110 centrosomal intensity based on M, n = 60 cells/condition from three independent experiments. Average +/- SD: siControl 1 +/- 0.4 (A.U.), siWDR90: 0.99 +/- 0.4 (A.U). Mann-Whitney p=0.7756. (O) Centrin centrosomal intensity based on M, n = 55 cells/condition from three independent experiments. Average +/- SD: siControl 1 +/- 0.3 (A.U.), siWDR90: 0.4 +/- 0.2 (A.U). Mann-Whitney ****p<0.0001. Note that Centrin intensity served as an internal control for the efficient depletion of WDR90 by siRNA in this experiment.
-
Figure 3—figure supplement 2—source data 1
Percentage of cells displaying 0, 1, 2 or 4 dots of WDR90 based on the number of Centrin dots in U2OS cells treated with control or wdr90 siRNA.
- https://cdn.elifesciences.org/articles/57205/elife-57205-fig3-figsupp2-data1-v1.docx
-
Figure 3—figure supplement 2—source data 2
Percentage of cells displaying 0, 1, 2 or 4 dots of POC5 based on the number of HsSas-6 dots in U2OS cells treated with control or wdr90 siRNA.
- https://cdn.elifesciences.org/articles/57205/elife-57205-fig3-figsupp2-data2-v1.docx
Figure 4 with 1 supplement
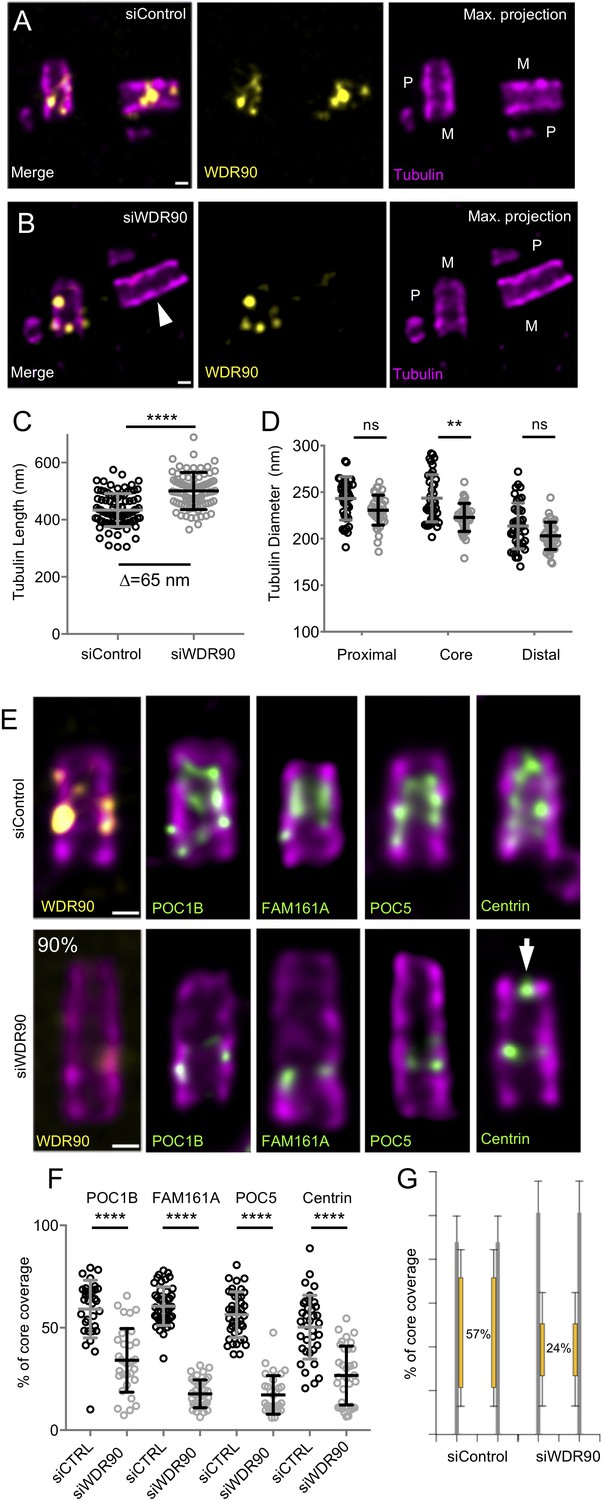
WDR90 is crucial for inner scaffold components localization (see also Figure 4—figure supplement 1).
(A, B) Expanded centrioles from S-phase U2OS cells treated with either control (A) or wdr90 siRNA (B) stained for tubulin (magenta) and WDR90 (yellow). M stands for mature centriole and P for procentriole. White arrowhead points to WDR90-depleted centriole. Scale bar: 100 nm. (C) Tubulin length in nm, n = 90 centrioles/condition from three independent experiments. Average +/- SD: siControl = 434 nm +/- 58, siWDR90 = 500 nm +/- 65. Mann-Whitney p<0.0001. Note that only efficiently depleted centrioles were counted. (D) Tubulin diameter measured in the proximal, central core and distal regions of expanded centrioles in control (black circles) and wdr90 siRNA (siWDR90, grey circles). n = 42 and 43 centrioles for siControl and siWDR90 from two independent experiments, respectively. Averages +/- SD: refer to Figure 4—source data 1. One-way ANOVA and Holm-Sidak’s multiple comparisons (ns p<0.05, **p<0.01). (E) Expanded U2OS centrioles treated with either control or wdr90 siRNA stained for tubulin (magenta) and WDR90 (yellow) or POC1B, FAM161A, POC5 or Centrin (inner scaffold components: green). White arrow indicates the distal localization of Centrin. Scale bar: 100 nm. (F) Inner scaffold protein length expressed as a percentage of the total tubulin length, n > 30 centrioles/condition from three independent experiments. Average +/- SD: refer to Figure 4—source data 2. One-way ANOVA and Holm-Sidak’s multiple comparisons (****p<0.0001). (G) Average core length coverage. Average +/- SD: siControl = 57% +/- 13; siWDR90 = 24% +/- 14.
-
Figure 4—source data 1
Diameter at proximal, core and distal region of the centriole.
- https://cdn.elifesciences.org/articles/57205/elife-57205-fig4-data1-v1.docx
-
Figure 4—source data 2
Inner scaffold proteins coverage.
- https://cdn.elifesciences.org/articles/57205/elife-57205-fig4-data2-v1.docx
Figure 4—figure supplement 1
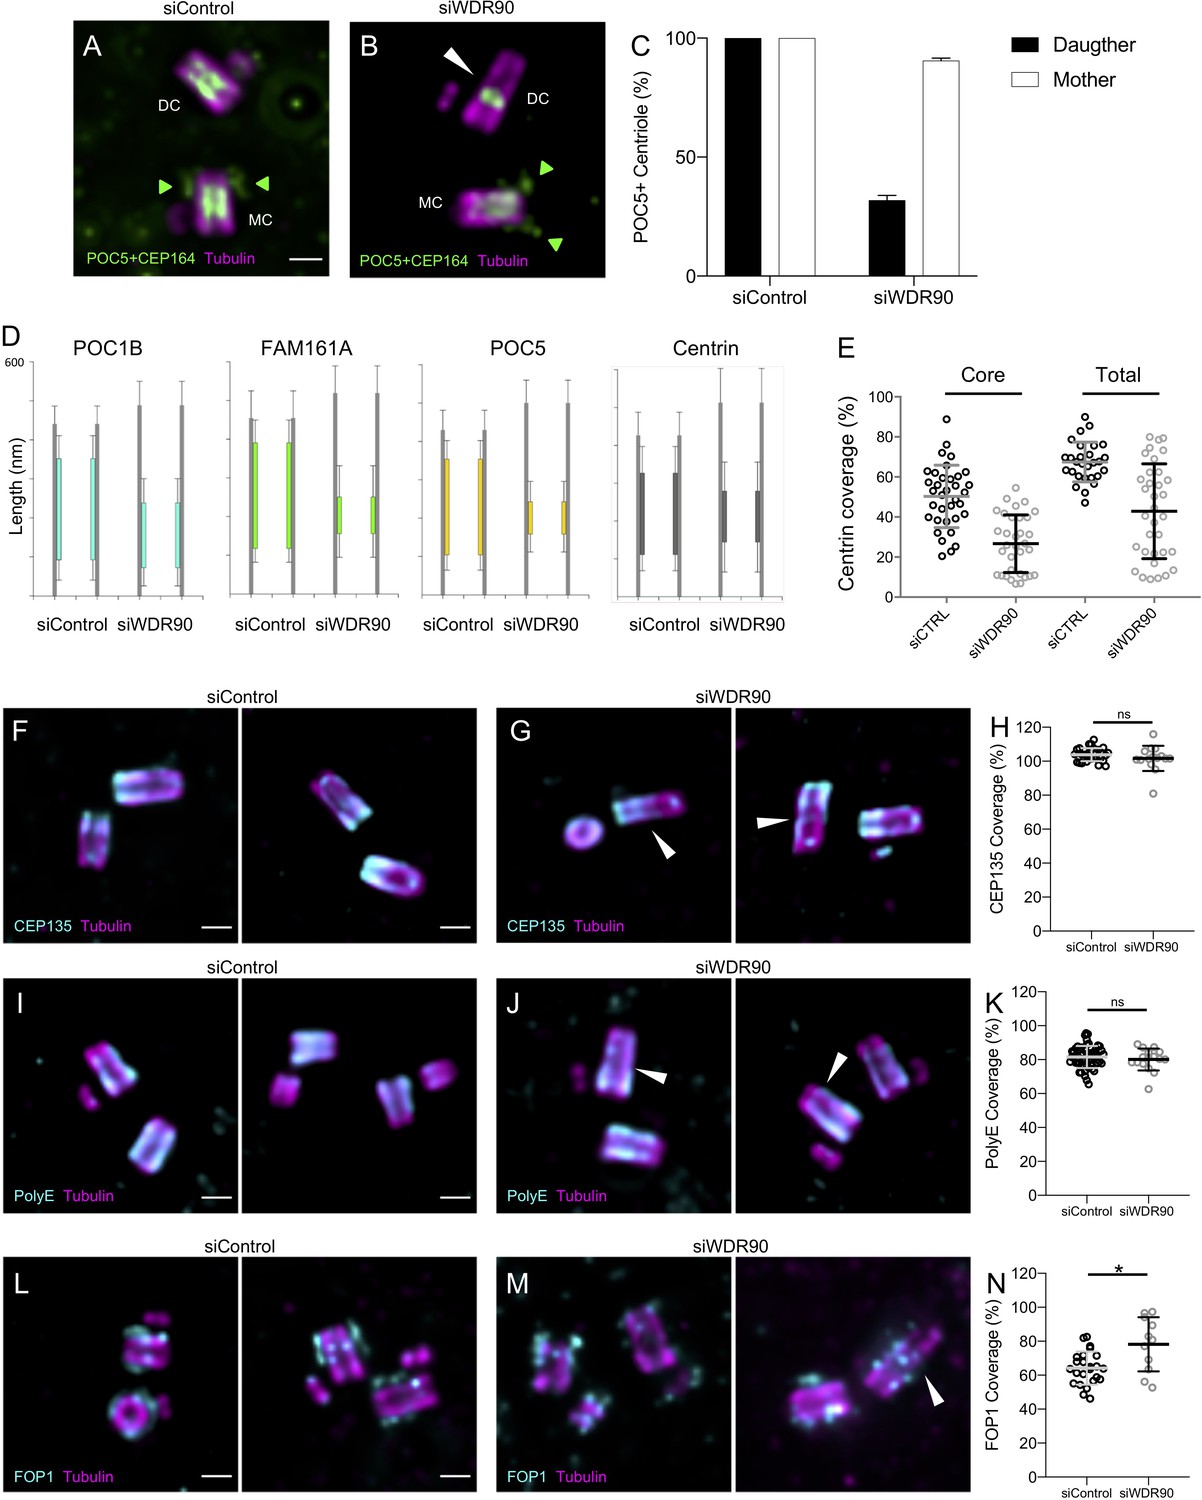
WDR90 depletion affects mainly inner scaffold components.
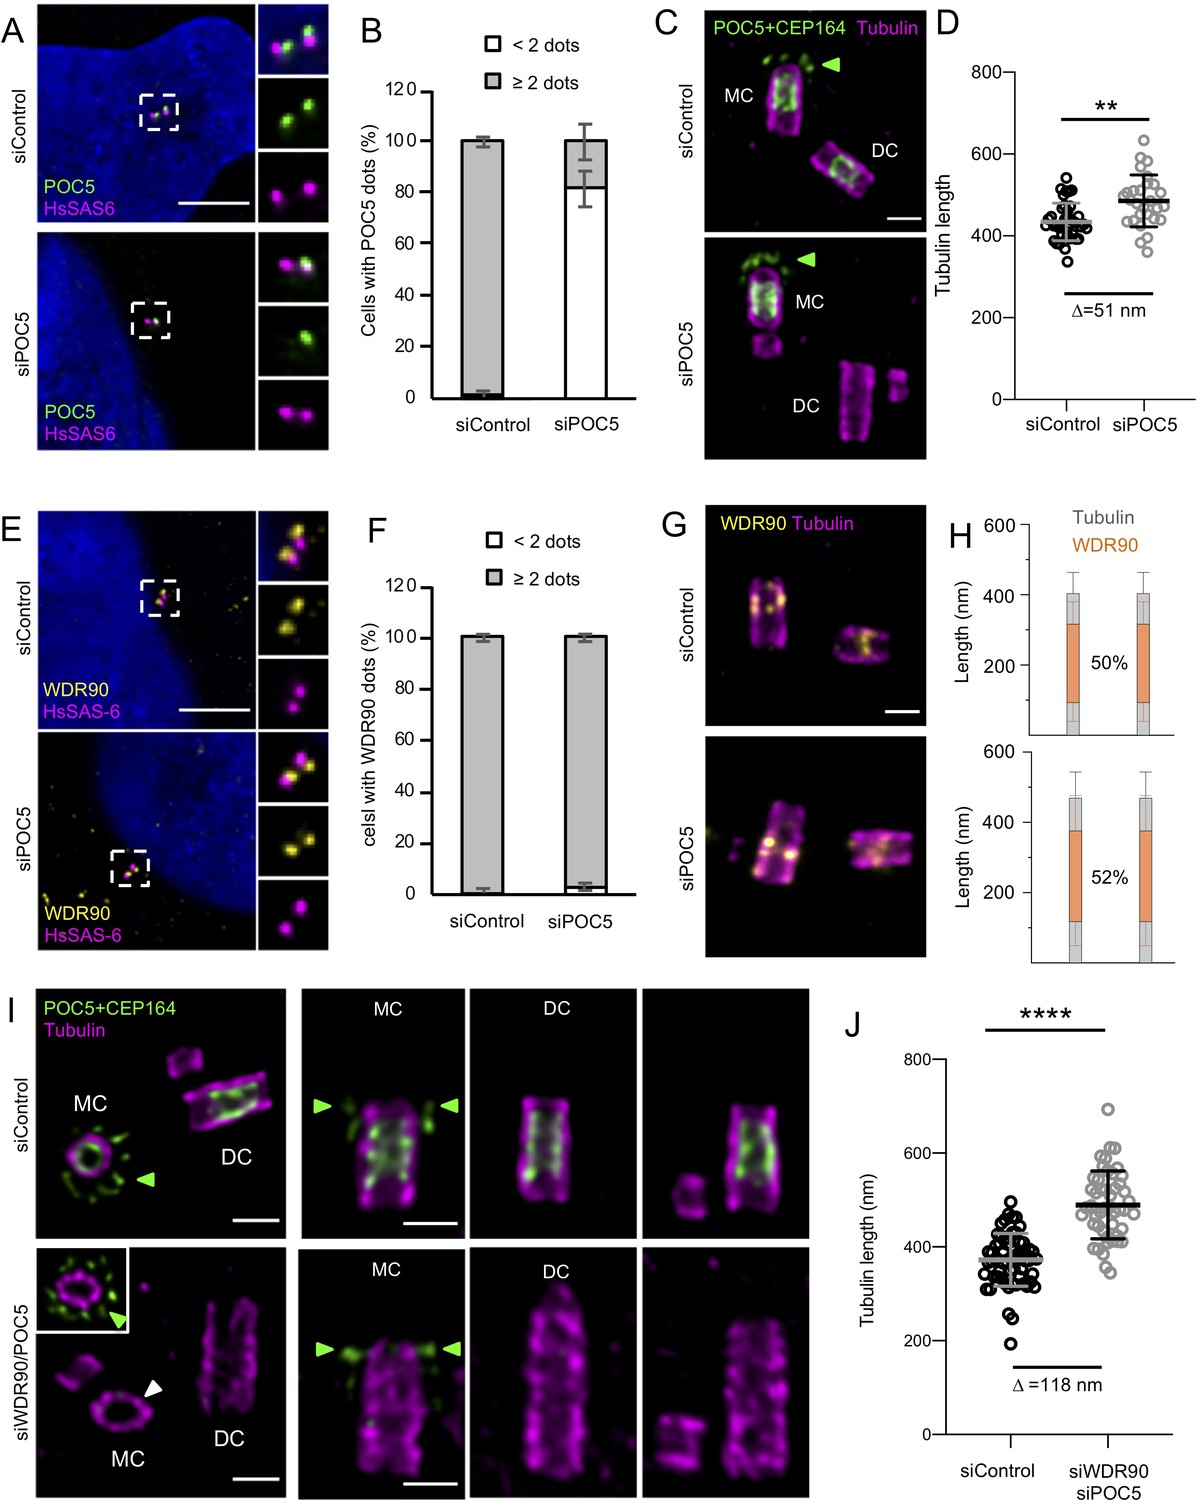
(A, B) Expanded centrioles from U2OS treated with either control (A) or wdr90 siRNA (B) stained for tubulin (magenta) and POC5+CEP164 (both in green. CEP164 is indicated by a green arrowhead). MC stands for mother centriole and DC for daughter centriole. White arrowhead indicates overly long centriole. Scale bar: 250 nm. (C) Quantification of the number of POC5-positive mother and daughter centrioles in siControl and siWDR90 conditions. N = 40 centrioles from two independent experiments. Average +/- SD: siControl daughter: 100% +/- 0, siControl mother: 100%+/- 0, siWDR90 daughter: 31.9+/- 2, siWDR90 mother: 90,6+/- 1.7. (D) Inner scaffold protein length coverage based on Figure 4E, n > 30 centrioles/condition from three independent experiments. (E) Centrin length coverage based on Figure 4E, measuring inner core or total (core + distal) length. (F, G) Expanded centrioles from U2OS treated with either control (F) or wdr90 siRNA (G) stained for tubulin (magenta) and CEP135 (cyan). White arrowheads indicate overly long centrioles. Scale bar: 250 nm. (H) CEP135 protein length expressed as a percentage of the total tubulin length, n = 31 and 15 centrioles for siControl and siWDR90 respectively, from two independent experiments. Average +/- SD: siControl: 104% +/- 3.8, siWDR90: 102% +/- 1.9. Mann-Whitney test p=0.235. (I, J) Expanded centrioles from U2OS treated with either control (I) or wdr90 siRNA (J) stained for tubulin (magenta) and PolyE (cyan). White arrowheads indicate overly long centrioles. Scale bar: 250 nm. (K) PolyE protein length expressed as a percentage of the total tubulin length, n = 53 and 16 centrioles for siControl and siWDR90 respectively, from two independent experiments. Average +/- SD: siControl: 81% +/- 6.5, siWDR90: 80% +/- 6.4. Mann-Whitney test p=0.375. (L, M) Expanded centrioles from U2OS treated with either control (L) or wdr90 siRNA (M) stained for tubulin (magenta) and FOP1 (cyan). White arrowheads indicate overly long centrioles. Scale bar: 250 nm. (N) FOP1 protein length expressed as a percentage of the total tubulin length, n = 24 and 11 centrioles for siControl and siWDR90 respectively, from two independent experiments. Average +/- SD: siControl: 64% +/- 9.7, siWDR90: 78% +/- 15.9. Mann-Whitney test *p=0.018.
Figure 5 with 1 supplement

WDR90 is important for centriole architecture integrity (see also Figure 5—figure supplement 1, Videos 1 and 2).
(A, B) Expanded centrioles from S-phase U2OS cells treated with control (A) or wdr90 siRNA (B), stained for tubulin (magenta) and POC1B (green). White arrowhead: broken microtubule wall of the mature centriole. P: procentriole, M: mature centriole. Scale bars: 100 nm. (C, D) Expanded centrioles from U2OS cells treated with control (C) or wdr90 siRNA (D), stained for tubulin (magenta) and POC5 (green) or WDR90 (yellow), displaying microtubule wall fractures (white arrowheads), lateral view. Scale bars: 100 nm. (E, F) Top views of expanded centrioles from U2OS cells treated with control (E) or wdr90 siRNA (F) stained as specified above. Note the loss of roundness of centrioles treated with wdr90 siRNA. Scale bars: 100 nm. (G) Model of WDR90 function holding microtubule triplets in the central core region of centrioles.
Figure 5—figure supplement 1
WDR90 depletion leads to severe centriolar structure defects.
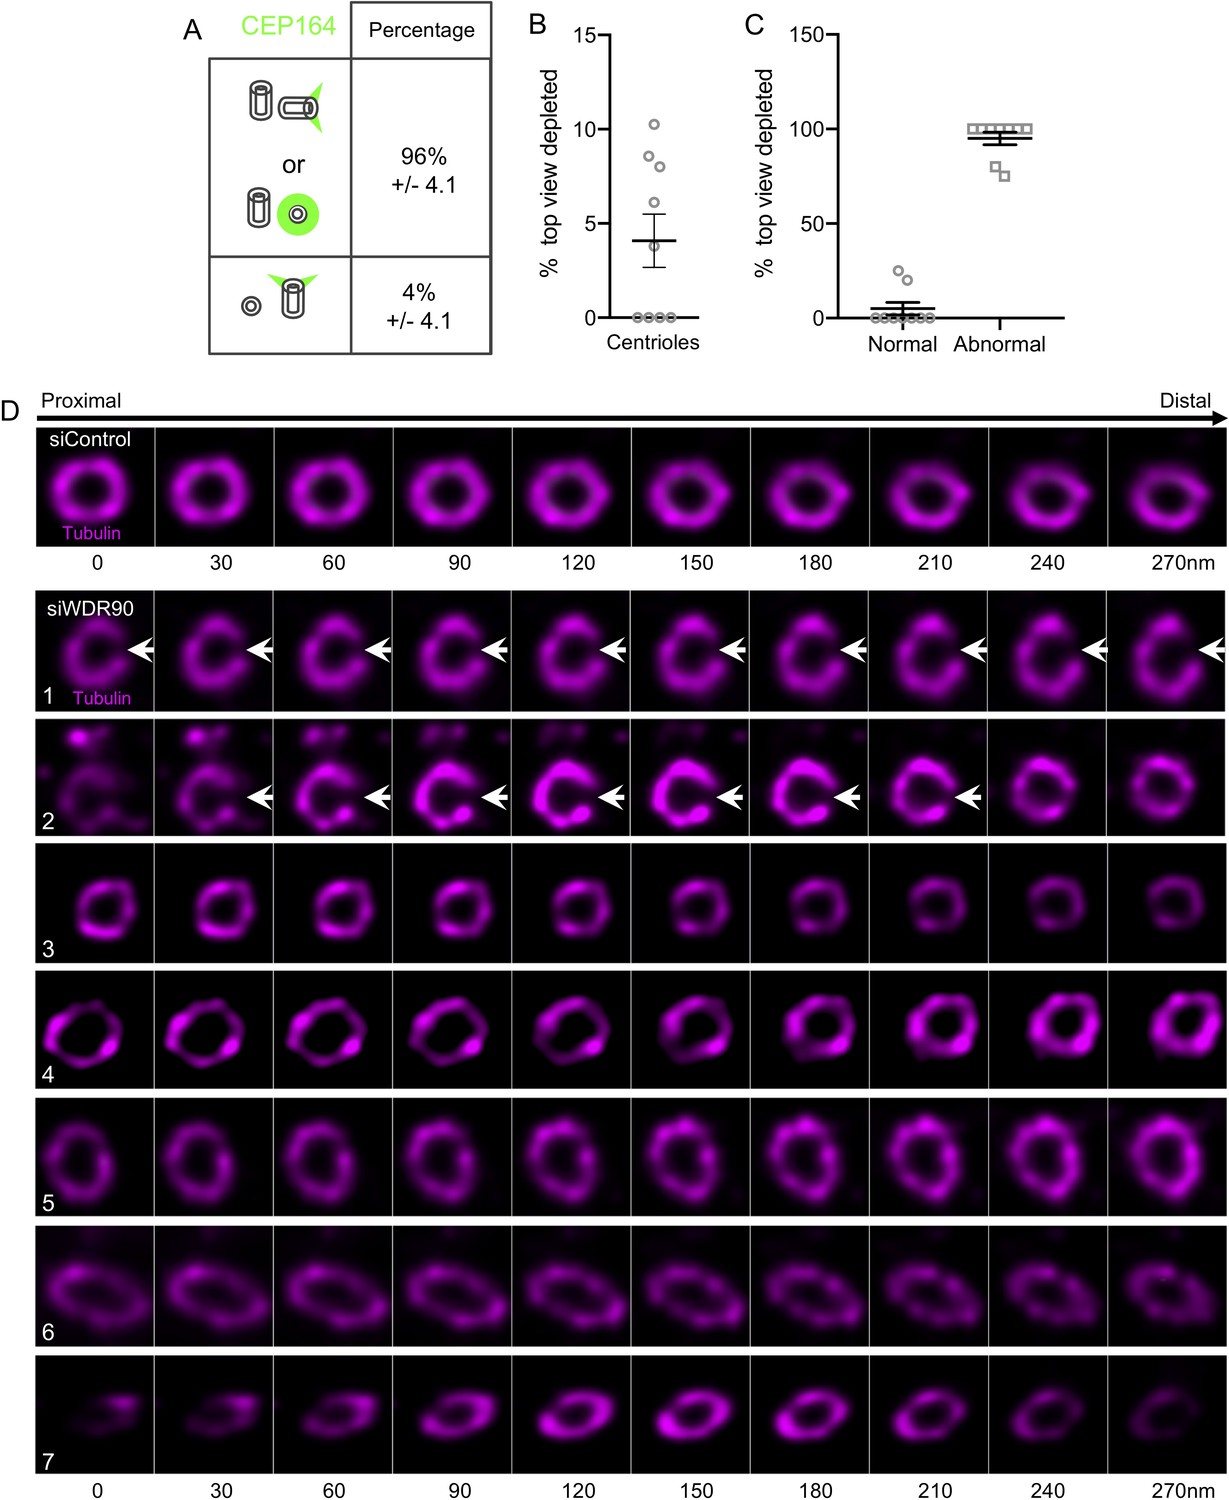
(A) Quantification of the orientation of mother centrioles in control cells following the appendages marker CEP164. N = 215 centrioles from three independent experiments. (B, C) Percentage of normal and defective top viewed centrioles depleted for WDR90. Centrioles were considered as defective when the roundness of the centriole was lost. N = 356 centrioles from nine independent experiments. Average +/- SD: Top view depleted: 4.1% +/- 4.2 (B); Normal: 5% +/- 10; Abnormal: 95% +/- 10 (C). (D) Expanded centriole from U2OS cells treated with control or wdr90 siRNA stained for tubulin, top views. White arrows indicate centriole fracture. Numbers indicate different centrioles. Scale bar: 200 nm.
Figure 6 with 2 supplements
POC5 and WDR90 are important for proper centriole architecture.
(See also Figure 6—figure supplements 1 and 2) (A) Human U2OS cell treated with either control or poc5 siRNA and stained for POC5 (green) and HsSAS-6 (magenta). DNA is in blue. Dotted white squares indicate insets. Scale bar: 5 µm. (B) Percentage of cells with the following number of POC5 dots per cell based on A, n = 50 cells/condition from three independent experiments. Average +/- SD: refer to Figure 6—source data 1. Fisher's exact test p<0.0001. (C) Expanded centrioles from U2OS treated with either control or poc5 siRNA stained for tubulin (magenta) and POC5+CEP164 (both in green. CEP164 is indicated by a green arrowhead). MC stands for mother centriole and DC for daughter centriole. Scale bar: 250 nm. (D) Tubulin length in nm, n = 30 centrioles/condition from two independent experiments. Average +/- SD: siControl = 434 nm +/- 45, siPOC5 = 485 nm +/- 64. Mann-Whitney p=0.0005. (E) Human U2OS cell treated with either control or poc5 siRNA and stained for WDR90 (yellow) and HsSAS-6 (magenta). DNA is in blue. Dotted white squares indicate insets. Scale bar: 5 µm. (F) Percentage of cells with the following number of WDR90 dots per cell based on A, n = 50 cells/condition from three independent experiments. Average +/- SD: refer to Figure 6—source data 2. Fisher's exact test p=0.6328. (G) Expanded centrioles from U2OS treated with either control or poc5 siRNA stained for tubulin (magenta) and WDR90 (yellow). Scale bar: 250 nm. (H) Average WDR90 length coverage in siControl or siPOC5. n = 30 centrioles/condition from two independent experiments. Average +/- SD: siControl = 50% +/- 21; siPOC5 = 52% +/- 23. (I) Expanded centrioles from U2OS treated with either control or wdr90/poc5 siRNA stained for tubulin (magenta) and POC5+CEP164 (both in green, CEP164 is indicated by a green arrowhead). MC stands for mother centriole and DC for daughter centriole. Inset shows a distal position of the mother centriole were CEP164 signal is visible (green arrowheads). White arrowhead indicates a loss of centriolar roundness. Scale bars: 250 nm. (J) Tubulin length in nm, n = 50 centrioles/condition from two independent experiments. Average +/- SD: siControl = 372 nm +/- 56, siWDR90/POC5 = 490 nm +/- 72. Unpaired t test ****p<0.0001.
-
Figure 6—source data 1
Percentage of cells with the following number POC5 dots/cell in siControl and siPOC5 conditions.
- https://cdn.elifesciences.org/articles/57205/elife-57205-fig6-data1-v1.docx
-
Figure 6—source data 2
Percentage of cells with the following number WDR90 dots/cell in siControl and siPOC5 conditions.
- https://cdn.elifesciences.org/articles/57205/elife-57205-fig6-data2-v1.docx
Figure 6—figure supplement 1
Characterization of POC5 and POC5/WDR90 depletion.
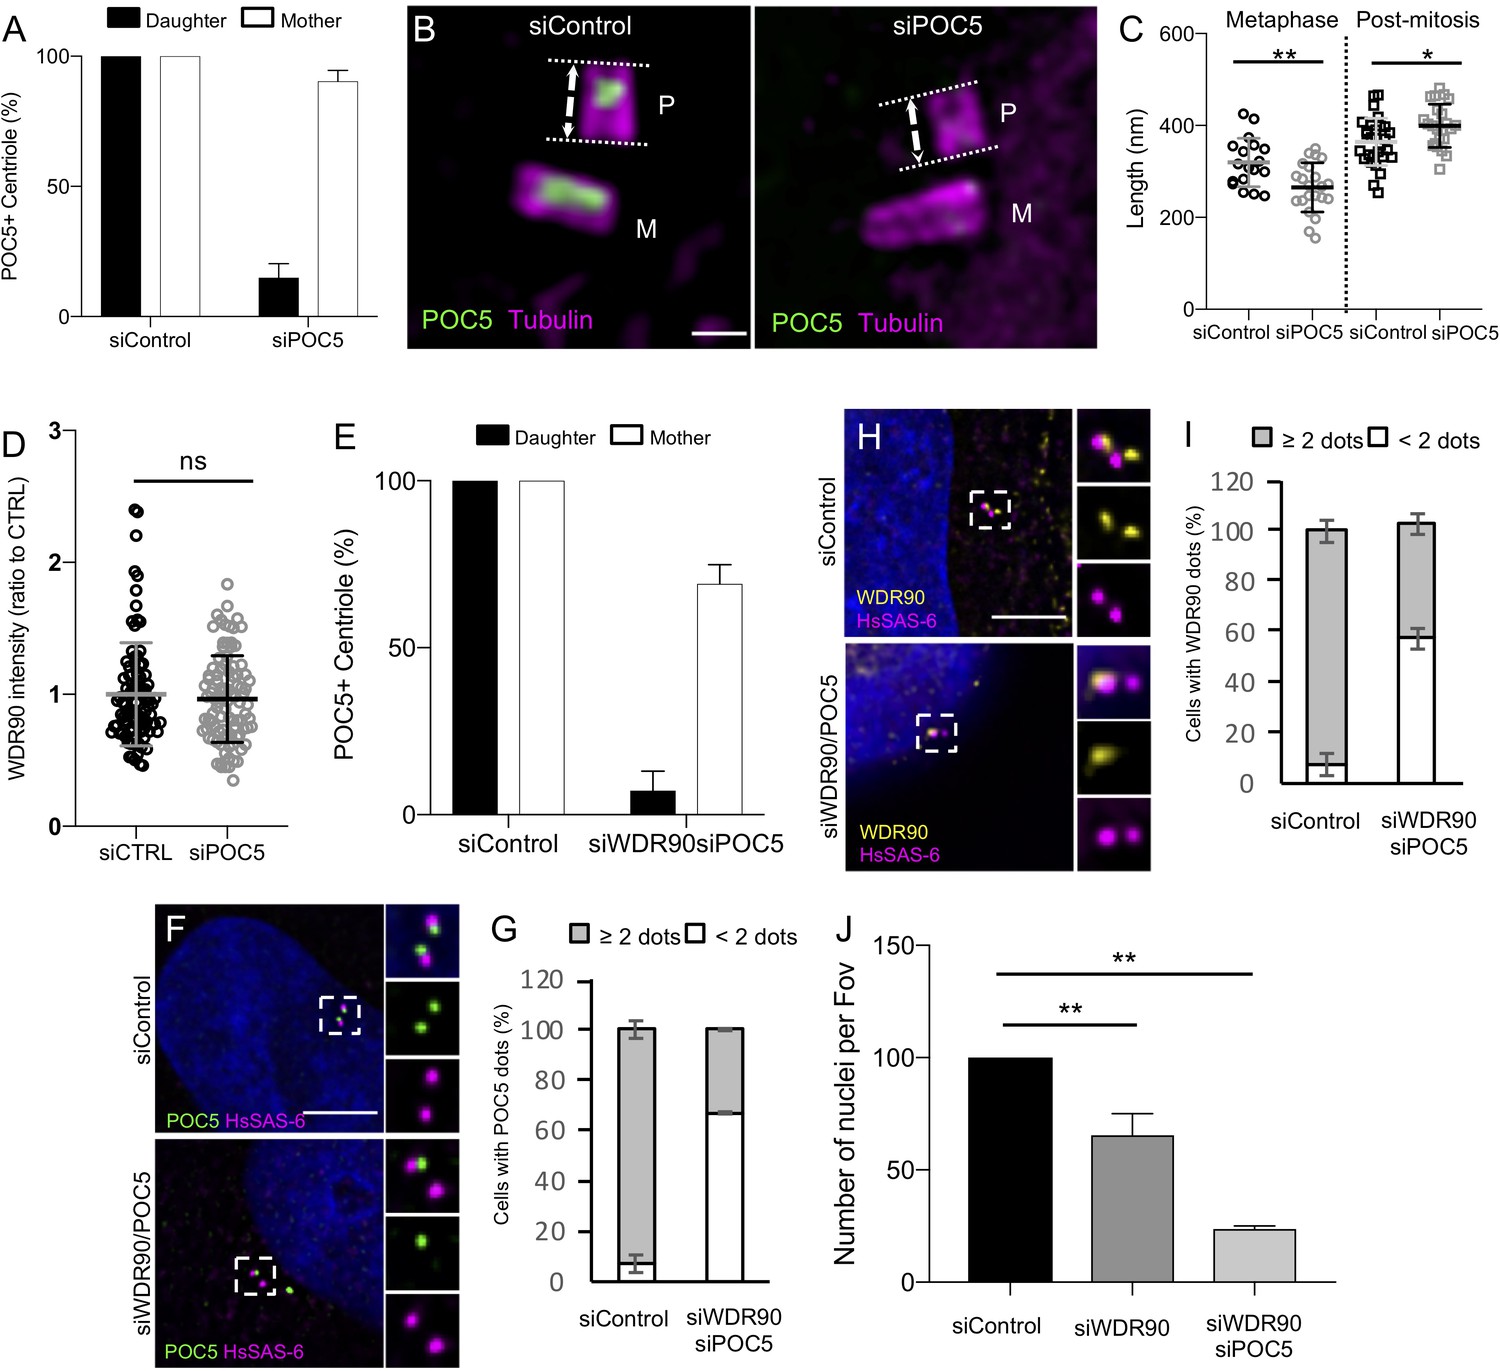
(A) Quantification of the number of POC5-positive mother and daughter centrioles in siControl and siPOC5. n = 50 centrioles counted from two independent experiments. Average +/- SD: siControl daughter: 100% +/- 0, siControl mother: 100%+/- 0, siWDR90 daughter: 14.9+/- 5.4, siWDR90 mother: 90.4+/- 4. (B) Expanded centrioles from U2OS in metaphase treated with either control or poc5 siRNA stained for tubulin (magenta) and POC5 (green). M stands for mature centriole and P for procentriole. Scale bar: 250 nm. Note the shorter procentriole in poc5 siRNA condition. (C) Tubulin length in nm of procentriole in metaphase and post-mitosis from siControl and siPOC5. n = 18, 22, 29, 23 centrioles for siControl metaphase, siPOC5 metaphase, siControl post-mitosis, siPOC5 post-mitosis respectively from three independent experiments. Average +/- SD: refer to Figure 6—figure supplement 1—source data 1. One-way ANOVA and Holm-Sidak’s multiple comparisons *p<0.05, **p<0.001. (D) WDR90 centrosomal intensity based on Figure 6E, n = 90 cells/condition from three independent experiments. Average +/- SD: siControl: 1 +/- 0.4 (A.U.), siWDR90: 0.96 +/- 0.3 (A.U.). Mann Whitney p=0.9088. (E) Quantification of the number of POC5-positive mother and daughter centriole in siControl and siWDR90/POC5. n = 100 centrioles from two independent experiments. Average +/- SD: siControl daughter: 100% +/- 0, siControl mother: 100%+/- 0, siWDR90/POC5 daughter: 7.2+/- 2.9, siWDR90/POC5 mother: 69.1+/- 2.9. (F) Human U2OS cell treated with either control or wdr90/poc5 siRNA and stained for POC5 (green) and HsSAS-6 (magenta). DNA is in blue. Dotted white squares indicate insets. Scale bar: 5 µm. (G) Percentage of cells with the following number of POC5 dots per cell based on F, n = 100 cells/condition from two independent experiments. Average +/- SD: refer to Figure 6—figure supplement 1—source data 2. Fisher's exact test p<0.0001. (H) Human U2OS cell treated with either control or wdr90/poc5 siRNA and stained for WDR90 (yellow) and HsSAS-6 (magenta). DNA is in blue. Dotted white squares indicate insets. Scale bar: 5 µm. (I) Percentage of cells with the following number of WDR90 dots per cell based on H, n = 100 cells/condition from two independent experiments. Average +/- SD: Refer to Figure 6—figure supplement 1—source data 3. Fisher's exact test p<0.0001. (J) Number of nuclei counted per field of view (Fov) (expressed as a ratio to the siControl), n > 5000 cell/condition from 2/3 independent experiments. Average +/- SD: siControl: 100% +/- 0, siWDR90: 65% +/- 16; siWDR90/POC5: 24% +/- 2. ANOVA one-way followed by Tukey’s post hoc test. **p=0.0015.
-
Figure 6—figure supplement 1—source data 1
Length of centriole in metaphase and at the end of mitosis in siControl and siPOC5 conditions.
- https://cdn.elifesciences.org/articles/57205/elife-57205-fig6-figsupp1-data1-v1.docx
-
Figure 6—figure supplement 1—source data 2
Percentage of cells with the following number POC5 dots/cell in siControl and siWDR90/POC5 conditions.
- https://cdn.elifesciences.org/articles/57205/elife-57205-fig6-figsupp1-data2-v1.docx
-
Figure 6—figure supplement 1—source data 3
Percentage of cells with the following number WDR90 dots/cell in siControl and siWDR90/POC5 conditions.
- https://cdn.elifesciences.org/articles/57205/elife-57205-fig6-figsupp1-data3-v1.docx
Figure 6—figure supplement 2
Loss of the inner scaffold components WDR90 and POC5 leads to centriole breakage.
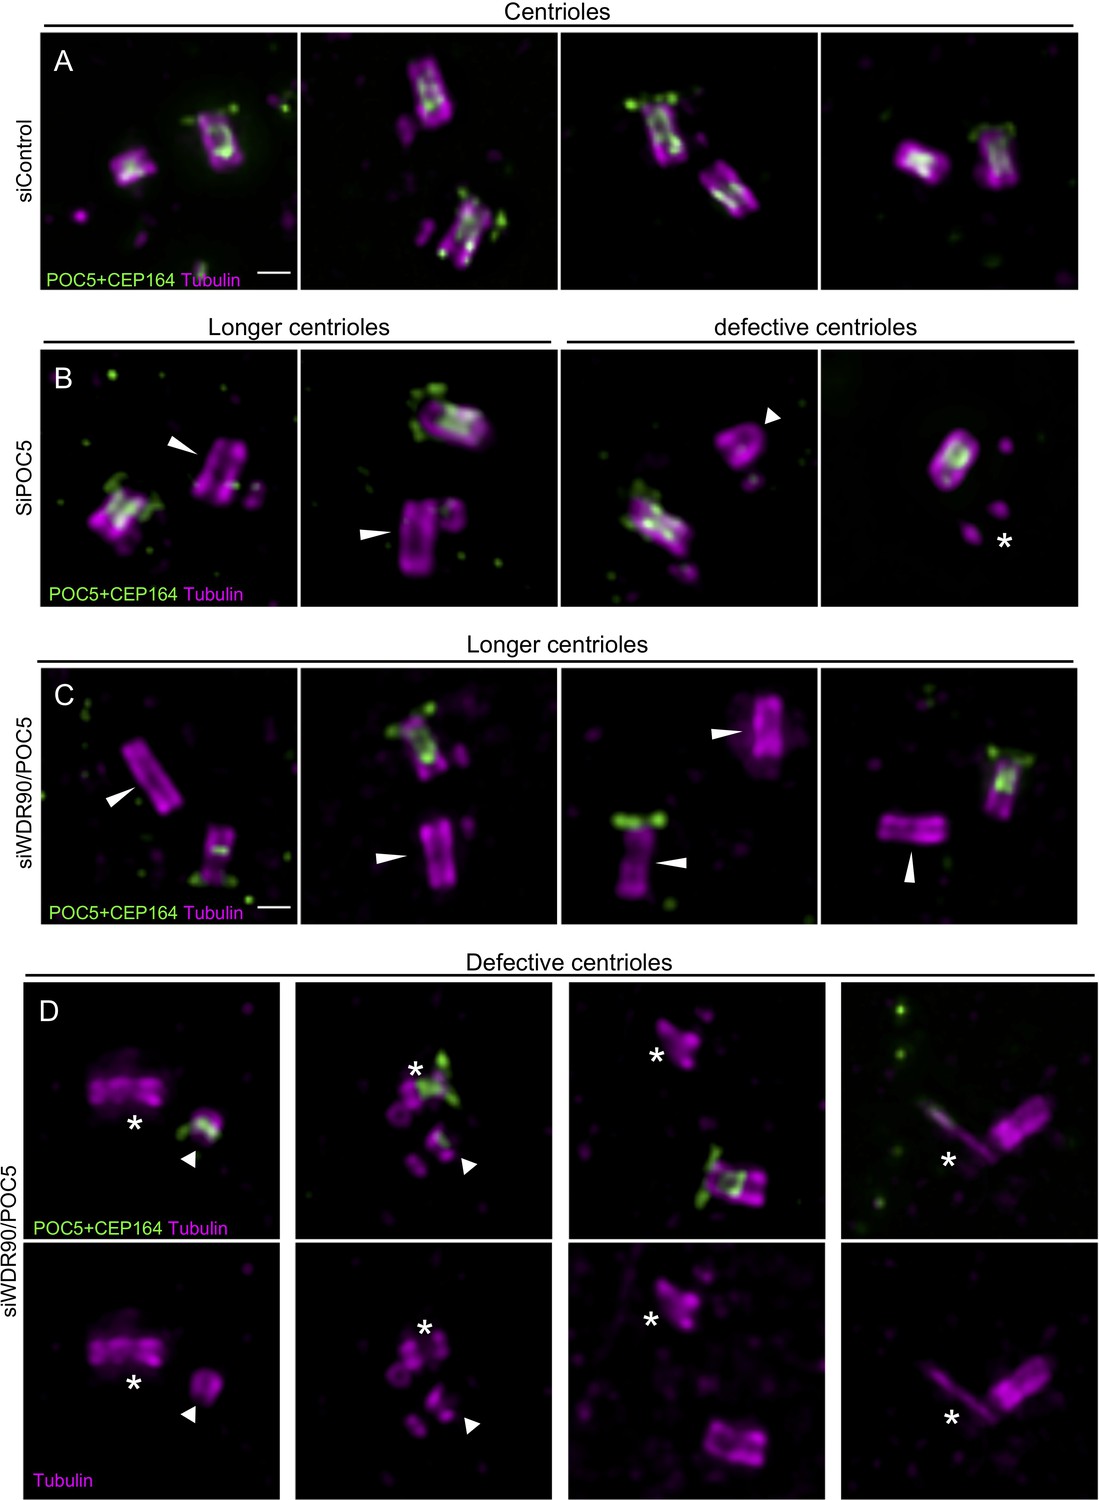
(A) Expanded centrioles from U2OS treated with control siRNA stained for tubulin (magenta) and POC5+CEP164 (both in green). Scale bar: 250 nm. (B) Expanded centrioles from U2OS treated with poc5 siRNA stained for tubulin (magenta) and POC5+CEP164 (both in green). Long white arrowheads indicate overly long centrioles, short white arrowhead indicates structurally abnormal centriole, that could be either blunt broken or misassembled, star indicates fully broken centriole. Scale bar: 250 nm. (C, D) Expanded centrioles from U2OS treated with wdr90/poc5 siRNA stained for tubulin (magenta) and POC5+CEP164 (both in green). Long white arrowheads indicate overly long centrioles (C), short white arrowheads indicate structurally abnormal centrioles, that could be either blunt broken or misassembled, stars indicate fully broken centrioles (D). Scale bar: 250 nm.
Videos
Video 1
U-ExM expanded control centrioles.
Top viewed expanded centriole from U2OS cell treated with control siRNA and stained for tubulin (magenta) and POC5 (green). Z-stack acquired every 0.12 µm from the proximal to distal end of the centriole.
Video 2
U-ExM expanded centrioles depleted of WDR90.
Top viewed expanded centriole from U2OS cell treated with wdr90 siRNA and stained for tubulin (magenta) and POC5 (green). Z-stack acquired every 0.12 µm from the proximal to distal end of the centriole.
Tables
Key resources table
| Reagent type (species) or resource | Designation | Source or reference | Identifiers | Additional information |
|---|---|---|---|---|
| Strain, strain background (Chlamydomonas reinhardtii) | WT | Chlamydomonas Resource Center | cMJ030 | Wild-type |
| Strain, strain background (Paramecium tetraurelia) | 7S | Beisson et al., 2010 | doi:10.1101/pdb.prot5364 | |
| Cell line (Homo sapiens) | U2OS | Habedanck et al., 2005 | PMID:16244668 | |
| Cell line (Homo sapiens) | RPE-1 p53- | Wang et al., 2015 | PMID:26609813 | |
| Cell line (Homo sapiens) | U2OS:GFP-WDR90RR | This paper | p. 19 of the manuscript (Material and methods) | Episomal, puromycine selected, doxycycline-inducible |
| Transfected construct (Homo sapiens) | GFP-WDR90RR | This paper | pEBTet-GFP-WDR90RR(FL) p. 20 of the manuscript (Material and methods) | WDR90RR DNA template from Hamel et al., 2017 |
| Transfected construct (Homo sapiens) | GFP-WDR90(1-225)RR | This paper | pEBTet-GFP-WDR90RR(1-225) p. 20 of the manuscript (Material and methods) | WDR90RR DNA template from Hamel et al., 2017 |
| Transfected construct (Homo sapiens) | GFP-WDR90 | This paper | Genebank sequence NP_660337, pEGFP-WDR90 | RT-PCR from human RPE-1 cells, cloned into modified pEGFP-C1 vector using AscI andPacI restriction sites |
| Transfected construct (Chlamydomonas reinhardtii) | POC16 (1-295) | This paper | pXLG-POC16(1-295), described p.20 of the manuscript in the Material andmethods section. | POC16 sequence synthetized by GeneArt using the E. coli codon usage (described in Hamel et al., 2017) cloned into pXLG vector using NotI and BamHI restriction sites |
| Biological sample (Chlamydomonas reinhardtii) | Isolated basal bodies | Klena et al., 2018 | PMID:30295659 | |
| Biological sample (Sus scrofa) | Tubulin | Cytoskeleton | Cat. #: T240 | Isolated from brain, used for electron microscopy |
| Biological sample (Bovine taurus) | Tubulin | Centro de Investigastiones Biologicas, Madrid, Spain | Isolated from brain, used for pelleting assay | |
| Antibody | Tubulin AA345 (mouse monoclonal) | Le Guennec et al., 2020 | PMID:32110738 | U-ExM Isolated Basal Bodies (1:500) U-ExM in cells (1:250) |
| Antibody | Alpha-Tubulin AA344 (mouse monoclonal) | Le Guennec et al., 2020 | PMID:32110738 | U-ExM in cells (1:250) |
| Antibody | POC16 (rabbit polyclonal) | Hamel et al., 2017 | PMID:28781053 | U-ExM (1:100) |
| Antibody | POB15 (rabbit polyclonal) | Hamel et al., 2017 | PMID:28781053 | U-ExM (1:100) |
| Antibody | WDR90 (rabbit polyclonal) | NovusBio | Cat. #: NBP2-31888 | U-ExM (1:100) IF (1:250) |
| Antibody | POC1B (rabbit polyclonal) | ThermoFisher | Cat. #: PA5-24495 | U-ExM (1:250) |
| Antibody | POC5 (rabbit polyclonal) | Bethyl | Cat. #: A303-341A | U-ExM (1:250) IF (1:500) |
| Antibody | FAM161A (rabbit polyclonal) | Le Guennec et al., 2020 | PMID:32110738 | U-ExM (1:250) |
| Antibody | Centrin (mouse monoclonal, 20H5) | Merck Millipore | Cat. #: 04–1624 | U-ExM (1:250) IF (1:500) |
| Antibody | DM1A Tubulin (mouse monoclonal) | Abcam | Cat. #: ab7291 | IF (1:1000) |
| Antibody | HsSAS-6 (mouse monoclonal) | Santa Cruz Biotechnology | Cat. #: sc-81431 | IF (1:100) |
| Antibody | PCM1 (rabbit polyclonal) | Santa Cruz Biotechnology | Cat. #: sc-67204 | IF (1:500) |
| Antibody | CP110 (rabbit polyclonal) | Proteintech | Cat. #: 12780–1 | IF (1:500) |
| Antibody | GFP (mouse monoclonal) | Abcam | Cat. #: ab1218 | IF (1:500) |
| Antibody | mCherry (rabbit polyclonal) | Abcam | Cat. #: ab167453 | IF (1:500) |
| Antibody | ptPOC16 (rabbit polyclonal) | This study | described p.27 of the manuscript in the Supplemental Methods section. | IF (1:50) |
| Antibody | Tubulin 1D5 (mouse mono clonal) | Beisson et al., 2010 | IF (1:10) | |
| Antibody | Alexa 488 anti-rabbit IgG (goat) | ThermoFisher | Cat. #: A11008 | U-ExM (1:400) IF (1:1000) |
| Antibody | Alexa 568 anti-mouse IgG (goat) | ThermoFisher | Cat. #: A11004 | U-ExM (1:400) IF (1:1000) |
| Recombinant DNA reagent | pEBTet-EGFP-GW | Gift from the Gönczy lab | Na. | |
| Recombinant DNA reagent | pENTR-Age-AGT | Gift from the Gönczy lab | Na. | |
| Recombinant DNA reagent | pEGFP-C1 | Clontech | ||
| Sequence-based reagent | siRNA Control | ThermoFisher | AM4642 | Silencer select |
| Sequence-based reagent | siRNA targetingwdr90 gene | ThermoFisher | S47097 | Silencer select |
| Sequence-based reagent | siRNA targetingpcm1 gene | ThermoFisher | ADCSU9L | Silencer select |
| Peptide, recombinant protein | POC16(1-295) | This paper | Uniprot A8JAN3 | Purified from bacteria |
| Peptide, recombinant protein | WDR90(1-225) | This paper | Uniprot Q96KV7 | Purified from bacteria |
| Peptide, recombinant protein | drPOC16(1-243) | This paper | Uniprot F1RA29 | Purified from bacteria |
| Peptide, recombinant protein | btPOC16(1-224) | This paper | Uniref UPI000572B175 | Purified from bacteria |
| Peptide, recombinant protein | ptPOC16(2-210) | This paper | Uniprot A0DK60 | Purified from bacteria |
| Peptide, recombinant protein | xtPOC16(1-245) | This paper | Uniref UPI0008473371 | Purified from bacteria |
| Peptide, recombinant protein | rnPOC16(54-282) | This paper | Uniref UPI0008473371 | Purified from bacteria |
| Commercial assay or kit | Lipofectamine 3000 Transfection kit | LifeTechnology | Cat. #: L3000015 | |
| Commercial assay or kit | Lipofectamine RNAi max kit | LifeTechnology | Cat. #: 13778150 | |
| Commercial assay or kit | Click-EdU-Alexa647 FACS kit | Carl Roth | Cat. #: 7783.1 | |
| Commercial assay or kit | DAPCO Mounting medium | Abcam | Cat. #: ab188804 | |
| Commercial assay or kit | Affi-Gel 10 | Bio-Rad | Cat. #:153–6099 | |
| Chemical compound, drug | Formaldehyde 36.5–38% | Sigma | Cat. #: F8775 | |
| Chemical compound, drug | Acrylamide 40% | Sigma | Cat. #: A4058 | |
| Chemical compound, drug | N,N’-methylbisacrylamide 2% | Sigma | Cat. #: M1533 | |
| Chemical compound, drug | Sodium acrylate 97–99% | Sigma | Cat. #: 408220 | |
| Chemical compound, drug | Ammonium persulfate | ThermoFisher | Cat. #: 17874 | |
| Chemical compound, drug | Tetramethylethyldiamine | ThermoFisher | Cat. #: 17919 | |
| Chemical compound, drug | Poly-D-Lysine 1 mg/mL | Gibco | Cat. #: A3890401 | |
| Chemical compound, drug | Taxol/Paclitaxel | Sigma-Aldrich | Cat. #: T7191 | |
| Chemical compound, drug | Coomassie staining | Biotium | Cat. #: 21003 | |
| Chemical compound, drug | Propidium Iodide | Sigma | Cat. #: 81845 | |
| Chemical compound, drug | Rnase | Roche | Cat. #: 11119915001 | |
| Software, algorithm | ImageJ/FiJi | Schindelin et al., 2012 | doi:10.1038/nmeth.2019 | |
| Software, algorithm | CentrioleJ pluggin | Guichard et al., 2013 | DOI:10.1016/j.cub.2013.06.061 | |
| Software, algorithm | UnwarpJ pluggin | Sorzano et al., 2005 | DOI:10.1109/TBME.2005.844030 | |
| Software, algorithm | GraphPadPrism7 | GraphPad Software | 7.0 | |
| Software, algorithm | Phyre2 | Kelley and Sternberg, 2009 | DOI:10.1038/nprot.2015.053 | |
| Software, algorithm | UCSF Chimera | Pettersen et al., 2004 | DOI:10.1002/jcc.20084 | |
| Other | Zeiss LSM700 microscope | Zeiss | ||
| Other | Leica TCS SP8 microscope | Leica | Expansion microscopy | |
| Other | Leica Thunder inverted microscope | Leica | ||
| Other | Tecnai G2 Sphera microscope | Thermofisher | Negative stain and cryo-EM |
Additional files
Download links
A two-part list of links to download the article, or parts of the article, in various formats.
Downloads (link to download the article as PDF)
Open citations (links to open the citations from this article in various online reference manager services)
Cite this article (links to download the citations from this article in formats compatible with various reference manager tools)
WDR90 is a centriolar microtubule wall protein important for centriole architecture integrity
eLife 9:e57205.
https://doi.org/10.7554/eLife.57205


