The HIV-1 latent reservoir is largely sensitive to circulating T cells
- Department of Microbiology and Immunology, University of North Carolina, United States
- Lineberger Comprehensive Cancer Center, University of North Carolina, United States
- UNC Center For AIDS Research, University of North Carolina, United States
- British Columbia Centre for Excellence in HIV/AIDS, Canada
- Department of Medicine, University of North Carolina, United States
- UNC HIV Cure Center, University of North Carolina, United States
- Department of Urology, University of California San Francisco, United States
- Gladstone Institute of Virology and Immunology, United States
- Faculty of Health Sciences, Simon Fraser University, Canada
Figures
Figure 1
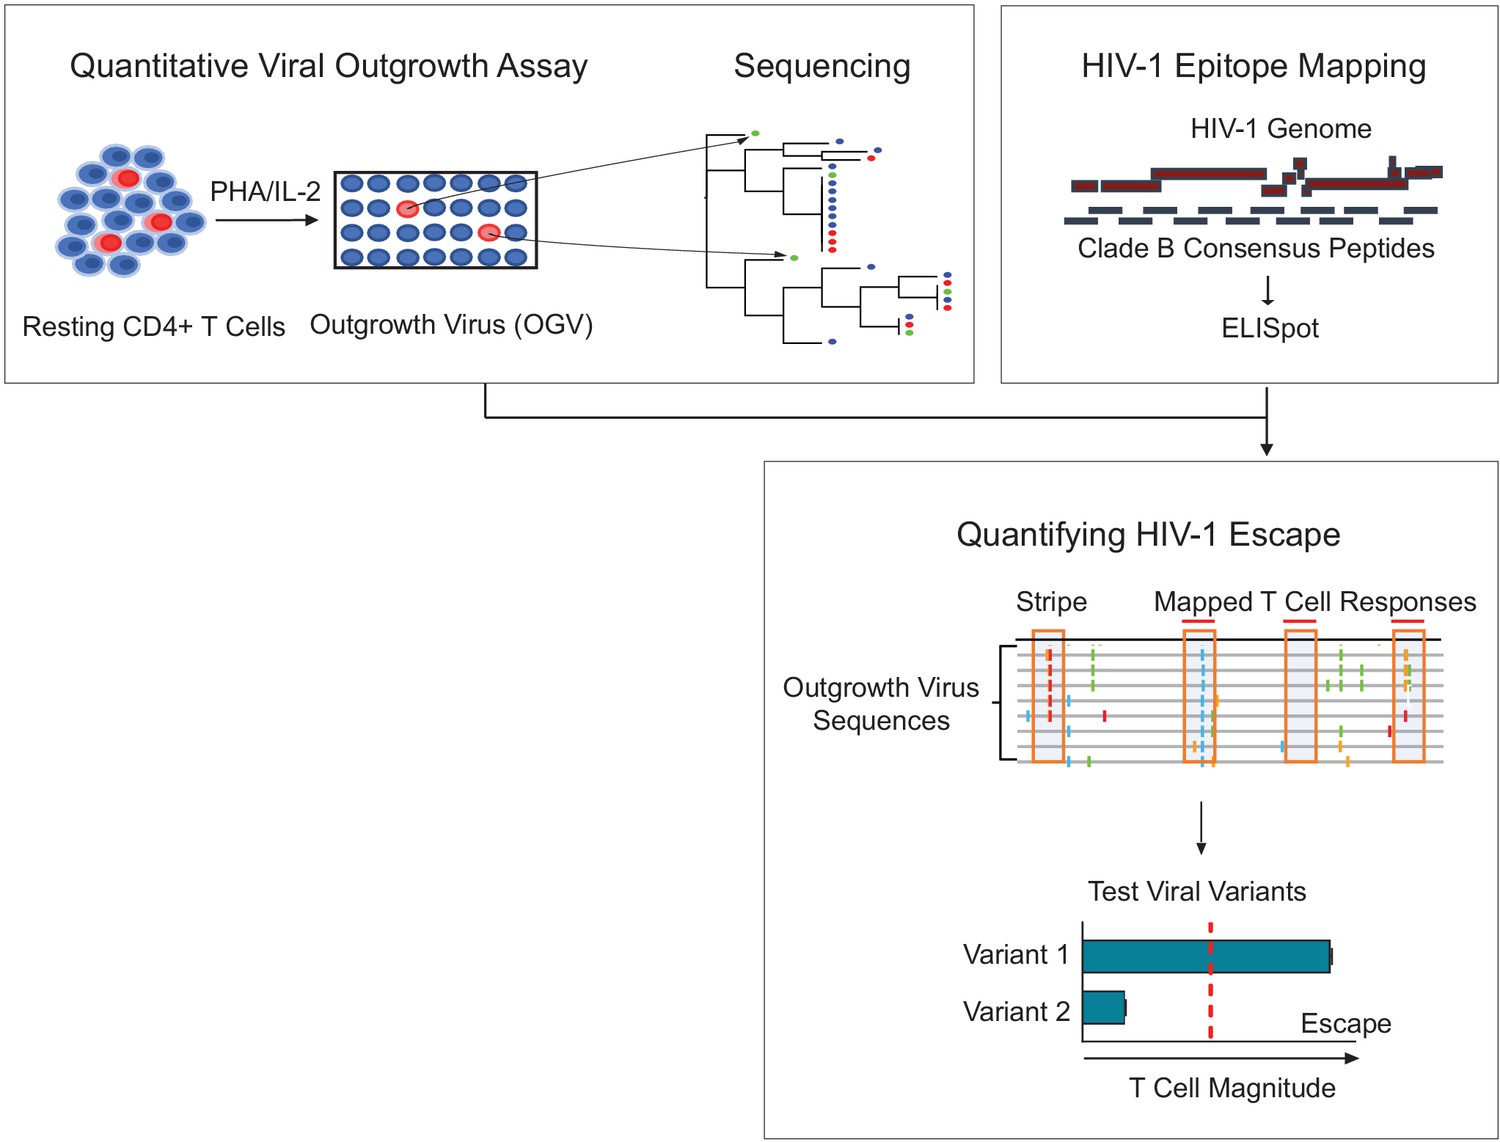
Schema of empirical testing of T cell escape in the HIV-1 reservoir.
Top left panel. The quantitative viral outgrowth assay (QVOA) provided a minimal estimate of the size of the replication-competent reservoir virus from total resting CD4+ T cells of PLWH on ART (n = 25). Supernatants from HIV-1 p24+ wells harboring outgrowth virus (OGV) were sequenced by either PacBio (n = 22) or MiSeq (n = 1). Top right panel. Ex vivo IFN-γ ELISpot assays identified reactive T cell epitopes in clade B HIV-1 proteome in each participant. Lower panel. Sequencing and T cell data were combined to identify putative virus escape mutations by overlaying reactive T cell reactive epitopes (red horizontal line) on highlighter plots of each participant’s outgrowth sequences (n = 23). Peptides spanning all non-synonymous changes between the clade B-defined epitope and outgrowth sequences (orange boxes) were synthesized. In addition, peptides matching OGVs in participants in which > 40% of viruses contained the same non-synonymous mutation generating a ‘stripe’ on the highlighter plot were also synthesized (orange box, no overhead red line). Variant peptides were examined for their impact on T cell recognition in ex vivo IFN-γ ELISpot. Virus escape was defined as a ≥ 50% difference in magnitude between variants, either Clade B sequence or OGV variants (vertical, red dotted line).
Figure 2
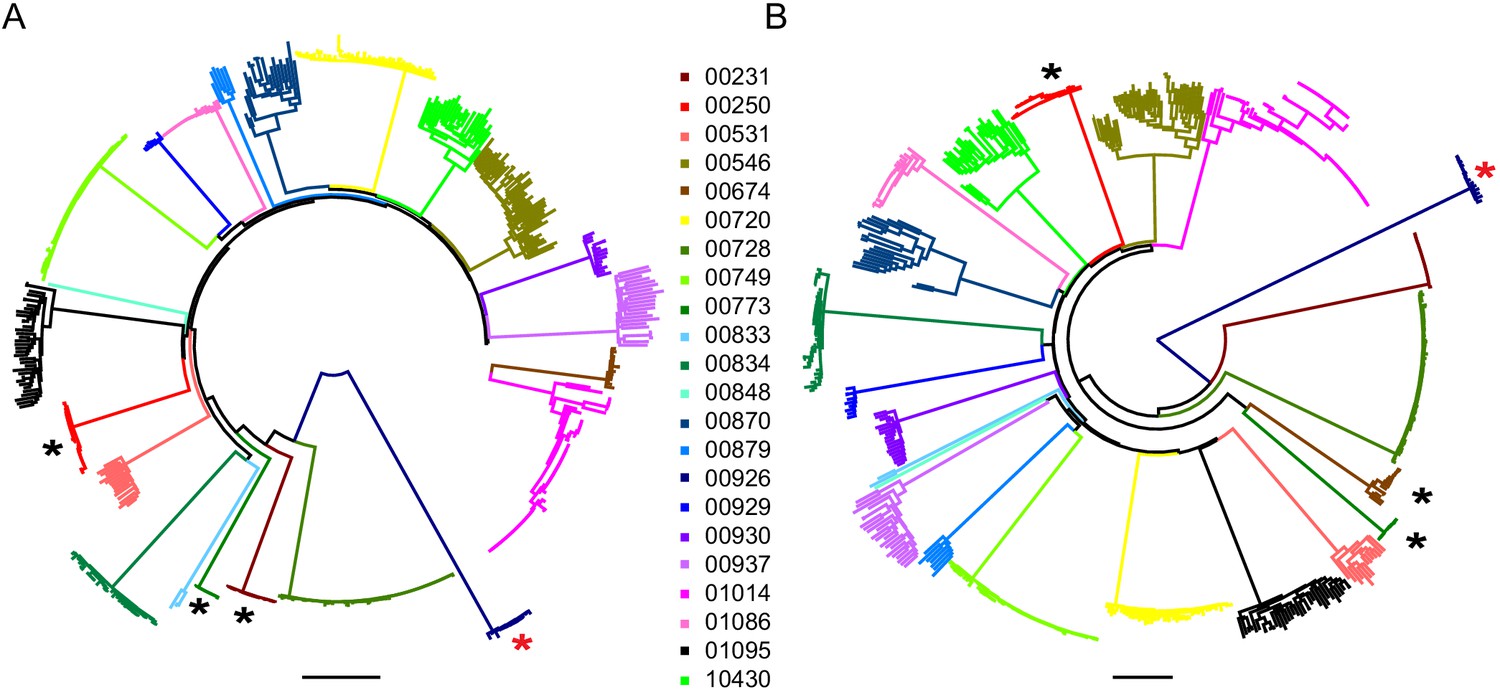
Neighbor-joining phylogenetic trees of sequenced outgrowth virus.
The phylogenetic trees display 5’ (A) and 3’ (B) half genome sequences generated by PacBio sequencing of outgrowth virus from the quantitative viral outgrowth assay from n = 22 PLWH on ART. Each color indicates outgrowth virus sequences from a different PLWH on ART. Black stars denote participants who initiated ART during acute infection. All participants were infected with a clade B HIV-1 virus, except for one participant (red star), who was infected with a clade G HIV-1 virus. The genetic distance is shown by scale bar, 2 substitutions out of 100 bp. Trees are midpoint-rooted.
Figure 3 with 2 supplements
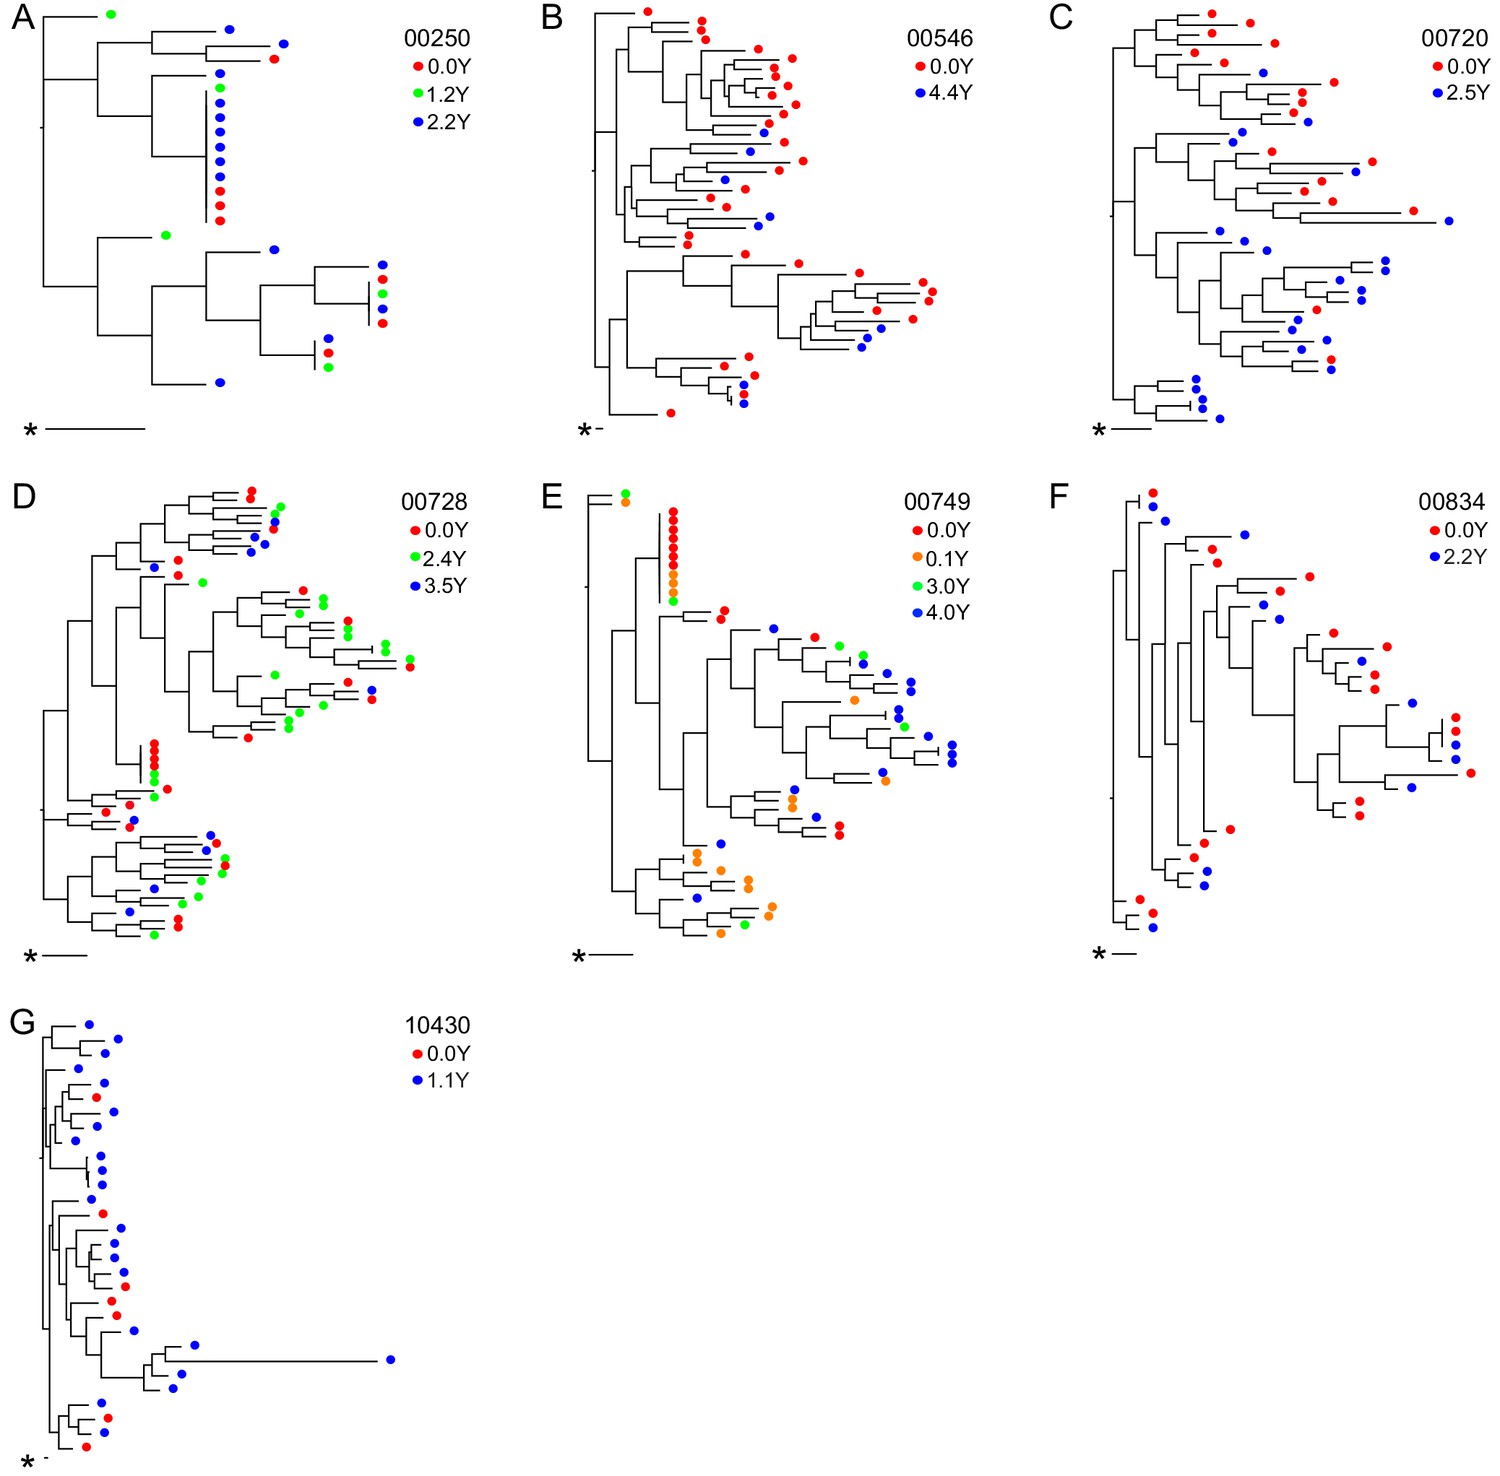
Neighbor-joining within-host phylogenetic trees inferred from longitudinal outgrowth virus sequences.
Phylogenetic trees displaying 3’ half genome sequences of longitudinal outgrowth virus sequences from seven participants (A–G). Each color represents a different time point in which outgrowth virus was sequenced for each participant. Sequences from different time points for each participant are distributed throughout the phylogeny. The genetic distance is shown by scale bar (indicated with an asterisk), 1 substitution out of 1000 bp. Trees are midpoint-rooted. (A) 00250 treated during acute infection and (E) 00749 have > 20% clonal sequences.
Figure 3—figure supplement 1
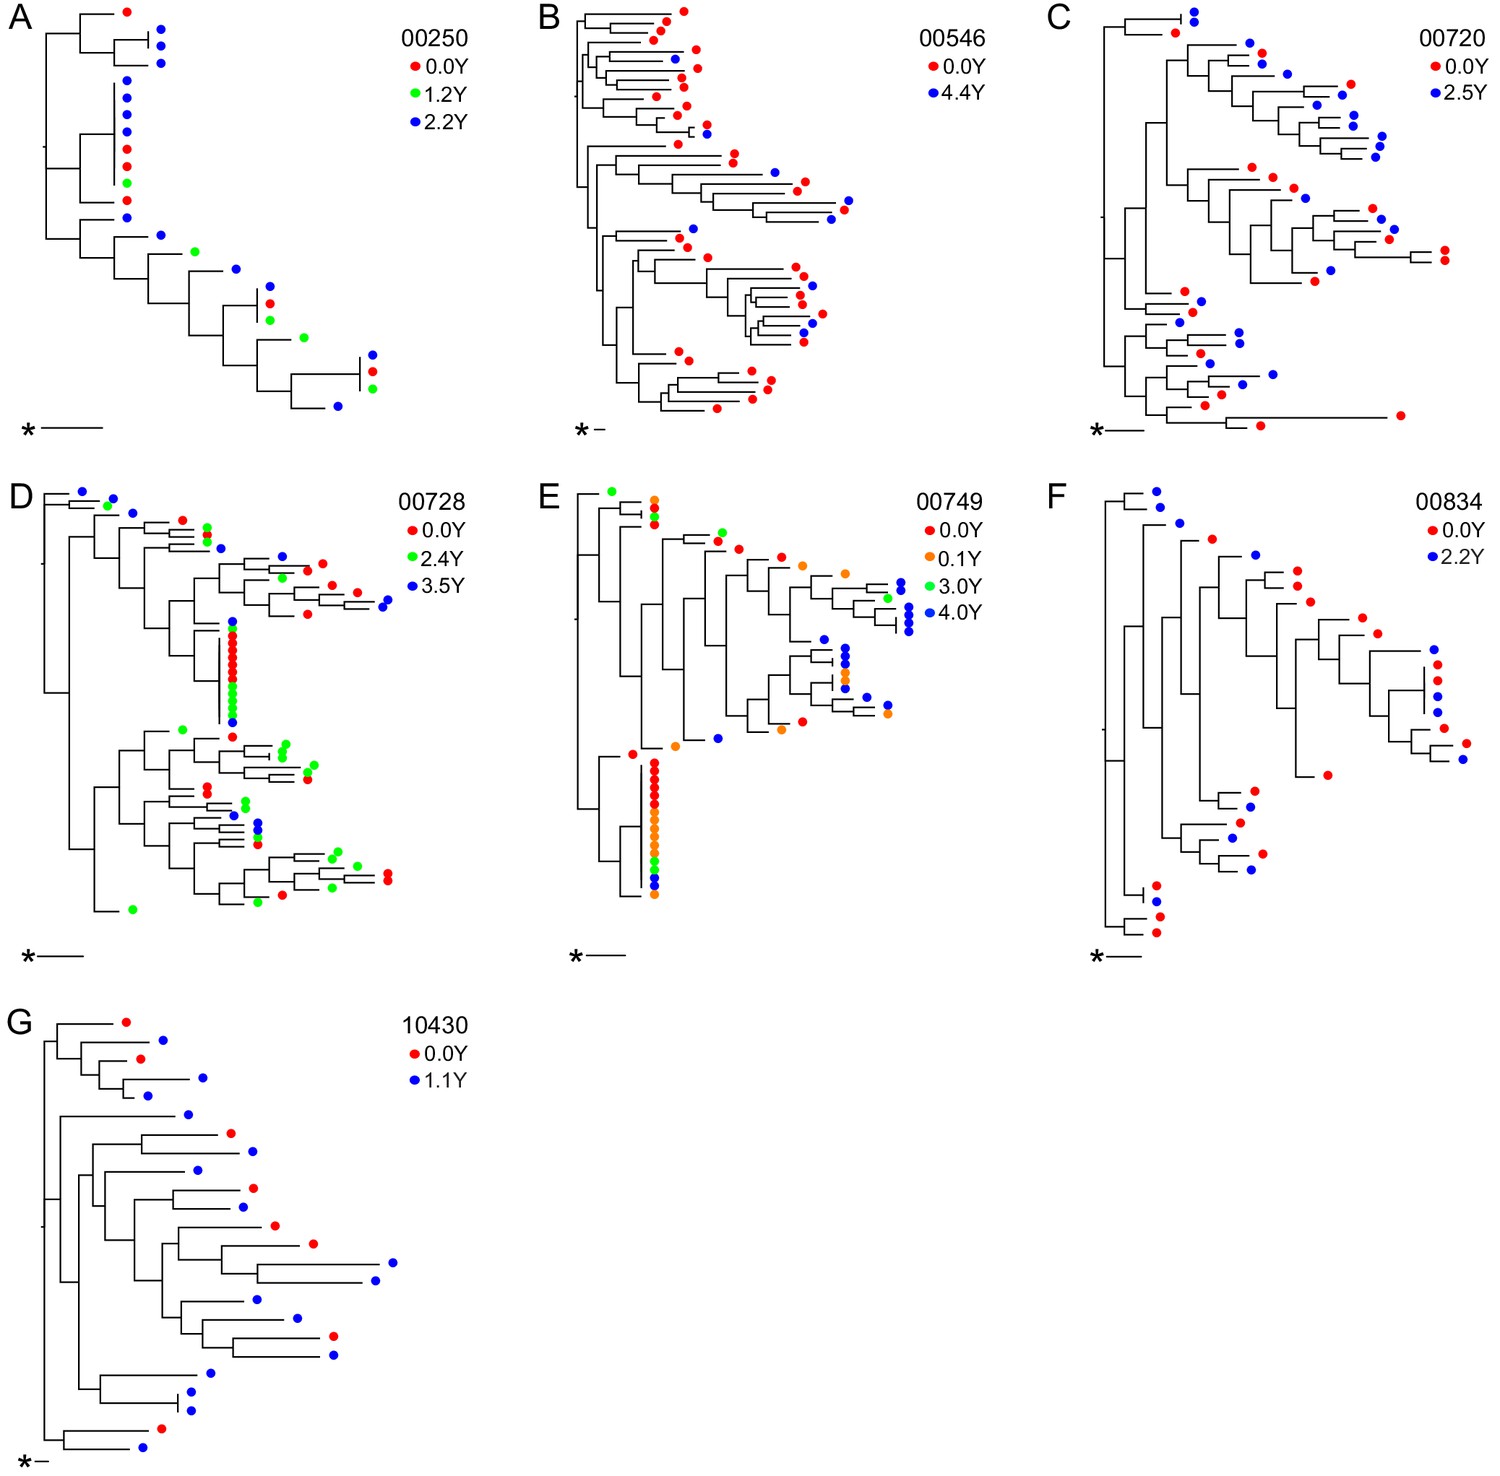
Longitudinal outgrowth virus sequences on neighbor-joining phylogenetic trees.
Phylogenetic trees displaying 5’ half genome sequences of longitudinal outgrowth virus sequences from seven participants (A–G). Each color represents a different time point in which outgrowth virus was sequenced for each participant. Sequences from different time points for each participant are distributed throughout the phylogeny. The genetic distance is shown by scale bar (indicated with an asterisk), 1 substitution out of 1000 bp.
Figure 3—figure supplement 2
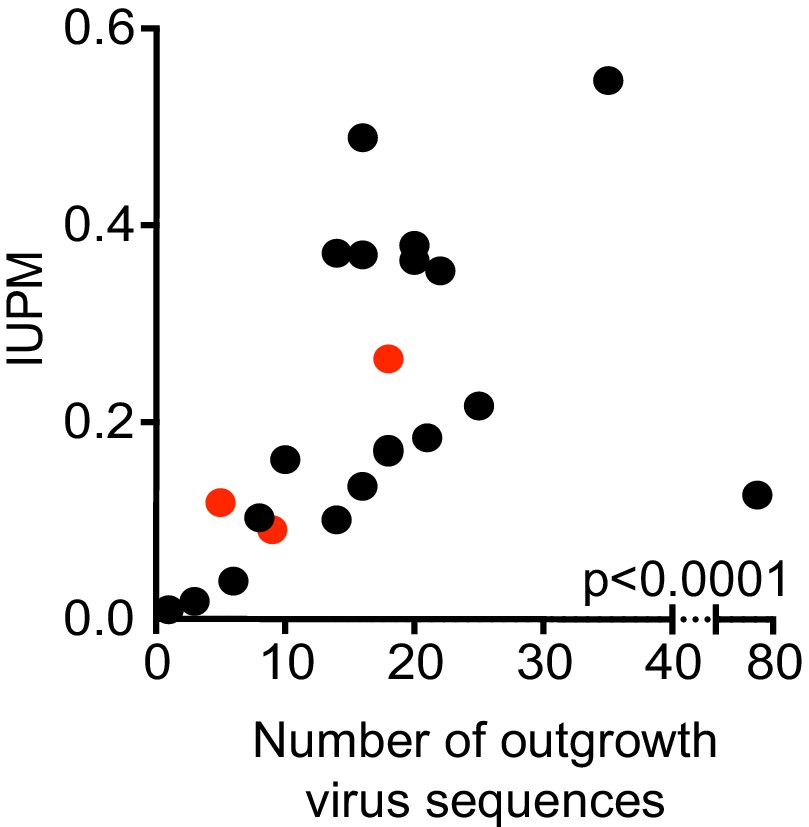
Size of the replication-competent reservoir as measured by infectious units per million (IUPM) against the number of sequences obtained by PacBio sequencing (r = 0.755, p<0.0001, Spearman Rank, n = 24 pairs).
Red dots are participants treated during acute HIV infection.
Figure 4 with 2 supplements
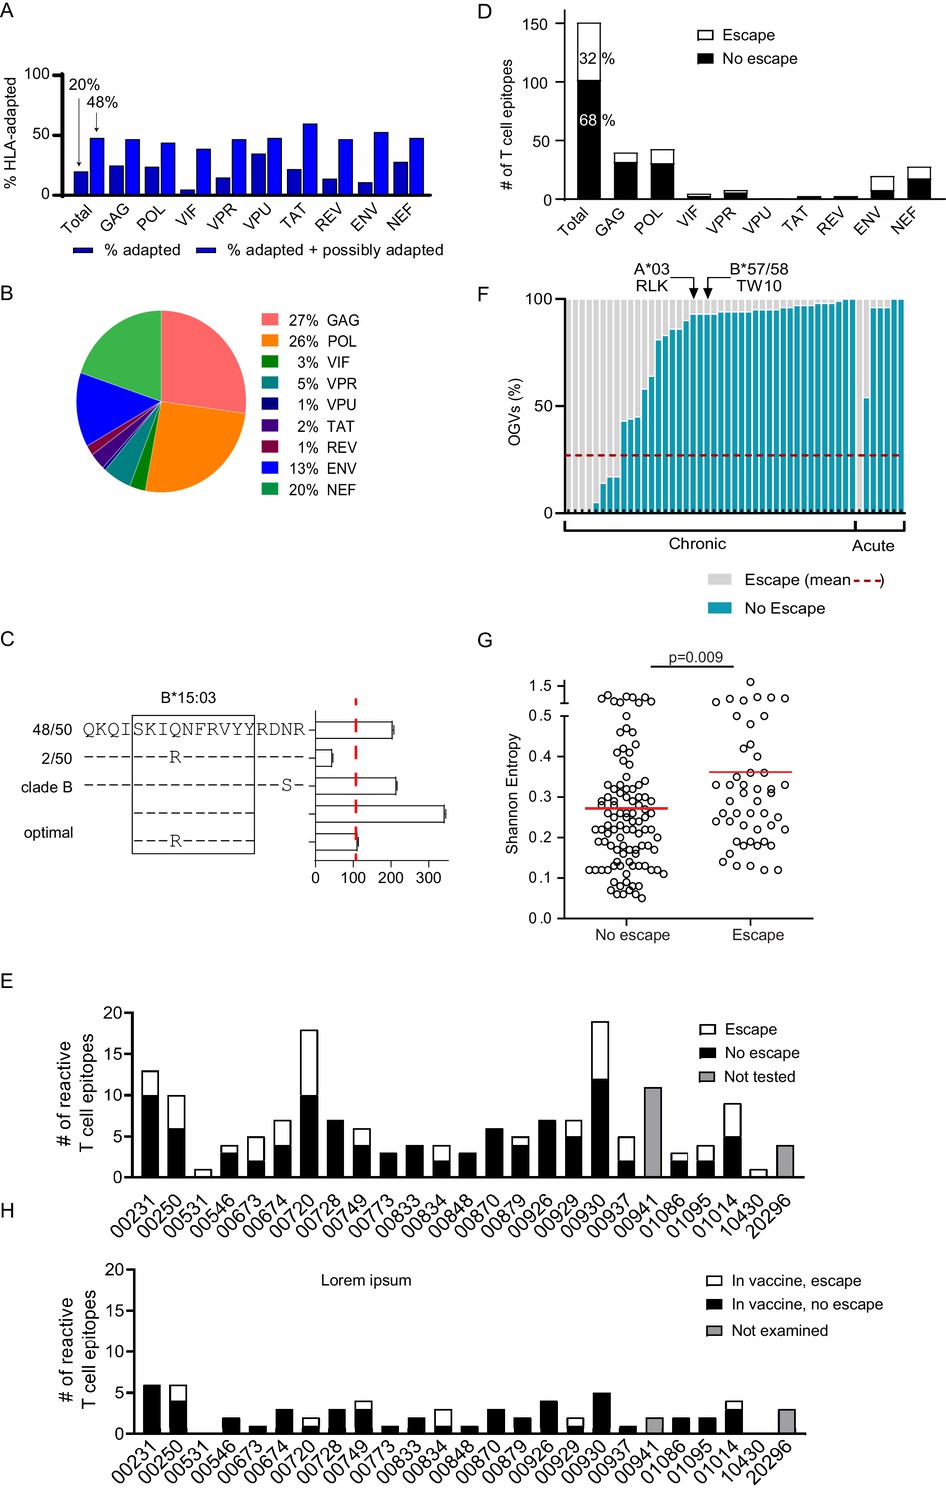
Quantifying T cell escape in the HIV-1 reservoir.
(A) HLA associations in OGVs: The proportion of polymorphisms harboring HLA-adapted (blue bar) and HLA-adapted + possibly HLA-adapted polymorphisms (light purple) in PLWH on ART (Clade B infected with full-length sequencing, n = 22). Results are summarized as total, as well as by individual HIV-1 protein. (B) T cell mapping: Ex vivo IFN-γ ELISpot was performed to determine T cell responses (n = 166), shown by protein, against the clade B HIV-1 proteome in 25 PLWH on ART. (C) Escape testing: Variants detected in OGVs of participant 00749 were tested ex vivo using IFN-γ ELISpot alongside the original reactive clade B 18-mer and optimal peptide. Bars show the T cell magnitude reported as spot forming units per million (SFU/M) PBMCs. Escape was defined as a ≥ 50% decrease (red vertical dotted line) in the mean magnitude of triplicate wells compared to the peptide which elicited the greatest T cell response. The left side shows the proportion of each variant in total OGVs (n = 50). (D) Cohort-level escape: T cell escape was examined in participants for which OGV sequence data were available (n = 23 participants, n = 151 epitopes). The proportion of empirically confirmed T cell epitopes that harbored escape variant(s) (n = 49, white) or no escape variant(s) (n = 102, black) in OGV. Results are summarized in total, as well as by individual HIV-1 protein. (E) Escape by participant: The proportion of reactive T cell epitopes that harbored escape variant(s) (white) and no escape variant(s) (black) per participant (n = 23). Gray bars indicate participants (n = 2) where epitopes (n = 15) were not tested for escape due to limited OGVs. (F) Within-epitope escape: Stacked bar graph showing the proportion of individual OGVs that conferred (gray –escape) or did not confer (blue – no escape) T cell escape in each epitope for which escape was observed (n = 49). Red dotted line is the average (27%) frequency of OGVs that conferred T cell escape across all epitopes. Data are ordered in ascending order of no escape OGVs, grouped by whether the participants initiated ART in either acute or chronic HIV-1 infection. Arrows identify immunoprevalent T cell epitopes, in which the majority of OGVs do not harbor escape variants. (G) Shannon entropy: A Shannon entropy score was calculated for reactive T cell epitopes for which sequence data were available (n = 151, 23 participants). Entropy was higher in epitopes which contained T cell escape variant(s) (n = 49, median = 0.29) than epitopes with no escape variant(s) (n = 102, median = 0.23) in the OGVs (Mann Whitney two-tailed test, p=0.009). (H) Escape in vaccine immunogen: The proportion of reactive T cell epitopes in each participant (n = 25) that are targeted by the HIVconsvX immunogen (total = 59) and harbored one or more escape variants (white), or no escape variants (black) in OGVs. Gray bars indicate participants (n = 2) where epitopes in the immunogen could not be examined for escape due to limited OGVs.
Figure 4—figure supplement 1
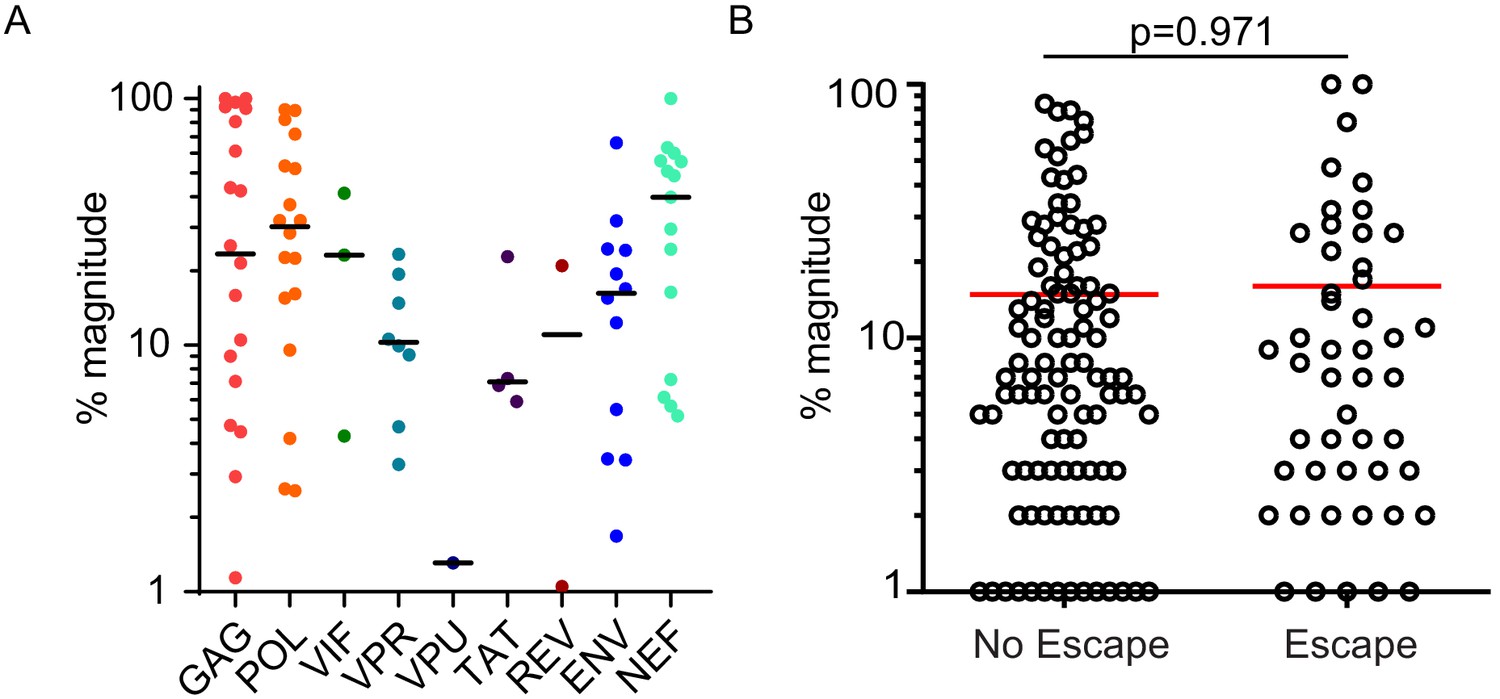
HIV-1-specific T cell responses in PLWH on ART.
(A) The % magnitude of each mapped T cell response (n = 25 participants, n = 166 epitopes) was calculated as a percentage of the total response measured by ELISpot in that individual, and graphed by HIV-1 protein. Horizontal bars represent median values and each point represents an individual T cell response. (B) The percent magnitude was calculated for all reactive T cell responses for which there was sequencing data from outgrowth viruses (n = 23 participants, n = 151). There was no difference in the % magnitude between T cell responses that targeted epitopes harboring escape variants (n = 49, median % magnitude = 7.5) and epitopes with no escape variants (n = 102, median % magnitude = 7.0). (Mann Whitney two-tailed test, p=0.971).
Figure 4—figure supplement 2

Outgrowth virus sequences and DNA sequences on neighbor-joining phylogenetic trees.
Phylogenetic trees displaying longitudinal outgrowth virus sequences (red text) and DNA sequences, intact (blue text, DNA no stop codon (DNA no_sc)) and non-intact (black text, DNA stop codon (DNA_sc)) from resting CD4+ T cells in two participants (A–C). Highlighter plots showing differences between outgrowth virus sequences and intact DNA sequences (shaded in yellow) for HIV nef (A), and HIV gag (B) in participant 00728, and HIV Gag (C) in participant 00720. Variants are compared to the consensus sequence. A, C, T, and G mismatches, gaps, APOBEC and G to A mutation are shown in green, blue, orange, red and gray, purple and open purple square, respectively. Nucleotide numbering is relative to the reference strain HXB2. Mapped T cell responses are indicated by a gray box. The genetic distance is shown by scale bar (indicated with an asterisk), showing the number of nucleotide substitutions out of 1000 bp.
Tables
Table 1
Demographic and clinical data of participants (n = 25).
| Participant | Sex | Race* | Ethnicity† | Status at diagnosis‡ | Age§ | Years suppressed¶ | Hiv-1 RNA** | Nadir CD4 | Mean IUPM [n]†† | HLA type |
|---|---|---|---|---|---|---|---|---|---|---|
| 00231 | M | C | NH | A | 66 | 9.66 | 1.5E+07 | 277 | 0.839 [1] | A*11:01, A*24:02, B*35:TDS‡‡‡, B*35:02, C*04:01, C*04:01 |
| 00250 | M | C | NH | A | 48 | 7.44 | 6.8E+05 | 403 | 0.318 [3] | A*01:01, A*31:01, B*27:03, B*44:02, C*02:02, C*06:02 |
| 00531 | M | C | NH | C | 52 | 14.87 | 3.8E+05 | 81 | 1.372 [5] | A*02:01, A*02:01, B*07:02, B*44:02, C*03:04, C*07:02 |
| 00546 | M | C | NH | C | 56 | 20.09§§ | N/A | 195 | 0.453 [2] | A*02:01, A*32:01, B*15:01, B*40:01, C*02:02, C*03:04 |
| 00673 | M | C | NH | C | 49 | 8.05 | 3.2E+05 | 168 | 0.790 [4] | A*24:02, A*30:02, B*15:17, B*18:01, C*05:01, C*07:01 |
| 00674 | M | C | NH | C | 57 | 6.25 | 6.8E+04 | 338 | 2.064 [5] | A*02:01, A*03:01, B*07:TDVB§§§, B*40:01, C*03:04, C*07:02 |
| 00720 | M | C | NH | C | 25 | 2.96 | 4.0E+05 | 168 | 0.499 [4] | A*01:01, A*02:01, B*07:02, B*18:01, C*07:02, C*12:03 |
| 00728 | M | C | NH | C | 30 | 6.00 | 1.8E+04 | 354¶¶ | 0.676 [6] | A*02:01, A*03:01, B*07:02, B*40:02, C*02:02, C*07:02 |
| 00749 | M | AA | NH | C | 25 | 4.10 | N/A | 402 | 0.365 [2] | A*03:01, A*30:02, B*15:03, B*40:01, C*02:10, C*03:04 |
| 00773 | M | C | NH | A | 46 | 2.01 | 2.4E+04 | 234 | 0.233 [1] | A*02:01, A*11:01, B*18:01, B*51:01, C*01:02, C*02:02 |
| 00833 | M | AA | NH | C | 36 | 8.16 | 7.9E+03 | 358*** | 0.048 [1] | A*02:02, A*74:01, B*15:16, B*82:01, C*03:02, C*14:02 |
| 00834 | M | AA | NH | C | 25 | 2.15 | 2.1E+04 | 365 | 0.479 [1] | A*02:05, A*30:02, B*51:01, B*58:01, C*04:01, C*16:01 |
| 00848 | F | C | NH | C | 44 | 4.78 | 1.4E+04 | 800 | 0.022 [1] | A*01:01, A*30:02, B*08:01, B*18:01, C*05:01, C*07:01 |
| 00870 | M | C | NH | C | 54 | 5.28 | 5.3E+04 | 154††† | 1.400 [1] | A*11:01, A*24:02, B*35:01, B*55:01, C*03:03, C*04:01 |
| 00879 | F | AA | NH | C | 54 | 1.60 | 4.5E+02 | 612 | 0.093 [1] | A*03:01, A*33:01, B*14:02, B*58:02, C*06:02, C*08:02 |
| 00926 | F | AA | NH | C | 38 | 3.83 | 1.3E+05 | 508 | 0.262 [1] | A*02:02, A*02:05, B*:39:10, B*45:01, C*12:03, C*16:01 |
| 00929 | F | AA | NH | C | 61 | 1.77 | 1.9E+04 | 528 | 0.268 [1] | A*01:01, A*74:AB****, B*15:MJMN¶¶¶, B*81:AB****, C*02:10, C*18:01 |
| 00930 | M | C | NH | C | 53 | 2.70 | 6.4E+05 | 174 | 2.084 [1] | A*01:01, A*11:01, B*08:01, B*40:01, C*03:04, C*07:01 |
| 00937 | F | AA | NH | C | 45 | 5.84 | 8.8E+04 | 260 | 1.276 [2] | A*03:01, A*30:01, B*35:01, B*52:01, C*04:01, C*16:01 |
| 00941 | F | C | NH | C | 47 | 14.58 | 6.6E+03 | 12 | 1.50E-08‡‡[1] | N/A |
| 01014 | F | C | H | C | 52 | 19.85 | 1.2E+06 | 16 | 0.338 [1] | A*23:01, A*74:01, B*07:02, B*41:02, C*15:05, C*17:03 |
| 01086 | F | AA | NH | C | 30 | 5.81 | N/A | 320 | 0.0529 [1] | A*02:05, A*03:01, B*07:06, B*53:01, C*04:01, C*07:02 |
| 01095 | F | C | NH | C | 54 | 6.56 | 1.1E+05 | 88 | 2.528 [1] | A*03:01, A*31:01, B*40:01, B*44:02, C*03:04, C*05:01 |
| 10430 | M | C | NH | C | 59 | 9.47 | 8.1E+04 | 78 | 1.367 [5] | A*02:01, A*30:01, B*13:02, B*51:01, C*06:02, C*14:02 |
| 20296 | M | C | NH | A | 35 | 6.90 | 2.5E+04 | 427 | 1.50E-08‡‡ [1] | A*29:02, A*31:01, B*08:01, B*44:03, C*07:01, C*16:01 |
| Mean: | 46 | 7.22 | 8.6E+05 | 293 | 0.775 | |||||
| Range: | 25–66 | 1.6–20.10 | 4.5E+02- 1.5E+07 | 12–800 | 1.50E-08–2.528 |
-
* C: White/Caucasian, AA: Black/African American.
† NH: Non-Hispanic; H: Hispanic.
-
‡A: Initiation of ART during acute HIV-1 infection, prior to establishment of setpoint viremia; C: Initiating of ART during chronic HIV-1 infection.
¶ Durable suppression defined as time from ≤ 40 copies/ml to date of T cell measurement.
-
** HIV-1 RNA at start of combination ART.
†† IUPM (infectious units per million). Mean of IUPM measurements over 2 years from date of T cell mapping.
-
‡‡ Below the limit of detection.
§§00546 on monotherapy from 1985 to 1996, initiated combination ART in 1996. Years suppressed calculated from data of initiation of cART.
-
¶¶ CD4 count 261 on 8/17/17 (after cell collection date).
***Lowest CD4 value, CD4 nadir before ART initiation is 567.
-
†††Lowest CD4 value, CD4 nadir before ART initiation is 157.
‡‡‡B*35:01/B*35:42.
-
§§§ B*07:02/B*07:61/B*07:16.
¶¶¶ B*15:03/B*15:103/B*15:220.
-
**** B*81:01/B*81:02.
Table 2
HIV-1-Specific T cell reponses (n = 25 participants).
| Participant | Summed magnitude (106/PMBC) | Immunodominant T cell response | Total T cell breadth | # of epitopes with escape variant(s) in outgrowth virus | Escape in immunodominant epitope (Y/N) |
|---|---|---|---|---|---|
| 00231 | 2856 | Vif153→170 | 13 | 3 | Y |
| 00250 | 1531 | Env765→782 | 10 | 4 | Y |
| 00531 | 390 | Gag357→374 | 1 | 1 | Y |
| 00546 | 895 | Gag260→277 | 4 | 1 | N |
| 00673 | 2313 | Nef73→90 | 5 | 3 | N |
| 00674 | 1394 | Env838→855 | 7 | 3 | Y |
| 00720 | 1947 | Pol521→538 | 18 | 8 | Y |
| 00728 | 439 | Gag204→221 | 7 | 0 | N |
| 00749 | 418 | Pol481→498 | 6 | 3 | N |
| 00773 | 1174 | Pol273→290 | 3 | 0 | N |
| 00833 | 333 | Gag164→181 | 4 | 0 | N |
| 00834 | 725 | Pol273→290 | 4 | 2 | N |
| 00848 | 276 | Nef89→106 | 3 | 0 | N |
| 00870 | 363 | Nef65→82 | 6 | 0 | N |
| 00879 | 500 | Gag292→309 | 5 | 1 | N |
| 00926 | 234 | Gag180→197 | 7 | 0 | N |
| 00929 | 798 | Gag180→197 | 7 | 2 | N |
| 00930 | 2182 | Nef81→98 | 19 | 7 | Y |
| 00937 | 297 | Pol257→274 | 5 | 3 | N |
| 00941 | 2216 | Nef81→98 | 11 | N/A* | N/A* |
| 01014 | 1463 | Nef65→82 | 9 | 4 | N |
| 01086 | 258 | Gag17→34 | 3 | 1 | Y |
| 01095 | 2337 | Pol313→330 | 4 | 2 | N |
| 10430 | 157 | Nef97→114 | 1 | 1 | Y |
| 20296 | 331 | Gag204→221 | 4 | N/A* | N/A* |
| Total | 166 | 49 (32% - 49/151) | |||
| Mean: | 1033 | 7 | 2 | ||
| Range: | 157–2856 | 1–19 | 0–8 |
-
*No outgrowth virus sequence data available to test for the presence of an escape variant in the sequenced outgrowth virus.
Additional files
-
Supplementary file 1
Size of the replication-competent reservoir in PLWH on ART (n = 25 participants) as measured by infectious units per million (IUPM) up to 2 years prior to T cell mapping date.
- https://cdn.elifesciences.org/articles/57246/elife-57246-supp1-v2.xlsx
-
Supplementary file 2
The number of near full-length sequences obtained from p24 antigen positive wells generated in quantitative viral outgrowth assays for each participant, and the pairwise diversity of sequences obtained (5’ and 3’ halves).
- https://cdn.elifesciences.org/articles/57246/elife-57246-supp2-v2.xlsx
-
Supplementary file 3
Percentage of clonal sequences obtained from p24 antigen positive wells generated in quantitative viral outgrowth assays for each participant (5’ and 3’ halves).
- https://cdn.elifesciences.org/articles/57246/elife-57246-supp3-v2.xlsx
-
Supplementary file 4
Summary of HLA-associated polymorphism by HIV-1 protein.
- https://cdn.elifesciences.org/articles/57246/elife-57246-supp4-v2.xlsx
-
Supplementary file 5
Summary of reactive T cell epitopes in study participants.
- https://cdn.elifesciences.org/articles/57246/elife-57246-supp5-v2.xlsx
-
Supplementary file 6
Raw data from studies evaluating viral T cell escape variants in the replication-competent reservoir.
- https://cdn.elifesciences.org/articles/57246/elife-57246-supp6-v2.xlsx
-
Supplementary file 7
HIV-1-specific T cell measurements and HIV reservoir size.
- https://cdn.elifesciences.org/articles/57246/elife-57246-supp7-v2.docx
-
Supplementary file 8
HIV-1-specific T cell responses do not correlated with the size of the HIV reservoir.
Correlation between T cell breadth and summed magnitude of T cell response to HIV-1 protein in PLWH on ART (n = 25 participants, n = 166 epitopes), and adjusted for escape variants (n = 23 participants, n = 102 epitopes excluding 49 epitopes at which escape was observed), measured by IFN-γ ELISpot and the size of the replication-competent reservoir as measured by infectious units per million (IUPM) using Spearman Rank.
- https://cdn.elifesciences.org/articles/57246/elife-57246-supp8-v2.docx
-
Supplementary file 9
Reactive T cell epitopes in PLWH on ART (n = 23 participants, 151 total mapped epitopes including 49 escape epitopes) are targeted by conserved immunogen vaccines.
Escape in the HIV-1 reservoir is consistently lower in T cell epitopes that fall within conserved immunogen vaccines than mapped epitopes that fall outside of the immunogens.
- https://cdn.elifesciences.org/articles/57246/elife-57246-supp9-v2.docx
-
Supplementary file 10
Comparison of approaches to assess pre-ART escape in the latent HIV-1 reservoir.
- https://cdn.elifesciences.org/articles/57246/elife-57246-supp10-v2.docx
-
Transparent reporting form
- https://cdn.elifesciences.org/articles/57246/elife-57246-transrepform-v2.docx
Download links
A two-part list of links to download the article, or parts of the article, in various formats.
Downloads (link to download the article as PDF)
Open citations (links to open the citations from this article in various online reference manager services)
Cite this article (links to download the citations from this article in formats compatible with various reference manager tools)
The HIV-1 latent reservoir is largely sensitive to circulating T cells
eLife 9:e57246.
https://doi.org/10.7554/eLife.57246


