Slowly folding surface extension in the prototypic avian hepatitis B virus capsid governs stability
- Julius Maximilian University of Würzburg, Department of Biochemistry and Rudolf Virchow Centre, Germany
- University Hospital Freiburg, Internal Medicine 2/Molecular Biology, Germany
Figures
Figure 1 with 5 supplements

Image reconstruction of CLPs vitrified 10 months after purification.
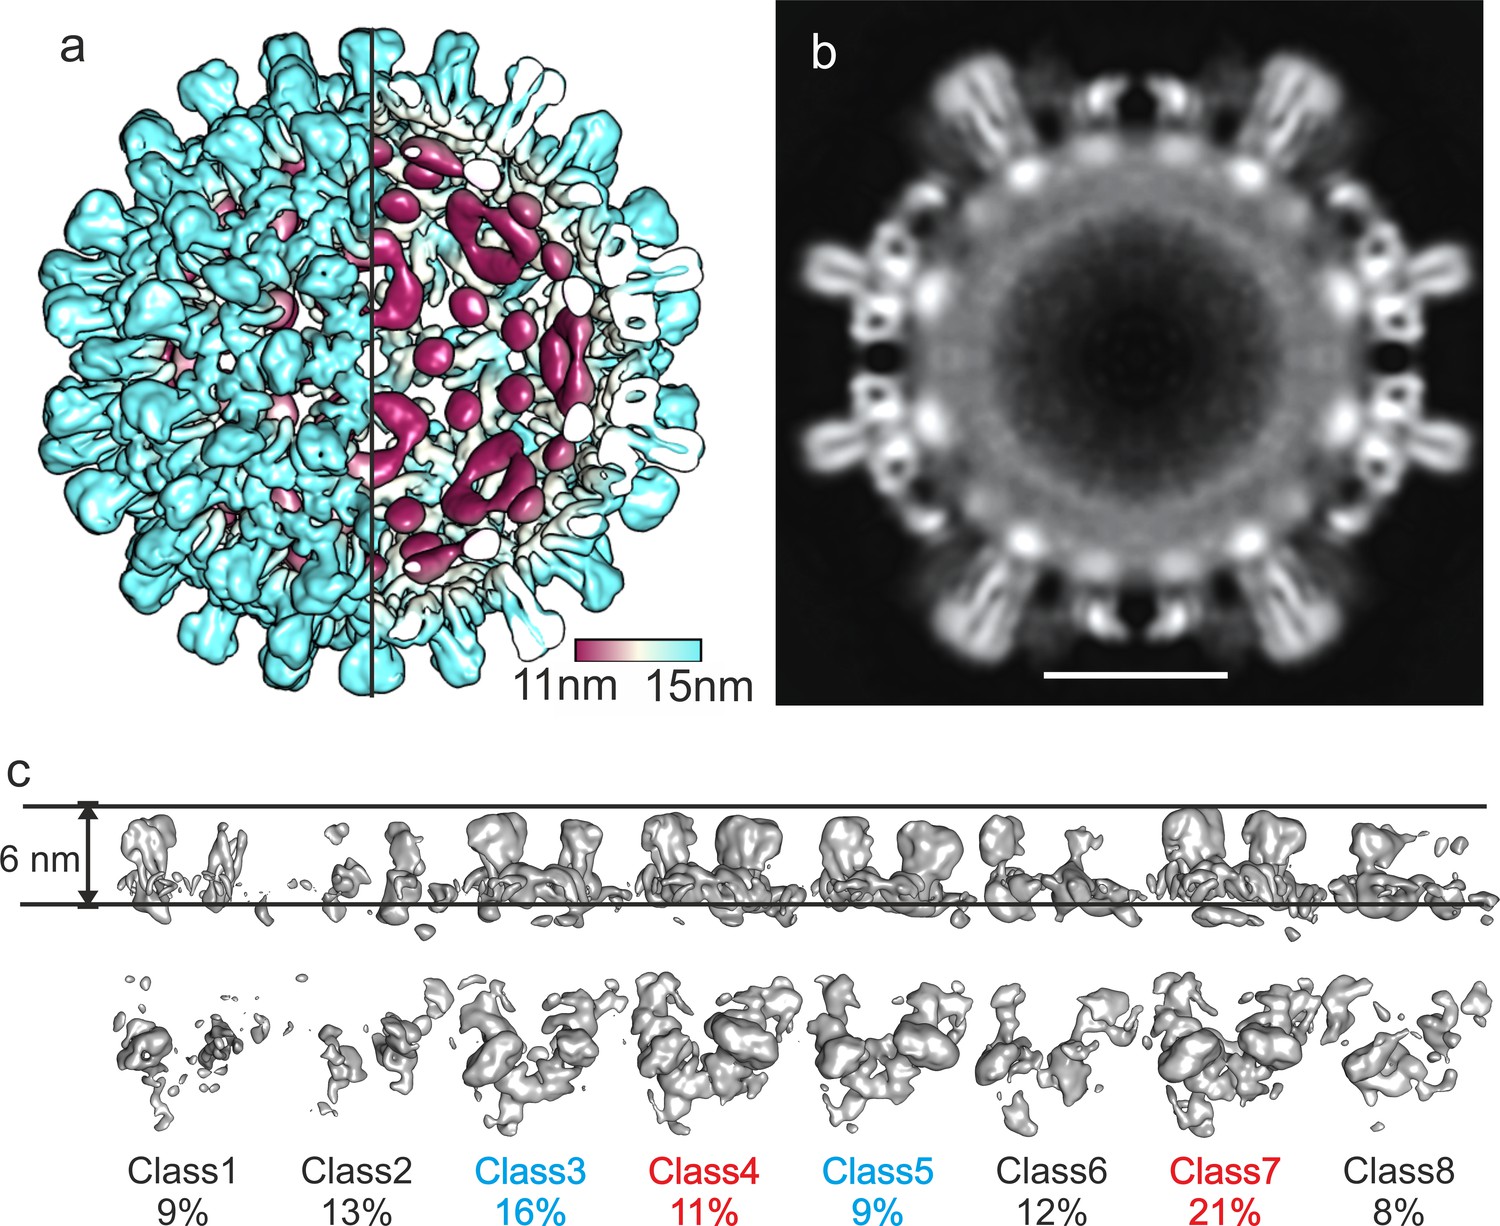
(a) A segment of the capsid color-coded by the radial position. The length of the color key corresponds to 6 nm. For comparison, the capsid of human HBc is shown in Figure 1—figure supplement 1. A representative micrograph and class averages are shown in Figure 1—figure supplement 2. The same sample 2 weeks after purification was less well resolved (Figure 1—figure supplement 3). Conditions for imaging and image processing are summarized in Table 1. (b) An equatorial slice through the EM-density with spikes indicated by arrows (narrow sections: filled arrowheads; wide cross sections: open arrowheads). The diffuse shell of density at the capsid interior is highlighted by a white arch. The scale bar indicates 10 nm. (c) Surface representations of 3D-class averages from the classification of the asymmetric units without alignment. The two horizontal lines indicate the same radial position and are 6 nm apart. Class 1, 2 and 4 differ in their radial positions by up to 2 Å. Class five represents holes in the CLPs. Perpendicular views are shown in Figure 1—figure supplement 4. (d) Model of the asymmetric unit of DHBc fitted into the EM-map. Chain A is shown in blue, chain B in cyan, chain C in yellow and chain D in red. The model validation is summarized in Table 2. The model also fits with the map of DHBc co-expressed with FkpA two weeks after purification (Figure 1—figure supplement 5) (e,f) Perpendicular views of the map of the CD-dimer with the model of the CD-dimer fitted. Density accounted for by the extension domain (79-119) is colored white, the core of chain C in yellow and that of chain D in red. The density at the foot of the spikes (magenta) is neither accounted by the assembly domain of chain C nor of chain D and is modelled with the most C-terminal residues.
Figure 1—figure supplement 1
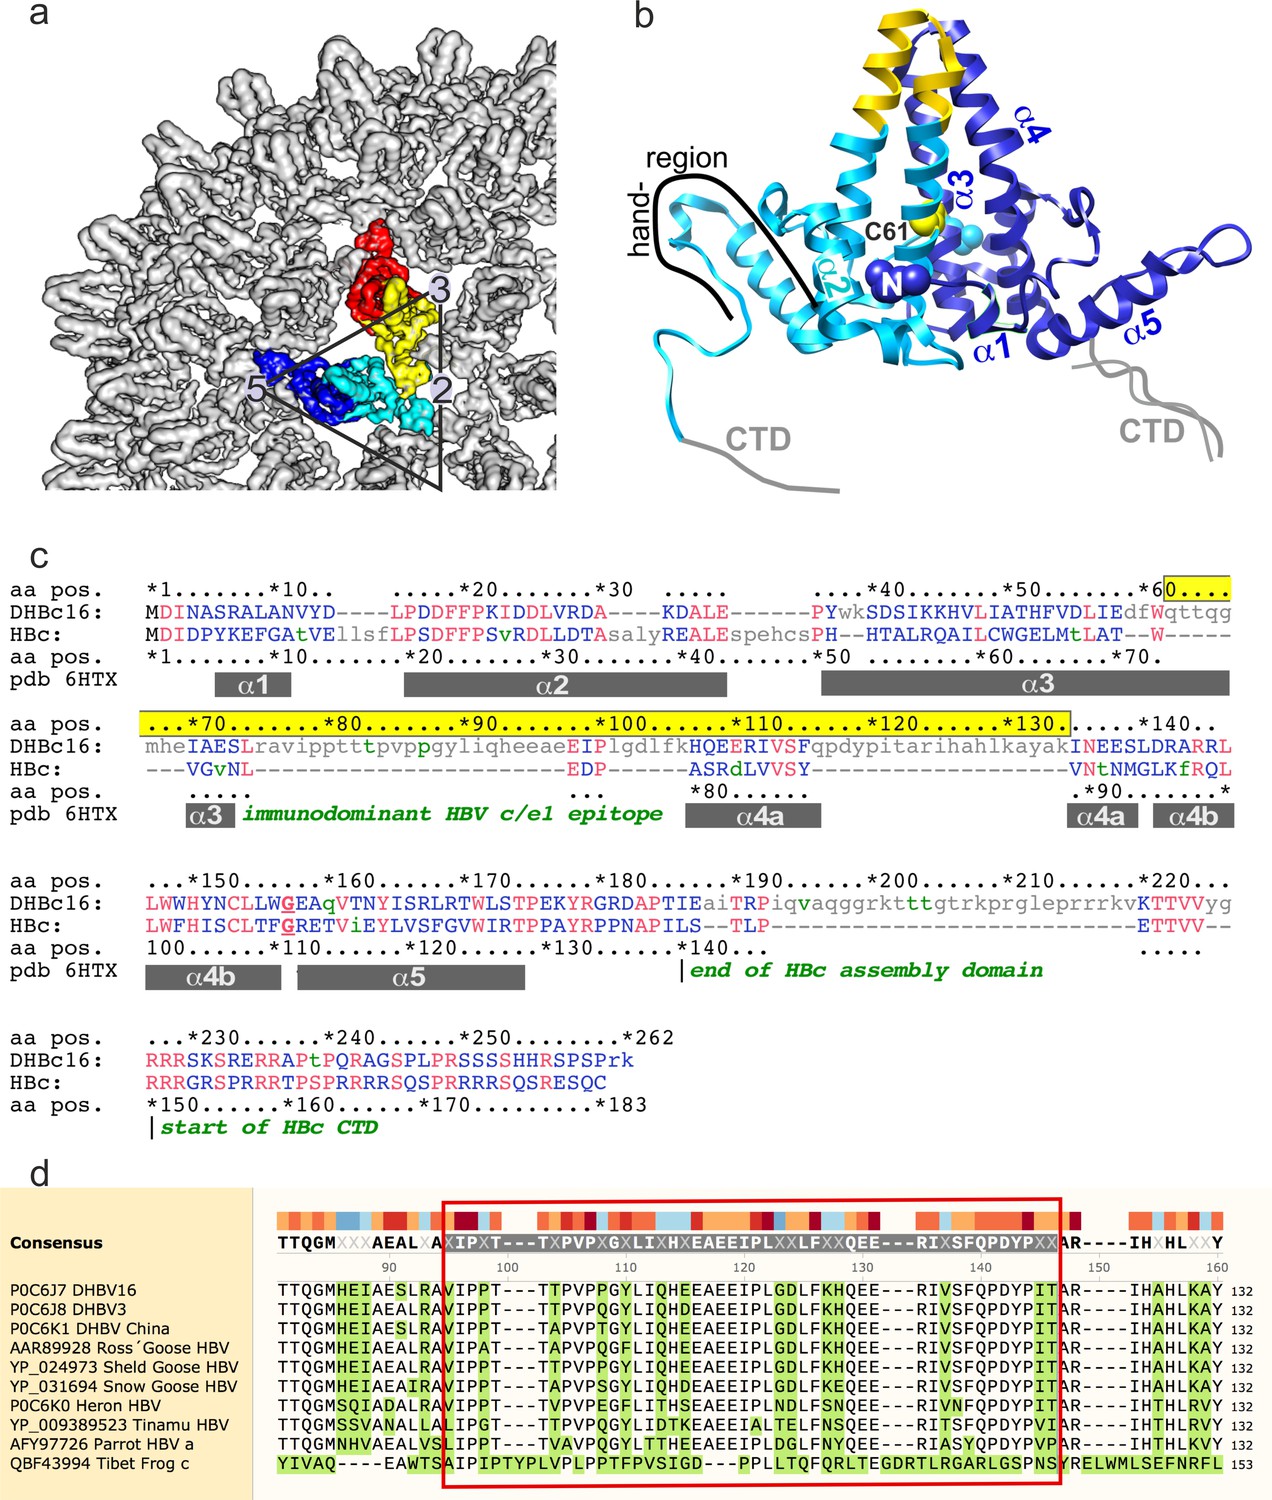
Organization of HBc.
(a) Surface representation of a segment of HBc CLPs (Böttcher and Nassal, 2018), with the subunits in one asymmetric unit highlighted in color (blue chain A, cyan chain B, yellow chain C, red chain D). (b) Representation of the AB-dimer of the asymmetric unit. The naming of the helices follows Wynne et al., 1999. Inter-dimer contacts are formed between the hand-regions. Inner dimer contacts in HBc can be stabilized by a disulfide-bridge between Cys61 in HBc. (c) PFAM alignment of HBc and DHBc. The alignment corresponds to Conserved Protein Domain Family pfam00906 Hepatitis_core, except that the primary sequences were adapted (lower case green letters) to match the isolate-specific DHBc and HBc proteins used here (Uniprot IDs: P0C6J7.1 and P03146.1, respectively). Identical residues are shown in red, lower case grey letters indicate non-aligning residues. Grey bars show the positions of HBc helices α1 to α5 as in pdb: 1QGT; HBc domain borders are indicated in dark green. DHBc sequence 62–134 (highlighted in yellow) is predicted to replace HBc sequence 71–89, i.e. the spike tip comprising the C terminal part of α3, the connecting loop (the c/e1 epitope) and the N terminal part of α4. DHBc sequence 78–122 (light-green box) represents the biochemically predicted and here directly confirmed extension domain at the spike tip. (d) Conservation of the extension domain sequence among hepadnaviral large type CPs: The indicated CP sequences with their Uniprot and/or NCBI accession numbers were aligned using Clustal Omega as implemented in SnapGene v. 5. Tibet Frog c refers to one of three published Tibetan Frog HBV sequences. Conservation is indicated by colored blocks, with dark blue indicating the lowest and dark red the highest conservation. Residues differing from the consensus are shown with green background. The avian HBV CP sequences are highly similar to each other, including in the extension domain (red box around DHBV16 CP aa V77-T122). The frog virus sequence only shares some interspersed key motifs; however, the sequence predicted to align with the DHBc extension domain is also exceptionally rich in proline residues (10 in 48 aa total) which also cluster mostly in the 5'- proximal part.
Figure 1—figure supplement 2
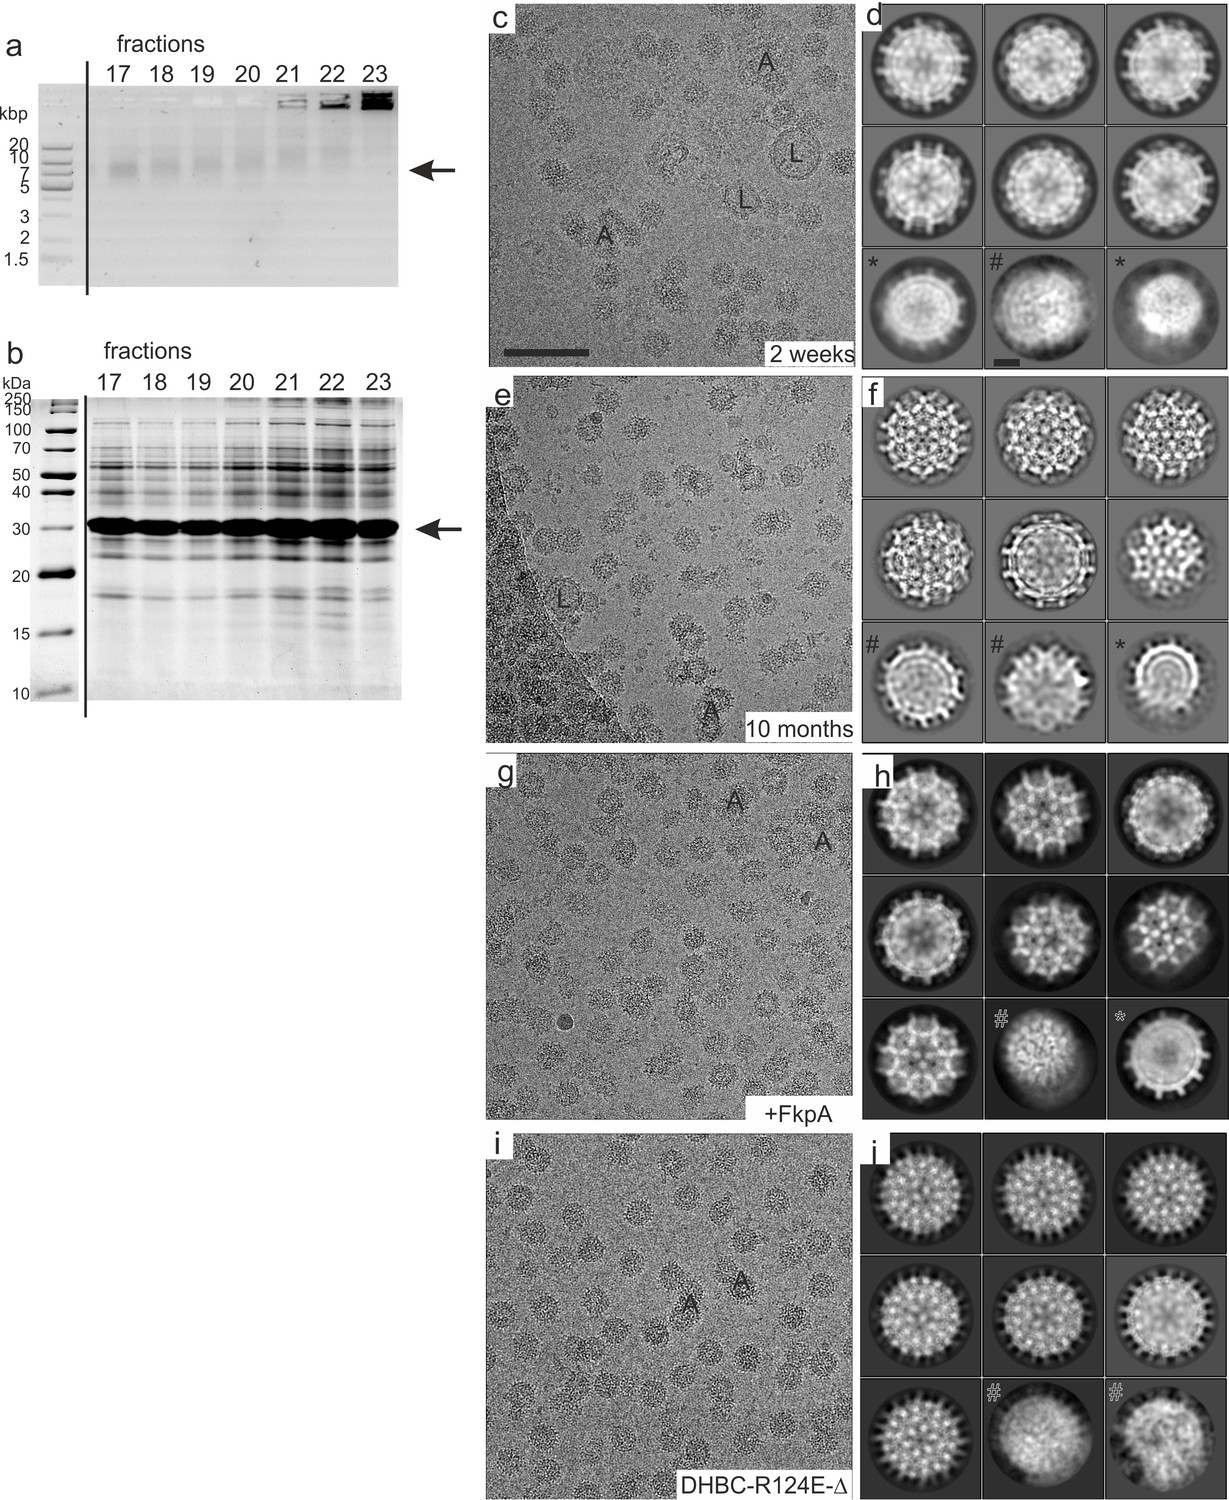
Sample preparation and 2D-image analysis of DHBc 2 weeks and 10 months after purification.
(a) Analysis of fractions obtained by step-gradient ultra-centrifugation with native agarose gel electrophoresis with 1% agarose in 2 x TAE buffer. The staining was done with SYBR Safe (Thermo Fisher Scientific) at a dilution of 1:5.000. The position of intact DHBc CLPs is indicated by an arrow. The sizes of the DNA standard are indicated in kilo base pair (kbp). Intact DHBc CLPs have an electrophoretic mobility comparable to DNA with a size of approximately 10 kbp in TAE buffer (fractions 17–18). In the following fractions (towards higher sucrose densities) all bands become gradually diffuse and shift towards lower mobility. Additionally, an increasing amount of proteins is aggregated and stuck in the wells of the agarose gel. (b) The same fractions were subjected to SDS-PAGE with 15% acrylamide and stained with Coomassie Brilliant Blue. The position of DHBc (30 kDa) is indicated by an arrow. (c, d) DHBc after 2 weeks storage. (c) A typical micrograph shows aggregated CLPs (some labelled with ‘A’) and lipid vesicles (some labelled with ‘L’). The scale bar indicates 100 nm. (d) Selected class averages of CLPs vitrified 2 weeks after purification. Most CLPs fall into one size class. Some class averages represent deformed CLPs (‘#”) and some are consistent with a smaller size class (‘*”). The scale bar in (d) indicates 10 nm. (e,f) Typical micrograph (e) and selected class averages (f) of DHBc after 10 months of storage. Class averages of particles vitrified 10 months after purification are better resolved than CLPs vitrified 2 weeks after purification and show projections of secondary structural elements in 2D-class averages. (g,h) Typical micrograph (g) and selected class averages of DHBc co-expressed with the peptidyl-prolyl cis-trans isomerase FkpA after 2 weeks of storage. The class averages are better resolved than DHBc CLPs without co-expressed FkpA after 2 weeks of storage. (i,j) Typical micrograph of DHBc-R124E-Δ i and typical class averages j. (k,l) Typical micrograph of DHBc-R124E (k) and typical class averages (l).
Figure 1—figure supplement 3
Reconstruction of CLPs vitrified 2 weeks after purification.
(a) Surface representation color-coded by the radius. The right front quarter of the CLP is not shown giving a view to the interior of the CLP at the left side. (b) Equatorial slice through the capsid. The scale bar indicates 10 nm. (c) Surface representations of 3D-classes of the asymmetric units of CLPs. The asymmetric units were classified without further alignment thus classes can also represent positional variability relative to the expected position in the capsid. The horizontal lines indicate the same radial position in the capsid. All surfaces were calculated at the same density threshold. The relative occupancies of the classes are indicated. Classes 1, 2, 6 and 8 show a weaker than expected density probably representing holes or grossly misplaced subunits. Classes 3 and 5 show one wide and one narrow spike. Classes 4 and 7 show two wide spikes.
Figure 1—figure supplement 4
Resolution of DHBc CLPs.
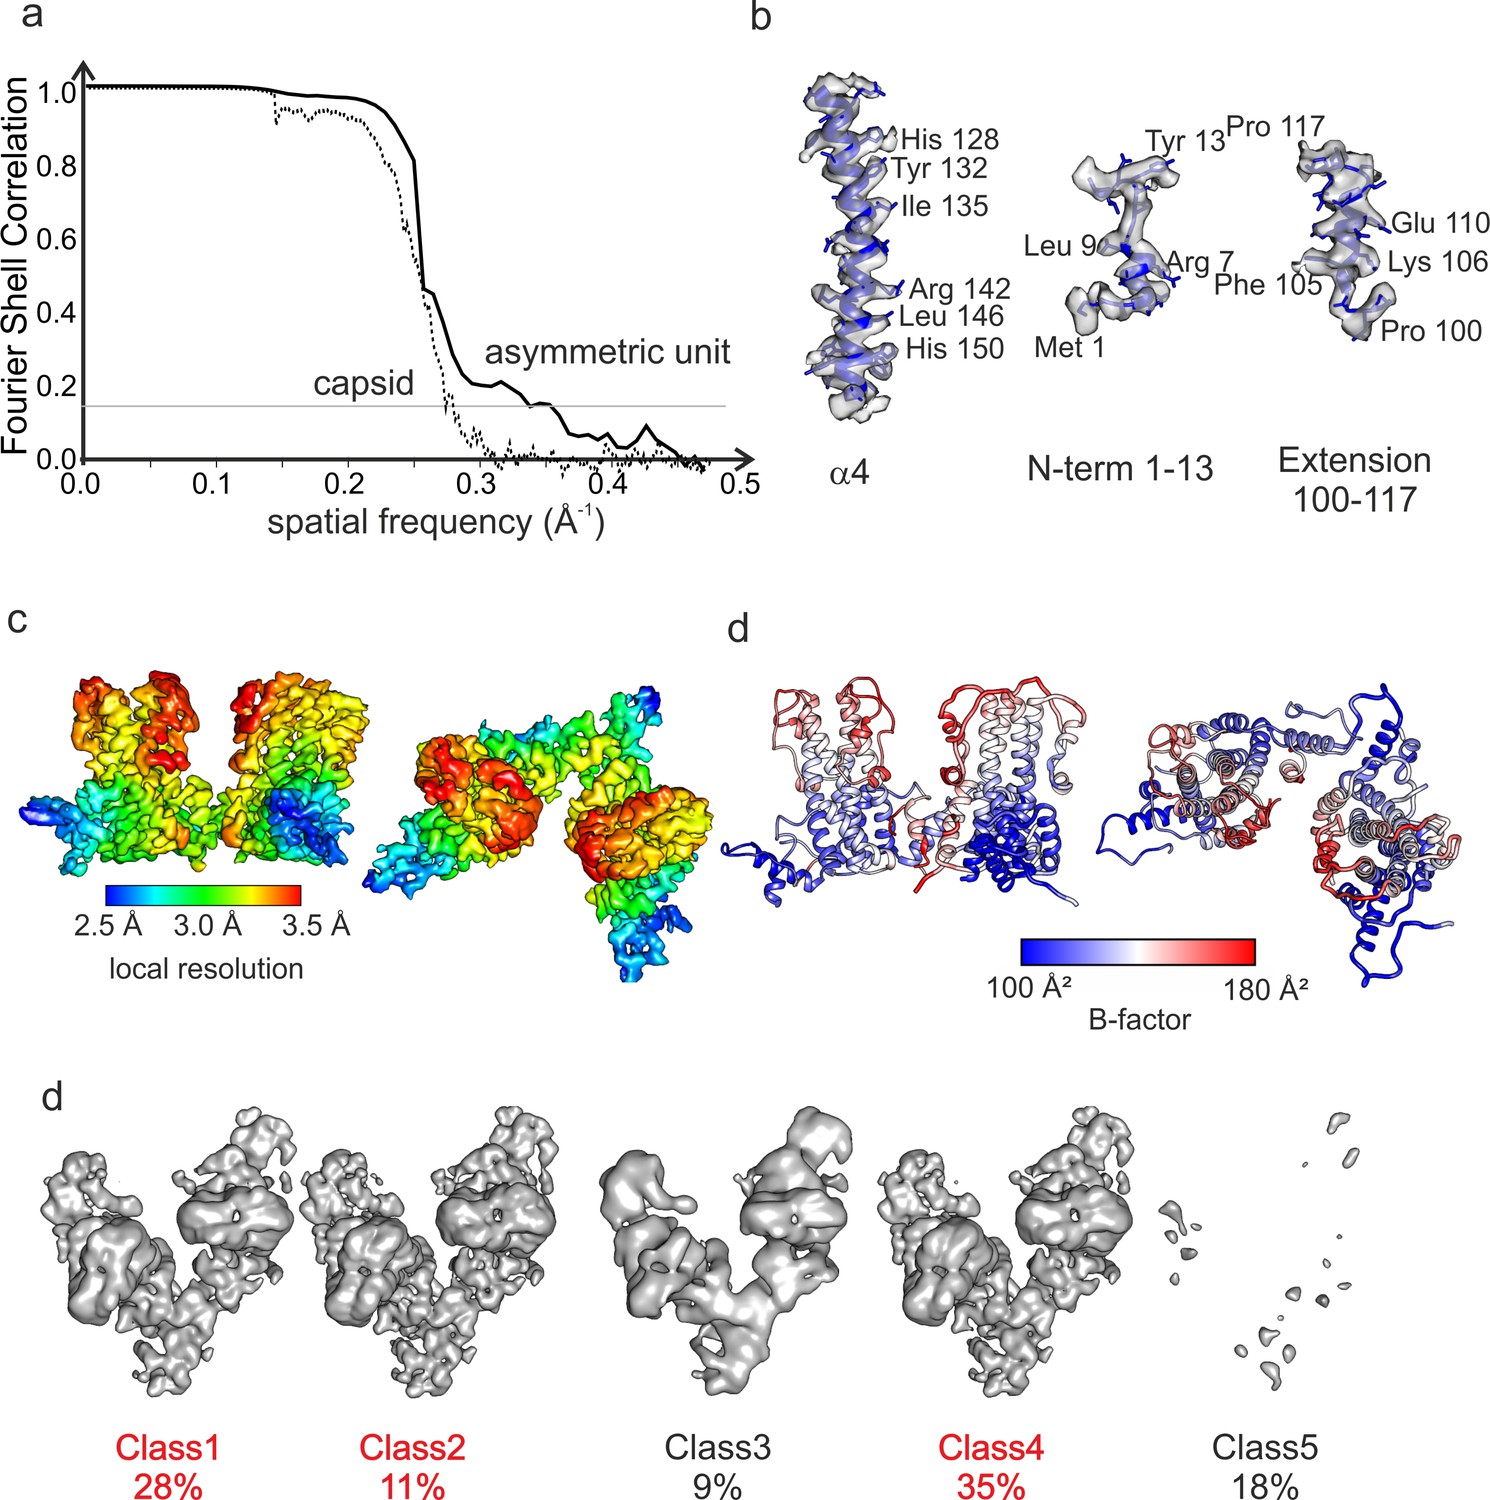
(a) Fourier shell correlation after gold standard refinement and masking for the asymmetric unit of DHBc prepared after 10 months (solid black line) and for the CLPs (dotted line). The FSC threshold of 0.143 for quoting the resolution is shown as thin black line. (b) Representation of selected side chain density of α4 in, at the N-terminus and in the extension domain highlighting the quality and local variation in resolution of the map. (c) Two perpendicular views of the 3D-map of the asymmetric unit after local orientational refinement of the particles of classes 1, 2 and 4 in (e). The color-coding represents the local resolution and is lowest in the extension domain. (d) Two perpendicular views of the model of the asymmetric unit of DHBc colored with the local B-factors calculated during Phenix ADP-refinement. The extension domains have the highest local B-factors, which matches the low local resolution in this region. The color key is given below. The absolute numbers for the B-factors are somewhat arbitrary and depend on the B-factor used for map-sharpening during post-processing in RELION. (e) Surface representations of 3D-class averages from the classification of the asymmetric units without alignment. Class 1, 2 and 4 show broad spikes. Class five represents holes in the CLPs. The views are perpendicular to those shown in Figure 1.
Figure 1—figure supplement 5
DHBc CLPs with co-expressed FkpA.
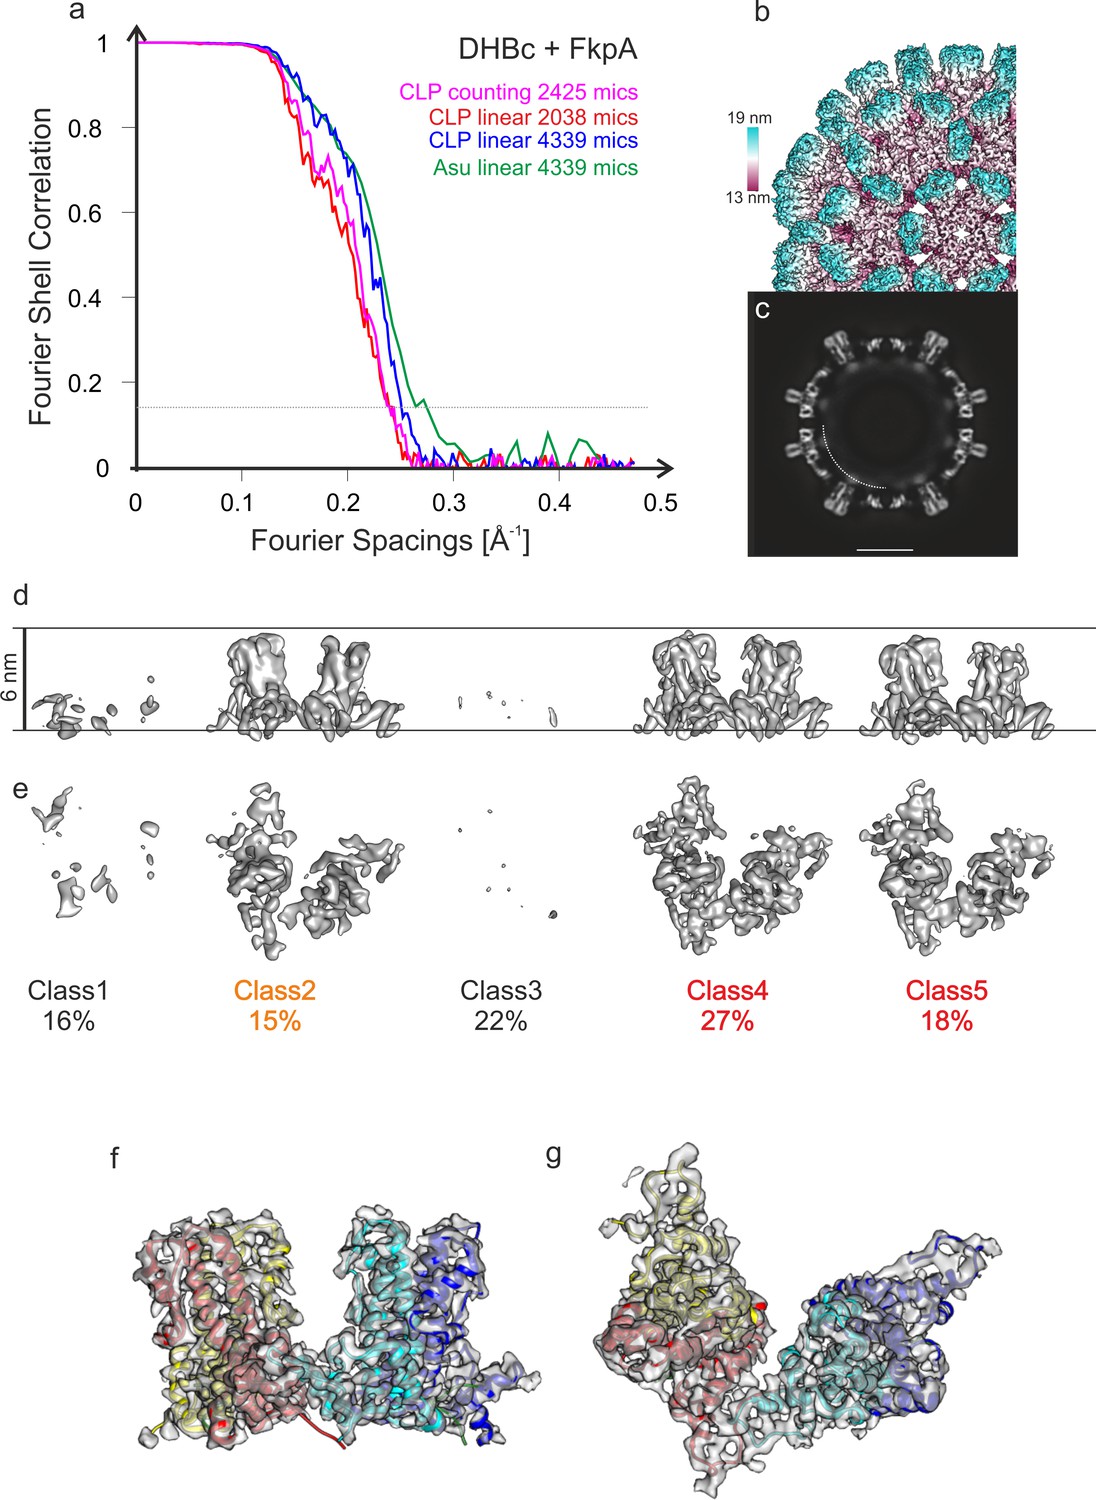
(a) Fourier Shell Correlation of maps of DHBc co-expressed with FkpA. The plots represent different maps of CLPs reconstructed from micrographs acquired from the same grid either in counting mode (magenta) or in linear mode (red and blue). Reconstructions in linear mode were calculated from the full data set (4039 movies, blue) or from the 1st part of the data acquisition (2038 movies, red). Reconstructions in counting mode were calculated from 2425 movies and had the same overall resolution (4.2 Å, magenta) as data acquired in linear mode from the first part of the acquisition with a similar number of micrographs (for more details on imaging see Table 1). This comparison suggests that the resolution of the final maps was not limited by the image acquisition mode, similar as reported earlier for HBc (Song et al., 2019). Doubling the data by approximately a factor of two in linear mode increased the resolution only slightly from 4.2 Å to 4 Å. The best resolved 3D-map of the CLPs of DHBC+FkpA from all movies acquired in linear mode is shown as surface representation of the B-factor sharpened map in (b) and as equatorial slice of the none-sharpened map in (c). The surface representation in (b) is color-coded by the radius as indicated by the color key. The length of the color key corresponds to a length of 6 nm. In the equatorial slice in (c) the arch indicates the approximate position of diffuse density that is mainly attributed to RNA. The similar resolution and quality of the 3D-maps from counted and linear data indicated that the limited resolution of wt DHBc prepared after two weeks is most likely a property of the sample and not related to the imaging conditions (linear, 40 e-Ų). (d-g) Analysis of the asymmetric unit of DHBc+FkpA for the counted data (classification shown in d and e) and for the linear data (best class shown in f and g). Both classification gave similar results. Surface representations calculated at the same threshold of the 3D-class averages of the counted data are shown in (d) and (e). The views in (d) and (e) are perpendicular to each other. Class1 and class 3 (38% of all asymmetric units, both 7.2 Å resolution) represented mainly holes or grossly displaced subunits. Class two was poorly resolved (15% of all asymmetric units, 6.2 Å resolution). Classes 4 and 5 (45% of all asymmetric units, 4.9 Å and 5.7 Å resolution respectively) were better resolved but had a relative radial displacement of 3 Å, which is larger than for the 10 months old DHBc CLPs (2 Å displacement) but significantly smaller than the 7 Å displacement of the 2 weeks old CLPs without co-expressed FkpA (Figure 1—figure supplement 3). Classes 4 and 5 both showed broad spikes indicating folding of the extension domain. We did not observe any classes showing consistently narrow spikes as we had observed for the 2 weeks old CLPs without co-expression of FkpA. For the best class of data acquired in linear mode, we locally refined the orientations of the asymmetric unit. The resulting 3D-map with the fitted model of the 10 months old DHBc is shown in (f and g) in two perpendicular views of the same map/model. This 3D-map has a resolution of 3.9 Å (see (a), green plot). In conclusion, data acquired in linear mode at a lower dose has a sufficient signal-to-noise-ratio to analyze the individual asymmetric units of the CLPs.
Figure 2 with 2 supplements
Structural model of DHBc.
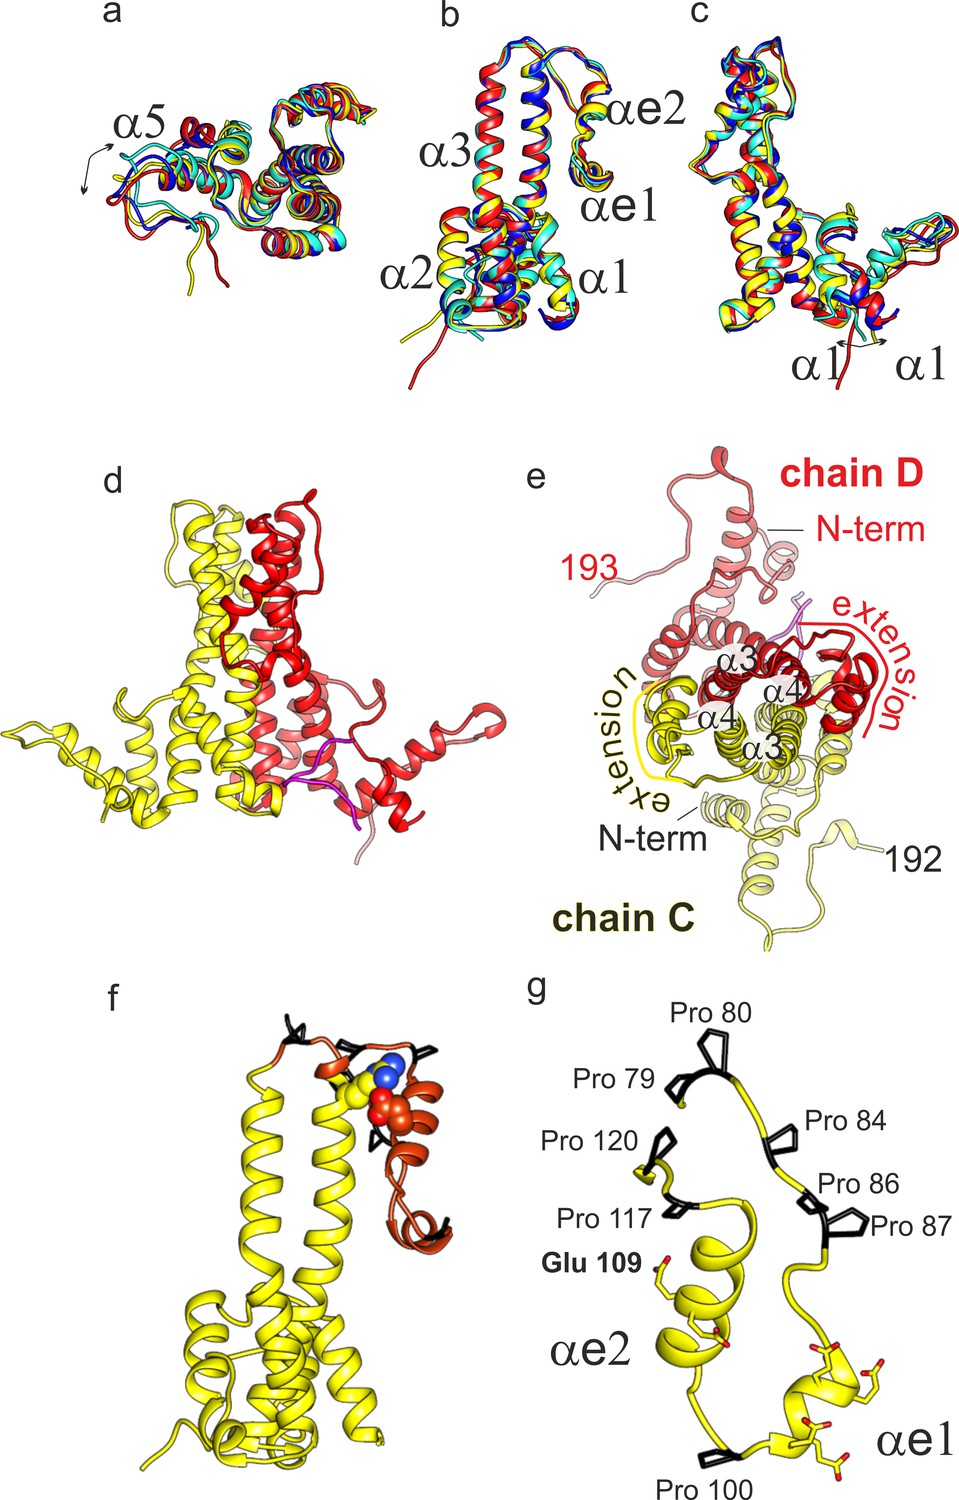
(a-c) Superposition of the four subunits in the asymmetric unit (chain A: blue, chain B: cyan, chain C: yellow, chain D red). The helices in the extension domain are labelled αe1 and αe2. All four subunits show the same overall fold with deviations in the hand-region (a); arrow) and at the N-terminus (c); arrow). (d) View of the CD-dimer perpendicular to the dimer axis, with the CD dimer. The C-terminus (250-262) is shown in magenta. The intra-dimer contact is stabilized by hydrophobic interactions between F60 and H52 in opposing CPs (Figure 2—figure supplement 2) (e) View of the CD-dimer along the dimer axis with the last resolved C-terminal residues of the dimer, the position of the N-termini and the position of the extension domain indicated. (f) Chain C with the extension domain in brown and the prolines in the extension domain in black. R124 and E109, forming the stabilizing salt bridge in the extension domain, are shown in ball representation (Figure 2—figure supplement 1 for a close-up of the salt-bridge together with the EM-map). (g) Extension domain of chain C (78-121). The eight prolines are highlighted in black and the side chains of the six glutamates are indicated.
Figure 2—figure supplement 1

Stabilizing Elements of Extension domain.
(a) R124 in α4 of the core spike and E109 in αe2 in the extension domain form a salt bridge, which is visible as continuous density in the EM-map of DHBc (wire representation). The close-up shows chain C. (b) H107 in αe2 forms a hydrophobic interaction with I99 in αe1 and thus stabilizes the fold of the lower part of the extension domain.
Figure 2—figure supplement 2
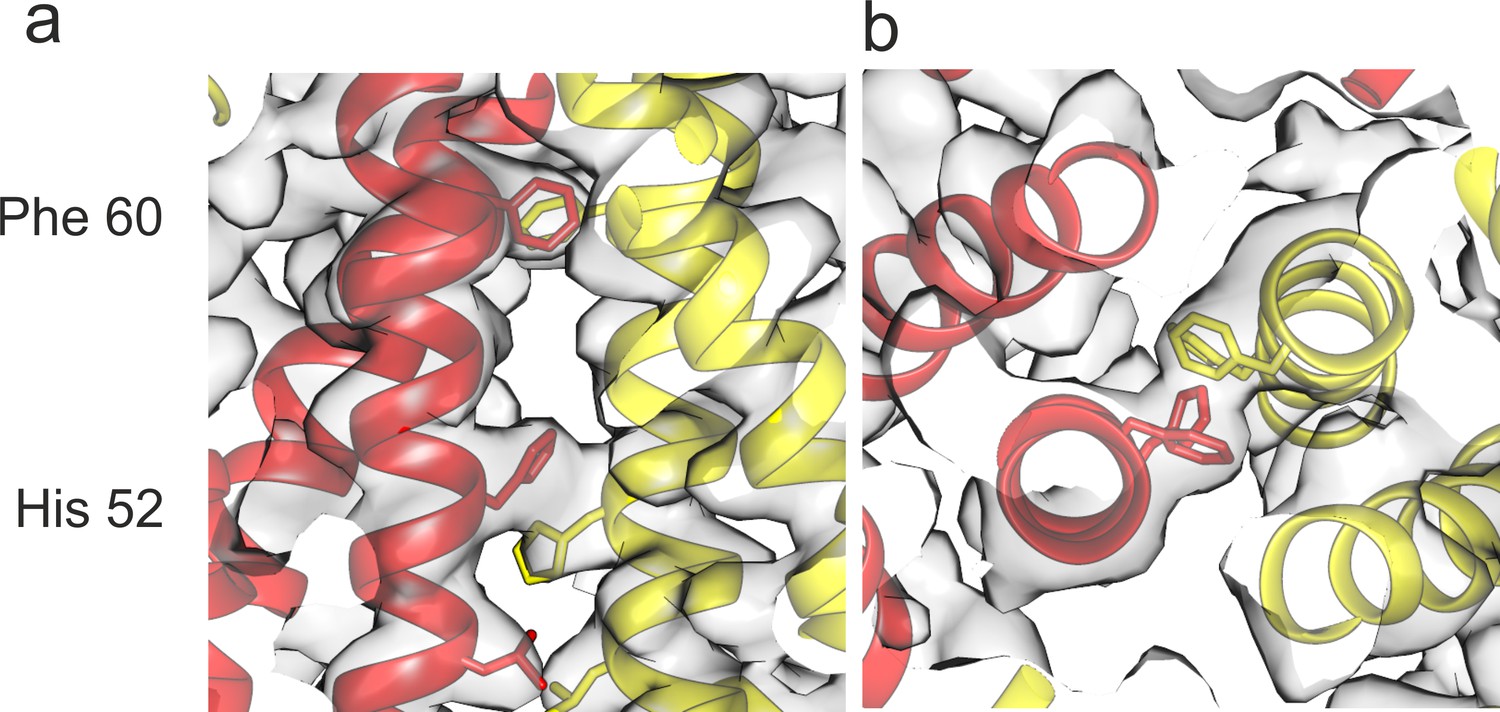
Intra-dimer contact (a) Close-up of the center of the CD-spike perpendicular to the dimer axis and (b) along the dimer axis.
The inner dimer contact is stabilized by stacking of Phe60 and His52 in α3 with the same residue of the opposite subunit. Chain C is shown in sallow and chain D in red.
Figure 3 with 2 supplements
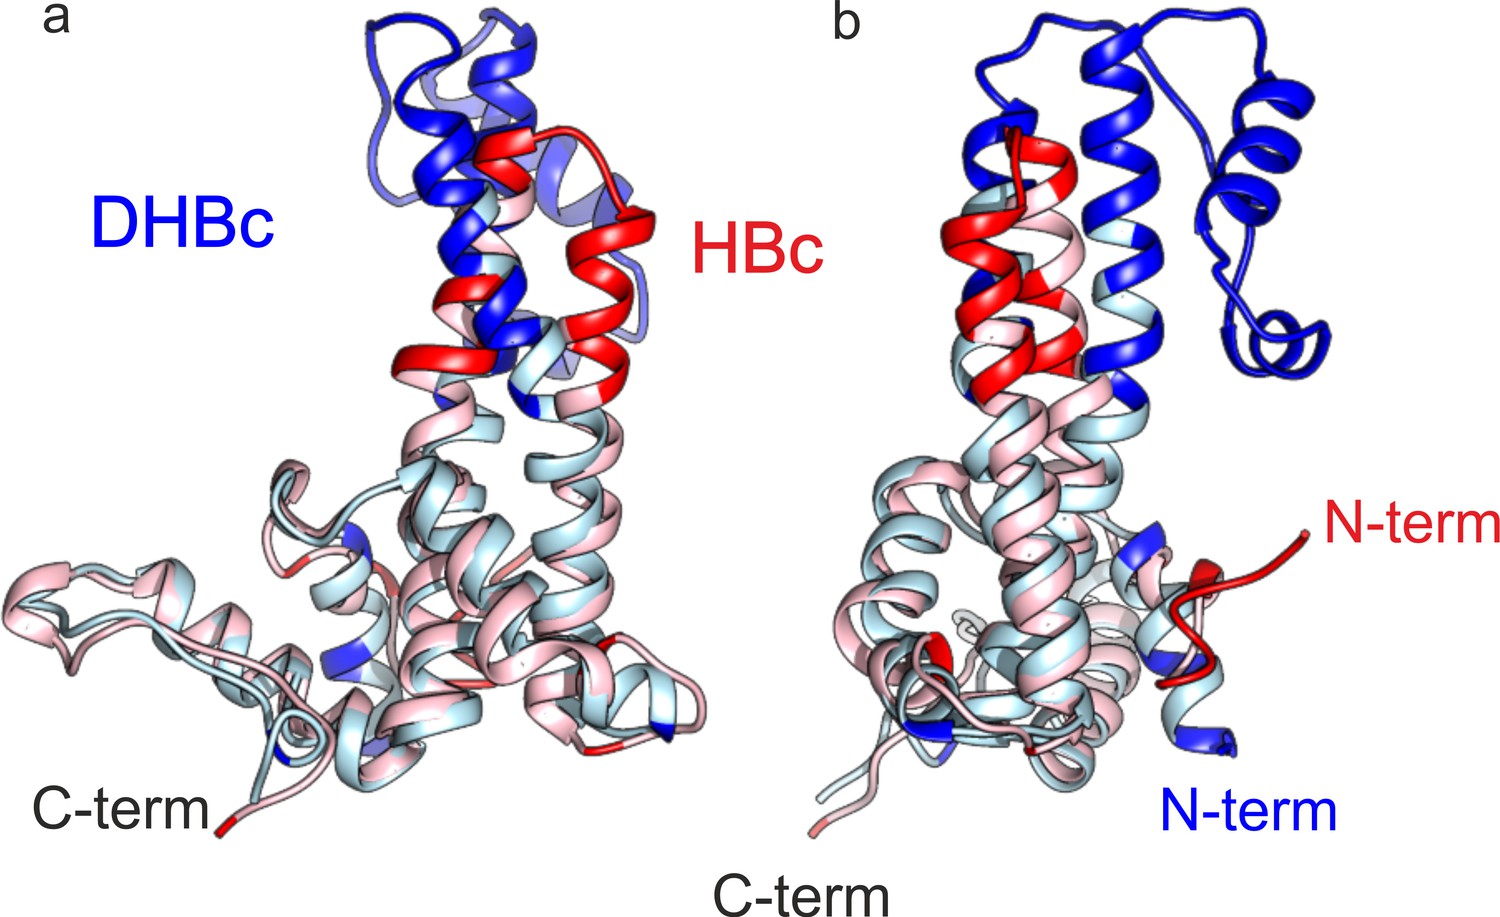
C-terminus of DHBc CPs and the N-terminus of HBc occupy the same site.
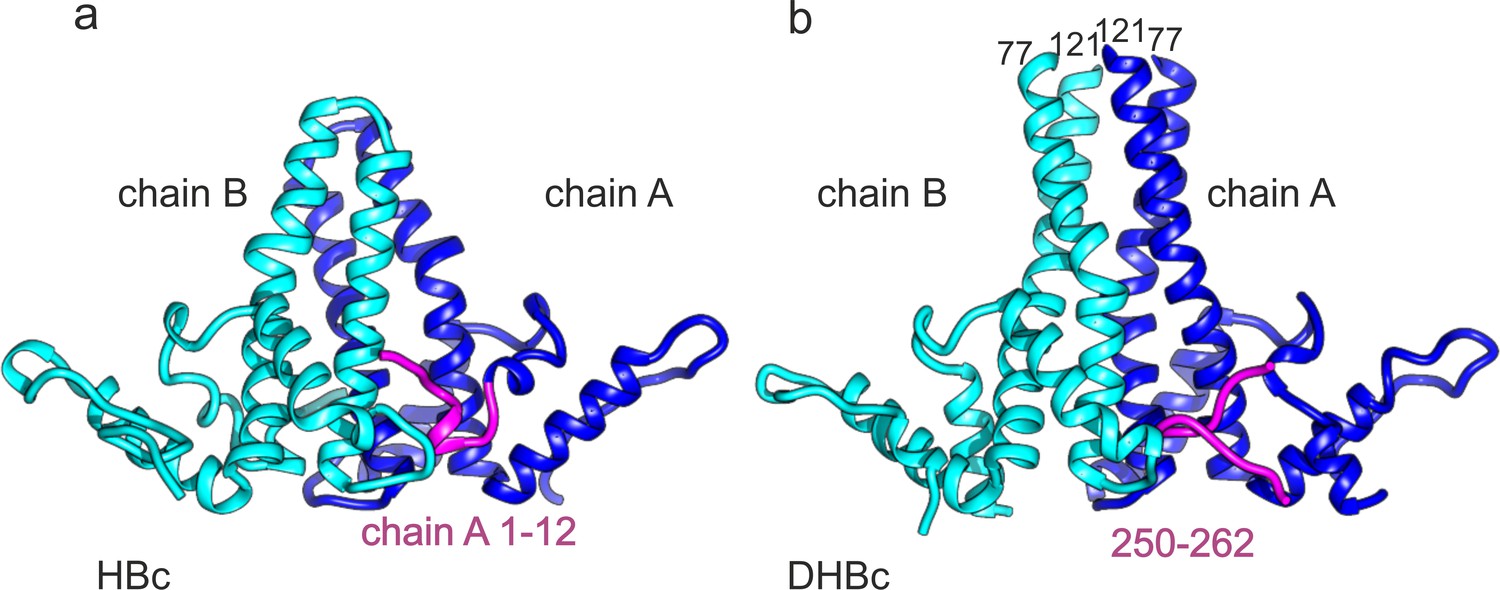
(a) The AB-dimers of HBc (pdb: 6HTX Böttcher and Nassal, 2018) and b of DHBc in the same orientation. For clarity the extension domain (78-120) is not shown. Large-type and small-type CPs show a structurally conserved hand region and lower spike arrangement with an RMSD of 1.9 Å (Figure 3—figure supplement 1). Major differences are the packing of the four helices in the upper part of the spike and the site at the base of the spikes. This is occupied either by the 12 N-terminal residues of chain A of HBc or by the 12 C-terminal residues of DHBc (magenta). The protruding tip of the extension domain in one CP of DHBc provides a similar structural environment as the tips of the spikes in a CP dimer of HBc (Figure 3—figure supplement 2).
Figure 3—figure supplement 1
The fold of the lower part of HBc and DHBc CPs have an RMSD of 1.9 Å.
Chain C of HBc and DHBc were superposed with the match align tool of Chimera. The 113 matching amino acids (light blue for DHBc and light red for HBc) had an overall RMSD of 1.9 Å. The none-matching parts (red for HBc and blue for DHBc, RMSD >5 Å) cluster to the upper half of the spike and at the N-terminus. (a and b) show two different views which are related by 90° rotation around the vertical axis.
Figure 3—figure supplement 2
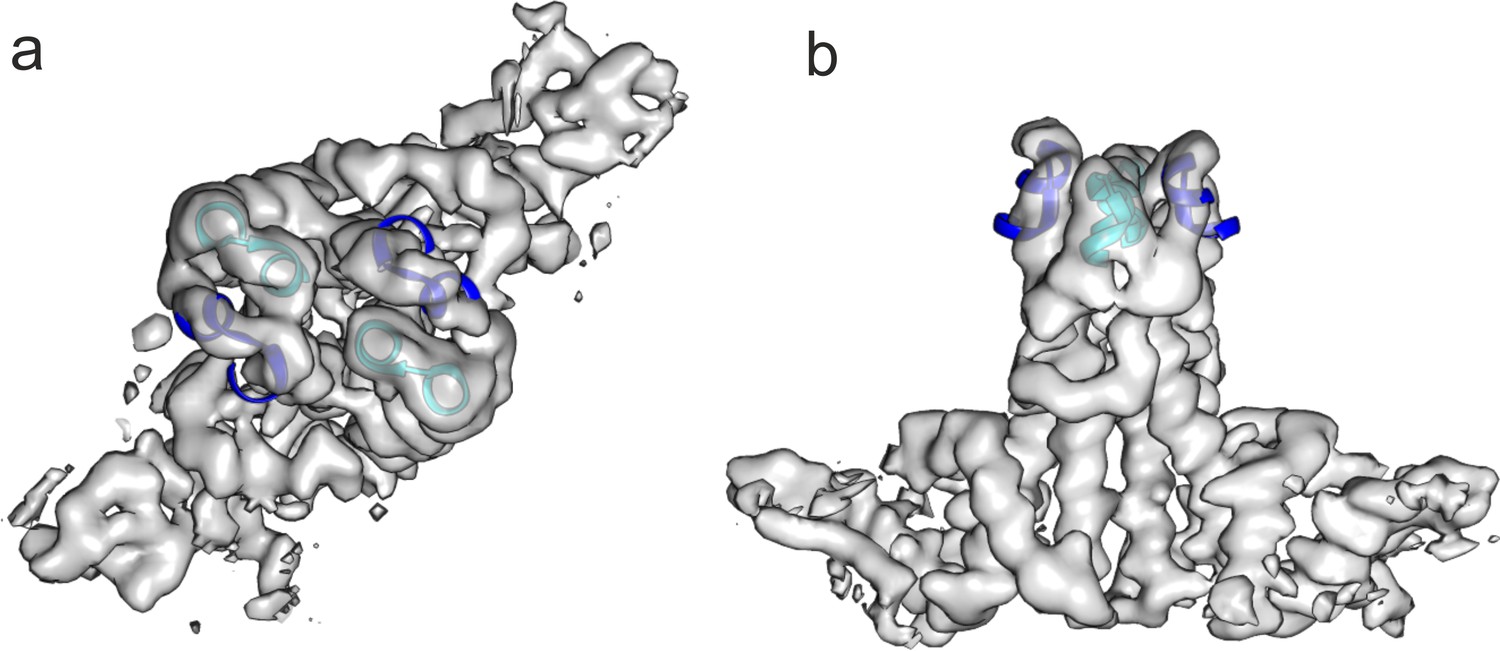
The extension domain of DHBc provides a similar structural environment as the tips of the spikes in HBc.
The tips of the AB-dimer of HBc (6HTX, residues 73–83 of chains A and B, blue and cyan) were fitted as rigid body to the two extension domains in a DHBc-dimer. The map is the same as shown for the asymmetric unit in Figure 1—figure supplement 4 but without B-factor sharpening. (a) Shows a view parallel to the dimer axis and (b) perpendicular to the dimer axis.
Figure 4 with 1 supplement
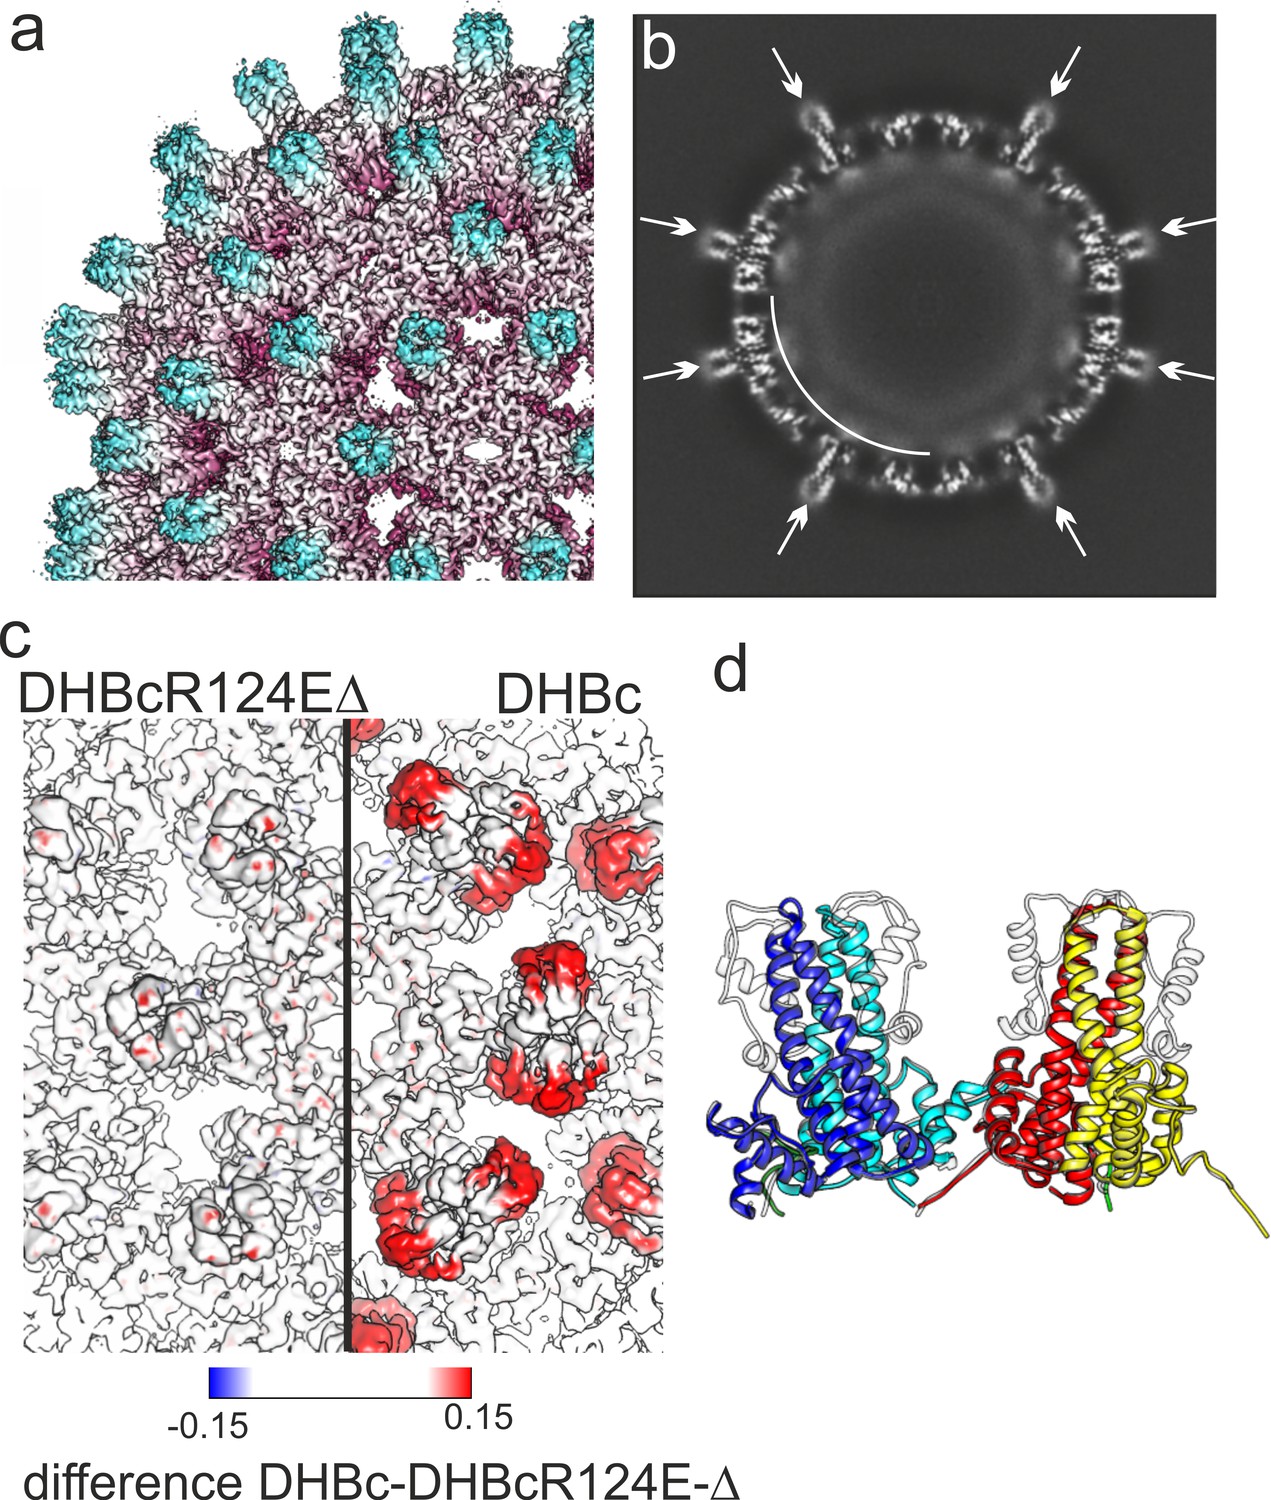
3D-map of extension-less variant DHBc_Δ78–122 R124E (DHBcR124EΔ) in comparison to DHBc.
(a) Segment of the DHBcR124EΔ capsid colored by the radial position. The Fourier-Shell correlation and local resolution analysis is shown in Figure 4—figure supplement 1. (b) Equatorial slice through the EM-density of DHBcR124EΔ. All spikes show narrow cross sections (arrows). A shell of diffuse density underneath the protein shell is highlighted by a white arch. (c) Close-up along the two-fold symmetry axis of a surface representation of DHBcR124EΔ (left) and DHBc (right) color-coded with the differences between the two maps. The color key is given below. Positive densities (additional density in DHBc) are shown in red and negative densities in blue (additional density in DHBcR124EΔ. (d) Model of DHBc (grey) and DHBcR124EΔ in color: chain A blue, chain B cyan, chain C yellow, chain D red are superposed). The common cores of DHBc and DHBcR124EΔ are virtually indistinguishable with an overall RMSD of 0.6 Å. The G2SG2 linker that replaces the extension domain in DHBcR124EΔ is unresolved.
Figure 4—figure supplement 1
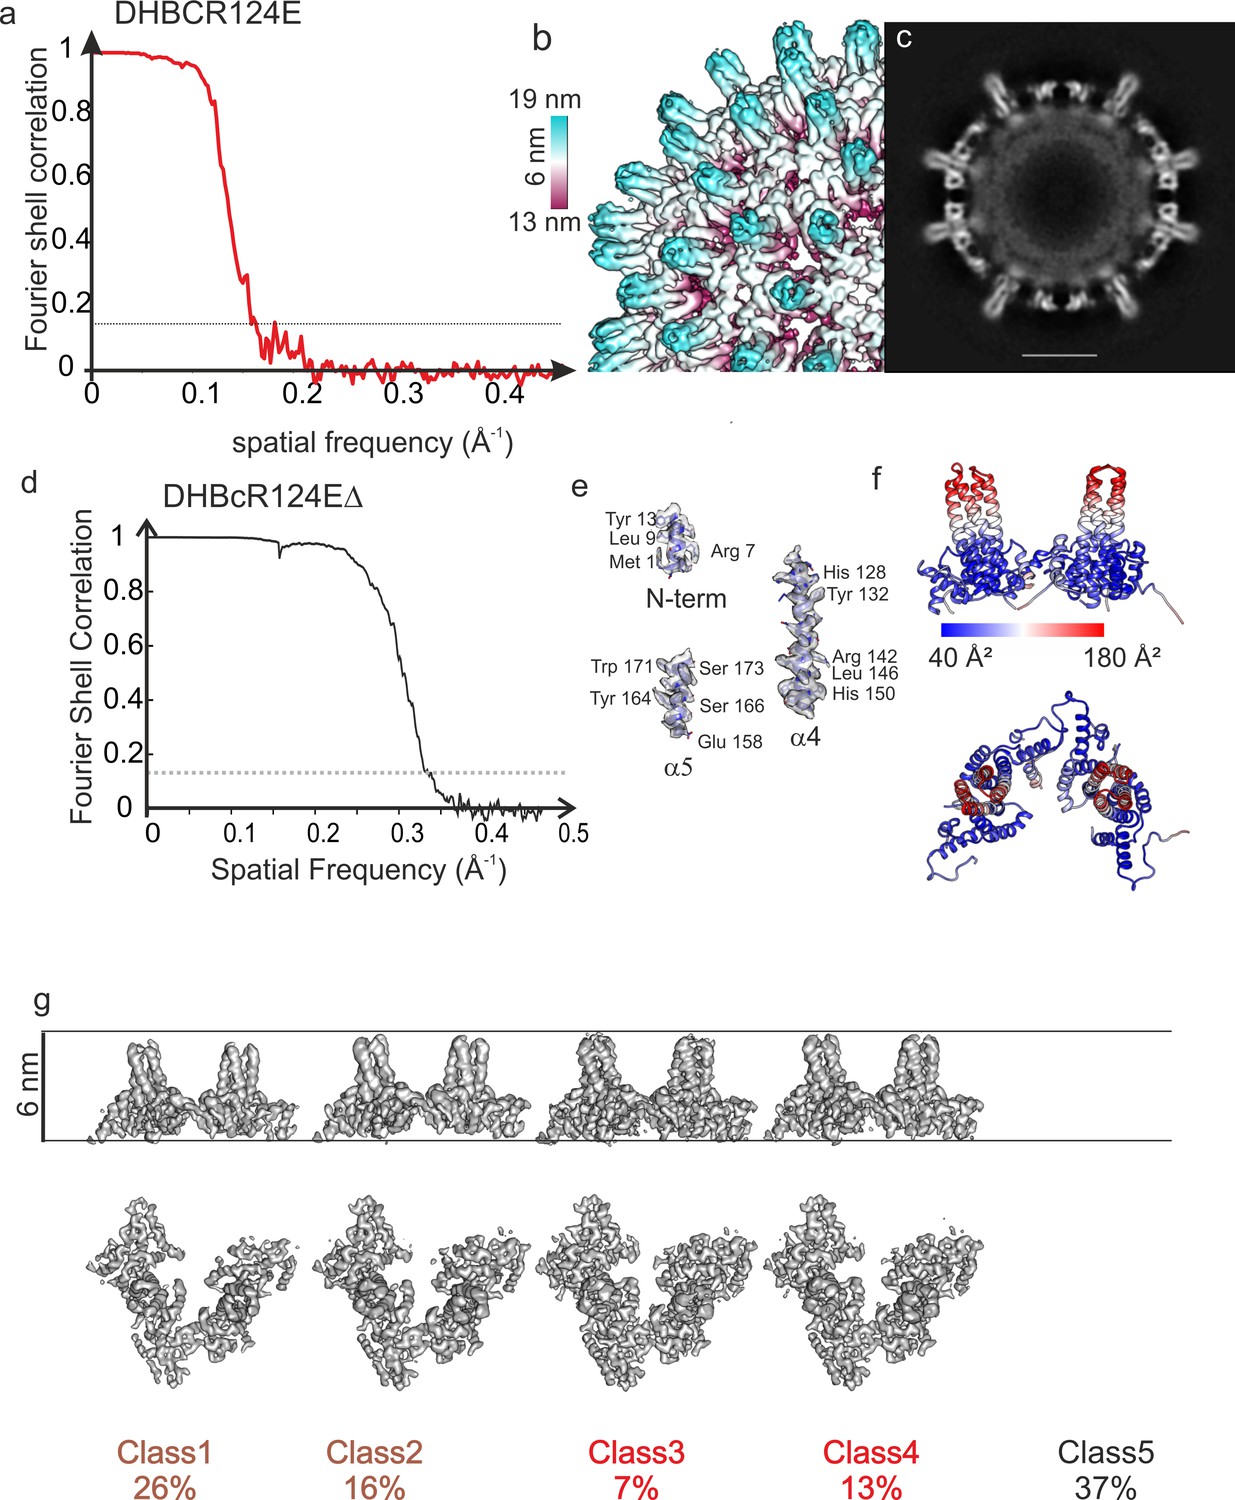
Structural characterization of DHBcR124E and DHBcR124EΔ.
(a) Fourier Shell correlation after gold standard refinement of DHBCR124E. The dashed, grey line indicates a Fourier-Shell Correlation of 0.143, which was used as threshold for determining the resolution of 6 Å. (b) Close-up of the surface representation of the image reconstruction of DHBcR124E showing narrow spikes. The surface is colored according to the radius as indicated by the color key. The length of the color key indicates 6 nm. (c) Equatorial slice of the image reconstruction in (b). There is no density visible for the extension domain indicating high flexibility. The scale bar indicates 10 nm. (d) Analysis of DHBcR124EΔ CLPs: Fourier Shell Correlation of CLPs of DHBcR124EΔ after gold standard refinement. The dashed line indicates a FSC of 0.143. The FSC-curve falls below the 0.143 threshold at a spatial frequency of 1/3 Å. (e) Selected areas of the map and model to highlight the quality of the side chain density. (f) Model of DHBcR124EΔ colored with the local B-factors from ADP-refine of Phenix. The color key is given below. The tips of the spikes have much higher B-factors than the rest of the subunit, suggesting high flexibility of the upper part of the helical bundle preceding the G2SG2 linker. (g) Surface representations of 3D-class averages from classification of the asymmetric units. All class averages are represented with the same density threshold. Class number and relative class occupancy are given below. At the chosen threshold Class5 shows no density and is indicative of holes at the respective regular positions in the capsids. Class1 (3.4 Å resolution) and class2 (3.3 Å resolution) are somewhat less dense than class3 (3.2 Å resolution) and class4 (2.9 Å resolution). The radial displacement between the four classes is less than 1 Å.
Figure 5 with 2 supplements
Opposite charges at DHBc positions 109 and 124 warrant stable capsid formation in hepatoma cells.
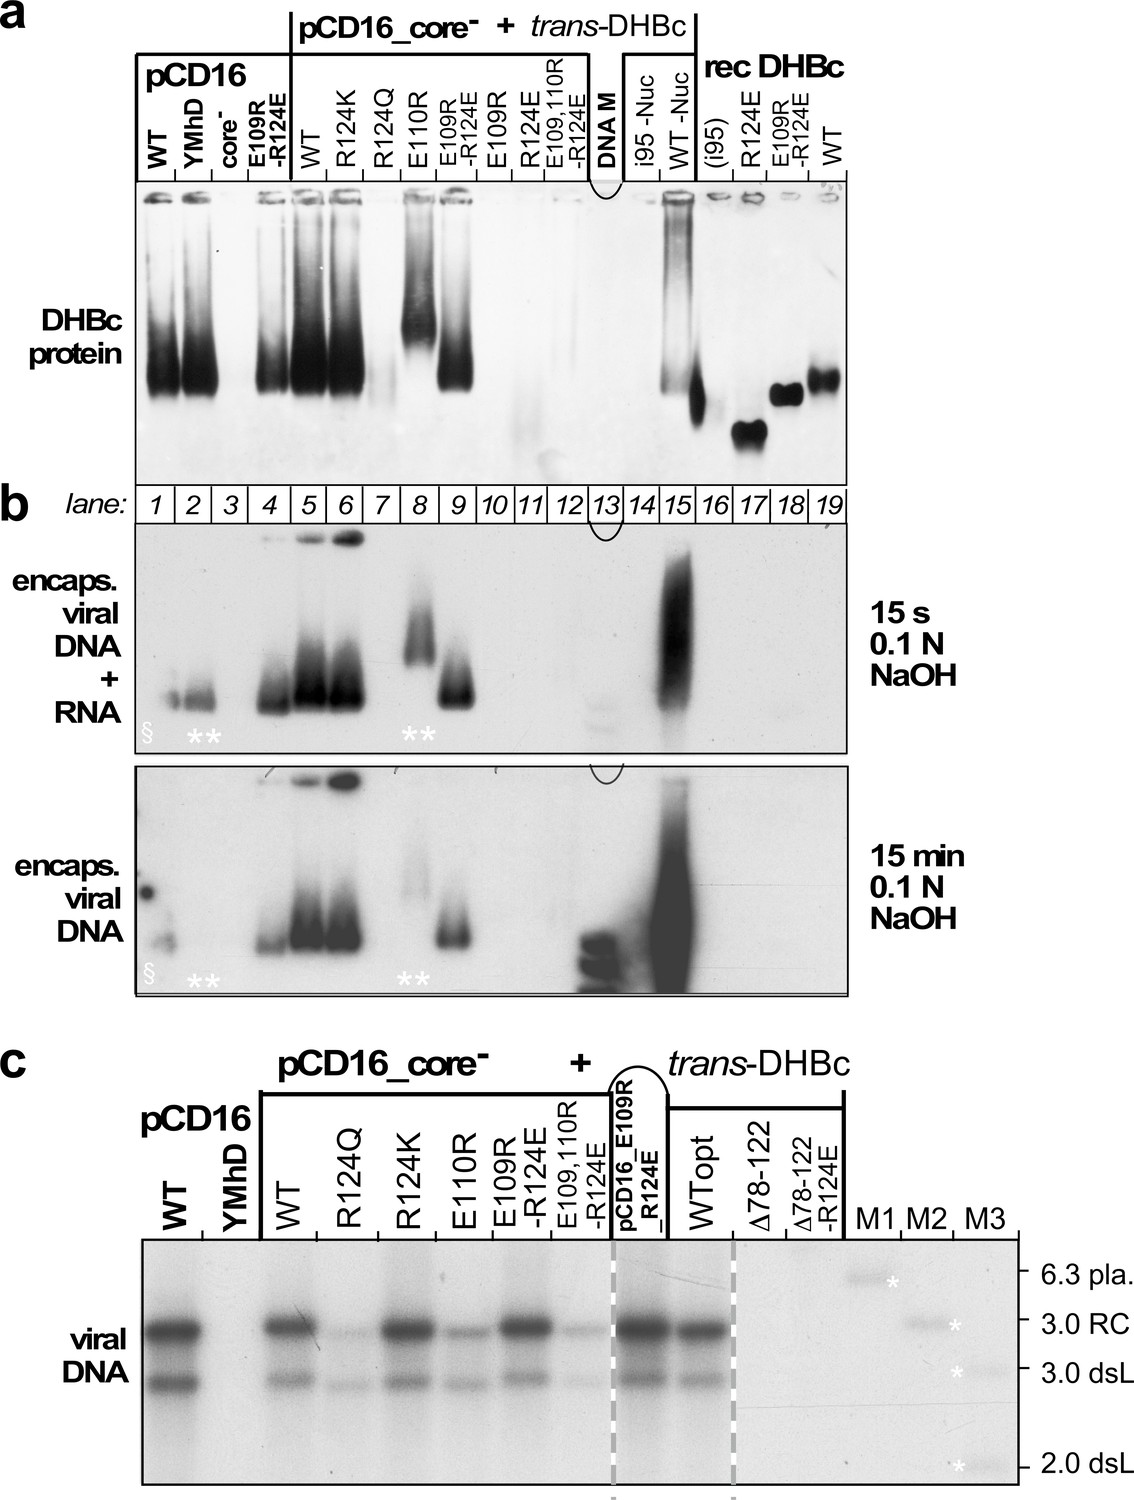
(a) Capsid formation. Cytoplasmic lysates from LMH cells transfected with the indicated constructs (pCD16: mutations present in cis; pCD16_core- + trans-DHBc: core-deficient DHBV genome co-transfected with DHBc vectors) were analyzed for capsid formation by NAGE and anti-DHBc immunoblot; recDHBc, E. coli derived CLPs. All samples except i95 -Nuc and WT -Nuc (lanes 14, 15) were treated with micrococcal nuclease to destroy non-packaged nucleic acids prior to NAGE. (b) Viral nucleic acid encapsidation. Cytoplasmic lysates separated as in (a) were examined by hybridization with a 32P-labeled DHBV probe after opening the blotted capsids via alkali treatment for 15 s (leaving RNA and DNA intact) and, thereafter, for 15 min (hydrolyzing RNA but not DNA). Signals from pCD16_YMhD (encoding a reverse transcription-deficient polymerase) and trans-DHBc E110R (lanes 2, 10; marked by **) showed strong and moderate, respectively, reductions upon longer treatment. § in lane one indicates poor transfer of the left part of the main band. (c) Absence of grossly aberrant reverse transcription products. DNAs from cytoplasmic capsids were analyzed by Southern blotting using the same probe as in (b). Labels WT vs. WTopt refer to the DHBc nucleotide sequence from DHBV16 vs. that from the E. coli optimized vectors. The presence of signals for DHBc_R124Q and E109,110R_R124E likely relates to the larger input of capsids for Southern blotting than for NAGE. M1-M3, marker DNAs; pla., pCD16 plasmid. The complete blot is shown in Figure 5—figure supplement 1.
Figure 5—figure supplement 1
Extension-less DHBc variants fail to support stable nucleocapsid formation in hepatoma cells.
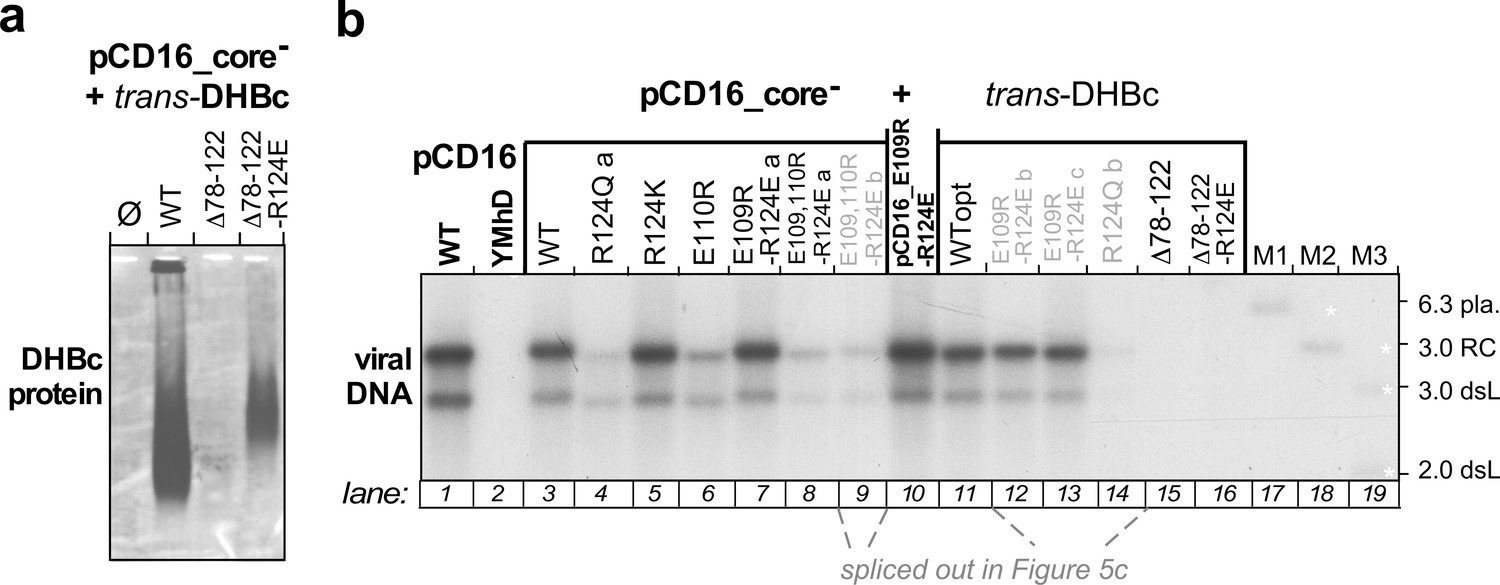
(a) NAGE capsid immunoblot. LMH hepatoma cells were co-transfected with the core-deficient DHBV vector pCD16_core- plus expression vectors for wt-DHBc or the extension-less variants DHBc_ Δ78–122_R124E (well expressed in E. coli but insoluble) or DHBc_ Δ78–122_R124E (well expressed in E. coli as soluble CLPs; Figure 4 and S2, S6). Formation of cytoplasmic capsids was analyzed by NAGE immunoblot as in Figure 5a, using the polyclonal rabbit anti-DHBc antiserum 12/99 which recognizes various avihepadnavirus core proteins (Vorreiter et al., 2007), followed by a peroxidase-conjugated secondary antibody and a chemiluminescent substrate. Despite long exposure only a very faint smear was detectable for variant Δ78–122_R124E. The signal from variant Δ78–122_R124E was stronger but still much weaker than that from wt-DHBV transfected cells. (b) Southern blot. The figure shows the complete version of the Southern blot from Figure 5, where lanes 9 and 12–14 loaded with redundant samples from repeat experiments (grey lettering, with labels b,c) had been spliced out. As variant Δ78–122_R124E did not form detectable capsids the lack of viral DNA is unsurprising. For variant Δ78–122_R124E the data suggest that if the weak immunoblot band in (a) represents true capsids they are defective in pgRNA packaging and/or reverse transcription.
Figure 5—figure supplement 2

Lack of stable capsid formation by variant DHBc_R124E in hepatoma cells correlates with increased proteolytic sensitivity.
LMH cells were cotransfected, in 10 cm dish format, with pCD16_core- and the indicated trans-DHBc constructs; for sample E109R_R124E lo only one fifth the amount of plasmid DNA was used. For sample GFP cells were solely transfected with the GFP vector pTRUF5. On day four post transfection cells were lysed using 750 µl lysis buffer containing NP40 detergent and protease inhibitor cocktail (Complete, EDTA-free; Roche). (a) NAGE capsid immunoblot. 20 µl of each lysate were analyzed by NAGE and immunoblotting as in Figure 5a. (b) NAGE capsid-DNA blot. 20 µl of each lysate were analyzed for capsid-borne DHBV DNA as in Figure 5b. (c) Steady-state levels and integrity of DHBc proteins irrespective of their assembly status. To enrich DHBc proteins, 400 µl of each lysate were subjected to immunoprecipitation using polyclonal rabbit anti-DHBc antibodies (rabbit serum 12/99, Vorreiter et al., 2007) immobilized on Protein A sepharose beads (GE Healthcare); after extensive washing the beads (about 40 µl gel bed each) were boiled with 80 µl SDS-containing sample buffer and 20 µl thereof were separated by SDS-PAGE (15% polyacrylamide), transferred to PVDF membrane and detected using the same polyclonal antiserum followed by an Fc-specific anti-rabbit IgG peroxidase conjugate and a chemiluminescent substrate. Approximately 30–50 ng of the indicated recombinant DHBc proteins served as markers. The 55 kDa band in the cell culture samples represents the heavy chains of the IP antibodies. The weak bands below the 25 kDa marker position (arrowheads) were present in all IP samples, including the GFP-only transfected lysates; hence they are not DHBc-specific. Note the multiple faster migrating DHBc-specific bands exclusively in the R124E sample (lane 2**), indicative of a much increased proteolytic sensitivity caused by the mutation.
Figure 6
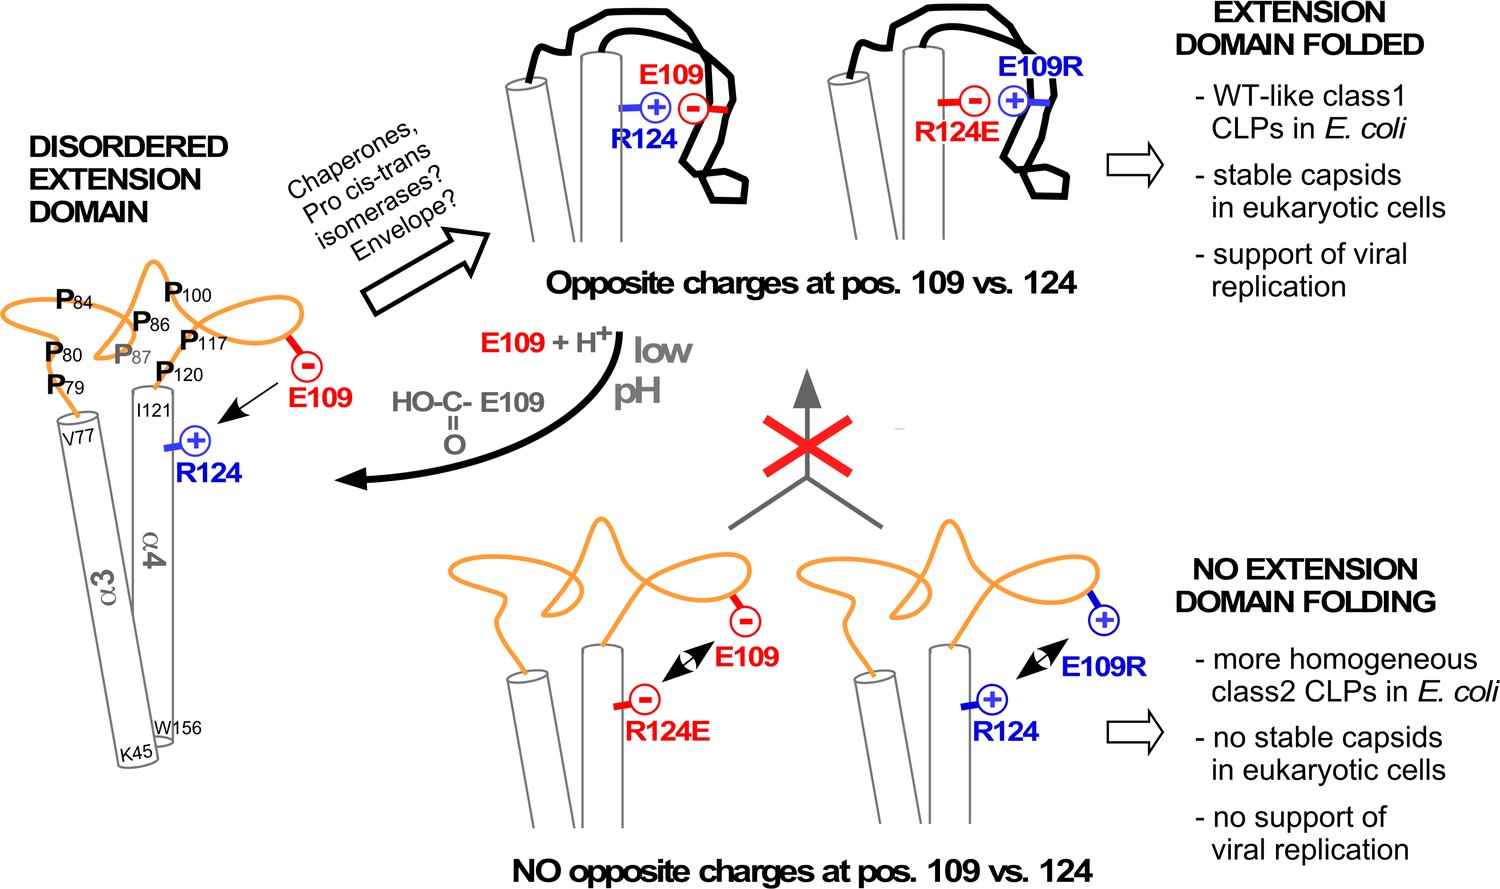
Model correlating disorder vs. order of the DHBc extension domain with phenotypes in bacteria and hepatoma cells.
Opposite charges in WT-DHBc and the double mutant E109R_R124E facilitate folding of the extension domain, in cells probably accelerated by chaperones, proline cis-trans-isomerases, and/or perhaps the envelope proteins. The shape of the folded extension domain is a schematic approximation to the structural data. Protonation of the E109 carboxylate at low pH ablates the salt-bridge, possibly creating a trigger for a conformational switch. In the absence of opposite charges at positions 109 and 124 (R124E, E109R) repulsion or lack of attraction (R124Q, not shown) hamper folding of the extension domain. This may expose eukaryotic instability determinants and cause the apparent capsid instability in hepatoma cells.
Author response image 1
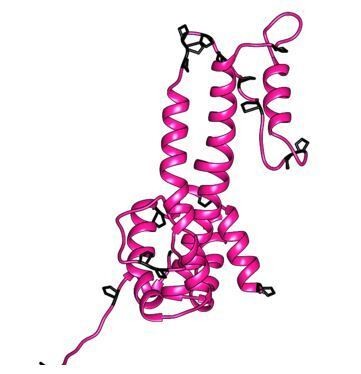
Model of the large-type CP of Tibetan frog.
The model was generated with Modeller (Webb and Sali Current Protocols in Bioinformatics 54, John Wiley and Sons, Inc, 5.6.1-5.6.37, 2016.), using our DHBc structure as template. Prolines are highlighted in black.
Tables
Table 1
Summary of image reconstruction and model building.
| Sample prepared @ | DHBc 2 weeks | DHBc 10 months | DHBcR124EΔ 2 weeks | DHBc+FkpA 2 weeks | DHBcR124E 3 months | |
|---|---|---|---|---|---|---|
| Magnification | 75,000 | |||||
| Acquisition mode | integrating mode | counting mode | Counting mode | Counting mode | Integrating mode | Integrating mode |
| Total exposure | 39 e-/Å2 | 77 e-/Å2 | 60 e-/Å2 | 60 e-/Å2 | 40 e-/Å2 | 40 e-/Å2 |
| Exposure time | 3.5 s | 75 s | 54 s | 56.6 s | 2.4 s | 2.3 s |
| Pixel size | 1.0635 Å | |||||
| Beam diameter | 1 µm | |||||
| C2 aperture | 70 µm | |||||
| Objective aperture | 100 µm | |||||
| Spot size | 5 | 9 | 9 | 9 | 5 | 5 |
| Number of movies per hole | 2 | 3 | 2 | 3 | 3 | 2 |
| Number of fractions | 20 | 47 | 40 | 40 | 40 | 20 |
| Number of movies | 3541 | 2473 | 1496 | 2425 | 4339 | 1226 |
| Defocus range | 700–2200 nm | 500–2100 nm | 500–1300 nm | 500–1600 nm | 600–1900 nm | 500–2000 nm |
| Acquisition software | EPU | |||||
| Frame alignment and dose weighting | MotionCor2 | |||||
| CTF estimation | CtfFind4.1 | |||||
| Processing software | RELION3 | |||||
| Number of selected capsids | 91,445 | 89,241 | 74,760 | 129,522 | 161,596 | 35,820 |
| Capsids in final map | 41,117 | 20,251 | 44,498 | 24,854 | 44,374 | 23,384 |
| Resolution capsid | 6.1 Å | 3.7 Å | 3.0 Å | 4.2 Å | 4.0 Å | 6.0 Å |
| EMDB | 10800 | 10803 | 10801 | 10802 | ||
| extracted asymmetric units | 2,428,920 | 1,215,060 | 2,669,880 | 1,210,560 | 2,662,440 | n/a |
| Extracted units in final map | 561,731 | 919,612 | 516,257 | n/a | 383,200 | n/a |
| Resolution asymmetric unit | 5.4 Å | 3.0 Å | 3.0 Å | n/a | 3.9 Å | n/a |
| Model building, refinement and validation | - | Coot, Phenix, Chimera | Coot, Phenix, Chimera | - | - | - |
Table 2
Validation of models.
| DHBc | DHBcR124E∆ | |
|---|---|---|
| Non-hydrogen atoms | 6485 | 5122 |
| Modelled residues | 790 | 633 |
| Average B factors (Å2) model | 63 | 121 |
| FSC0.5 Mapmasked vs Model | 3.9 Å | 3.1 Å |
| MolProbity score | 1.44 | 1.24 |
| Clashscore | 7 | 5 |
| Rotamer outliers (%) | 0 | 0 |
| RMSD Bond lengths (Å) | 0.003 | 0.0028 |
| RMSD Bond angles (°) | 0.41 | 0.42 |
| Ramachandran Outliers (%) | 0 | 0 |
| Ramachandran Allowed (%) | 4 | 4 |
| Ramachandran Favored (%) | 96 | 96 |
| PDB | 6ygh | 6ygi |
Key resources table
| Reagent type (species) or resource | Designation | Source or reference | Identifiers | Additional information |
|---|---|---|---|---|
| Strain, strain background (duck) | DHBV16 | GenBank | K01834 | duck hepatitis B virus |
| Strain, strain background (Escherichia coli) | BL21Star (DE3) CodonPlus RIL | Thermofisher and Agilent | C601003 #230240 | BL21Star (DE3) transformed with RIL CodonPlus plasmid |
| Cell line (Gallus gallus) | LMH | ATCC | CRL-2117 | chicken hepatocellular carcinoma |
| Recombinant DNA reagent | pCD16 | Nassal lab Dallmeier et al., 2008 | CMV promoter controlled DHBV16 vector | |
| Recombinant DNA reagent | pAAV-DHBc | This paper | pAAV-MCS Addgene #46954 | authentic DHBV16 C gene cloned in pAAV-MCS2 for eukaryotic expression (see Plasmid Constructs) |
| Recombinant DNA reagent | pAAV-DHBc_Opt | This paper | pAAV-MCS Addgene #46954 | E. coli optimized DHBV C gene cloned in pAAV-MCS2 for (see Plasmid Constructs) eukaryotic expression |
| Recombinant DNA reagent | pRSF-DHBc_Opt | This paper Heger-Stevic et al., 2018a | E. coli optimized DHBV C gene cloned in pRSF under T7 promoter for bacterial expression; (see Plasmid Constructs) | |
| Antibody | anti-DHBc (rabbit poylclonal) | Vorreiter et al., 2007 | serum 12/99 | raised against recombinant full-length DHBc WB (1:10,000) For immuno precipitation (IP): 50 µl Antiserum 12/99 are loaded onto 500 µl Protein A Sepharose beads (Gelbett); 30 µl loaded beads are used per IP |
| Antibody | Goat IgG anti-Rabbit IgG (Fc)-HRPO | Jackson Immuno Research | Dianova Cat. # 111-035-046 | WB (1:10,000) |
| Chemical compound, drug | TransIT-LT1 | Mirus Bio | VWR Cat. # 10767–118 | IF(1:500) |
| Software, algorithm | Relion 3 | Zivanov et al., 2018 | ||
| Software, algorithm | MotionCor2 | Zheng et al., 2017 | ||
| Software, algorithm | Ctffind4 | Rohou and Grigorieff, 2015 | ||
| Software, algorithm | Chimera | Yang et al., 2012 |
Additional files
Download links
A two-part list of links to download the article, or parts of the article, in various formats.
Downloads (link to download the article as PDF)
Open citations (links to open the citations from this article in various online reference manager services)
Cite this article (links to download the citations from this article in formats compatible with various reference manager tools)
Slowly folding surface extension in the prototypic avian hepatitis B virus capsid governs stability
eLife 9:e57277.
https://doi.org/10.7554/eLife.57277


