KSHV-encoded vCyclin can modulate HIF1α levels to promote DNA replication in hypoxia
- Department of Otorhinolaryngology-Head and Neck Surgery, Perelman School of Medicine, University of Pennsylvania, United States
- Institute of Medical Sciences, Banaras Hindu University, India
- Department of Microbiology, Levy Building, School of Dental Medicine, University of Pennsylvania, United States
- Program in Gene Regulation, The Wistar Institute, United States
- Department of Microbiology, Perelman School of Medicine, University of Pennsylvania, United States
Figures
Figure 1 with 1 supplement
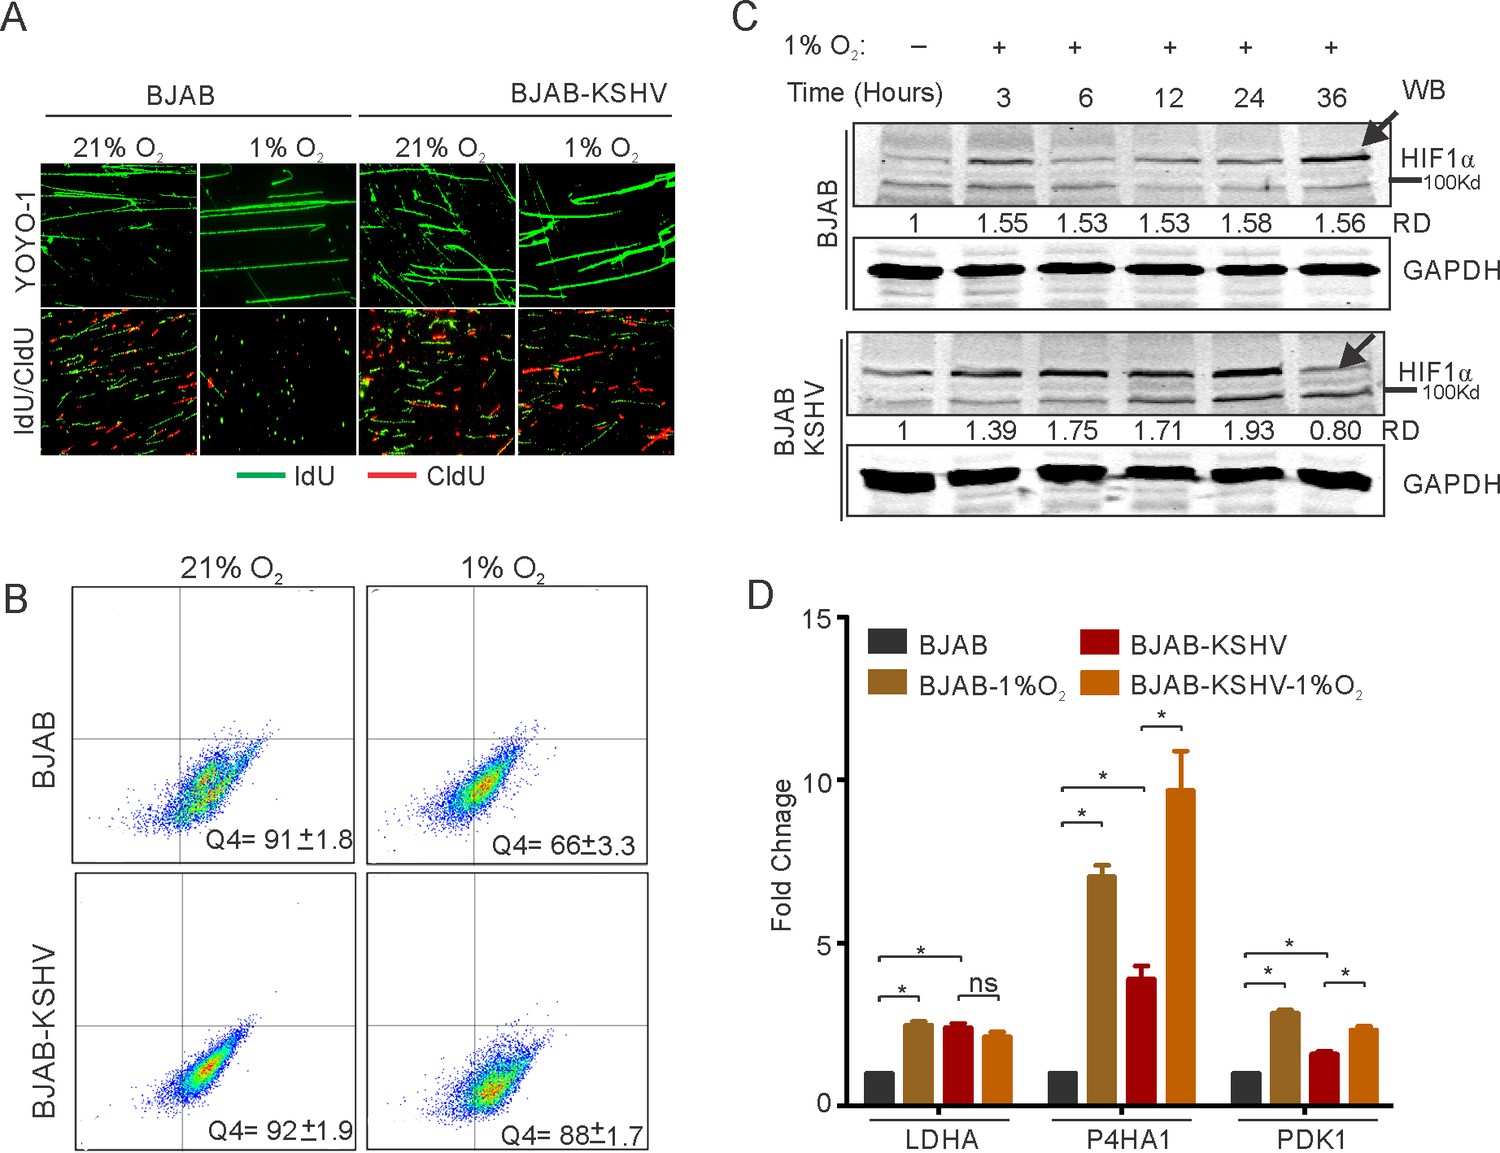
KSHV infection restricts HIF1α activity to promote DNA replication.
(A) Representative image of YOYO-1 staining of stretched DNA and nucleotide analog incorporation in BJAB and BJAB-KSHV cells grown under normoxic or hypoxic conditions (B) quantitation of nucleotide analog incorporation in BJAB and BJAB-KSHV cells grown under normoxic or hypoxic conditions. Cells pulsed with IdU were probed with anti-IdU antibodies and the relative incorporation was measured using a FACS machine. (C) Representative HIF1α western blot analysis in BJAB and BJAB-KSHV cells grown under normoxia or hypoxic conditions. The cells were either grown under normoxic or hypoxic conditions for the indicated time period. Equal amounts of protein were used to detect HIF1α from the lysate of these cells. GAPDH western Blot served as the loading control. (D) Real-time PCR analysis for the transcriptional activity of HIF1α in BJAB and BJAB-KSHV cells grown under normoxic or hypoxic conditions. The cells were grown under normoxic or hypoxic conditions followed by total RNA isolation and cDNA synthesis. Equal amounts of cDNA were used for expression analysis of HIF1α targets (LDHA, PDK1, and P4HA1) by real-time PCR. The experiment was performed in triplicate. The error bar represents standard error from the mean. A p-value of <0.05 (*) was taken into consideration for statistical significance.
-
Figure 1—source data 1
Fold change of LDHA P4HA1 and PDK1 in BJAB AND BJAB_KSHV cells in Normoxia and hypoxia.
- https://cdn.elifesciences.org/articles/57436/elife-57436-fig1-data1-v2.xlsx
Figure 1—figure supplement 1
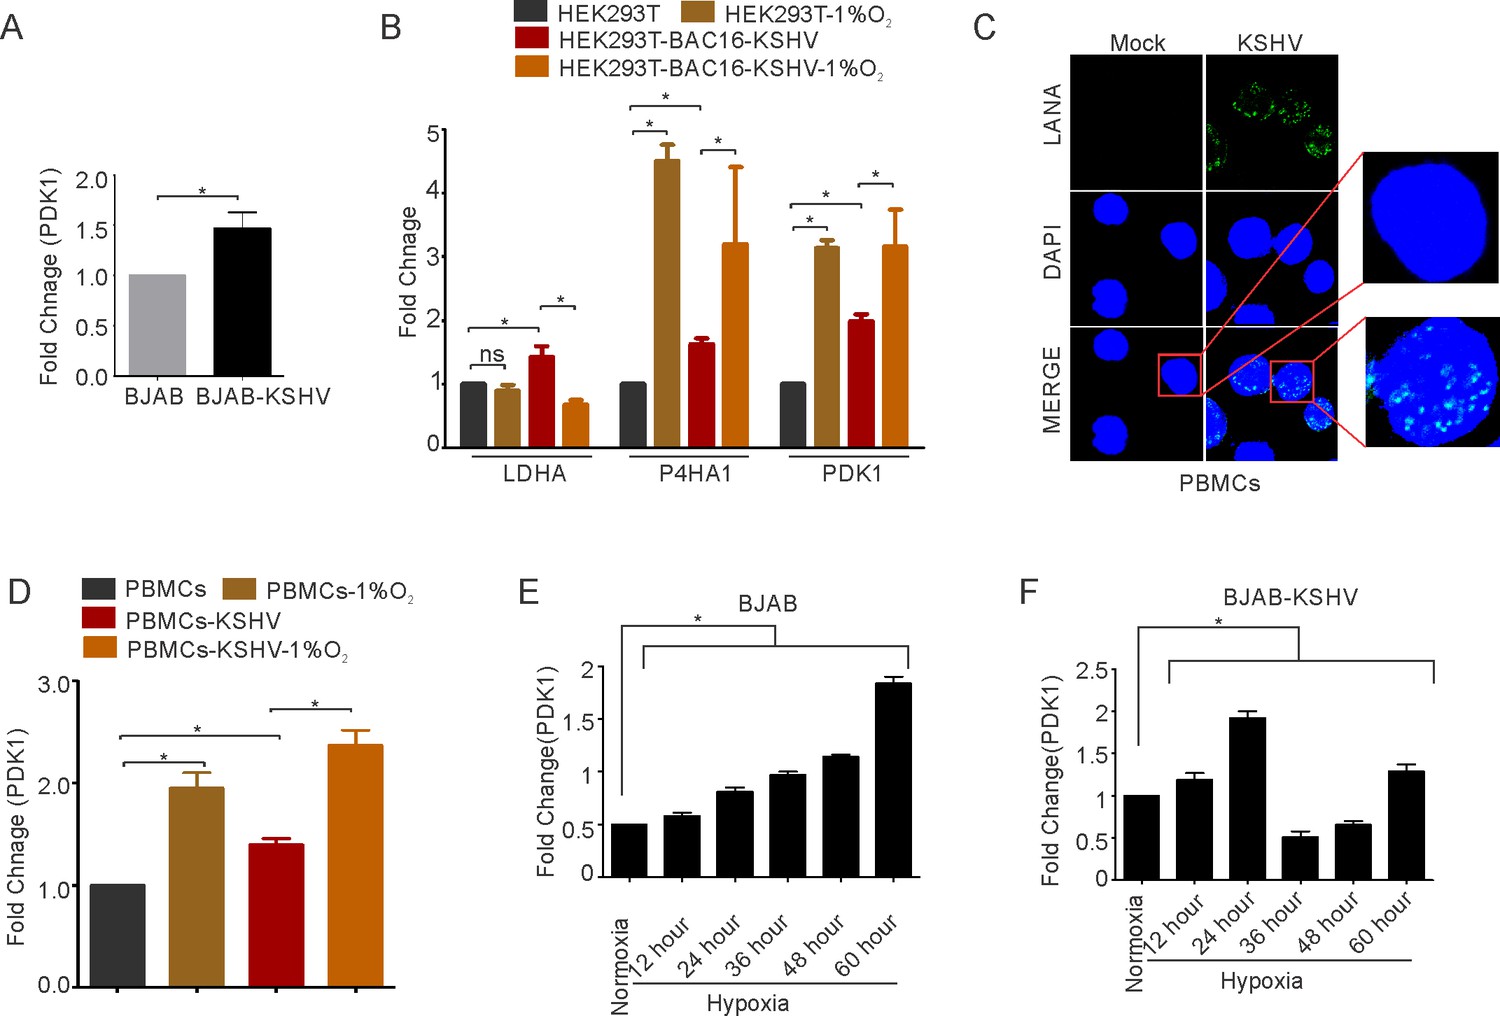
KSHV mediated supression of HIF1α transcriptional activity in HEK293T cells and in PBMCs.
(A) Real-time PCR analysis for the transcriptional activity of HIF1α by measuring expression of PDK1 in BJAB and BJAB-KSHV cells at 12 hr time period.
(B) Real-time PCR analysis for the transcriptional activity of HIF1α in HEK293T and HEK293T-BAC16-KSHV cells grown under normoxic or hypoxic conditions. The cells were grown under normoxic or hypoxic conditions for 36 hr followed by total RNA isolation and cDNA synthesis. Equal amount of cDNA was used for expression analysis of HIF1α targets (LDHA, PDK1, and P4HA1) by real-time PCR. The experiment was performed in triplicate. The error bar represents standard error from the mean. A p-value of <0.05 (*) was taken into consideration for statistical significance. (C) Representative image for LANA immuno-fluorescence in PBMCs infected with mock or rKSHV. (D) Real-time PCR analysis for the transcriptional activity of HIF1α by measuring expression of PDK1 in mock or rKSHV infected PBMCs grown under normoxic or hypoxic conditions. The experiment was performed in triplicate (* p<0.05). (E) Real-time PCR analysis for the transcriptional activity of HIF1α by measuring expression of PDK1 in BJAB cells grown under normoxic or hypoxic conditions for various time periods. The experiment was performed in triplicate. The error bar represents standard error from the mean. A p-value of <0.05 (*) was taken into consideration for statistical significance. (F) Real-time PCR analysis for the transcriptional activity of HIF1α by measuring expression of PDK1 in BJAB-KSHV cells grown under normoxic or hypoxic conditions for various time periods. The experiment was performed in triplicate. The error bar represents standard error from the mean. A p-value of <0.05 (*) was taken into consideration for statistical significance.
-
Figure 1—figure supplement 1—source data 1
Fold change of HIF1α transcriptional targets in various cell types in normoxic conditions.
- https://cdn.elifesciences.org/articles/57436/elife-57436-fig1-figsupp1-data1-v2.xlsx
Figure 2 with 1 supplement
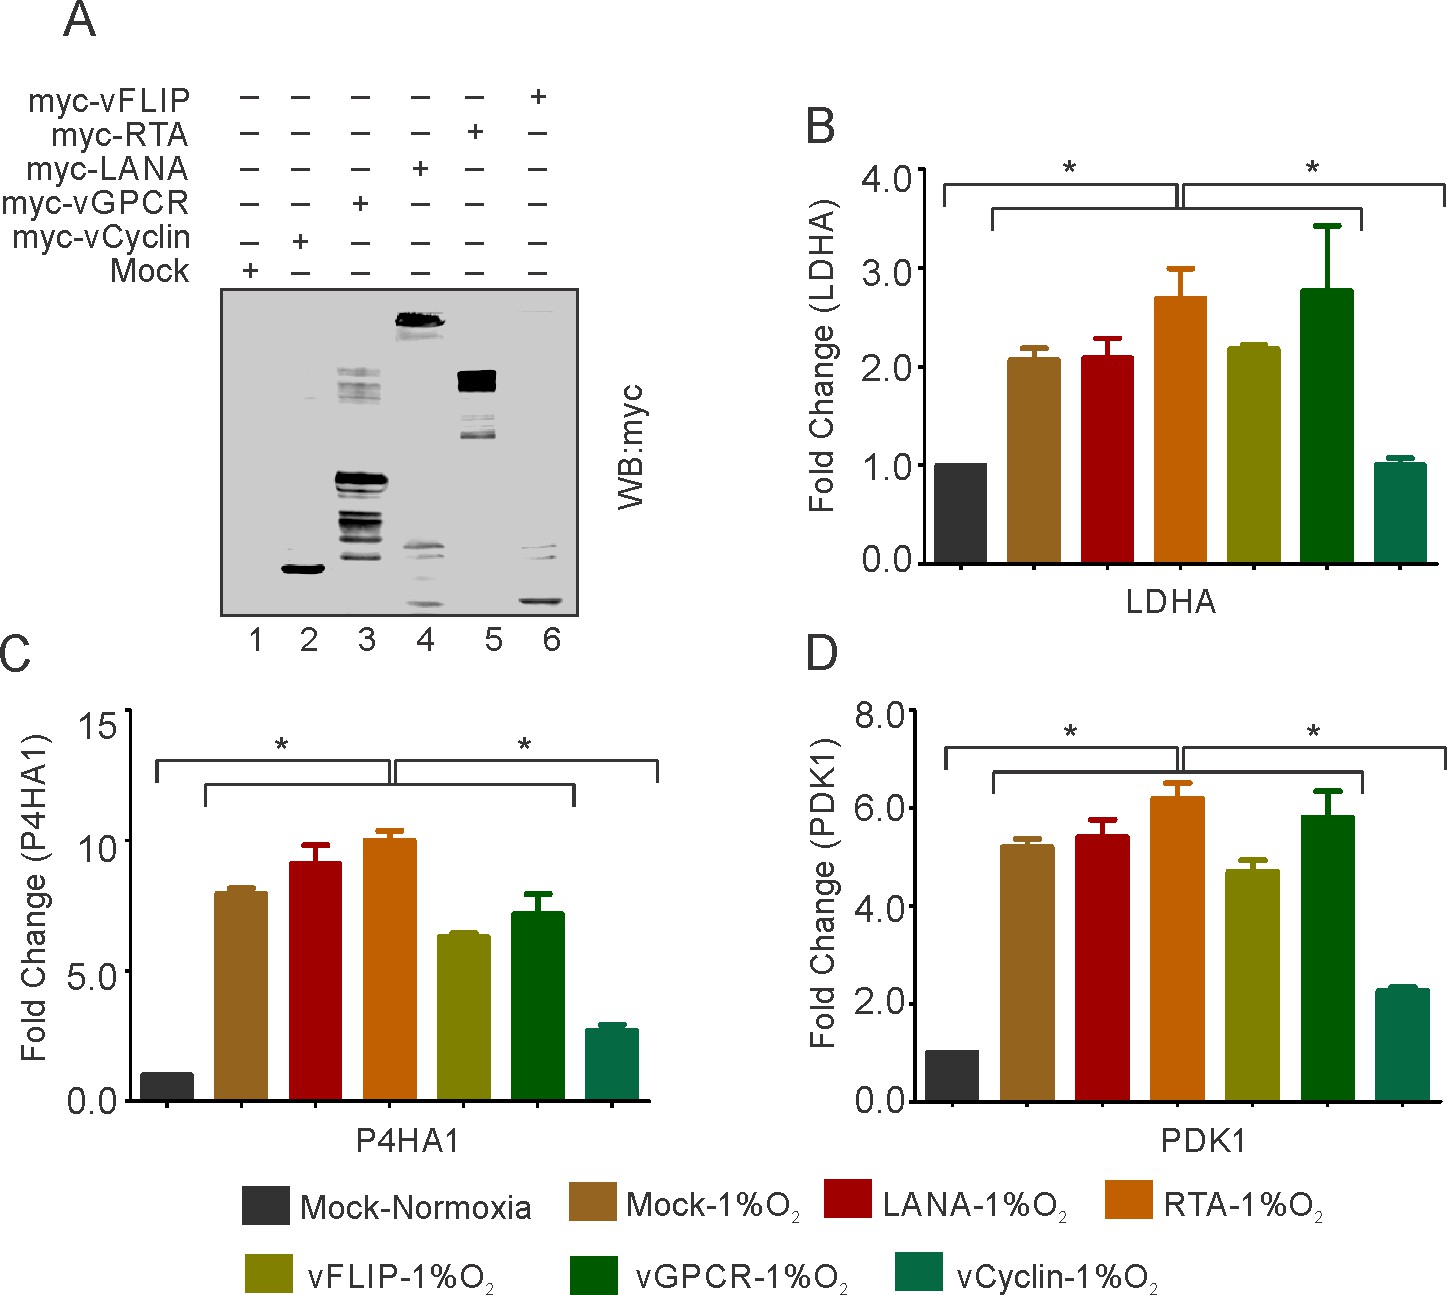
KSHV-encoded vCyclin restricts HIF1α transcriptional activity.
(A) Expression of KSHV-encoded antigens. Mock, myc-tagged vCyclin, myc-tagged vGPCR, myc-tagged LANA, myc-tagged RTA, or myc-tagged vFLIP plasmids were transfected into HEK293T cells followed by western blot analysis using anti-myc antibody. (B–D) Real-time PCR expression analysis of HIF1α targets LDHA, P4HA1 and PDK1 in HEK293T cells transfected with Mock, LANA, RTA, vFLIP, vCyclin, or vGPCR plasmids and grown under hypoxic conditions compared to Mock transfection grown under normoxic or hypoxic conditions. Twenty-four hr post transfection, cells were grown for another 24 hr in hypoxic conditions. Total RNA was isolated from transfected cells followed by synthesis of cDNA using 2 µg of the total RNA. Equal cDNA was used for quantitative real-time PCR. GAPDH was used as the endogenous control. The experiments were done in triplicate. The error bar represents standard error from the mean. A p-value of <0.05 (*) was taken into consideration for statistical significance.
-
Figure 2—source data 1
KSHV-encoded vCyclin mediated restriction of HIF1α transcriptional activity in hypoxic conditions.
- https://cdn.elifesciences.org/articles/57436/elife-57436-fig2-data1-v2.xlsx
Figure 2—figure supplement 1

Real-time PCR expression analysis of HIF1α targets LDHA, P4HA1 and PDK1 in HEK293T cells transfected with Mock, LANA, vGPCR, RTA, vCyclin or vFLIP plasmids and grown under normoxic conditions.
Forty-eight hr post transfection, total RNA was isolated from transfected cells followed by synthesis of cDNA using 2 µg of the total RNA. One µL of 10 times diluted cDNA was used for quantitative real-time PCR. GAPDH was used as the endogenous control. The experiments were done in triplicate. The error bar represents standard error from the mean. A p-value of <0.05 (*) was taken into consideration for statistical significance (** p<0.001).
-
Figure 2—figure supplement 1—source data 1
KSHV-encoded vCyclin mediated restriction of HIF1α transcriptional activity in normoxic conditions.
- https://cdn.elifesciences.org/articles/57436/elife-57436-fig2-figsupp1-data1-v2.xlsx
Figure 3 with 1 supplement

KSHV-encoded vCyclin physically interacts with HIF1α and mediates its cytosolic translocation.
(A) HEK293T cells were transfected with GFP-vCyclin encoding plasmids. The transfected cell were analyzed for cellular localization of expressed proteins through GFP fluorescence with reference to nucleus (DAPI signals). The GFP signals showed a clear distribution to the nuclear, cytosolic or nucleo-cytosolic compartments. (B) Microscopic investigation of HIF1α sub-cellular localization in vCyclin expressing KSHV-positive BC3 cells grown under hypoxic conditions. Cells were seeded on coverslips. The coverslip-attached cells were fixed, permealized, blocked and probed with vCyclin and HIF1α antibodies. Nuclei were stained with DAPI. Both vCyclin and HIF1α showed a clear distribution to the nuclear, cytosolic, or nucleo-cytosolic compartments. (C) Immuno-precipitation of vCyclin with HIF1α in HEK293T cells. GFP-vCyclin transfected cells were lysed in radio-immunoprecipiation buffer and protein were pre-cleared with protein agarose A/G beads followed by overnight immuno-precipitation with GFP antibody. The immune complexes were collected with Protein agarose A/G bead slurry. The beads were washed with PBS and were resuspended in 2X SDS loading dye. One-third of the immuno-precipitated complex was run on 10% SDS PAGE against 5% input or IgG control sample and probed with HIF1α or GFP (for vCyclin) antibodies. (D) HIF1α immuno-precipitation using vCyclin antibodies in KSHV positive BC3, BCBL1, and JSC1 cells. KSHV-negative BJAB cells were used as a negative control. (E) Western blot analysis for nuclear, cytosolic, or nucleo-cytosolic localization of HIF1α in vCyclin expressing cells. The transfected cells were lysed to separate into nuclear or cytosolic fraction as described in the materials and methods section. The nuclear or cytosolic fractions were checked for localization of HIF1α. GAPDH and Histone H4 served as loading controls for cytosolic and nuclear fraction, respectively. Asterisk represents non-specific bands.
Figure 3—figure supplement 1

KSHV-encoded vCyclin shows gradual cytosolic translocation in transfected cells.
HEK293T cells were transfected with mock or GFP-vCyclin encoding plasmids. 24 or 48 hr post transfection, cell were analyzed for cellular localization of expressed proteins through GFP fluorescence with respect to nucleus. The mock GFP showed an even distribution of GFP throughout the cells while vCyclin showed enhanced cytosolic localization at longer time points.
Figure 4 with 2 supplements
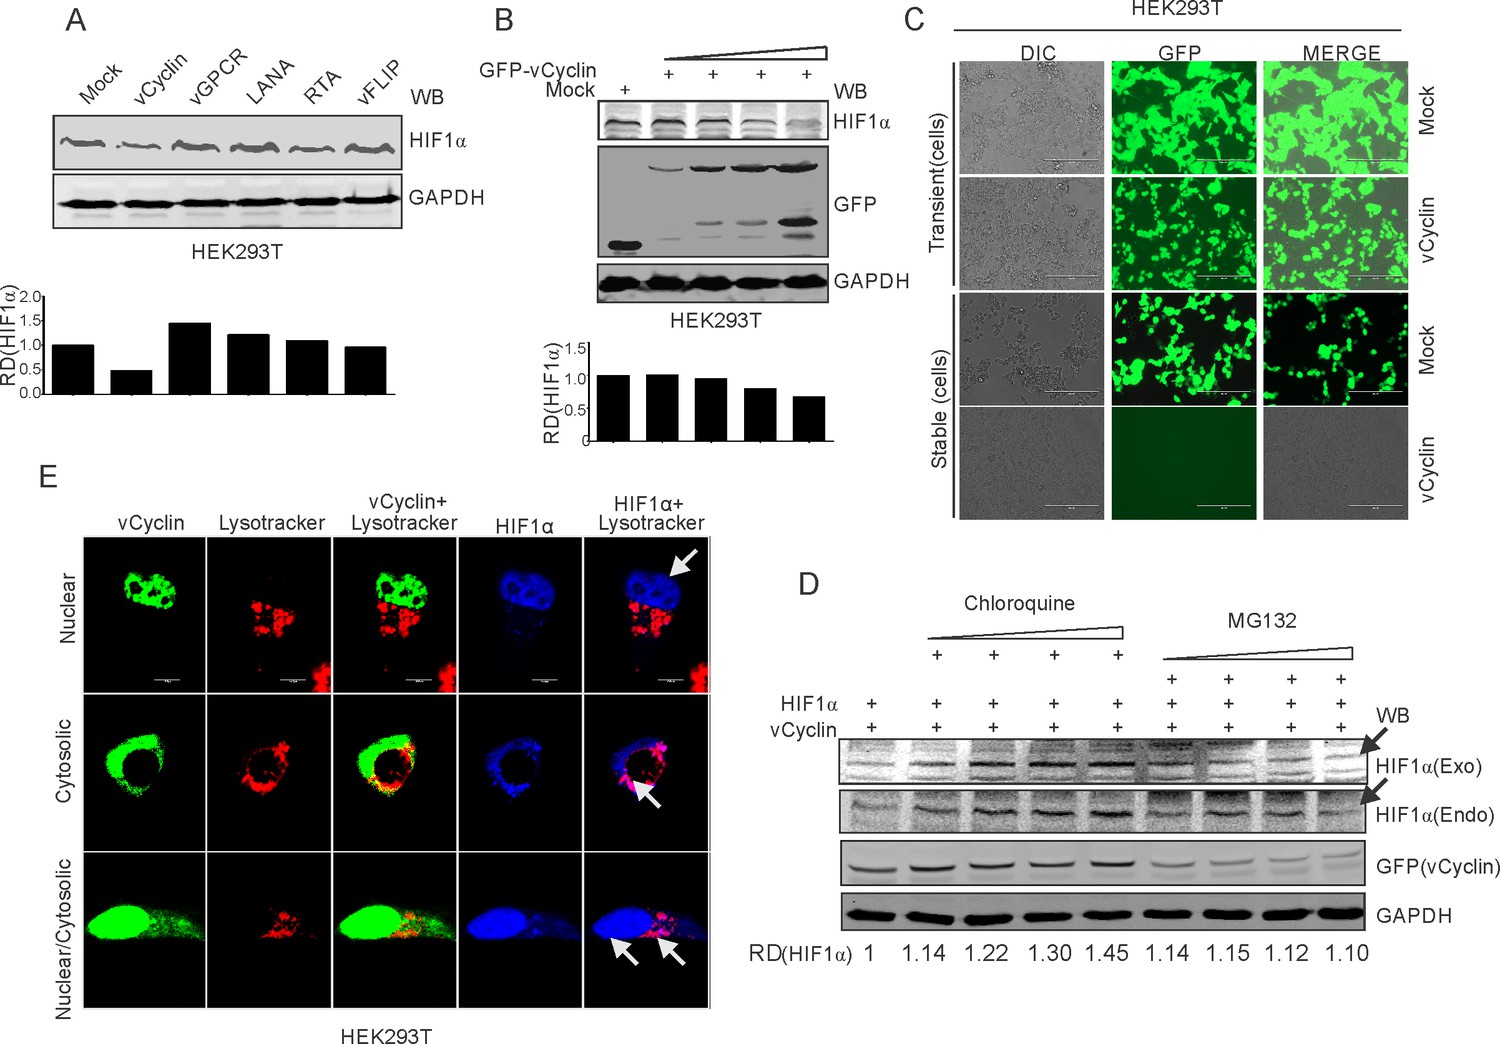
KSHV-encoded vCyclin degrades HIF1α in a dose-dependent manner through the lysosomal pathway.
(A) Mock or KSHV-encoded vCyclin, LANA, RTA, vGPCR, and vFLIP were transfected into HEK293T cells followed by investigating HIF1α levels. Equal amounts of protein were used to probe HIF1α levels. GAPDH was used as the loading control (B) HIF1α, GFP-vCyclin and GAPDH western blots of cells transfected with gradually increasing amounts of GFP-vCyclin. GFP western blot represents GFP-vCyclin. GAPDH was used as the loading control. (C) Representative image for generation of mock or GFP-vCyclin stable cell lines (D) HIF1α western blot analysis of HEK293T cells transfected with GFP-vCyclin and treated with increasing amounts of lysosomal inhibitor (Chloroquine; 0, 6.25, 12.5, 25, and 50 µM) or proteasomal inhibitor (MG132; 1.25, 2.5, 5, and 10 µM). Twenty-four hr post transfection, culture media was removed and replaced with fresh medium containing either Choloroquine or MG132 as indicated. Arrow indicates HIF1α band. (E) Lysosomal translocation of HIF1α by KSHV-encoded vCyclin. GFP signals represents expressed vCyclin. Lysosomes were stained with Lysotracker red. HIF1α was probed with Alexa 350 (blue). Arrow indicates representative HIF1α localization.
Figure 4—figure supplement 1
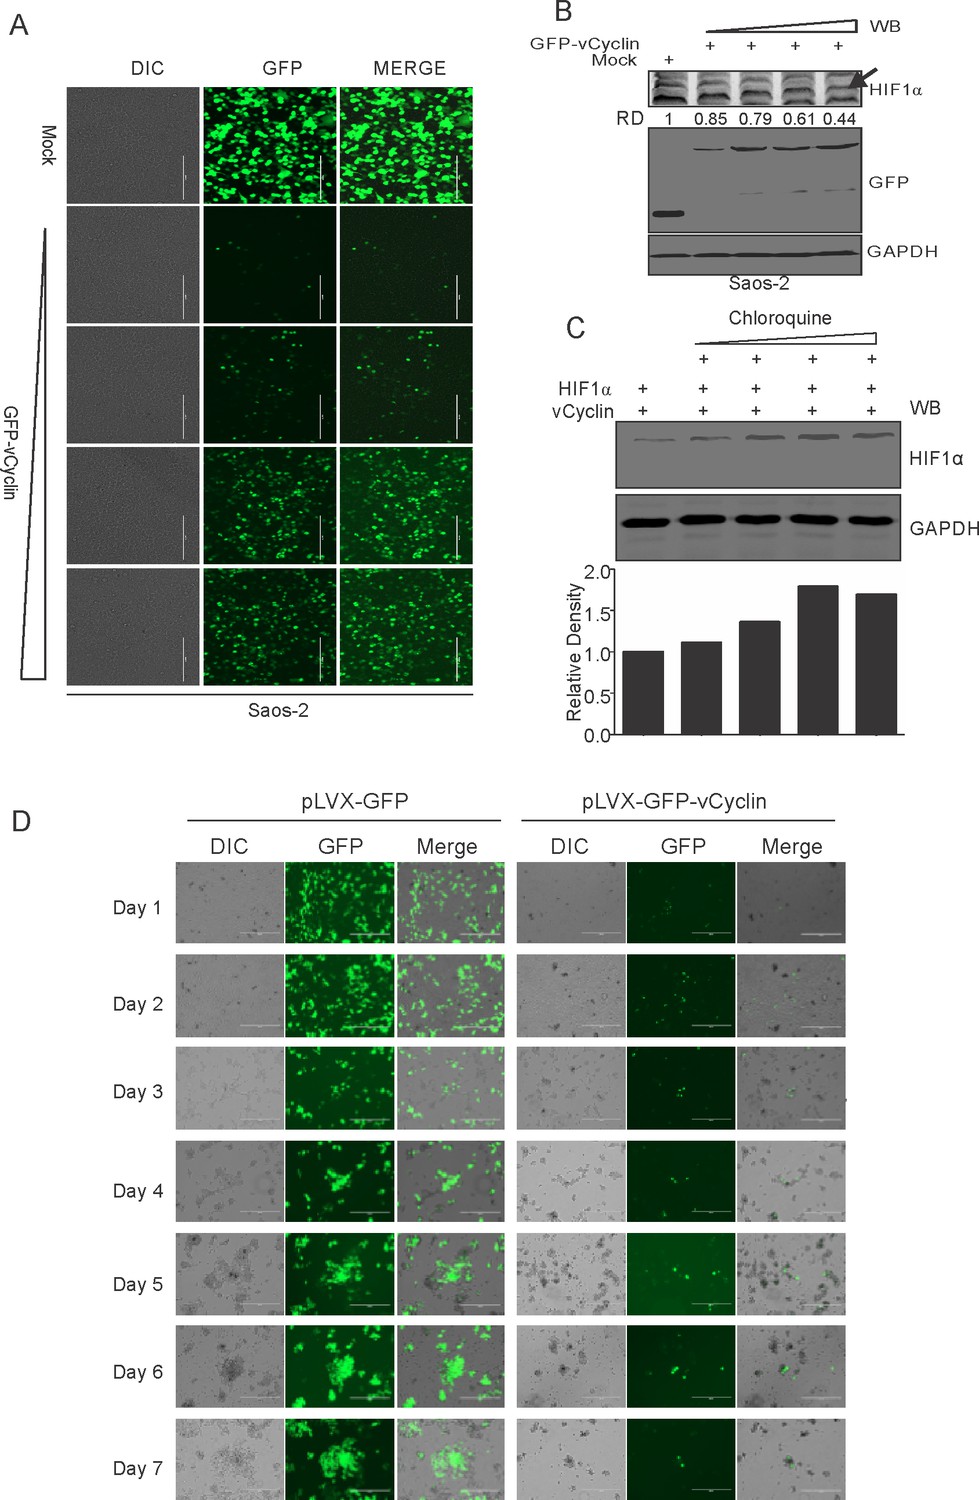
Dose-dependent lysosomal degradation of HIF1α by KSHV-encoded vCyclin in Saos-2 Cells.
(A) Microscopic visualization of vCyclin expression with increasing amounts of transfected plasmid. (B) HIF1α, GFP, and GAPDH western blots in cells transfected with gradually increasing amounts of GFP-vCyclin. GFP western blot represents GFP-vCyclin. GAPDH was used as the loading control. Arrow indicates HIF1α band. (C) HIF1α western blot analysis of Saos-2 cells transfected with GFP-vCyclin and treated with increasing amounts of lysosomal inhibitor (Chloroquine; 0, 6.25, 12.5, 25, and 50 µM). (D) Temporal expression of GFP-vCyclin in transfected cells at various time points. Mock-GFP or GFP-vCyclin was transfected in HEK293T cells followed by monitoring GFP expression every 24 hr for 7 days.
Figure 4—figure supplement 2
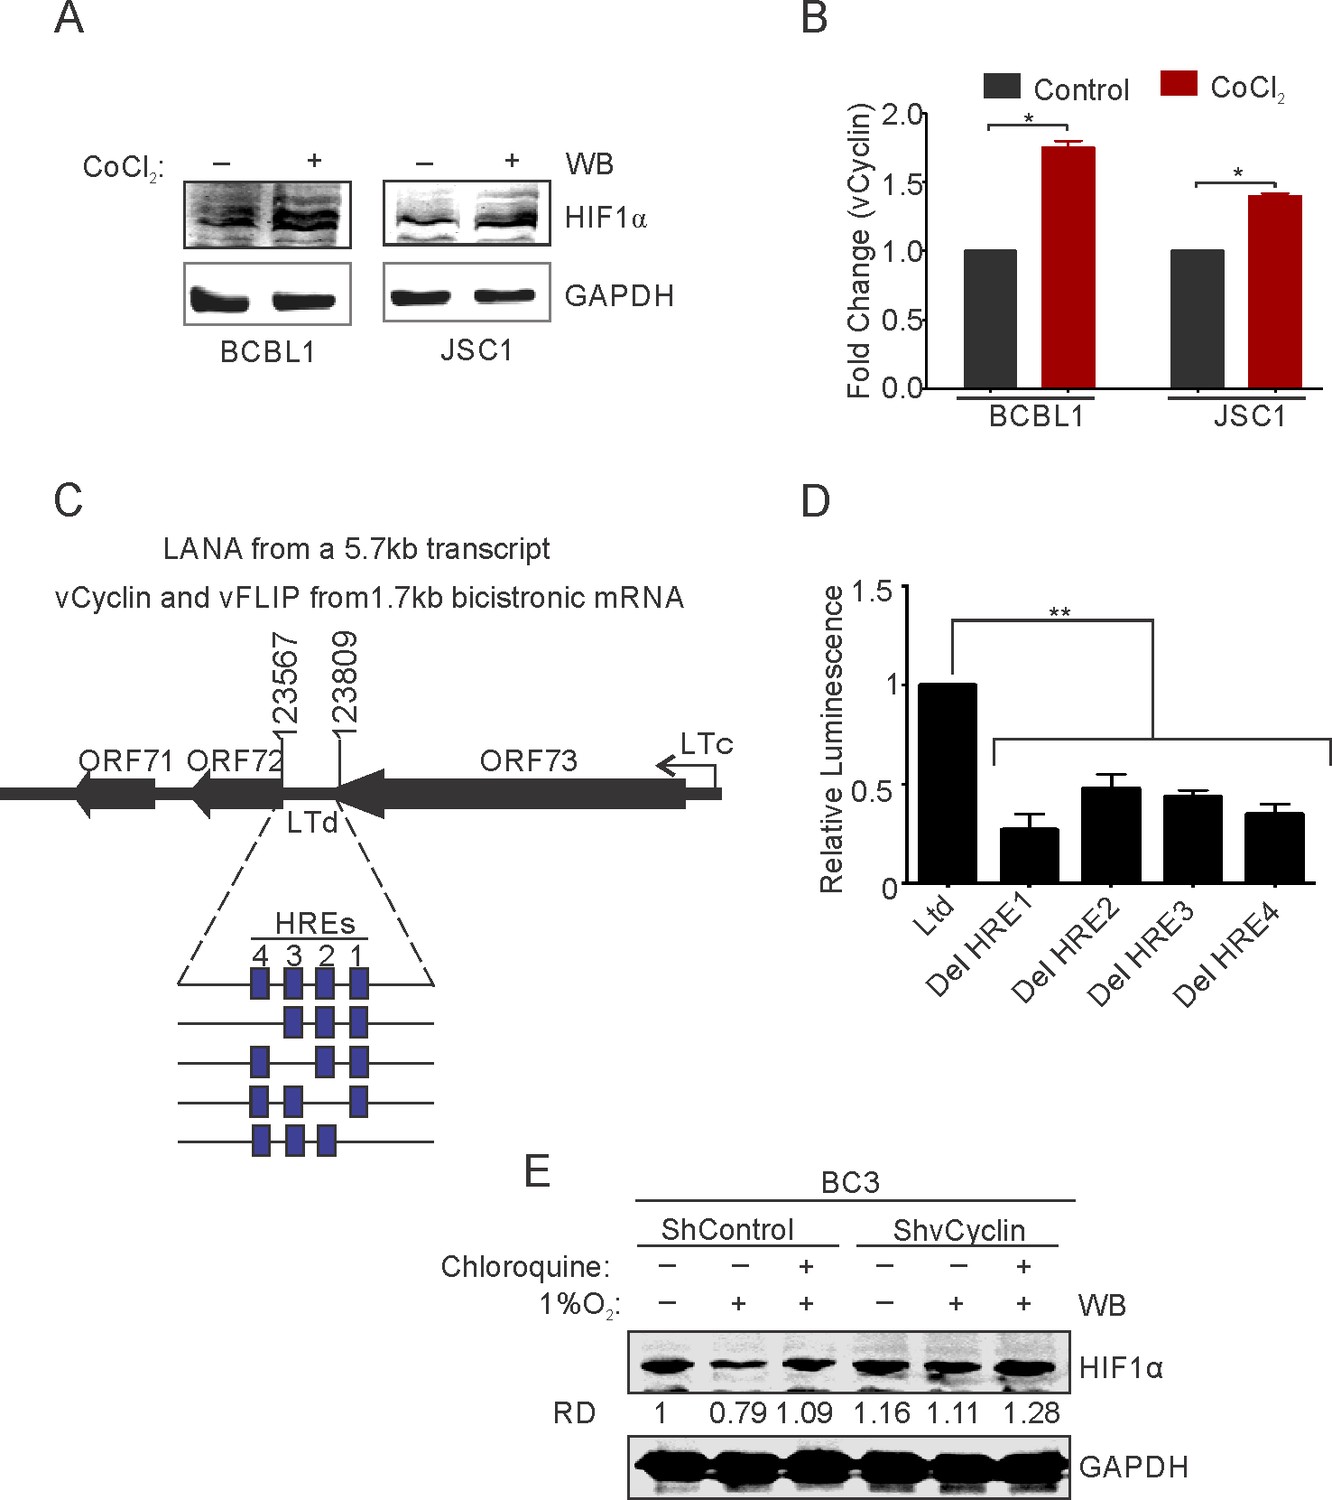
HIF1α-mediated upregulation of vCyclin in KSHV-positive BCBL1 and JSC1 cells.
Cells were grown under presence of CoCl2-induced hypoxia followed by real-time PCR analysis (A) Confirmation for induction of hypoxia by HIF1α western blot. (B) Real-time PCR analysis for vCyclin expression in BCBL1 and JSC1 cells grown under normoxic or CoCl2-induced hypoxia. (C) Schematic for hypoxia-responsive elements (HREs) within the promoter of vCycin. (D) Luciferase assay for identification of HIF1α regulated HREs of vCyclin promoter. (E) HIF1α western blot analysis in BC3-ShControl and BC3-ShvCyclin cells grown in normoxic or hypoxic condition in presence or absence of lysosomal inhibitor Chloroquine.
-
Figure 4—figure supplement 2—source data 1
vCyclin mediated degradation of HIF1α in naturally infected KSHV positive cell lines.
- https://cdn.elifesciences.org/articles/57436/elife-57436-fig4-figsupp2-data1-v2.xlsx
Figure 5
ChIP sequencing for HIF1α enrichment on KSHV genome in infected PBMCs or BC3 cells grown under normoxic or hypoxic conditions.
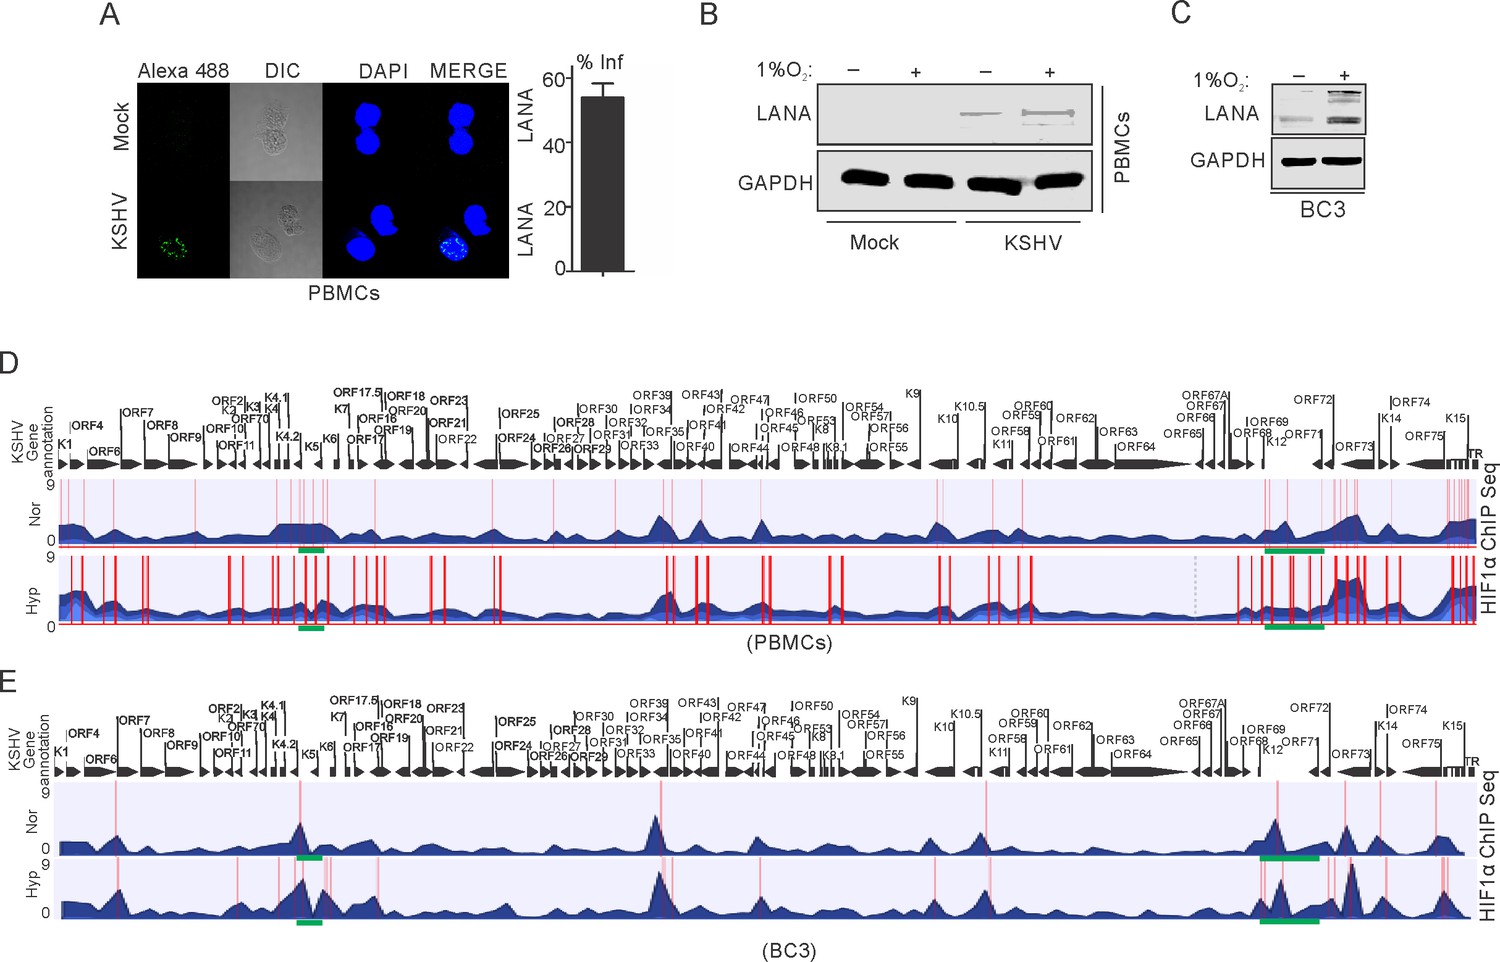
(A) KSHV infection of PBMCs. BC3 cells were used to reactivate KSHV by TPA/BA treatment. Purified KSHV at a multiplicity of infection equal to 10 was used for infecting PBMCs in the presence of 20 µg/ml Polybrene for 4 hr followed by changing infection medium to fresh medium without Polybrene and grown for another 24 hr. Cells were divided into halves and grown either under normoxic or hypoxic conditions for 24 hr. A small fraction of cells were taken out to check the efficiency of infection by LANA immunofluorescence. The bar diagram represents the infection rate. (B) Western blot analysis of LANA in mock or KSHV-infected cells grown under normoxic or hypoxic conditions. GAPDH served as the loading control. (C) Western blot analysis of LANA in KSHV-positive BC3 cells grown under normoxic or hypoxic conditions. (D and E) Alignment of ChIP sequencing reads with KSHV genome in infected PBMCs and KSHV-positive BC3 cells grown under normoxic or hypoxic conditions. The ChIP sequencing data was analyzed using CLCbio software (Qiagen). The highlighted sections represent regions with significant differential enrichment.
Figure 6 with 1 supplement
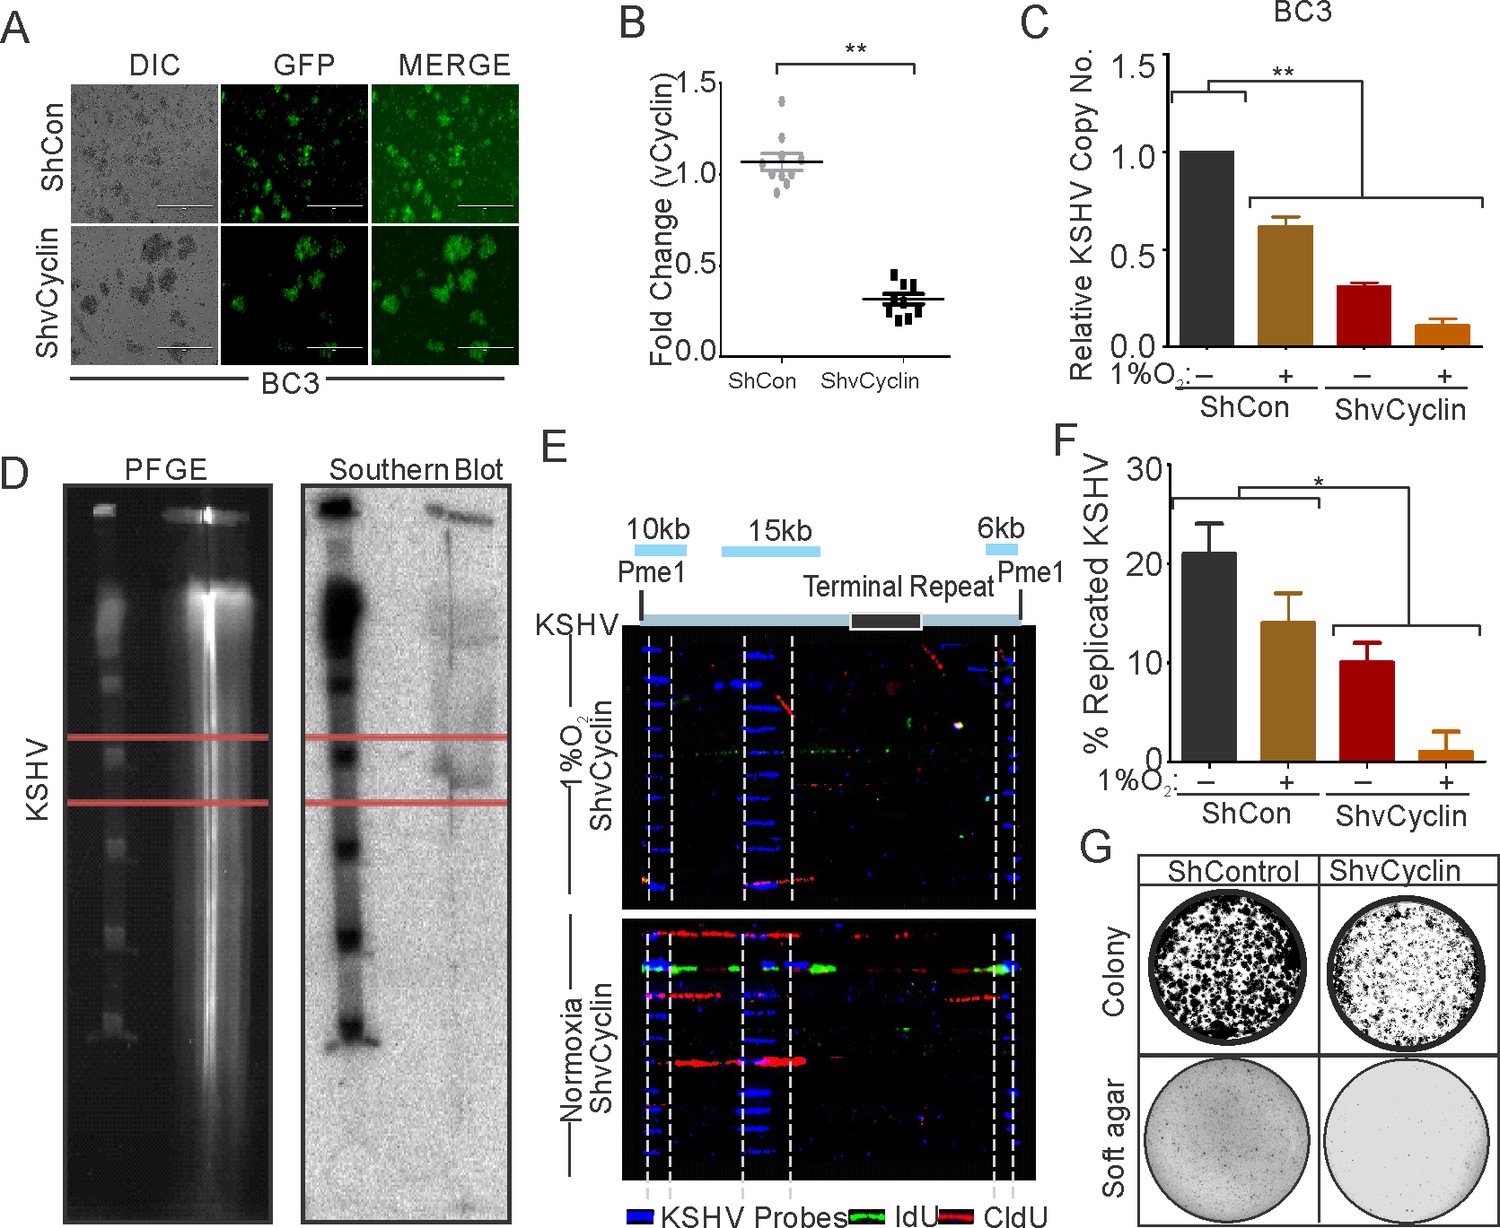
vCyclin knock down in KSHV-positive cells shows compromised growth potential in hypoxic conditions.
(A) Generation of vCyclin knock down stable cells in KSHV-positive BC3 cells. BC3 cells were transduced with ShvCyclin lentiviruses and selected in puromycin for 3 weeks. GFP-positive cells represent successfully transduced stable cells. (B) Real-time PCR for vCyclin in BC3 shControl and ShvCyclin stable cells (n=9; asterisk represents statistically significant difference). (C) Relative copy number calculation of KSHV in BC3 shControl and ShvCyclin stable cells grown under normoxic or hypoxic conditions. The experiments were performed in triplicate. The error bar represents standard error from the mean. A p-value of <0.05, was taken into consideration for statistical significance, (** p<0.001). (D) Representative image for pulse field gel electrophoresis and Southern blot analysis for nucleotide analog pulsed cells after proteinase K and Pme1 digestion. (E) Representative image for single molecule analysis of replicated DNA of BC3 ShControl or BC3-ShvCyclin cells grown under hypoxic conditions. Blue fluorescence represents KSHV specific probes; red represents incorporation of IdU, while green represents CldU incorporation. (F) Bar diagram for quantitation of replicated KSHV molecules in BC3 ShControl or BC3-ShvCyclin cells grown under normoxic or hypoxic conditions. (G) Colony focusing and soft agar assay to investigate in vitro anchorage-dependent/independent grown potential of shControl and ShvCyclin of KSHV-positive stable cells grown under hypoxic conditions.
-
Figure 6—source data 1
vCyclin is essential for hypoxic reactivation of KSHV.
- https://cdn.elifesciences.org/articles/57436/elife-57436-fig6-data1-v2.xlsx
Figure 6—figure supplement 1

Degradation of HIF1α in naturally KSHV-infected cells grown under normoxic or hypoxic conditions at various time points.
Naturally infected BC3 cells were grown under normoxic or hypoxic conditions for various time points and levels of vCylcin or HIF1α was investigated by western blot analysis. Increased expression of vCyclin was directly correlated with HIF1α degradation.
Figure 7

Schematic for KSHV-mediated attenuation of HIF1α-mediated repression of DNA replication in hypoxic conditions.
A KSHV uninfected cell shows upregulated expression of HIF1α which restricts DNA replication in hypoxic conditions. In KSHV-infected cells, KSHV-encoded LANA and vGPCR promotes upregulated expression of HIF1α through inhibition of its proteosomal degradation or by working on MAPK/P38 pathway, respectively. KSHV-encoded vCyclin, which is also expressed in response to hypoxia, interacts and regulates HIF1α transcriptional activity, as well as degrades it through the lysosomal pathway to balance HIF1α-mediated restriction of DNA replication in hypoxia.
Tables
Key resources table
| Reagent type (species) or resource | Designation | Source or reference | Identifiers | Additional information |
|---|---|---|---|---|
| Cell line (Homo sapiens) | BJAB | Harvard Medical School, Boston, MA | PMID:2157887 | Gift from Dr. Elliott Kieff (Harvard Medical School, Boston, MA) |
| Cell line (Homo sapiens) | BJAB-KSHV | University of Washington, Seattle, Washington | PMID:16254372 | Gift from Dr. Michael Lagunoff (University of Washington, Seattle, Washington) |
| Cell line (Homo sapiens) | BC3 | American Type Culture Collection | CRL:2277 | https://www.atcc.org/products/crl-2277 |
| Cell line (Homo sapiens) | BCBL1 | American Type Culture Collection | PMID:8612236 | Gift from Dr. Don Ganem (University of California School of Medicine, San Francisco, CA) |
| Cell line (Homo sapiens) | JSC1 | Johns Hopkins University School of Medicine, Baltimore, MD | CRL-2769 | Gift from Dr. Richard F. Ambinder (Johns Hopkins University School of Medicine, Baltimore, MD) |
| Cell line (Homo sapiens) | HEK293T | Brigham and Woman’s Hospital, Boston, MA | CRL:3216 | Gift from Dr. John Aster Brigham and Womens Hospital, Boston, MA |
| Cell line (Homo sapiens) | Saos-2 | Brigham and Woman’s Hospital, Boston, MA | HTB:85 | Gift from Dr. John Aster Brigham and Womens Hospital, Boston, MA |
| Antibody | Anti-HIF1α (Mouse monoclonal) | Novus Biologicals | Cat No. NB 100–105 | WB: 1:250 IF: 1:50 |
| Antibody | Anti-GAPDH (Mouse monoclonal) | Santa Cruz Biotechnology | Cat No. SC-32233 | WB: 1:2000 |
| Antibody | Anti-myc (Mouse monoclonal) | Hybridoma | Purified antibody | WB: 1:250 |
| Antibody | Anti-GFP (Mouse monoclonal) | Santa Cruz Biotechnology | Cat No. Sc-9996 | WB: 1:2000 |
| Antibody | Anti-vCyclin (Rat monoclonal) | Abcam | Cat No. ab12208 | WB: 1:250 IF: 1:50 |
| Antibody | Anti-LANA (Mouse monoclonal) | Hybridoma | Purified antibody | WB: 1:250 IF: 1:100 |
| Antibody | Anti-IdU (Mouse monoclonal) | BD Fisher Scientific | Cat No. BDB347580 | IF: 1:20 |
| Antibody | Anti-CldU (Rat monoclonal) | Accurate Chemical | Cat No. OBT0030S | IF: 1:20 |
| Antibody | Alexa flour 488 (Goat polyclonal) | ThermoFisher | Cat No. 11006 | IF: 1:20 |
| Antibody | Alexa flour 568 (Goat polyclonal) | ThermoFisher | Cat No. 11004 | IF: 1:20 |
| Antibody | Anti-Histone 4 (Rabbit polyclonal) | Merck | Cat No. 07–108 | WB: 1:1000 |
| Chemical compound, drug | YOYO-1 | ThermoFisher | Cat No. Y3601 | |
| Chemical compound, drug | Biotinylated anti-avidin | Vector Laboratory | Cat No. BA-0300 | |
| Chemical compound, drug | Neutr-avidin alexa 350 | ThermoFisher | Cat No. A11236 | |
| Chemical compound, drug | IdU | Sigma-Aldrich | Cat No. I7125-5G | |
| Chemical compound, drug | CldU | Sigma-Aldrich | Cat No. C6891 | |
| Chemical compound, drug | Transfection Reagent | Polyplus Transfection | Reference No. 114–07 | |
| Chemical compound, drug | MG132 | abcam | Cat No. ab141003 | |
| Chemical compound, drug | Chloroquine | Sigma-Aldrich | Cat No. C6628 | |
| Chemical compound, drug | DAPI | Sigma-Aldrich | Cat No. D9564 | |
| Chemical compound, drug | Lysotracker | ThermoFisher | Cat No. L12492 | |
| Software, algorithm | GraphPad Prism | GraphPad Prism (http://graphpad.com) | RRID:SCR_015807 | |
| Software, algorithm | ImageJ | ImageJ (http://imagej.nih.gov/ij/) | RRID:SCR_003070 | |
| Software, algorithm | CLC Bio | Qiagen (http://qiagen.com) | Cat. No. / ID: 832021 |
Additional files
-
Supplementary file 1
List of primers used to amplify various HREs constructs within vCyclin promoter and for the real-time PCR.
- https://cdn.elifesciences.org/articles/57436/elife-57436-supp1-v2.docx
-
Supplementary file 2
HIF1α-binding sites on the KSHV genome in BC3 cells grown under hypoxic conditions.
- https://cdn.elifesciences.org/articles/57436/elife-57436-supp2-v2.docx
-
Supplementary file 3
HIF1α-binding sites on the KSHV genome in BC3 cells grown under normoxic conditions.
- https://cdn.elifesciences.org/articles/57436/elife-57436-supp3-v2.docx
-
Supplementary file 4
HIF1α-binding sites on the KSHV genome in infected PBMCs grown under hypoxic conditions.
- https://cdn.elifesciences.org/articles/57436/elife-57436-supp4-v2.docx
-
Supplementary file 5
HIF1α-binding sites on the KSHV genome in infected PBMCs grown under normoxic conditions.
- https://cdn.elifesciences.org/articles/57436/elife-57436-supp5-v2.docx
-
Transparent reporting form
- https://cdn.elifesciences.org/articles/57436/elife-57436-transrepform-v2.docx
Download links
A two-part list of links to download the article, or parts of the article, in various formats.
Downloads (link to download the article as PDF)
Open citations (links to open the citations from this article in various online reference manager services)
Cite this article (links to download the citations from this article in formats compatible with various reference manager tools)
KSHV-encoded vCyclin can modulate HIF1α levels to promote DNA replication in hypoxia
eLife 10:e57436.
https://doi.org/10.7554/eLife.57436


