Microglia TREM2R47H Alzheimer-linked variant enhances excitatory transmission and reduces LTP via increased TNF-α levels
- Department of Pharmacology, Physiology and Neuroscience, New Jersey Medical School, United States
- Brain Health Institute, Jacqueline Krieger Klein Center in Alzheimer's Disease and Neurodegeneration Research, Rutgers, The State University of New Jersey, United States
Figures
Figure 1
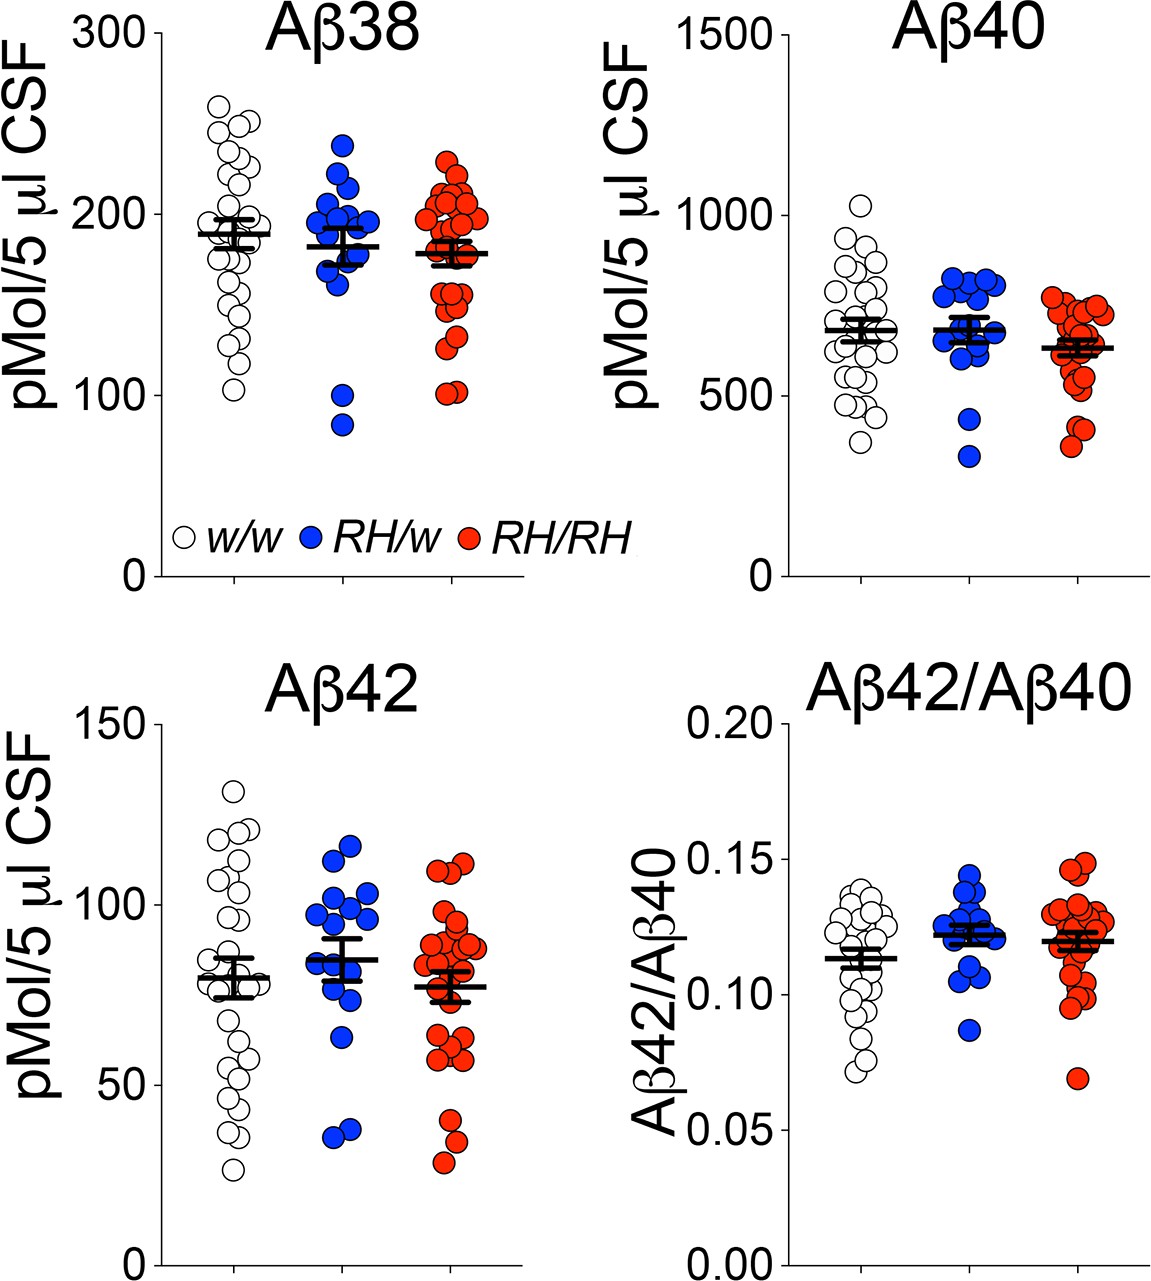
Concentrations of human Aβ species are similar in the CSF of peri-adolescent Trem2w/w, Trem2R47H/w, and Trem2R47H/R47H rats.
Levels of Aβ38, Aβ40, and Aβ42/Aβ40 ratio in 6–8 weeks old Trem2w/w, Trem2R47H/w, and Trem2R47H/R47H rat CSF. We used the following numbers of samples: Trem2w/w, females n = 12, males n = 16; Trem2R47H/w females n = 6, males n = 10; Trem2R47H/R47H females n = 10, males n = 17. Data are represented as mean ± SEM. Data were analyzed by ordinary one‐way ANOVA. No differences were seen in Aβ38 [F(2, 68)=0.5339, p=0.5887], Aβ40 [F(2, 68)=1.010, p=0.3696], Aβ42 [F(2, 68)=0.4376, p=0.6474] levels and the Aβ42/Aβ40 ratio [F(2, 68)=1.564, p=0.2168].
-
Figure 1—source data 1
Related to Figure 1.
- https://cdn.elifesciences.org/articles/57513/elife-57513-fig1-data1-v2.xlsx
Figure 2
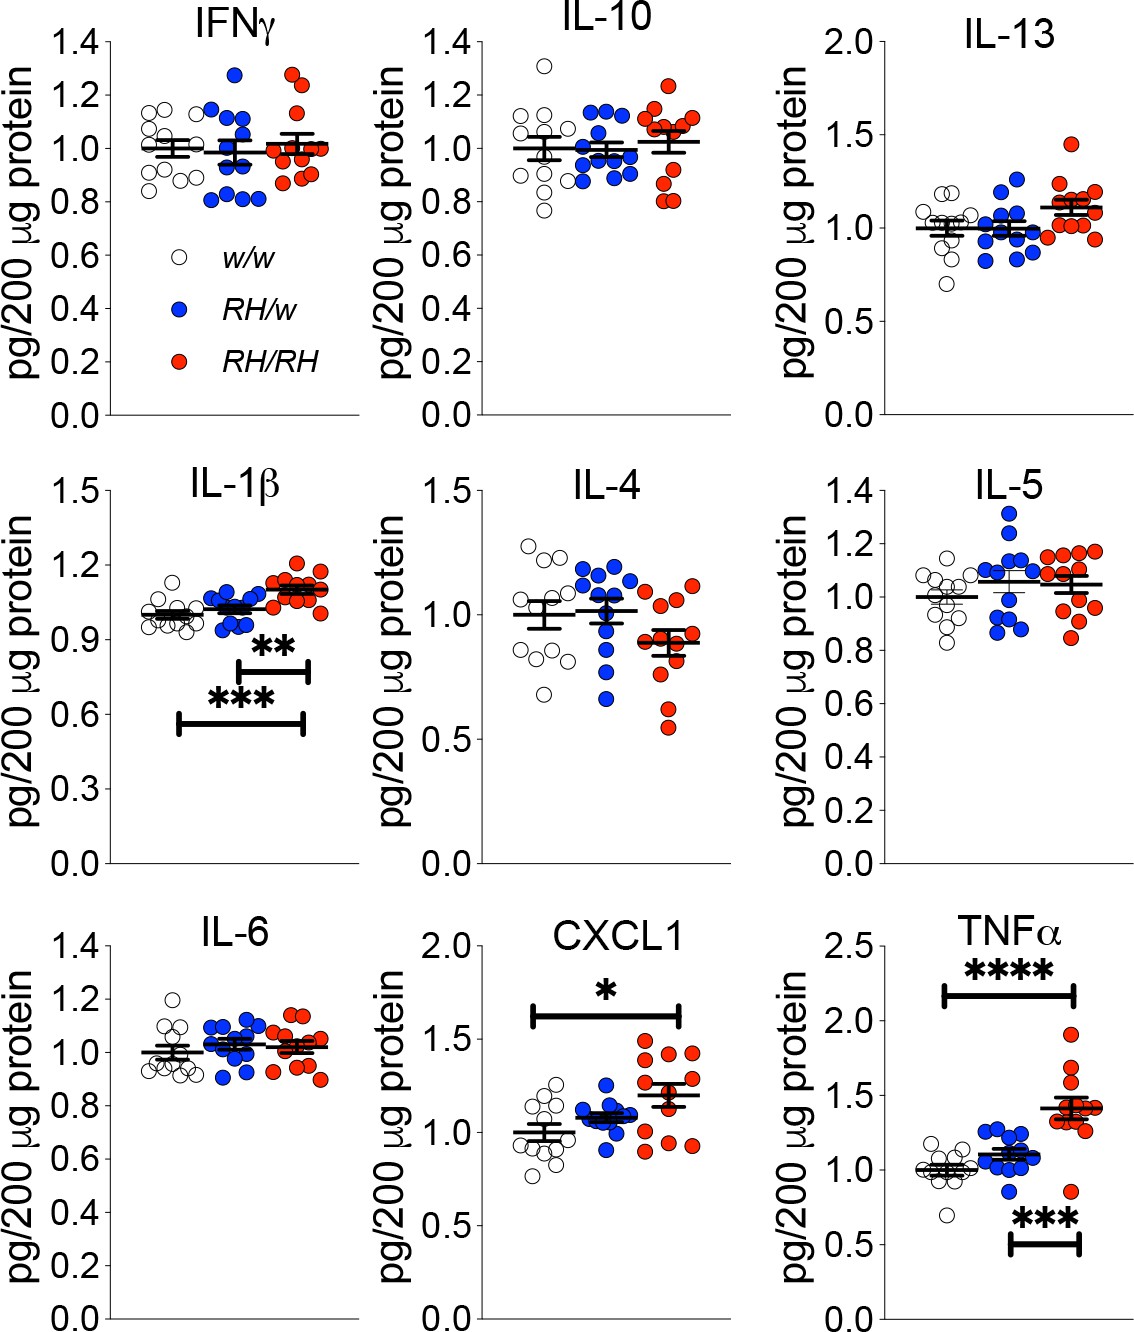
Levels of TNF-α and other proinflammatory cytokines are increased in the CNS of pre-adolescent Trem2R47H/R47H rats.
Levels of IFN-δ, IL-1β, IL-4, IL-5, IL-6, CXCL1, IL-10, IL-13, and TNF-α in the CNS of 4 weeks old rats were measured by ELISA. IL-1β, CXCL1 and TNF-α are significantly increased in Trem2R47H/R47H rats; IFN-γ, IL-4, IL-5, IL-6, IL-10 and IL-13 are not. We used the following numbers of samples: Trem2w/w, females n = 5, males n = 7; Trem2R47H/w females n = 6, males n = 6; Trem2R47H/R47H females n = 6, males n = 6. Data are represented as mean ± SEM and were analyzed by ordinary one‐way ANOVA followed by post-hoc Tukey's multiple comparisons test when ANOVA showed significant differences [IFN-γ: F(2, 33)=0.1762, p=0.8392 - IL-10: F(2, 33)=0.1781, p=0.8376 - IL-13: F(2, 33)=2.595, p=0.0898 - IL-1β: F(2, 33)=10.52, p=0.0003***; post-hoc Tukey's multiple comparisons test: w/w vs. RH/w, p=0.5921 (ns); w/w vs. RH/RH, p=0.0003***; RH/w vs. RH/RH, p=0.0051** - IL-4: F(2, 33)=1.763, p=0.1873 - IL-5: F(2, 33)=0.8137, p=0.4519 - IL-6: F(2, 33)=0.4640, p=0.6328 - KC-GRO: F(2, 33)=4.653, p=0.0166*; post-hoc Tukey's multiple comparisons test: w/w vs. RH/w, p=0.4516 (ns); w/w vs. RH/RH, p=0.0128*; RH/w vs. RH/RH, p=0.1808 (ns) - TNF-α: F(2, 33)=17.32, p<0.0001****; post-hoc Tukey's multiple comparisons test: w/w vs. RH/w, p=0.3272 (ns); w/w vs. RH/RH, p<0.0001****; RH/w vs. RH/RH, p=0.0005***].
-
Figure 2—source data 1
Related to Figure 2.
- https://cdn.elifesciences.org/articles/57513/elife-57513-fig2-data1-v2.xlsx
Figure 3
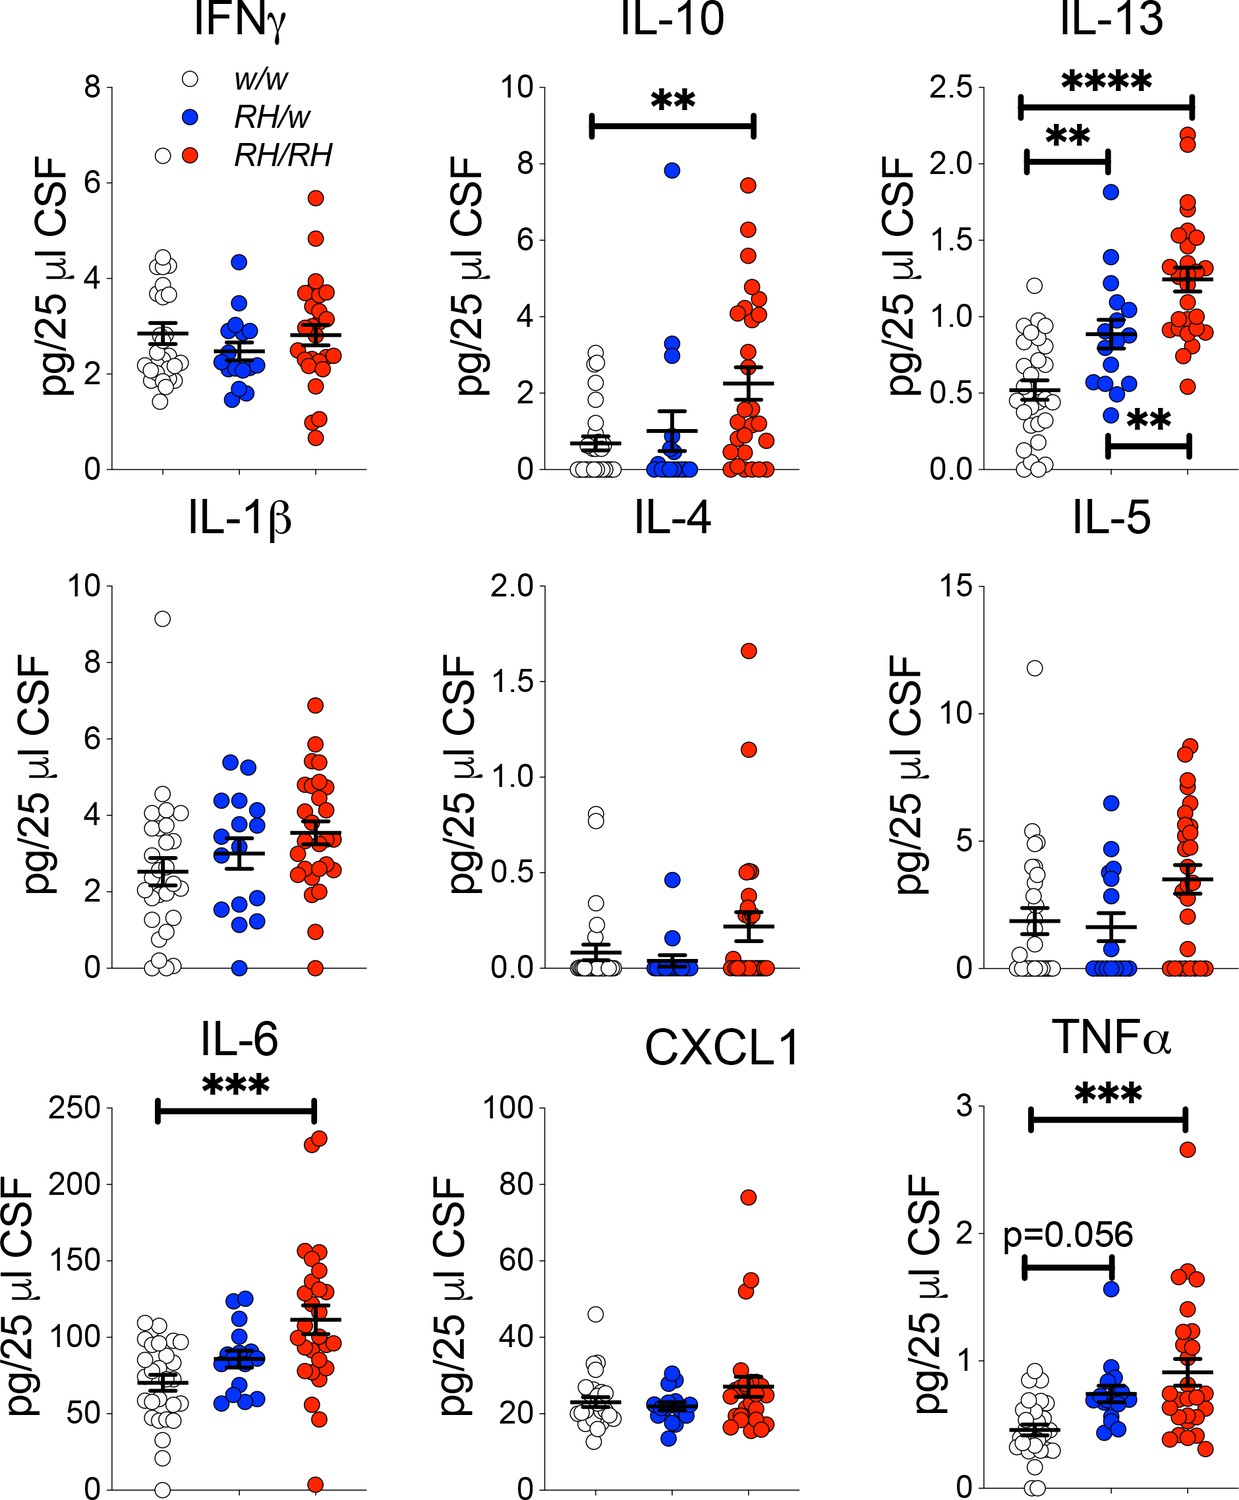
Levels of TNF-α and other pro-inflammatory cytokines are increased in the CSF of peri-adolescent Trem2R47H/R47H rats.
Measurement of cytokines present in the CSF of 6–8 weeks old rats shows that IL-1β, IL-6, IL-10, IL-13 and TNF-α are significantly increased in Trem2R47H/R47H rats; IFN-δ, IL-1β, IL-4, IL-5 and CXCL1 are not. The same samples used for the experiments shown in Figure 1 were used here. Data are represented as mean ± SEM and were analyzed by ordinary one‐way ANOVA followed by post-hoc Tukey's multiple comparisons test when ANOVA showed significant differences [IFN-γ: F(2, 68)=0.7008, p=0.4997- IL-10: F(2, 68)=5.651, p=0.0054**; post-hoc Tukey's multiple comparisons test: w/w vs. RH/w, p=0.8335 (ns); w/w vs. RH/RH, p=0.0051**; RH/w vs. RH/RH, p=0.0779 (ns) - ANOVA summary of IL-13: F(2, 68)=26.21, p<0.0001****; post-hoc Tukey's multiple comparisons test: w/w vs. RH/w, p=0.0066**; w/w vs. RH/RH, p<0.0001****; RH/w vs. RH/RH, p=0.0090** - IL-1β: F(2, 68)=2.473, p=0.0919 - IL-4: F(2, 68)=2.504, p=0.0893 - IL-5: F(2, 68)=3.489, p=0.0361*; post-hoc Tukey's multiple comparisons test: w/w vs. RH/w, p=0.9545 (ns); w/w vs. RH/RH, p=0.069 (ns); RH/w vs. RH/RH, p=0.0753 (ns) - IL-6: F(2, 68)=9.016, p=0.0003***; post-hoc Tukey's multiple comparisons test: w/w vs. RH/w, p=0.361 (ns); w/w vs. RH/RH, p=0.0002***; RH/w vs. RH/RH, p=0.0707 (ns) – CXCL1: F(2, 68)=1.847, p=0.1656 - TNF-α: F(2, 68)=9.720, p=0.0002***; post-hoc Tukey's multiple comparisons test: w/w vs. RH/w, p=0.0565 (ns); w/w vs. RH/RH, p=0.0001***; RH/w vs. RH/RH, p=0.3403 (ns)].
-
Figure 3—source data 1
Related to Figure 3.
- https://cdn.elifesciences.org/articles/57513/elife-57513-fig3-data1-v2.xlsx
Figure 4
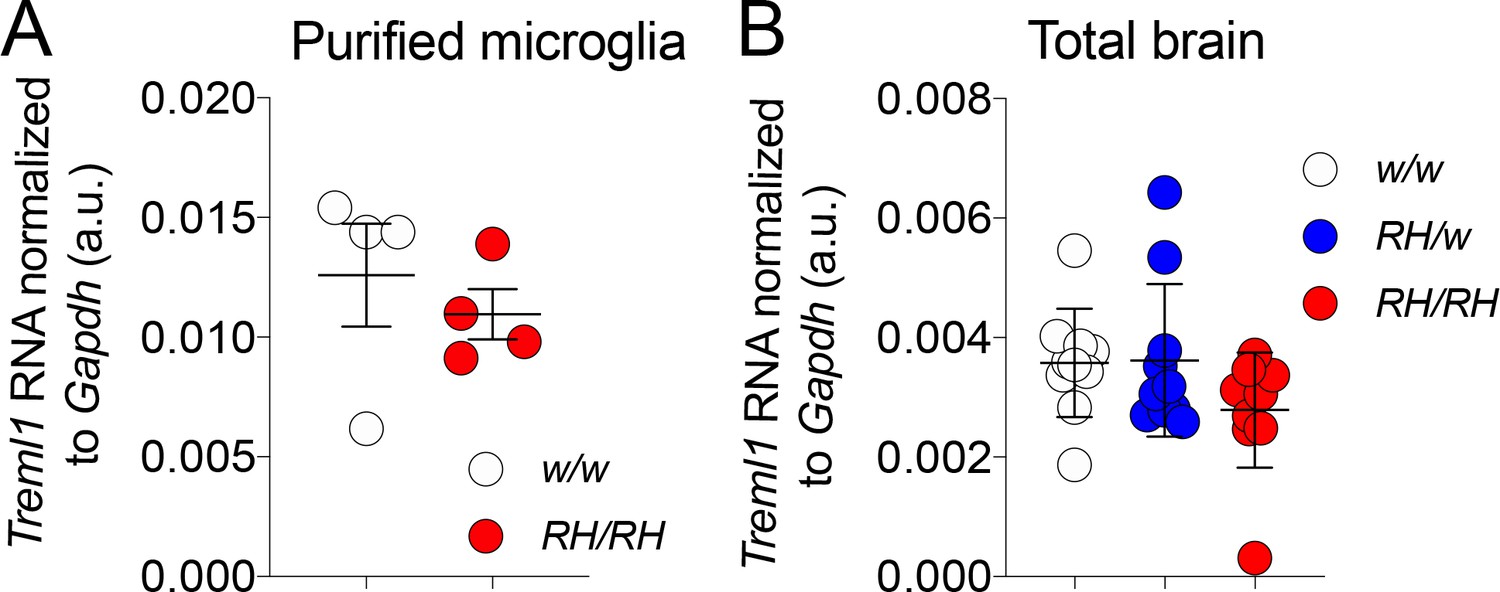
Treml1 mRNA expression is normal in Trem2R47H rats.
(A) Levels of Treml1 mRNA were measured and normalized to Gapdh mRNA expression. We used microglia purified from 2 male and 2 female 5/6 weeks old rats for each genotype (Trem2w/w and Trem2R47H/R47H). Data were analyzed by unpaired student’s t-test (p=0.5198), and presented as average (Treml1/Gapdh)± SEM. (B) Treml1 mRNA expression was measured in total brains. We used 5 female and 5 male (6–8 weeks of age) for each genotype (Trem2w/w, Trem2R47H/w and Trem2R47H/R47H). Data are represented as (Treml1/Gapdh) mean ± SEM and were analyzed by ordinary one‐way ANOVA (F(2, 27)=1.940, p=0.1632).
-
Figure 4—source data 1
Related to Figure 4A,B.
- https://cdn.elifesciences.org/articles/57513/elife-57513-fig4-data1-v2.xlsx
Figure 5
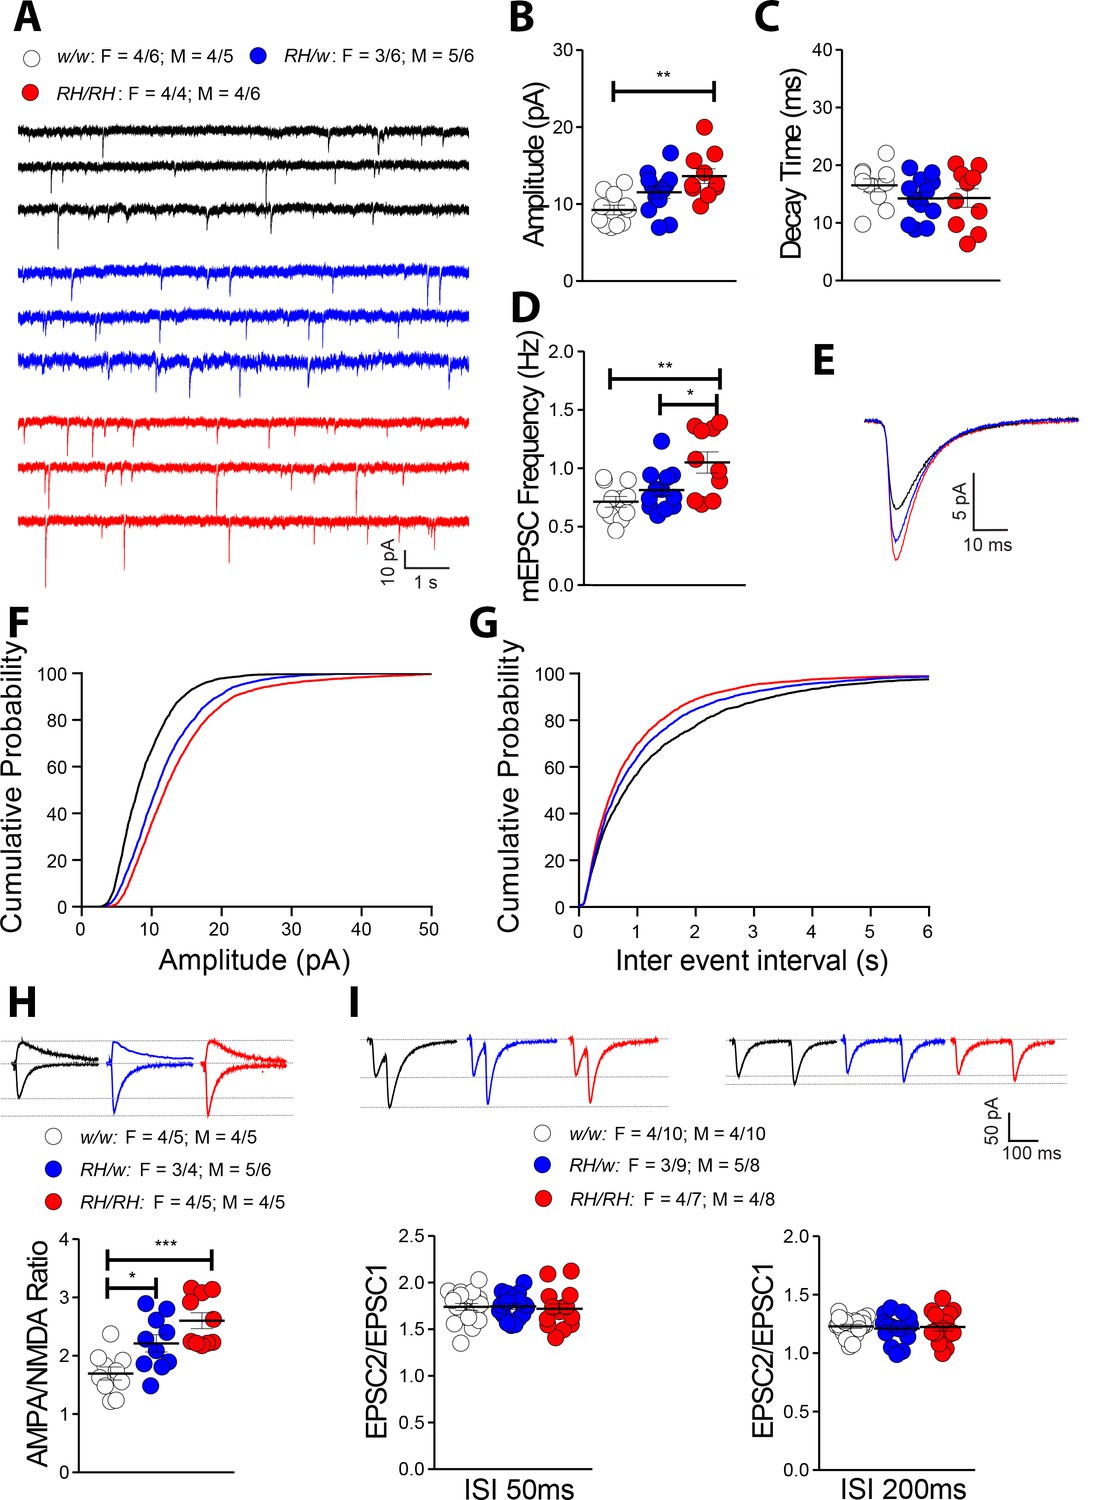
The Trem2R47H variant alters glutamatergic synaptic transmission in a gene dosage-dependent manner in young rats.
(A) Representative recording traces of mEPSC at SC–CA3 >CA1 pyramidal cell synapses. (B) The Trem2R47H variant causes a significant increase in mEPSC amplitude [F(2, 30)=7.371, p=0.0025**; post-hoc Tukey's multiple comparisons test: w/w vs. RH/w, p=0.1093 (ns); w/w vs. RH/RH, p=0.0017**; RH/w vs. RH/RH, p=0.1630 (ns)]. (C) In contrast, decay time of mEPSC was not changed [F(2, 30)=1.396, p=0.2632]. (D) Frequency of mEPSC was enhanced by the Trem2R47H variant [F(2, 30)=7.092, p=0.0030**; post-hoc Tukey's multiple comparisons test: w/w vs. RH/w, p=0.4881 (ns); w/w vs. RH/RH, p=0.0025**; RH/w vs. RH/RH, p=0.0345*]. (E) Average mEPSC of the three groups depicts differences in amplitude. As can also be noted in B, Trem2R47H/w rats show mEPSC with increased amplitude, albeit this increase did not reach statistical significance. Cumulative probability of AMPAR-mediated mEPSC amplitudes (F) and inter event intervals (G). (H) AMPA/NMDA ratio is significantly increased in both Trem2R47H/R47H and Trem2R47H/w rats in a gene dosage dependent manner [F(2, 27)=11.75, p=0.0002***; post-hoc Tukey's multiple comparisons test: w/w vs. RH/w, p=0.0265*; w/w vs. RH/RH, p=0.0001***; RH/w vs. RH/RH, p=0.1160 (ns)]. Representative traces are shown on of the graph (traces are averaged from 20 sweeps). (I) Average PPF at 50 ms (left panel) and 200 ms (right panel) Inter stimulus Interval (ISI) [PPF at 50 ms ISI: F(2, 49)=0.0949, p=0.9096; PPF at 200 ms ISI: F(2, 49)=0.1397, p=0.8700]. Representative traces are shown on top of the panels. Data are represented as mean ± SEM and were analyzed by ordinary one‐way ANOVA followed by post-hoc Tukey's multiple comparisons test when ANOVA showed significant differences. For each type of recordings, we indicate the number of animals by genotype and sex, plus the number of recording by genotype and sex as follow: 1) genotypes: w/w = Trem2 w/w, RH/w = Trem2 R47H/w, RH/RH = Trem2R47H/R47H;2) sex: R47H/R47H = female, M = males; 3) number of animals and number of recordings from animals: n/n’, were n = number of animals, n’=number of recordings from the n animals. For example, the w/w: F = 4/6; M = 4/5 in A indicates that data for mEPSC for the Trem2w/w rats were obtained from 4 females and 4 males, and that 6 recordings were obtained from the 4 females and 5 recordings from the 4 males.
-
Figure 5—source data 1
Related to Figure 5B,C,D,H,I.
- https://cdn.elifesciences.org/articles/57513/elife-57513-fig5-data1-v2.xlsx
Figure 6
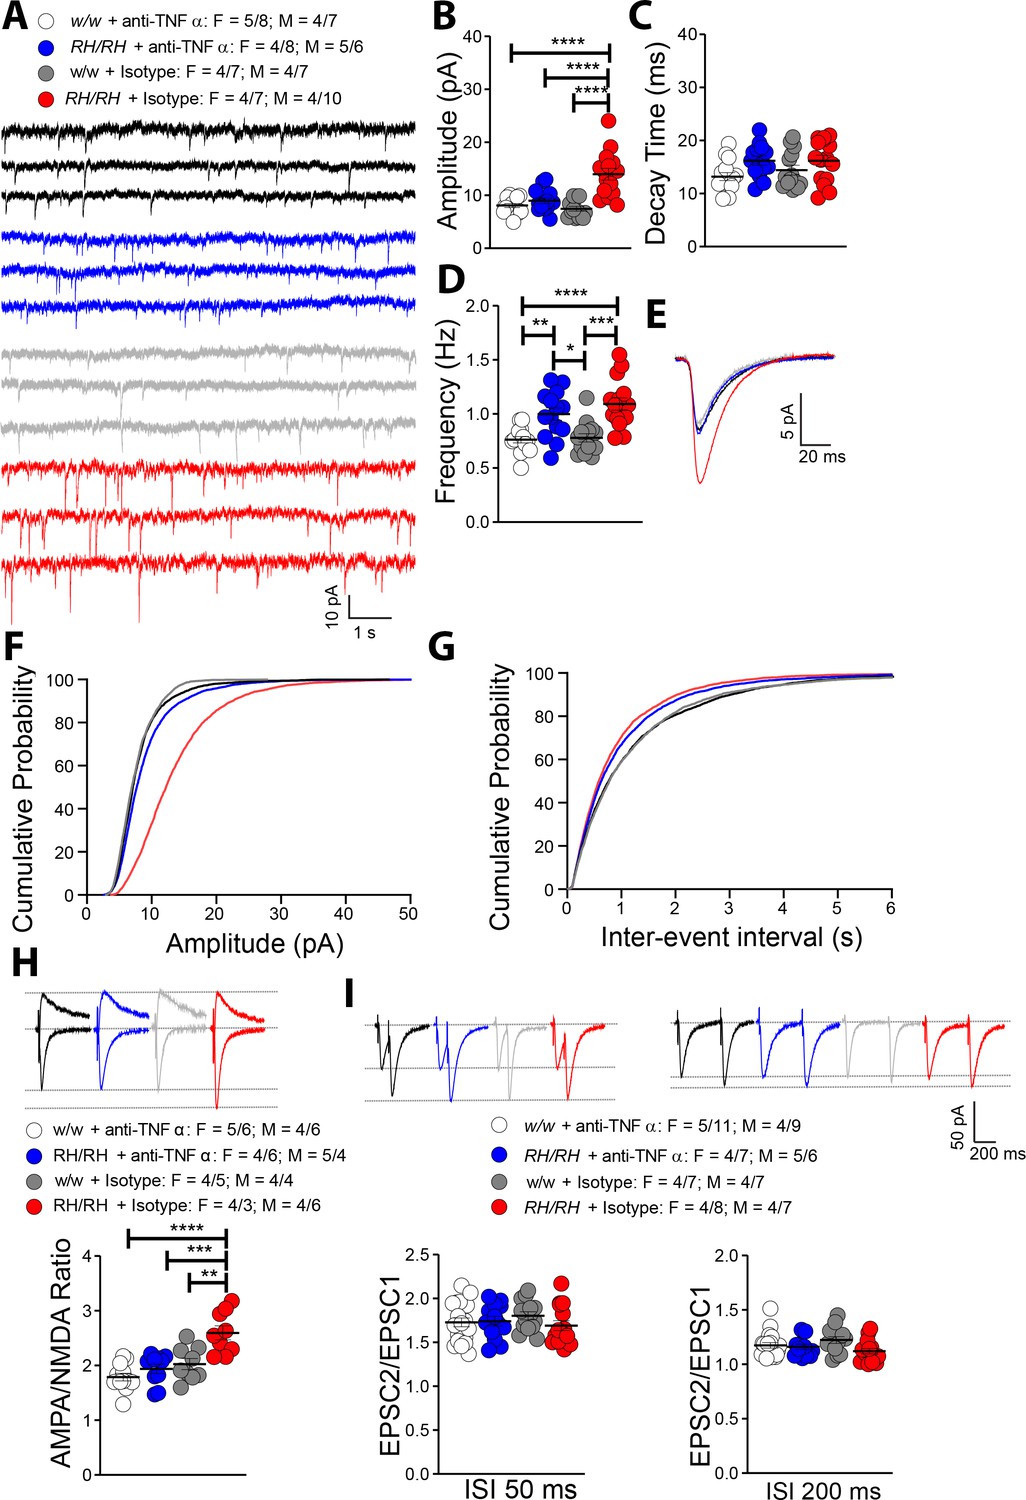
Rapid reduction of excess TNF-α activity normalizes amplitude of glutamatergic synaptic responses in young Trem2R47H/R47H rats.
(A) Representative mEPSC traces. (B) The increase in mEPSC amplitude caused by the Trem2R47H variant is occluded by anti-TNF-α application but not by the IgG isotype control [F(3, 54)=18.79, p<0.0001****; post-hoc Tukey's multiple comparisons test: w/w + anti-TNF-α vs. RH/RH + anti-TNF-α, p=0.7884 (ns); w/w + anti-TNF-α vs. RH/RH + Isotype, p<0.0001****; w/w + anti-TNF-α vs. w/w + Isotype, p=0.9252 (ns); RH/RH + anti-TNF-α vs. RH/RH + Isotype, p<0.0001****; RH/RH + anti-TNF-α vs. w/w + Isotype p=0.4299 (ns); RH/RH + Isotype vs. w/w + Isotype, p<0.0001****]. (C) Decay time of mEPSC was not changed by either genotype or treatments [F(3, 54)=2.716, p=0.0536]. (D) The increased frequency of mEPSC observed in Trem2R47H/R47H rats was not significantly affected by either anti-TNF-α or isotype control IgG [F(3, 54)=12.05, p<0.0001****; post-hoc Tukey's multiple comparisons test: w/w + anti-TNF-α vs. RH/RH + anti-TNF-α, p=0.0046**; w/w + anti-TNF-α vs. RH/RH + Isotype, p<0.0001****; w/w + anti-TNF-α vs. w/w + Isotype, p=0.9947 (ns); RH/RH + anti-TNF-α vs. RH/RH + Isotype, p=0.5147 (ns); RH/RH + anti-TNF-α vs. w/w + Isotype p=0.0109*; RH/RH + Isotype vs. w/w + Isotype, p<0.0001****]. (E) Average mEPSC of the four groups. Cumulative probability of AMPAR-mediated mEPSC amplitudes (F) and inter event intervals (G). (H) The increase of AMPA/NMDA ratio observed in Trem2R47H/R47H rats was reversed by anti-TNF-α but not IgG isotype control [F(3, 36)=13.50, p<0.0001****; post-hoc Tukey's multiple comparisons test: w/w + anti-TNF-α vs. RH/RH + anti-TNF-α, p=0.6507 (ns); w/w + anti-TNF-α vs. RH/RH + Isotype, p<0.0001****; w/w + anti-TNF-α vs. w/w + Isotype, p=0.2880 (ns); RH/RH + anti-TNF-α vs. RH/RH + Isotype, p=0.0002***; RH/RH + anti-TNF-α vs. w/w + Isotype p=0.9171 (ns); RH/RH + Isotype vs. w/w + Isotype, p<0.0015**]. Representative traces are shown above the graph (traces are averaged from 20 sweeps). (I) Neither genotype nor treatment changed average PPF at 50 ms (left panel) and 200 ms (right panel) ISI [PPF at 50 ms ISI: F(3, 58)=0.7420, p=0.5313; PPF at 200 ms ISI: F(3, 58)=2.356, p=0.0812]. Representative traces are shown above the panels. Data are represented as mean ± SEM and were analyzed by ordinary one‐way ANOVA followed by post-hoc Tukey's multiple comparisons test when ANOVA showed significant differences. Number of animals and of recordings are shown as explained in Figure 5.
-
Figure 6—source data 1
Related to Figure 6B,C,D,H,I.
- https://cdn.elifesciences.org/articles/57513/elife-57513-fig6-data1-v2.xlsx
Figure 7
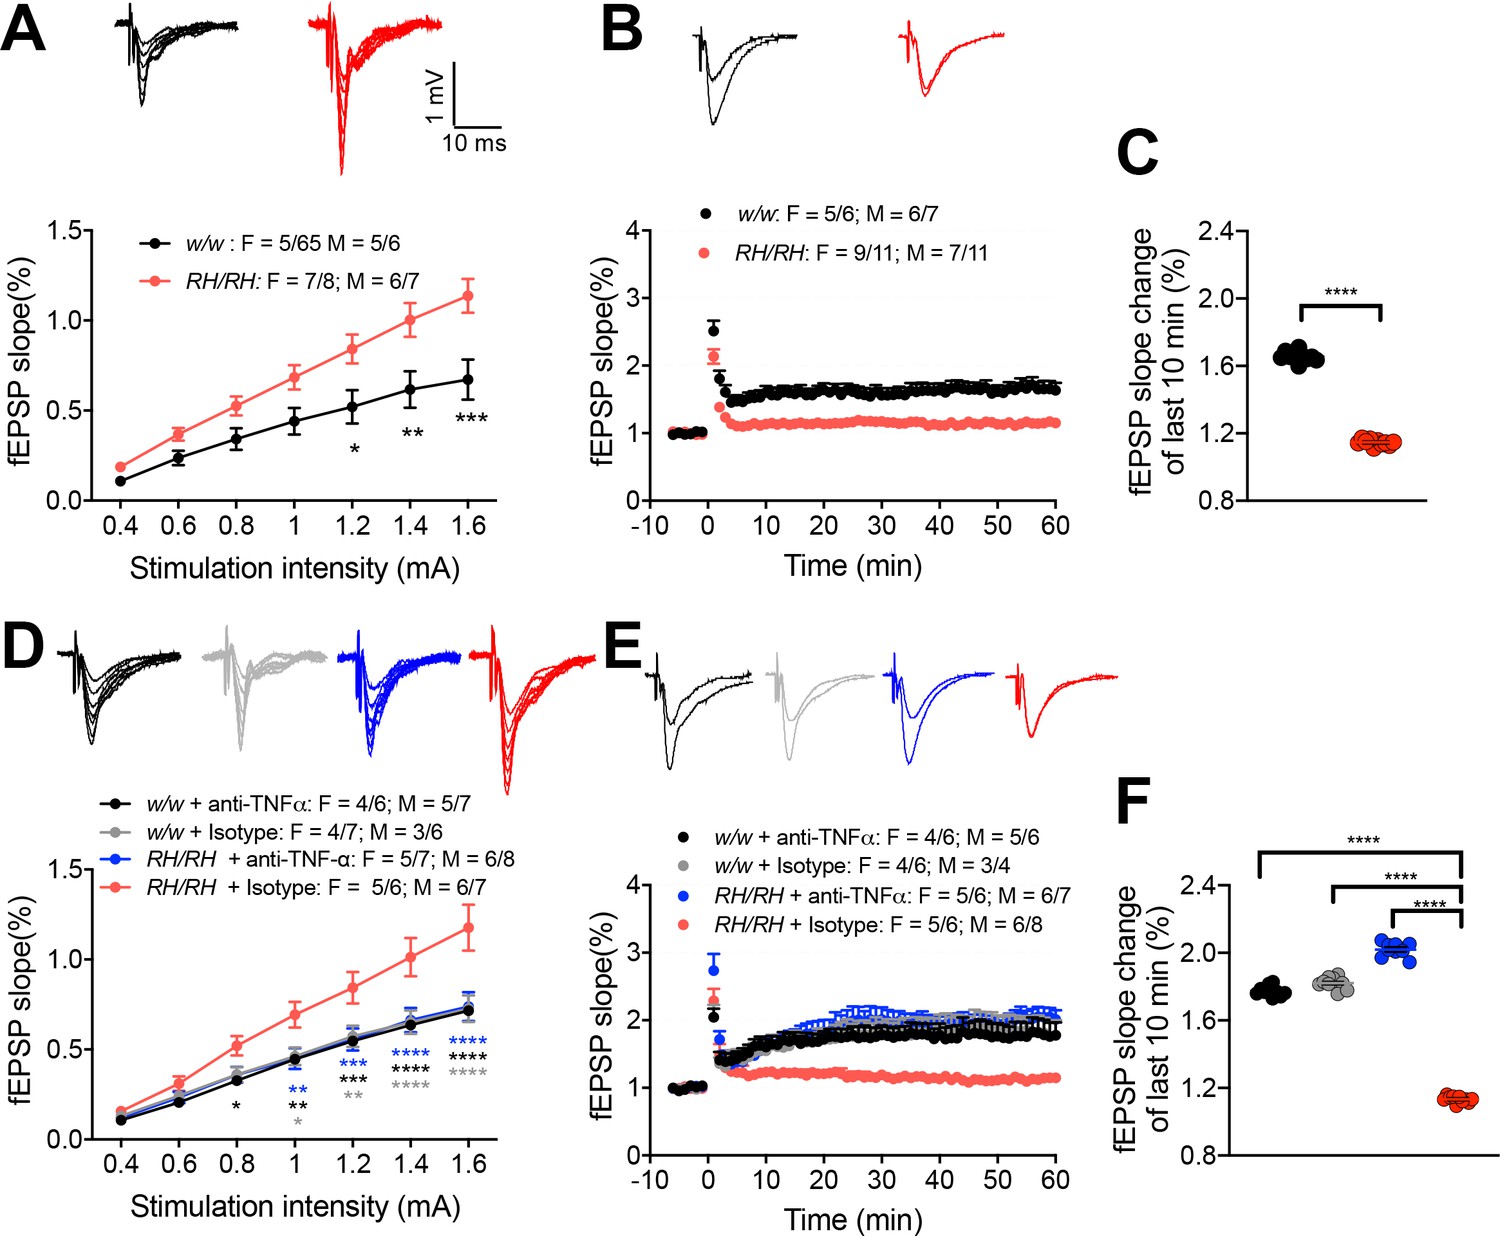
LTP is impaired in RH mutant rats, and the impairment could be rescued by application of anti-TNF-α antibody.
(A) The input-output slope is significantly increased in Trem2R47H/R47H rats [two-way ANOVA, stimulation intensity x genotype interaction F(6, 144)=6.745, p<0.0001****; post-hoc Sidak's multiple comparisons test: 1.2 mV p=0.0175*; 1.4 mV: p=0.0021**; 1.6 mV: p=0.0001***] Representative traces of fEPSPs in response to increasing stimulus from 0.4 to 1.6 mA are shown on the top. (B) LTP is impaired in Trem2R47H/R47H rats. Average traces of the baseline and the last 5mins of LTP are shown on top. (C) Plot of fEPSP slope change of the last 10 min of LTP in B (unpaired t test, p<0.0001****). (D) The increase of input-out slope in Trem2R47H/R47H rats is reversed by application of anti-TNF-α [ANOVA for repeated measures F(18, 300)=6.579, p<0.0001****; post-hoc Tukey's multiple comparisons test: 0.8 mV RH/RH + Isotype vs. w/w + anti-TNF-α p=0.0479*; 1.0 mV RH/RH + Isotype vs. RH/RH + anti-TNF-α p=0.0061**, RH/RH + Isotype vs. w/w + anti-TNFα p=0.0072**, RH/RH + Isotype vs. w/w + Isotype p=0.0113*; 1.2 mV RH/RH + Isotype vs. RH/RH + anti-TNFα p=0.0009***, RH/RH + Isotype vs. w/w + anti-TNF-α p=0.0009***, RH/RH + Isotype vs. w/w + Isotype p=0.0029**; 1.4 mV RH/RH + Isotype vs. RH/RH + anti-TNF-α p<0.0001****, RH/RH + Isotype vs. w/w + anti-TNF-α p<0.0001****, RH/RH + Isotype vs. w/w + Isotype p=P < 0.0001****; 1.6 mV RH/RH + Isotype vs. RH/RH + anti-TNF-α p<0.0001****, RH/RH + Isotype vs. w/w + anti-TNF-α P p<0.0001****, RH/RH + Isotype vs. w/w + Isotype p<0.0001****]. Representative fEPSP traces are shown on top. (E) The impaired LTP is restored by application of anti-TNF-α antibody. The average traces of the baseline and the last 5mins of LTP are shown on top. (F) Plot of fEPSP slope change of the last 10 min of LTP in E [one-way ANOVA, F(3, 36)=1490, p<0.0001; post-hoc Tukey's multiple comparisons test: RH/RH + Isotype vs. RH/RH + anti-TNF-α p<0.0001****, RH/RH + Isotype vs. w/w + anti-TNF-α P p<0.0001****, RH/RH + Isotype vs. w/w + Isotype p<0.0001****].
-
Figure 7—source data 1
Related to Figure 7A,C,D,F.
- https://cdn.elifesciences.org/articles/57513/elife-57513-fig7-data1-v2.xlsx
Tables
Key resources table
| Reagent type (species) or resource | Designation | Source or reference | Identifiers | Additional information |
|---|---|---|---|---|
| Genetic reagent (Rattus Norvegicus) | Apph | Tambini et al., 2019. Aging Cell 18: e13033 | Rat App allele with humanize Aβ region | |
| Genetic reagent (Rattus Norvegicus) | Trem2R47H | Tambini and D'Adamio, 2020 Sci Rep 10: 4122 | Rat Trem2 allele with R47H mutation | |
| Commercial assay or kit | V-PLEX Plus Aβ Peptide Panel 1 | Meso Scale Discovery | Cat# K15200G | Used following manufacturer’s recommendations |
| Commercial assay or kit | V-PLEX Proinflammatory Panel 2 | Meso Scale Discovery | Cat# K15059D | Used following manufacturer’s recommendations |
| Commercial assay or kit | CD11b/c (Microglia) Micro-Beads, rat antibody Cat# 130-105-634 | Miltenyi Biotec | RRID:AB_2783886 | Used following manufacturer’s recommendations |
| Commercial assay or kit | Adult Brain Dissociation Kit | Miltenyi Biotec | Cat# 130-107-677 | Used following manufacturer’s recommendations |
| Commercial assay or kit | RNeasy RNA Isolation kit | Qiagen | Cat# 74106 | Used following manufacturer’s recommendations |
| Commercial assay or kit | High-Capacity cDNA RT kit | Thermo | Cat# 4368814) | Used following manufacturer’s recommendations |
| Commercial assay or kit | TaqMan Fast Advanced Mix | Thermo | Cat# 4444556 | Used following manufacturer’s recommendations |
| Commercial assay or kit | Gapdh Real-Time PCR | Thermo | Rn01775763_g1 | Used following manufacturer’s recommendations |
| Commercial assay or kit | Treml1 Real-Time PCR | Thermo | Rn01511908_g1 | Used following manufacturer’s recommendations |
| Antibody | Polyclonal Goat IgG anti-Rat TNFα Cat# AF-510-NA | R and D Systems | RRID:AB_354511 | 10 ng/ml in ACSF |
| Antibody | Polyclonal Goat IgG. antibody Cat# AB-108-C | R and D Systems | RRID:AB_354267 | 10 ng/ml in ACSF |
| Software, algorithm | LinRegPCR software | hartfaalcentrum.nl | ||
| Software, algorithm | pCLAMP10 software | Molecular Devices, | ||
| Software, algorithm | Image Lab software | Biorad | RRID:SCR_014210 | |
| Software, algorithm | GraphPad Prism | RRID:SCR_002798 |
Additional files
Download links
A two-part list of links to download the article, or parts of the article, in various formats.
Downloads (link to download the article as PDF)
Open citations (links to open the citations from this article in various online reference manager services)
Cite this article (links to download the citations from this article in formats compatible with various reference manager tools)
Microglia TREM2R47H Alzheimer-linked variant enhances excitatory transmission and reduces LTP via increased TNF-α levels
eLife 9:e57513.
https://doi.org/10.7554/eLife.57513


