Evolutionarily distant I domains can functionally replace the essential ligand-binding domain of Plasmodium TRAP
- Integrative Parasitology, Center for Infectious Diseases, Heidelberg University Medical School, Germany
- Université de Strasbourg, CNRS UPR9022, INSERM U963, Institut de Biologie Moléculaire et Cellulaire, France
- Department of Molecular Virology, Heidelberg University Medical School, Germany
- Experimental Parasitology, Faculty of Veterinary Medicine, Ludwig-Maximilians-Universität München, Germany
- Program in Cellular and Molecular Medicine, Children's Hospital Boston, and Departments of Biological Chemistry and Molecular Pharmacology and of Medicine, Harvard Medical School, United States
Figures
Figure 1
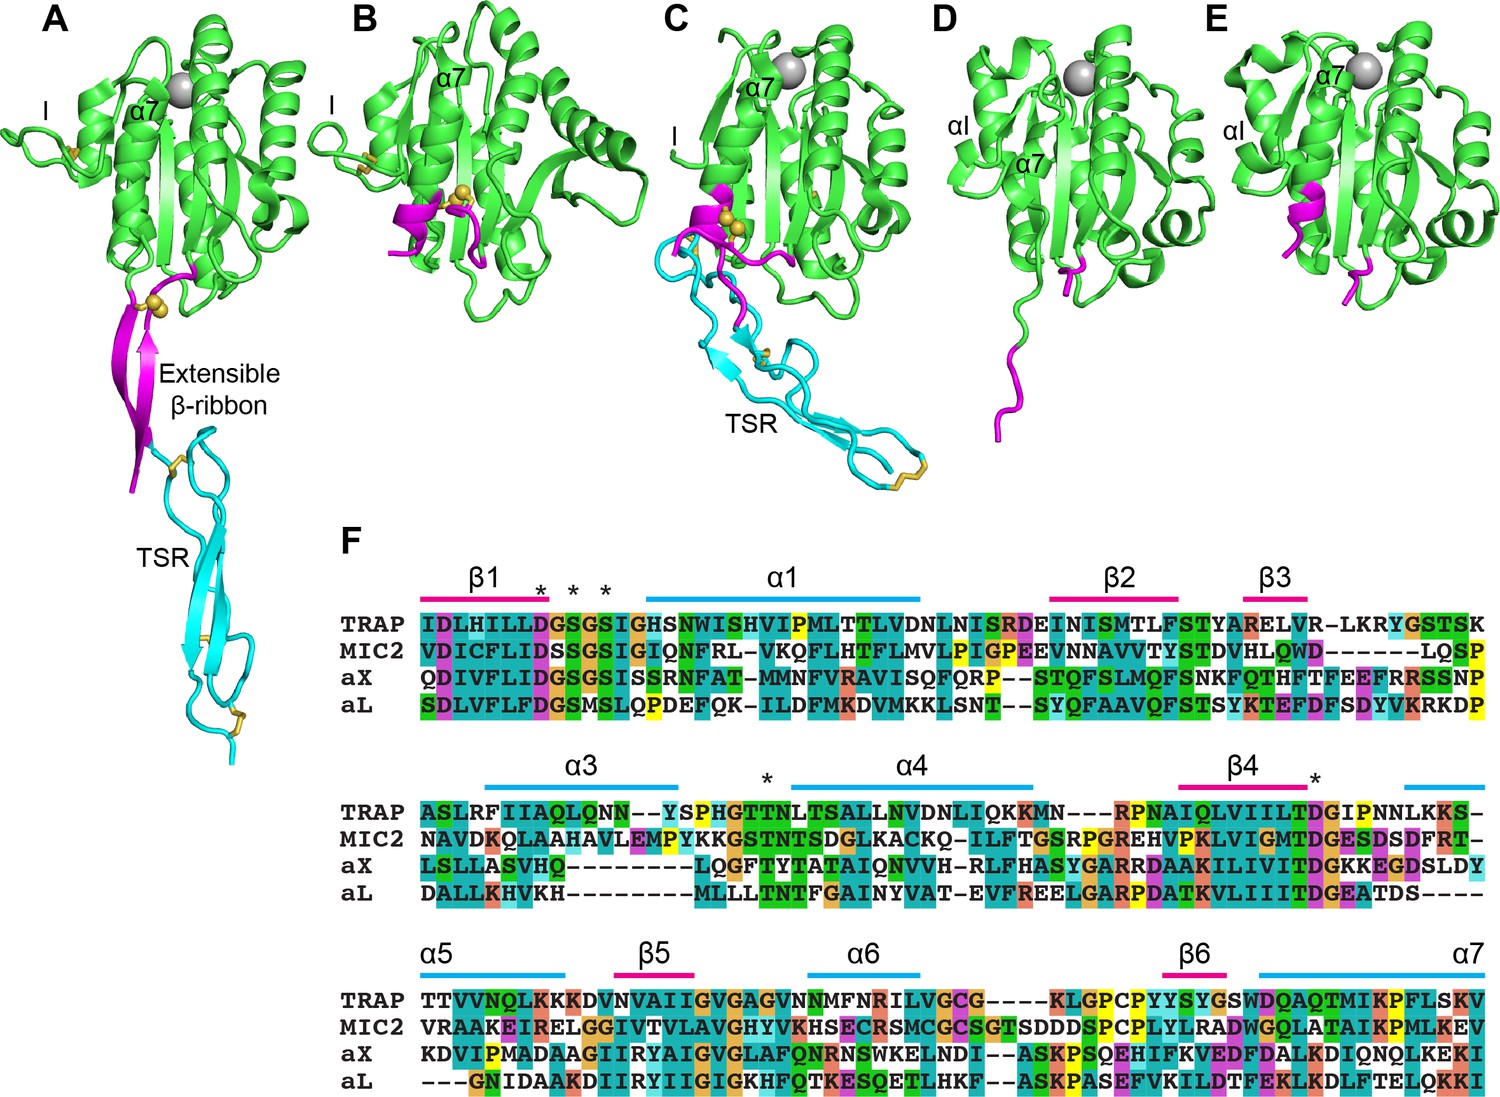
Structural features of TRAP, MIC2, and integrin αI domains.
(A–E) Cartoon ribbon diagrams. (A), open TRAP (Protein Databank ID (PDB)) 4HQL; (B), closed TRAP, PDB 4HQF; (C), closed MIC2, PDB 4OKR chain B; (D), open αX αI domain, PDB 4NEH; (E), closed αX αI domain, PDB 5ES4. Green: the portion of the I domains exchanged between TRAP and other I domains; cyan: the TSR domain; magenta: the portion in between the I domain and TSR in TRAP and MIC2 which includes the extensible β-ribbon. The comparable regions in integrin αI domains are also colored magenta and emphasize how the α7-helix reshapes similarly to that of apicomplexan I domains. The TSR domain of closed TRAP (B) is not shown because it was disordered in crystals; it likely is positioned similarly in the closed conformation as the TSR domain of closed MIC2 (C). The MIDAS Mg2+ ion is shown as a silver sphere and is present in all I domains. It is not shown in closed TRAP (B) because a lattice contact disrupted the conformation around the MIDAS. Disulfide bonds are shown as yellow sticks; for emphasis, the cysteine sulfur atoms of the extensible I domains are shown in identical orientations after superimposition. (F) The portions of the four I domains that were exchanged were aligned by sequence and structure (Song et al., 2012; Song and Springer, 2014). Secondary structure elements are labeled and MIDAS residues are asterisked above the alignment.
Figure 2 with 3 supplements
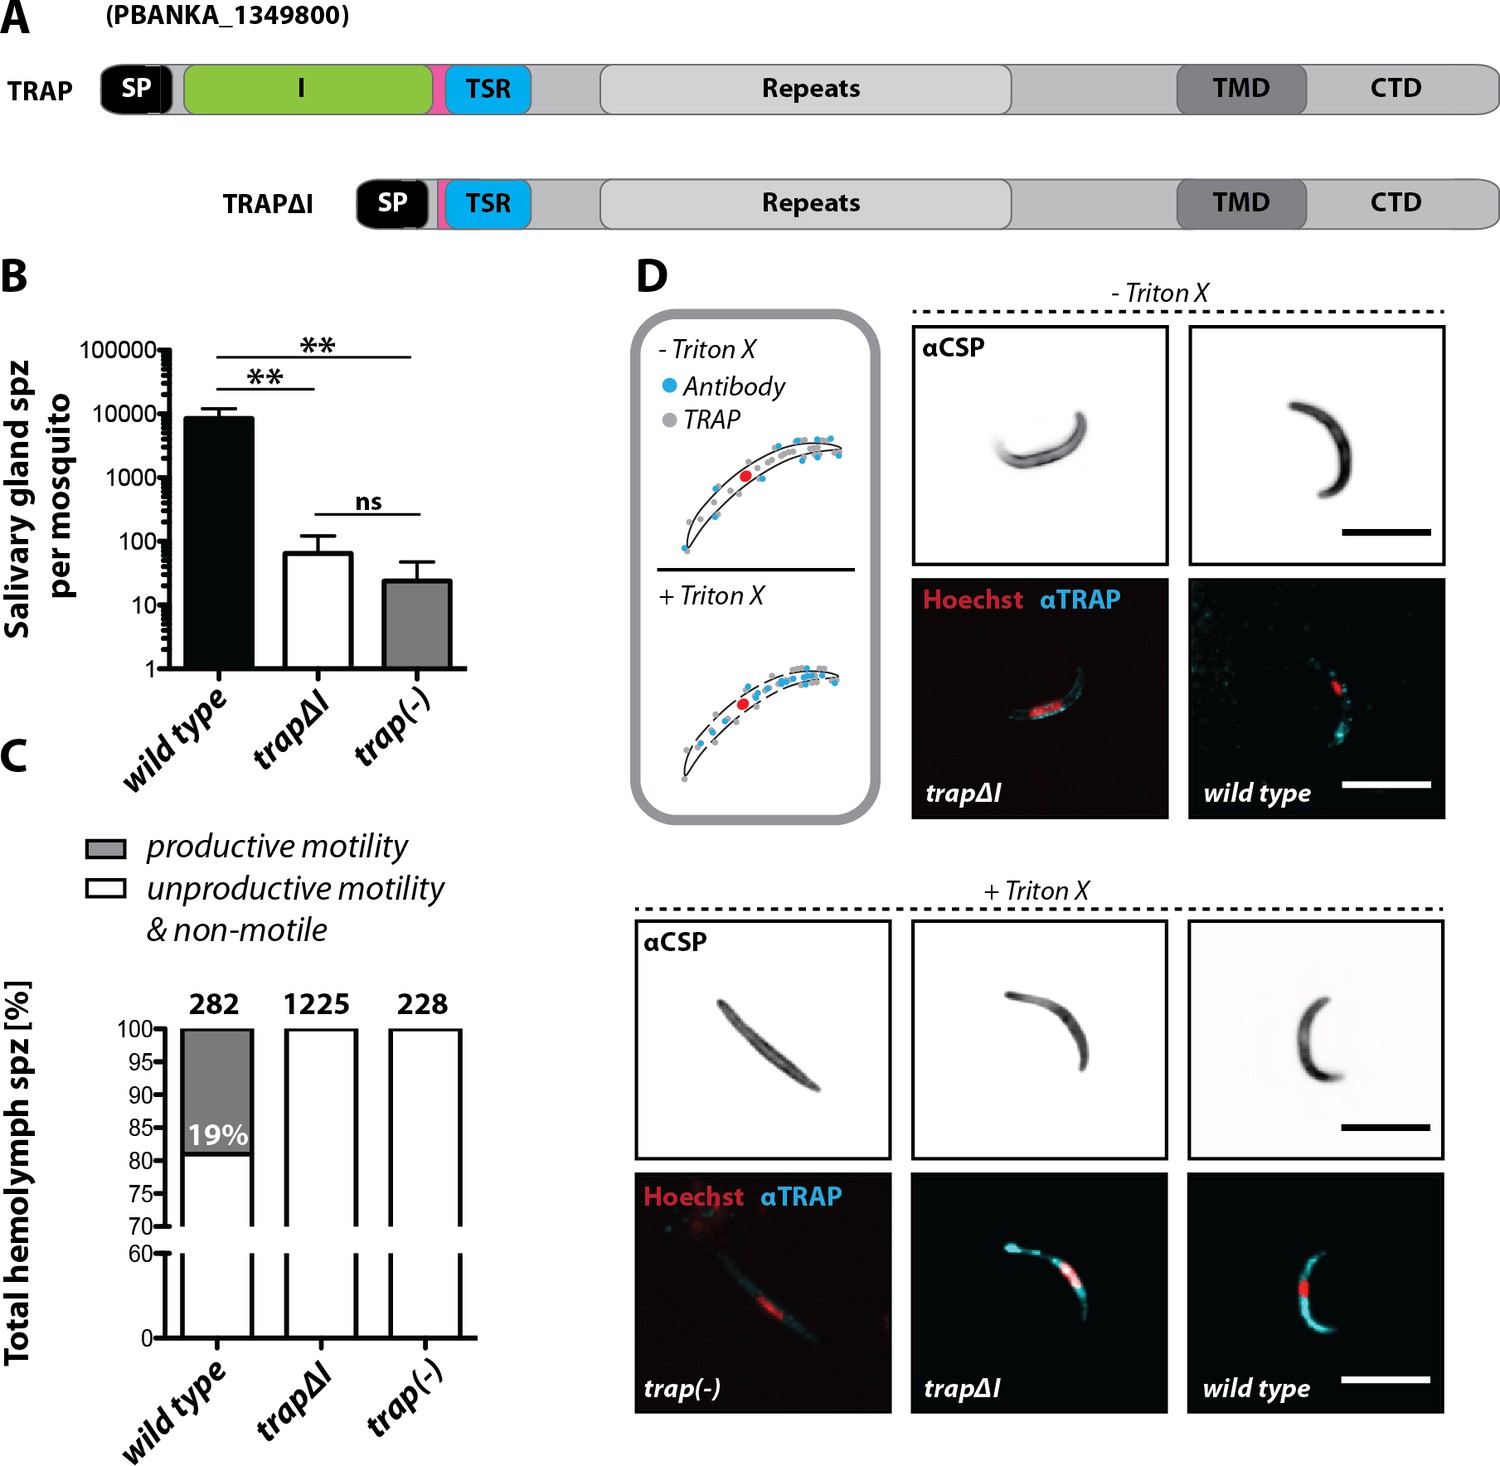
The I domain of TRAP is essential for salivary gland invasion and gliding motility of sporozoites.
(A) Domain architecture of full-length TRAP and the mutant TRAP∆I lacking the I domain denoting signal peptide (SP), I domain (I, green), thrombospondin type-I repeat (TSR, blue), repeats, transmembrane domain (TMD) and cytoplasmic tail domain (CTD). (B) Sporozoite numbers in the salivary glands of mosquitoes infected with trap∆I, trap(-) and wild type (wt) 14–22 days post infection. Shown is the mean ± SEM of at least seven counts of three different feeding experiments. ***p<0.0001 one-way-ANOVA (Kruskal-Wallis-test). (C) Motility of hemolymph sporozoites isolated 13–16 days post infection. Sporozoites moving in at least one full circle within five minutes were considered to be productively moving while all sporozoites that behaved differently were classified as unproductively moving/non motile. The number of analyzed sporozoites is indicated above each bar. (D) Immunofluorescence images of permeabilized and unpermeabilized trap∆I, wild type and trap(-) midgut sporozoites using αTRAP-repeat and anti CSP antibodies as well as Hoechst to stain DNA. Note that intracellular TRAP is stained after permeabilization as indicated in the schematic (grey box). Scale bars: 10 µm.
Figure 2—figure supplement 1
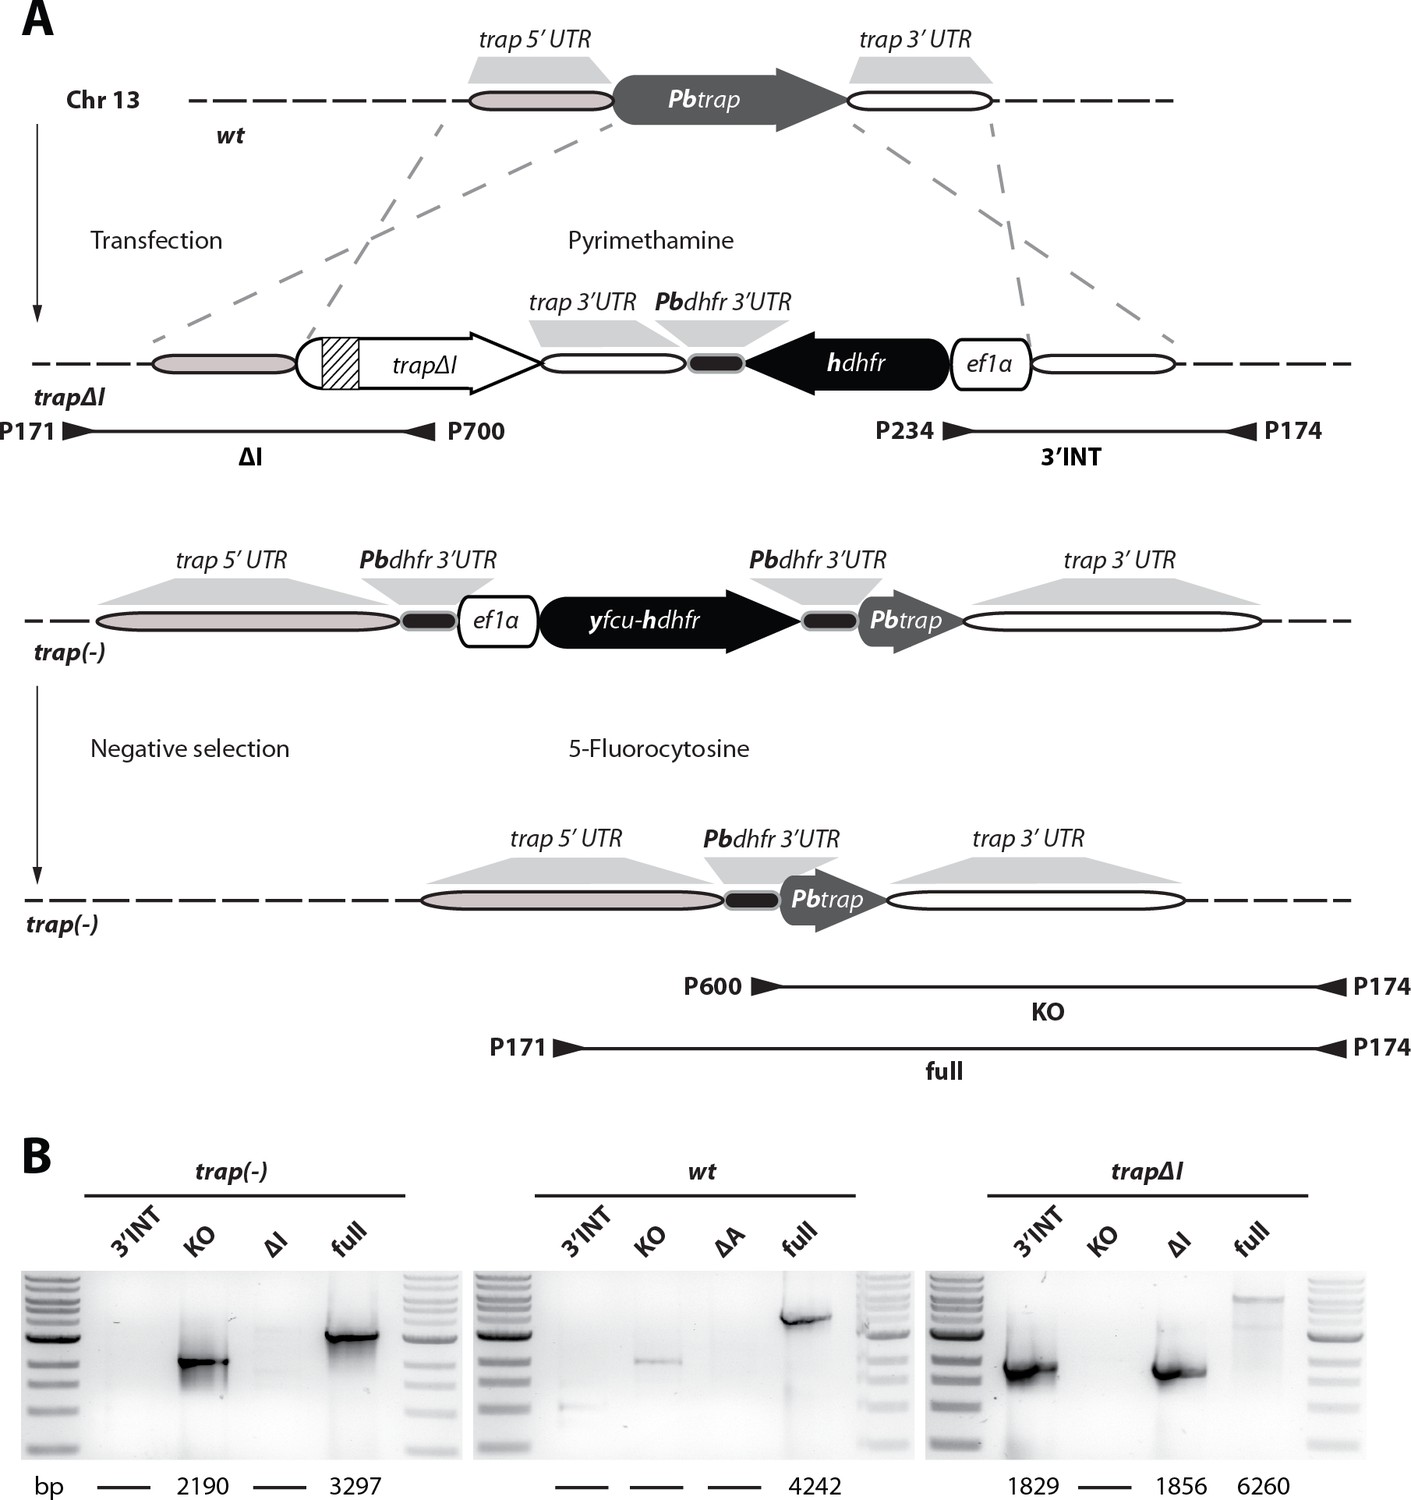
Generation of trap∆I and trap(-) parasites.
(A) Strategy to generate parasites that lack the I domain of TRAP (trap∆I) (top) and a trap(-) (bottom) line without resistance marker by double crossover homologous recombination. For the generation of trap∆I parasites the trap locus in wild type (wt) parasites was replaced with a gene copy that lacks the I domain and a positive resistance marker (hdhfr) driven by the ef1α promoter. Note that the inserted copy was codon modified for E. coli K12 (the codon modified gene copy is indicated in white while the wild type allele is shown in grey) to avoid unwanted crossover events with the C-terminus of the trap open reading frame (ORF). The deleted sequence encoding the I domain is indicated by stripes. The TRAP knockout was generated with a Plasmogem vector (see Materials and methods) by replacing the trap locus with a selection cassette that enables positive and negative selection. The resulting trap(-) parasites were treated with 5-fluorocytosine to select for parasites that lost the resistance cassette. Primer and predicted length of PCR products are indicated by arrowheads and black lines below the scheme. (B) PCR analysis of isogenic populations of trap∆I, trap(-) in comparison to wild type (wt). Sizes of PCR products are indicated below the images.
Figure 2—figure supplement 2
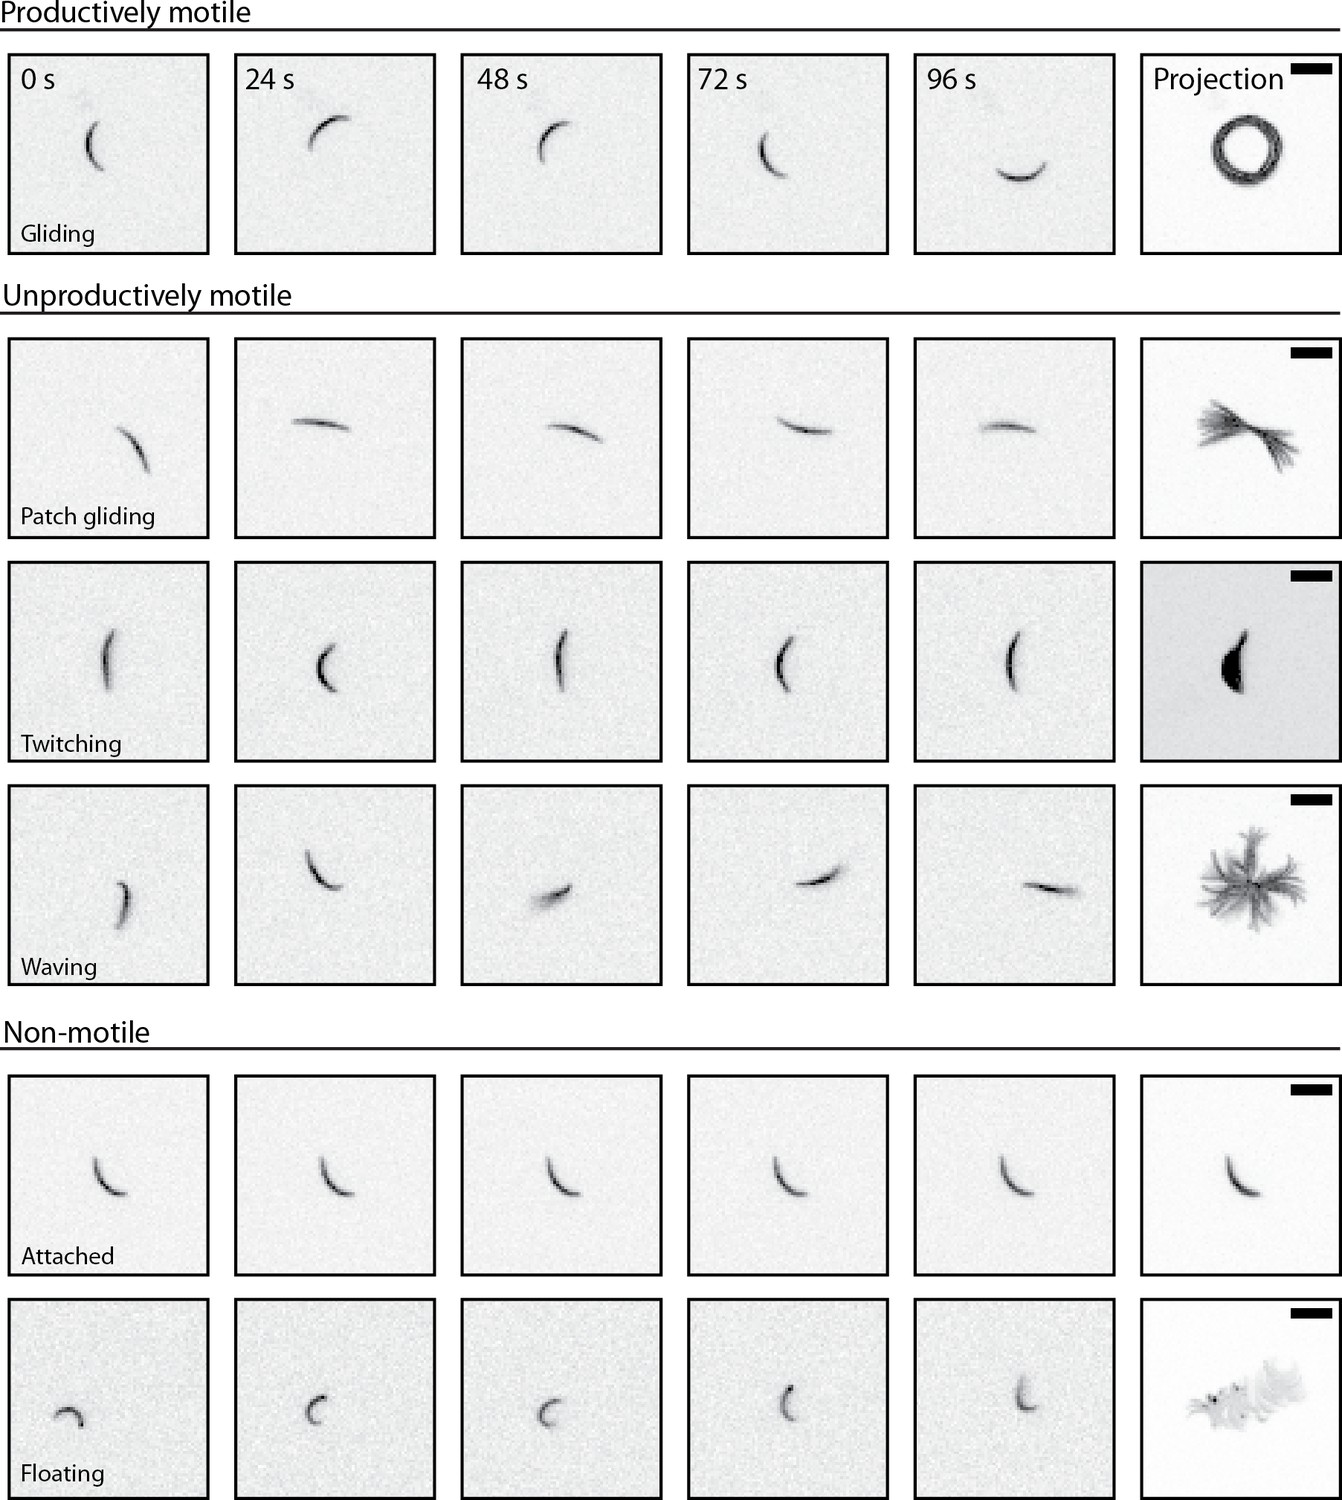
Movement patterns exhibited by sporozoites.
Sporozoites placed on solid substrates can exhibit different types of movement. Gliding, sporozoites migrate continuously in circles. Patch gliding sporozoites move back and forth over a single adhesion site. Twitching sporozoites are attached to the surface and bend back and forth continuously. Waving sporozoites are attached on one end and turn their body around this adhesion. Attached sporozoites stay fixed on the substrate. Floating sporozoites are not attached and drift with the flow of the medium. Gliding results in directed forward movement and was classified as productive motility. Other types of movements (patch gliding, twitching, and waving) lead to persistence of sporozoites at a single site and were classified as unproductive motility. Attached and floating sporozoites were classified as non-motile. Scale bars: 10 µm.
Figure 2—figure supplement 3
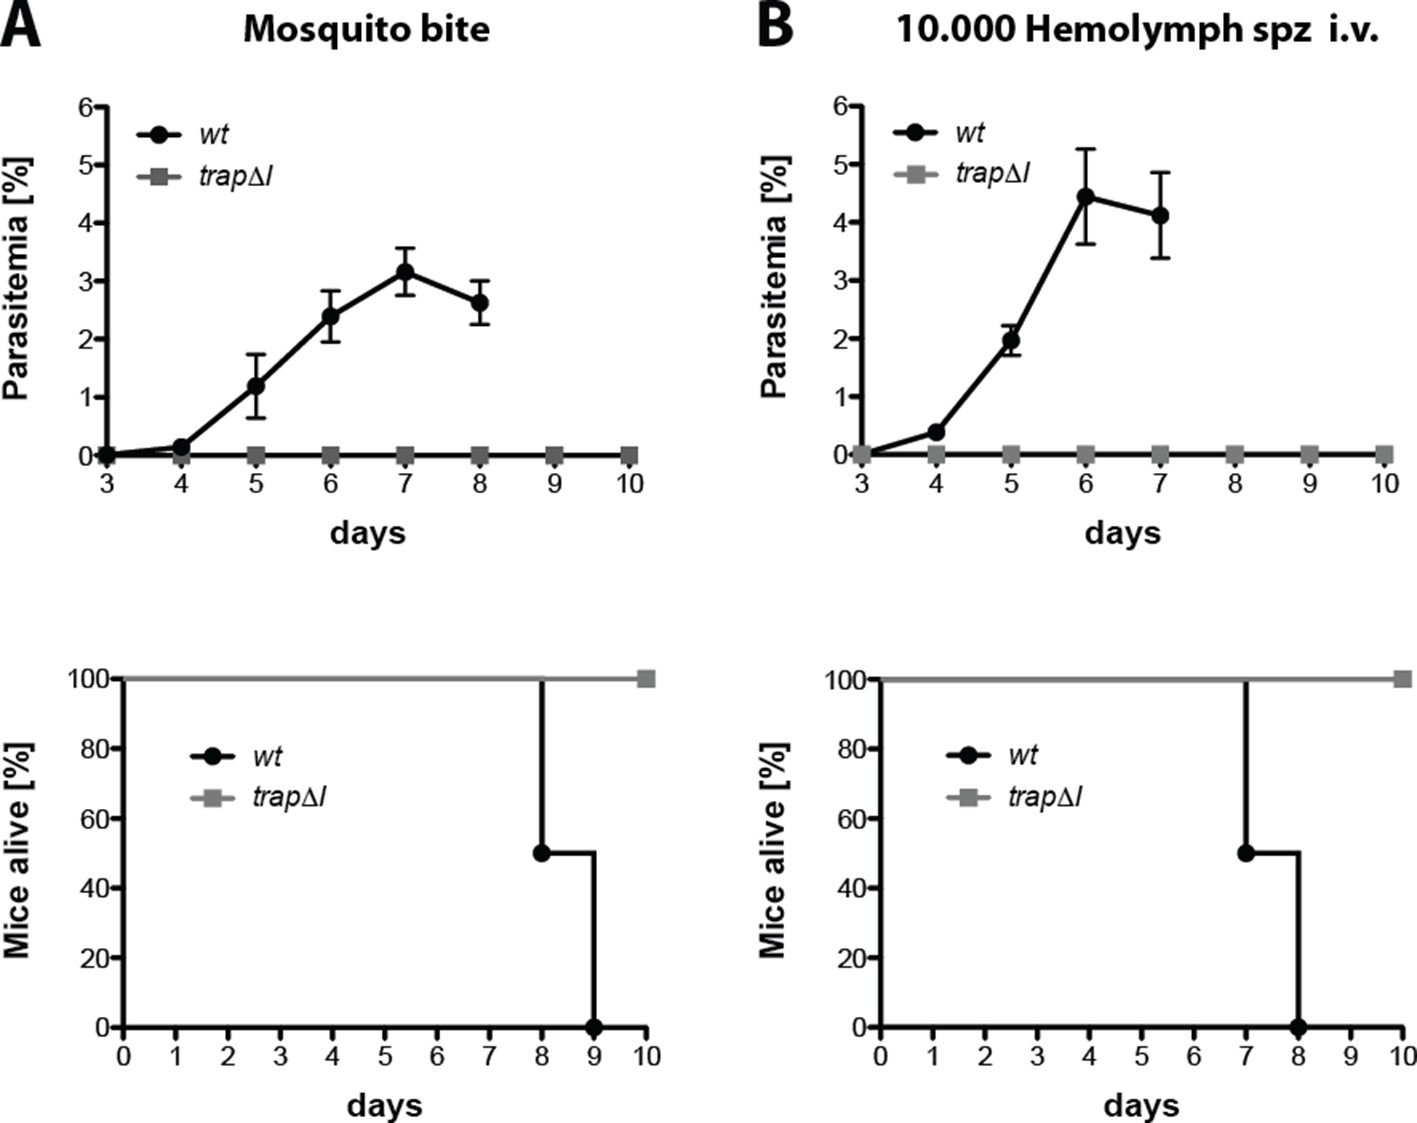
trap∆I sporozoites are not infective to mice.
Mice were either exposed to 10 infected mosquitoes (A) or injected intravenously with 10,000 hemolymph sporozoites (B) of trap∆I or wild type (wt). Parasite growth and survival of infected mice was monitored for 10 days post infection. Survival graphs correspond to the growth curve shown above. Shown is the mean parasitemia ± SEM of four mice for each parasite line from a representative experiment.
Figure 3 with 4 supplements

Sporozoites expressing TRAP with I domains from T. gondii or humans invade salivary glands at different levels.
(A) Domain architecture of full-length TRAP (see Figure 2A legend) indicating the exchanged I domain. (B) Immunofluorescence assay (IFA) using antibodies against TRAP and CSP on non-fluorescent permeabilized TRAP-I, MIC2-I, aX-I and aL-I midgut sporozoites. Scale bars: 10 µm. (C) Western blot probing TRAP from control (TRAP-I), trap(-), trapΔI, aX-I and aL-I hemolymph sporozoites. Anti-CSP antibodies were used as loading control. The asterisks mark an unspecific band observed in lysates of hemolymph sporozoites but not in lysates of salivary gland sporozoites (see panel E for TRAP-I). Repeated PCR of genomic DNA from the parasite lines also suggested that this band is not due to a TRAP fragment. (D) IFA using anti-TRAP antibodies on non-fluorescent TRAP-I and MIC2-I salivary gland sporozoites. Scale bars: 10 µm. (E) Western blot probing TRAP and CSP of TRAP-I and MIC2-I salivary gland sporozoites. (F, G) Quantification of salivary gland sporozoites of fluorescent (fluo) (F) and non-fluorescent (non-fluo) (G) I domain mutants 17–24 days post infection. The pictogram below each graph indicates the genotype of the tested parasite lines. Shown is the mean ± SEM of at least three (F) or two (G) countings from three (F) and one (G) independent feeding experiments. **p<0.05 one-way-ANOVA (Kruskal-Wallis-test). Note that mosquitoes infected with non-fluo lines were not preselected for fluorescent parasites before dissection potentially yielding smaller numbers. No significance test for (G) as data derived from one experiment. (H) Salivary gland colonization by sporozoites expressing the different I domains shown above each image. The fluorescence of mCherry expressing sporozoites is coded for intensity. The small image inset depicts the respective salivary gland in differential interference contrast (DIC). Scale bar: 200 µm. Invasion of the salivary glands by αX-I sporozoites is also shown in Video 1.
Figure 3—figure supplement 1

Generation of P. berghei strains expressing TRAP with different I domains.
(A) Cartoon illustrating the generation of transgenic parasites expressing trap genes with exchanged I domains in fluo and trap(-) parasites. Transgenic parasites were generated by double crossover homologous recombination replacing the endogenous trap gene (fluo line) or complementing the trap locus in trap(-) parasites: TRAP-I, expressing the wild type allele of TRAP from a codon-modified gene and thus serving as a control line; MIC2-I, chimeric TRAP expressing the I domain of micronemal protein 2 (MIC2) from Toxoplasma gondii; αX-I, chimera expressing the I domain of the human integrin αX; αL-I, chimera expressing the I domain of the human integrin αL; RevCharge, containing seven mutations that shift the surface charge of the TRAP I domain from a pI of 9.7 to 6.8 (see Figure 6A). The trap coding sequence in all generated lines was codon modified for E. coli K12 to avoid unwanted crossover events and to distinguish chimeras from wild type (wt). Binding sites and numbers of primers used for genotyping as well as the length of amplified PCR products are indicated with arrowheads and black lines below the scheme. Note that the illustration is not drawn to scale. (B) To control for correct integration of the transfected DNA sequences, three different PCRs were performed. The 5'INT PCR amplifies the 5' end of the integrated sequence with a primer that binds upstream of the integration site matching a primer that binds specifically to the sequence encoding the I domain. The 3'INT PCR amplifies the 3' end of the integrated sequence with a primer that binds downstream of the integration site matching a primer in the selection cassette. The control PCR (Con or KO) uses primers that are specific for the recipient lines fluo or trap(-). The length of the expected PCR products is depicted below the gel images. Shown are only PCR results of isogenic populations cloned by limiting dilution.
Figure 3—figure supplement 2

Transmission efficacy of salivary gland sporozoites expressing TRAP with different I domains transmitted either by mosquito bite or by intravenous injection.
Mice were either exposed to 10 infected mosquitoes (A) or injected intravenously (i.v.) with 10,000 salivary gland sporozoites (B). Shown is the parasitemia of four infected mice per parasite line as mean ± SEM from day 3 to day 10. The survival of infected mice was monitored for 12 days post infection. The survival graphs correspond to the growth curves shown above. Per parasite line and experiment four mice were infected. Note that only growth curves and survival graphs of fluorescent parasite lines are shown.
Figure 3—figure supplement 3
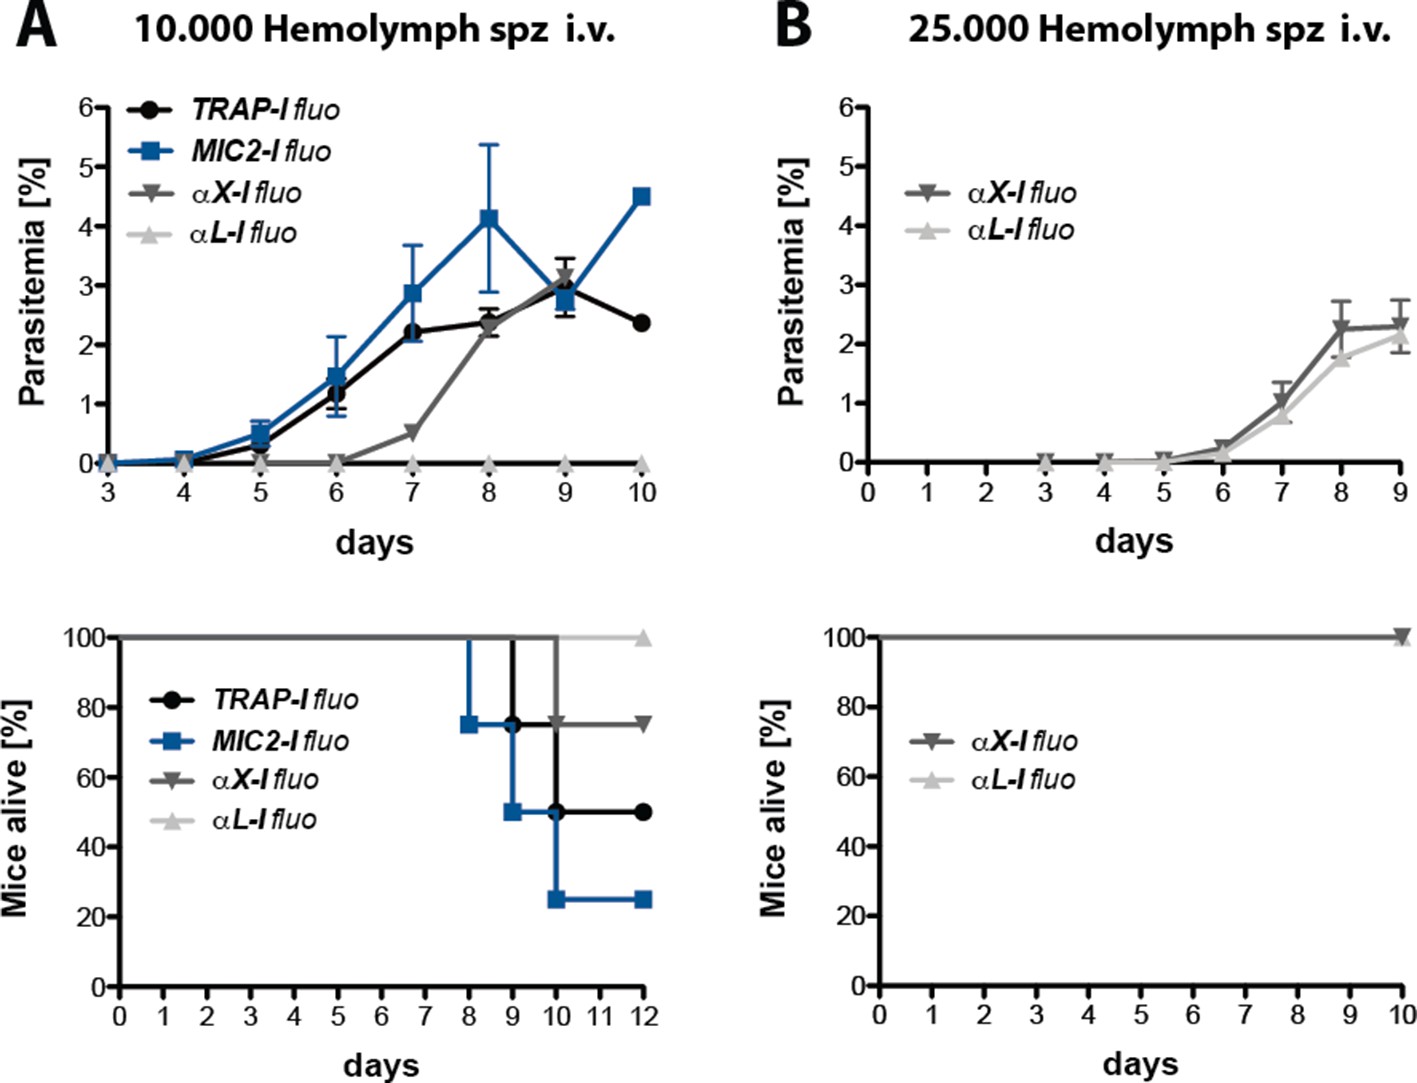
Transmission efficacy of intravenously injected hemolymph sporozoites expressing TRAP with different I domains.
Mice were either injected intravenously (i.v.) with 10,000 (A) or 25,000 (B) hemolymph sporozoites. Injections with 25,000 hemolymph sporozoites were only performed with αX-I fluo and αL-I fluo parasites. Shown is the parasitemia of four infected mice per parasite line as mean ± SEM from day 3 to day 9 respectively 10. The survival of infected mice was monitored for 10 respectively 12 days post infection. Survival graphs correspond to the growth curves shown above. Per parasite line and experiment two to four mice were infected. (A) Represents a single experiment with four infected mice per parasite line. (B) Represents two experiments with eight (αX-I) respectively six (αL-I) mice. Note that only growth curves and survival graphs for fluorescent parasite lines are shown.
Figure 3—figure supplement 4

Sporozoites expressing the integrin I domains αX or αL are infective to mice.
(A) Primers were designed to bind specific to sequences encoding for the different I domains TRAP-I, MIC2-I, αX-I and αL-I. (B) Cartoon to illustrate the genotype analysis of parasites isolated from selected mice infected with αX-I or αL-I determined by PCR with three different primer combinations: control (con); amplification of the 5'UTR including the N-terminal end of the TRAP wild type ORF, 5'INT; amplification of the 5'UTR including the N-terminal end of the codon modified TRAP ORF, 3'INT; amplification of the 3'UTR including the C-terminal part of the selection cassette. Illustration is not drawn to scale. (C) PCR genotyping of mice that became blood stage positive after injection of 10,000 or 25,000 αX-I or αL-I hemolymph sporozoites. In addition to the PCR data shown here, sequencing of the trap locus revealed the correct identity of the used parasite line in all tested mice.
Figure 4
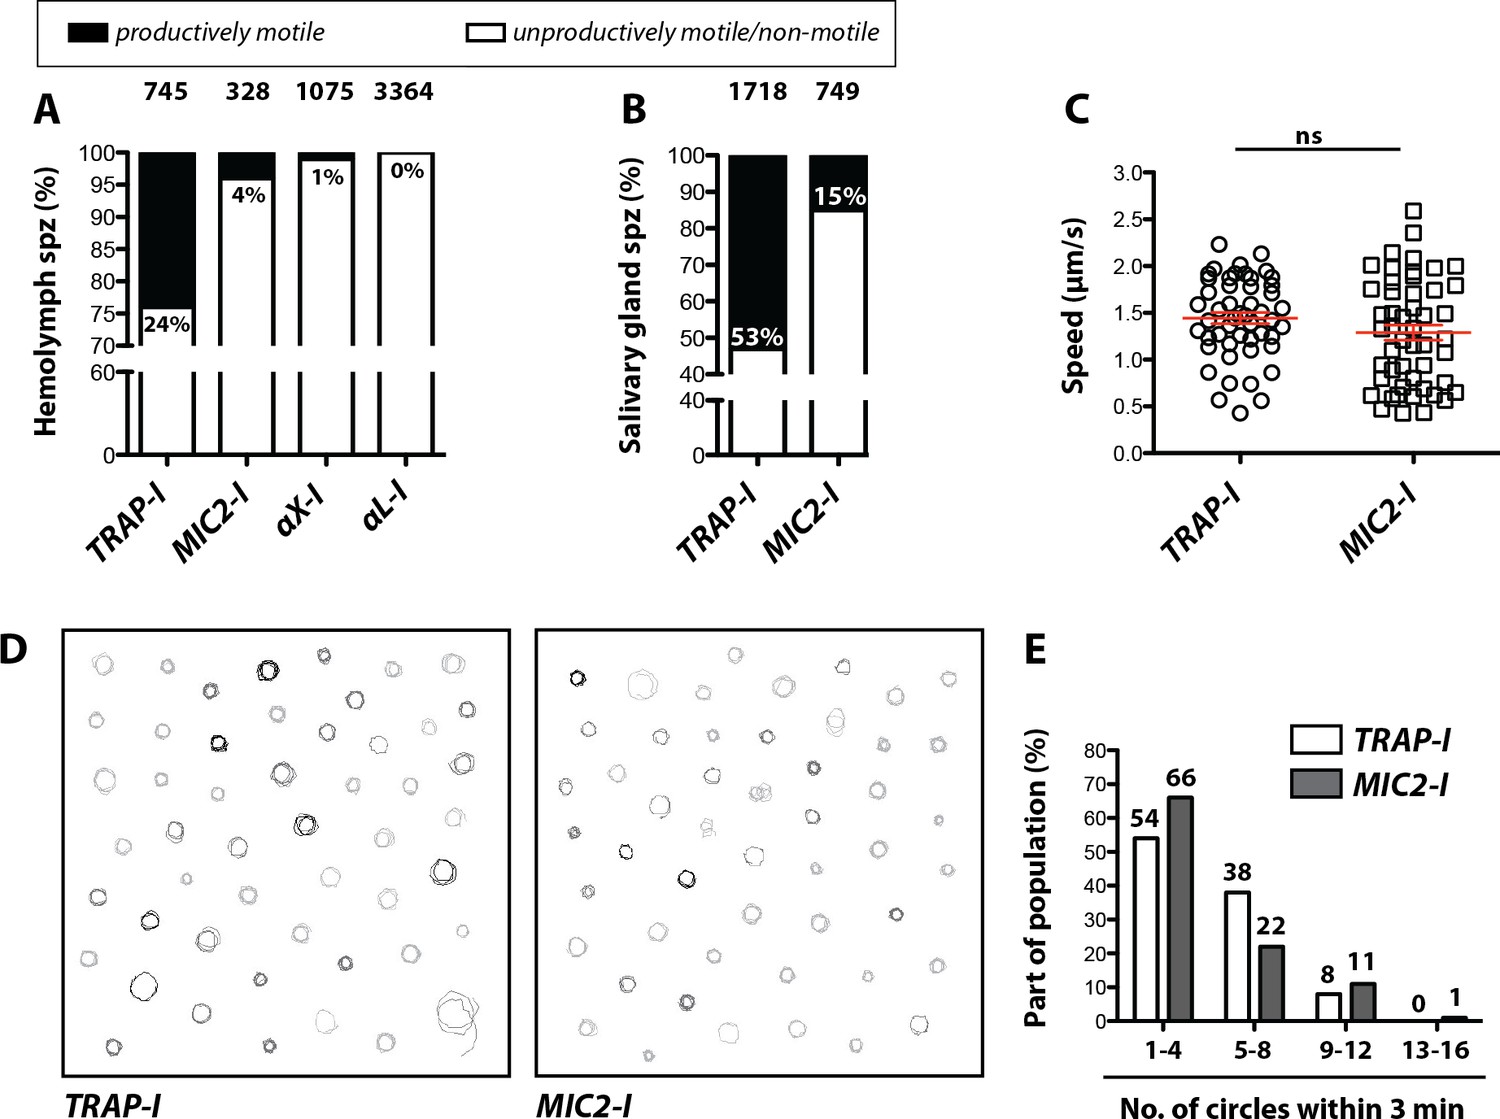
Impaired in vitro gliding of I domain mutant sporozoites.
(A, B) Ratio of productively and unproductively moving/non motile hemolymph (A) and salivary gland (B) sporozoites of the indicated parasite lines. Sporozoites were classified as productively moving if they were able to glide at least one complete circle during a three-minute movie. All sporozoites that behaved differently were classified as unproductively moving/non motile. Data were generated from three independent experiments per parasite line. The number of analyzed sporozoites is depicted above each column. For further details about movement pattern of sporozoites see Figure 2—figure supplement 2. Note that salivary gland sporozoites from the lines αX-I and αL-I could not be analyzed because of their low number. (C) Average speed of salivary gland sporozoites continuously gliding for 150 s. Shown are the mean speeds of 50 salivary gland sporozoites per line generated from two (MIC2-I) and three (TRAP-I) independent experiments. Red bars show the mean ± SEM; unpaired t-test. (D) Trajectories of the sporozoites tracked in (C). (E) Persistence of gliding TRAP-I and MIC2-I sporozoites. The graph illustrates the number of circles salivary gland sporozoites were able to glide during a three-minute movie. Data were generated from two (MIC2-I; 107 sporozoites) and three (TRAP-I; 111 sporozoites) independent experiments.
Figure 5 with 1 supplement
MIC2-I sporozoites are impaired in hepatocyte invasion but not in liver stage development.
(A) Invasion assay. Confluent HepG2 monolayers exposed to sporozoites for 1.5 hr were fixed and stained with CSP antibodies before and after permeabilization with methanol; anti-IgG secondary antibodies conjugated to different fluorochromes were used before and after permeabilization. The illustration on the right depicts the staining of intracellular and extracellular sporozoites. (B) Number of liver stages after challenge with 10,000 salivary gland sporozoites. Experiments were performed with sporozoites obtained from two different feeding experiments with 2–3 technical replicates per parasite line and experiment. The red line indicates the median. *** depicts a p-value of 0.005; unpaired t test. (C, D) Liver stage development of TRAP-I and MIC2-I parasites. (C) Immunofluorescence images of TRAP-I and MIC2-I liver stages 48 hr post infection. The expression of PbHSP70 is shown in red while DNA is shown in cyan. Scale bars: 10 µm. (D) Area of liver stages 48 hr post infection. The red line shows the median. Data were tested for significance with an unpaired t test. (E) Liver load in mice challenged with MIC2-I as % of load with the control TRAP-I. Shown is the relative expression of parasite-specific 18 s rRNA determined by qRT-PCR and normalized to mouse-specific GAPDH. Data display the mean of three measurements generated from pooled cDNA of four challenged mice per parasite strain.
Figure 5—figure supplement 1
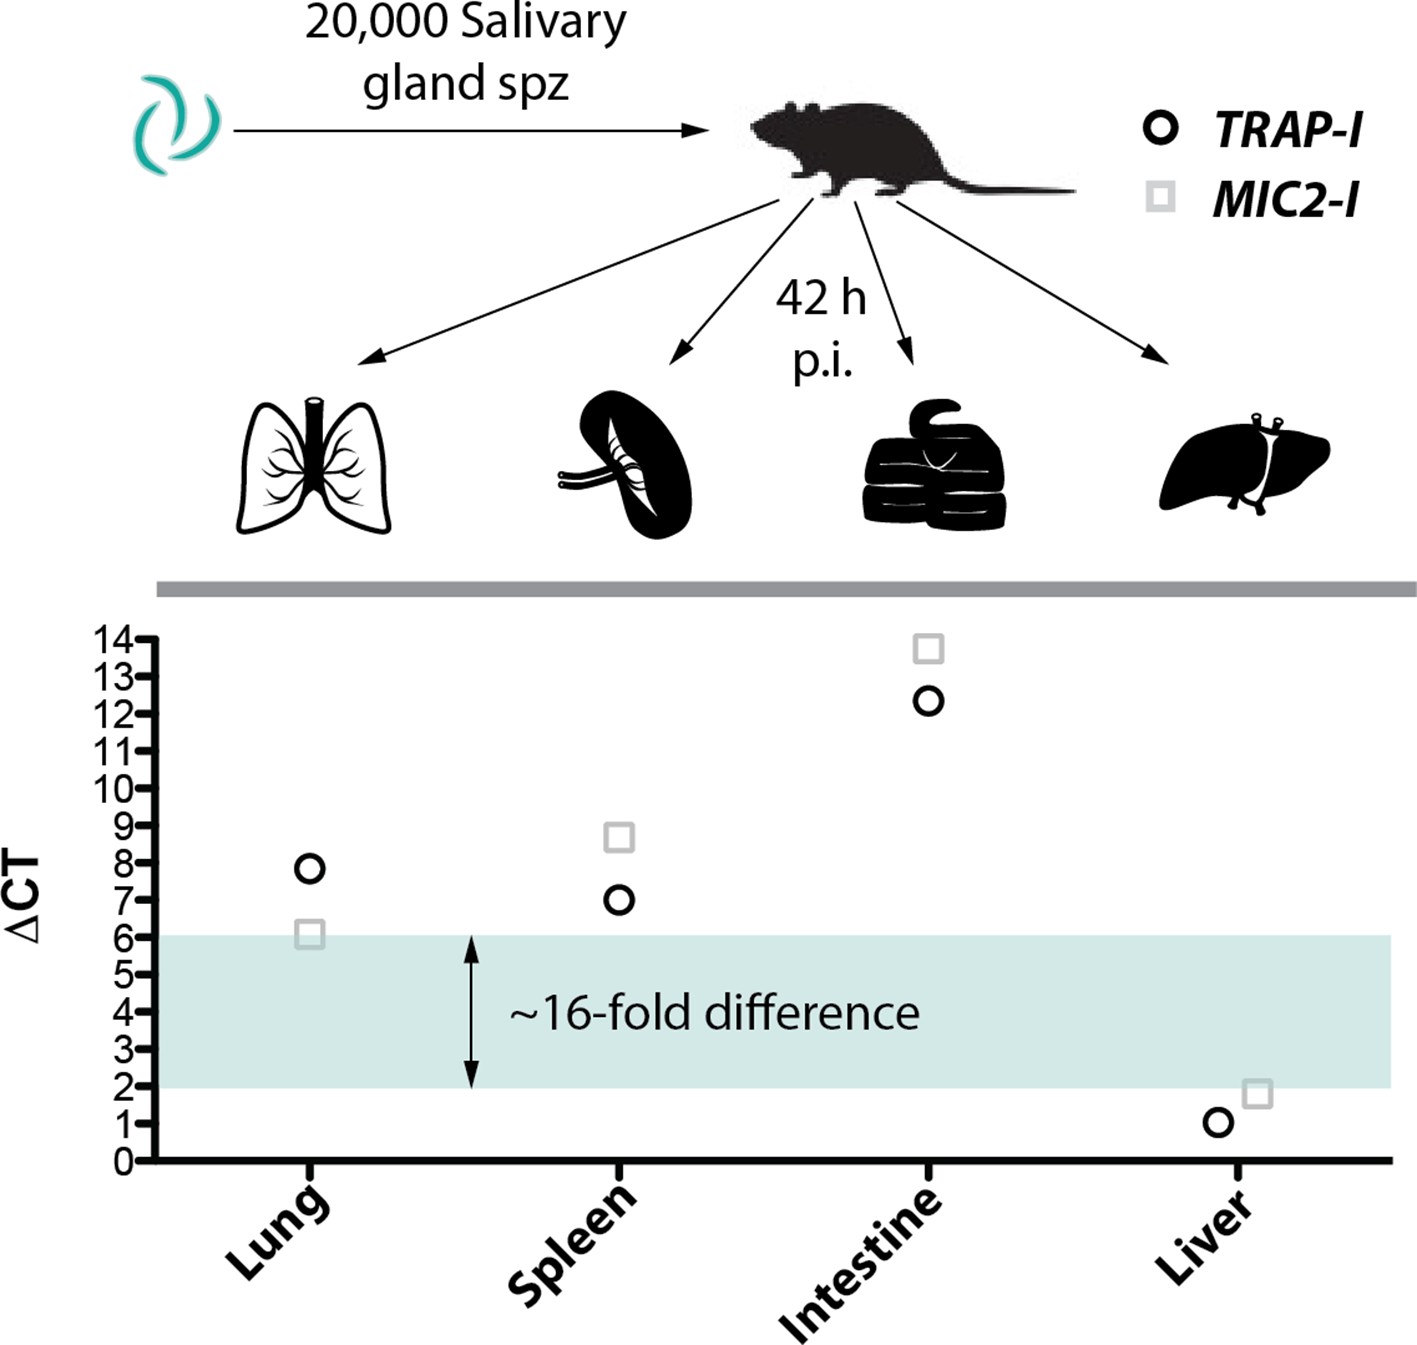
MIC2-I sporozoites show no altered tissue tropism compared to TRAP-I.
Parasite load in lung, spleen, small intestine and liver of mice infected with 20,000 MIC2-I or TRAP-I salivary gland sporozoites. Organs were harvested 42 hr post infection to isolate RNA. Per organ and parasite line equal amounts of RNA were pooled from four infected mice to generate one TRAP-I and one MIC2-I sample per harvested organ. qRT-PCR was performed in technical triplicates. The mean CT of Plasmodium berghei specific 18 s rRNA was subtracted from the mean CT of mouse specific GAPDH. Subsequently the ΔCT was plotted as single value. For further details please see Material and methods.
Figure 6 with 2 supplements
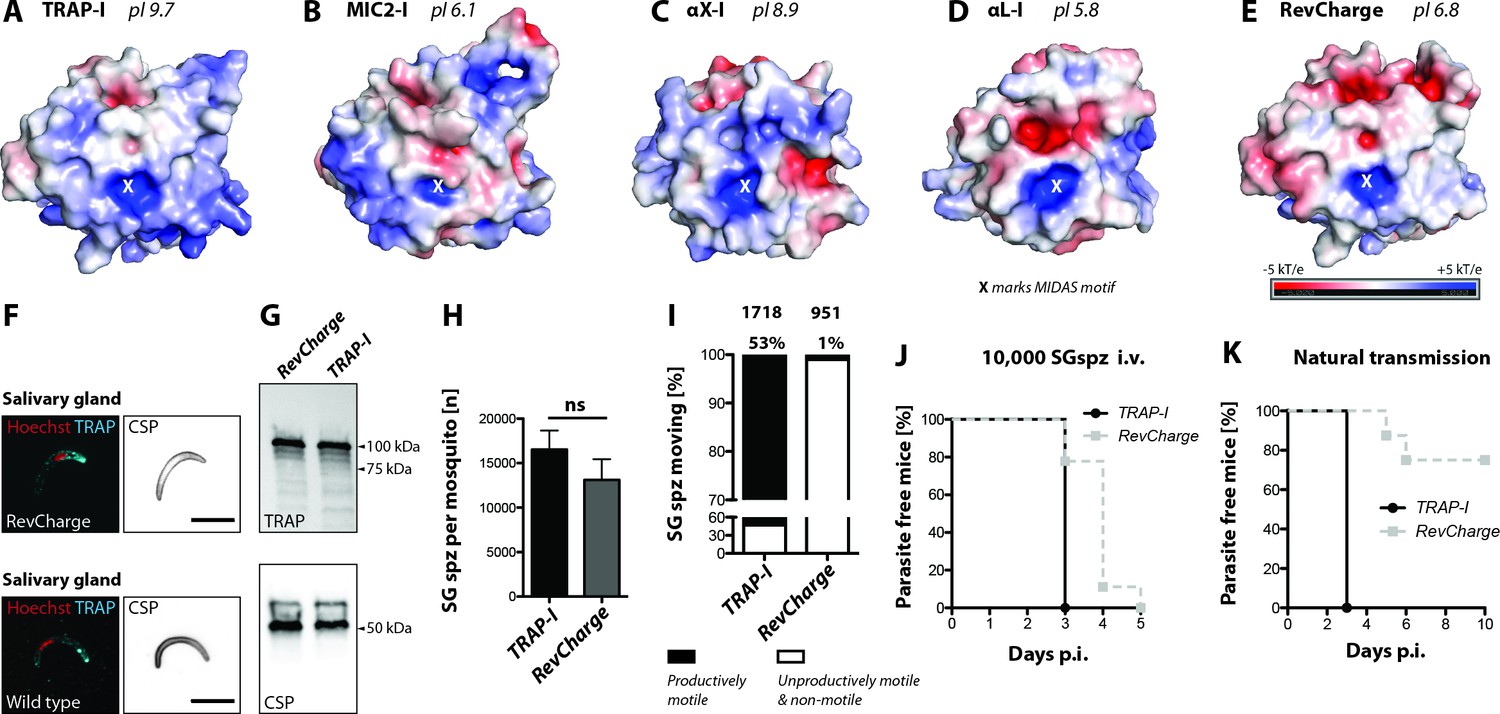
Sporozoites expressing an I domain with a negatively charged MIDAS perimeter invade salivary glands normally but show decreased motility and infectivity to mice.
(A–E) Electrostatic surfaces around the MIDAS metal ion of I domains in the open conformation. Structures are of (A), P. berghei TRAP modeled on P. vivax, PDB 4HQL; (B), MIC2, modeled on closed MIC2 (PDB 4OKR chain B) and open TRAP (PDB 4HQL); (C), integrin αX, PDB 4NEH; (D), integrin αL, PDB 1MQ8; and (E), P. berghei RevCharge modeled on P. vivax, (PDB 4HQL). The X marks the MIDAS. The color code refers to the electrostatic potential of the surface ranging from −5 to +5 kT/e. F) IFA on unpermeabilized salivary gland sporozoites of RevCharge and wild type (wt); cyan: TRAP, red: DNA, CSP: black. Scale bars: 10 µm. (G) anti-TRAP western blot of salivary gland control (TRAP-I) and RevCharge sporozoites; loading control: CSP. (H) Sporozoite numbers in salivary glands of mosquitoes infected with TRAP-I (fluo) and RevCharge (non-fluo) from three independent feeding experiments; Mann-Whitney test. Note that data for the control TRAP-I (fluo) are shown in Figure 3F. (I) Movement pattern of TRAP-I and RevCharge salivary gland sporozoites from three different feeding experiments. Sporozoites were classified as productively moving if they were able to perform ≥1 circle during a three minutes movie. All sporozoites that behaved differently were classified as unproductively moving or non-motile. Note that data for the control TRAP-I were shown previously in Figure 4B. (J, K) In vivo infectivity of TRAP-I and RevCharge salivary gland sporozoites. C57BL/6 mice were either exposed to infected mosquitoes or injected with 10,000 salivary gland sporozoites/mouse intravenously (i.v.) (see also Table 2). (J) The percentage of parasite-free mice over time after injection of 10,000 salivary gland sporozoites (TRAP-I, n = 4; RevCharge, n = 9). (K) The percentage of parasite-free mice over time after exposure to infected mosquitoes (TRAP-I, n = 4; RevCharge, n = 8). p.i. – post infection.
Figure 6—figure supplement 1
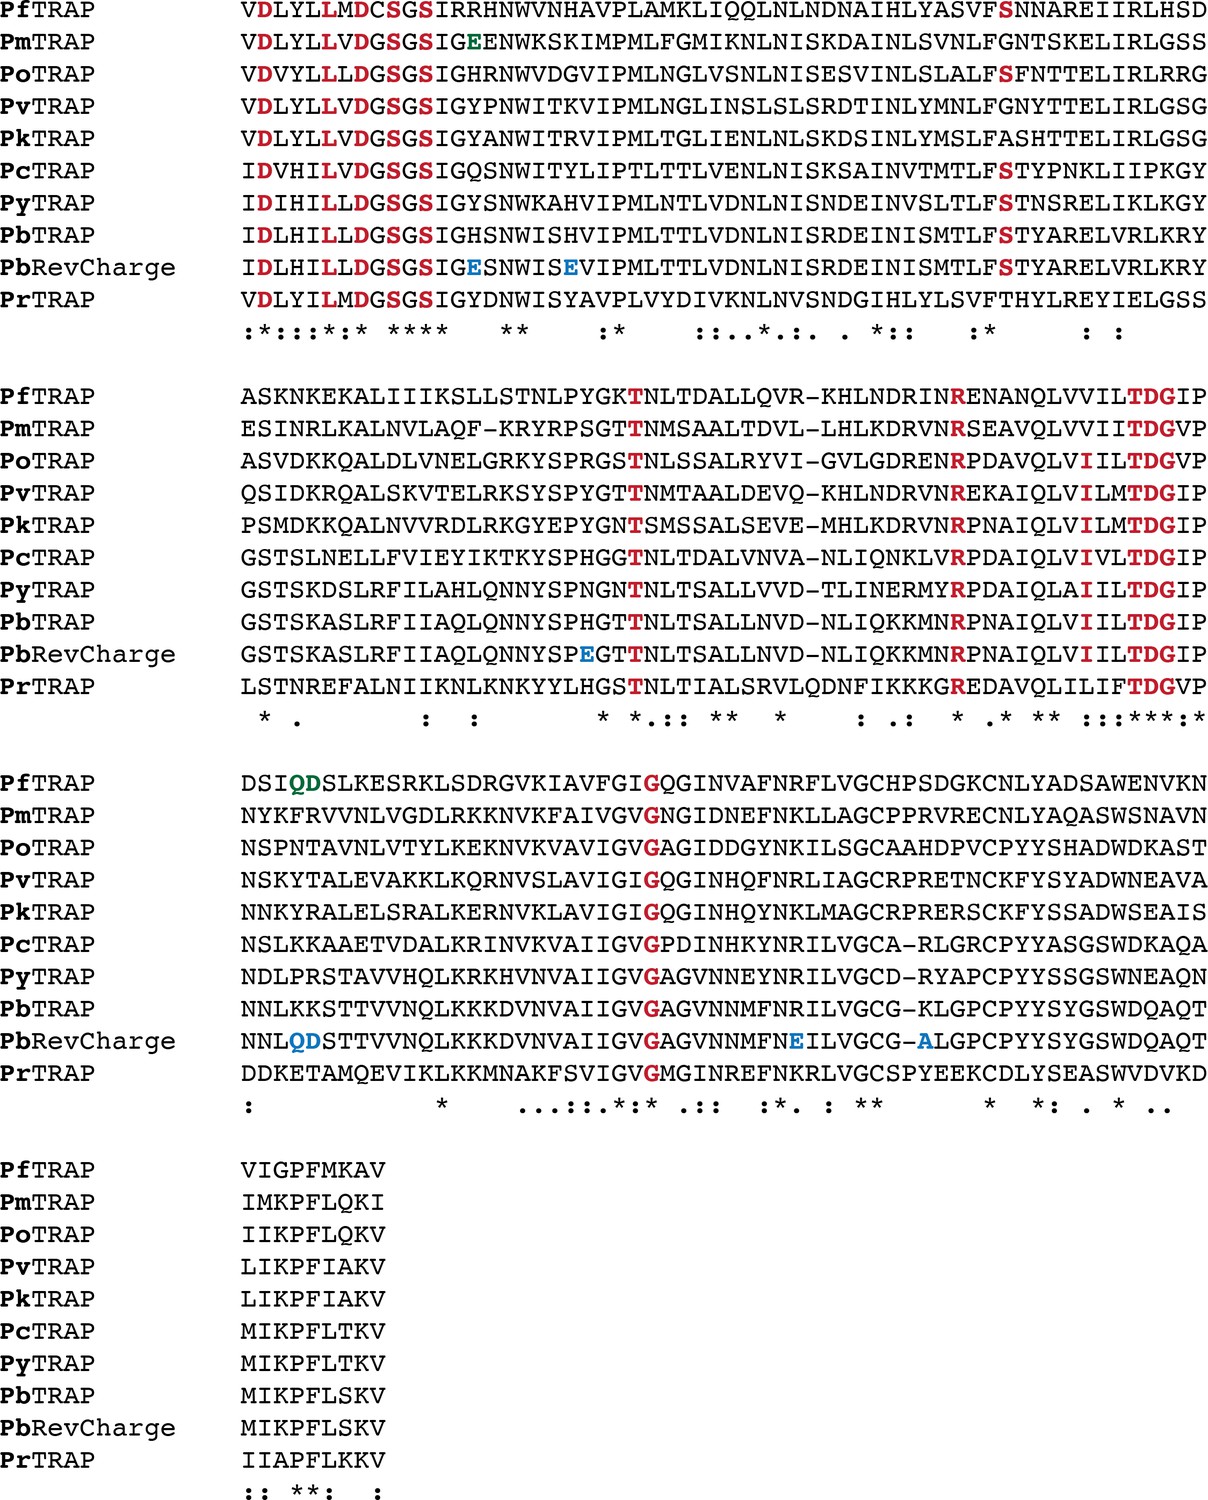
Alignment of TRAP I domain homologues of different Plasmodium species in comparison to the I domain of the PbRevCharge mutant.
The I domain of the RevCharge mutant was aligned with the I domains of TRAP homologues found in the five human infecting Plasmodium species P. falciparum (Pf), P. malariae (Pm), P. ovale (Po), P. vivax (Pv) and P. knowlesi (Pk) as well as the three rodent malaria parasites P. chabaudi (Pc), P. yoelii (Py) and P. berghei (Pb) and the bird infecting species P. relictum (Pr). Residues part of the MIDAS motif are indicated in red while residues mutated in the PbRevCharge mutant are highlighted in turquoise. Residues in I domains of other Plasmodium species matching mutations in the RevCharge mutant are marked in green. Note that the positions S90 and I154 (PbTRAP) of the MIDAS motif are not strictly conserved in all aligned Plasmodium species. An asterik indicates a position with a single, fully conserved residue. A colon indicates conservation of functional groups with strongly similar properties. A period indicates conservation of functional groups with weakly similar properties.
Figure 6—figure supplement 2
RevCharge sporozoites show impaired hepatocyte invasion but normal liver stage development.
(A) Invasion assay of RevCharge and control (TRAP-I) sporozoites showing sporozoites that entered (black) or not (white) hepatocytes. Cells were fixed and stained with CSP antibodies as well as two anti-IgG secondary antibodies conjugated to different fluorochromes before and after permeabilization with methanol, respectively. The illustration on the right shows the staining pattern of invaded and non-invaded sporozoites. (B) Number of liver stages after incubation with 10,000 salivary gland sporozoites. Experiments were performed with sporozoites obtained from two feeding experiments with at least two technical replicates per parasite line and experiment. The red line indicates the median. *** depicts a p-value of 0.005; unpaired t test. (C) Immunofluorescence images of TRAP-I and RevCharge liver stages 48 hr post infection. The expression of PbHSP70 is shown in red while DNA is shown in blue. Scale bars: 8 µm.
Author response image 1
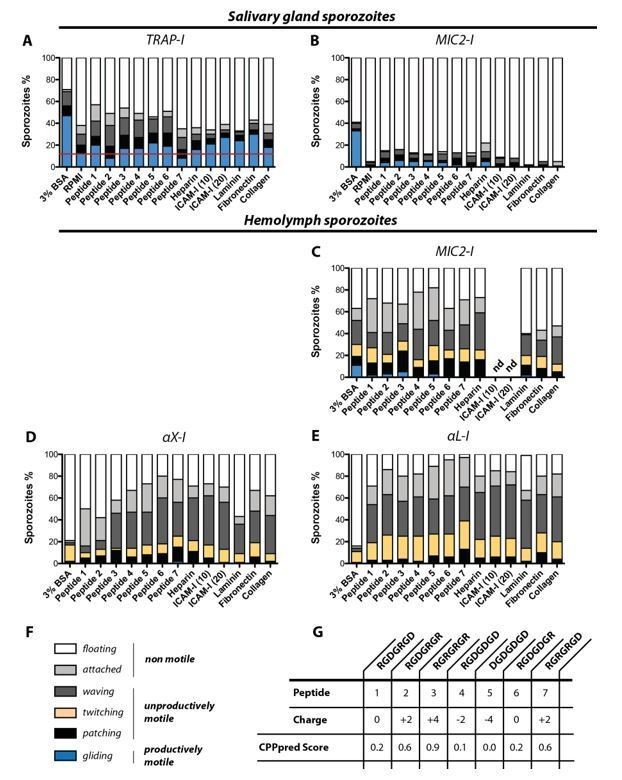
In vitro gliding motility of TRAP-I, MIC2-I, αX-I and αL-I sporozoites on different substrates.
Sporozoites were allowed to glide in wells coated with heparin, laminin, fibronection, collagen and two different concentrations of ICAM-I (10 µg/mL and 20 µg/mL); see Author response table 1. In addition gliding motility was tested in the presence of seven differently charged heptapeptides as well as in 3% BSA and in RPMI(P/S) without additives. (A) Gliding motility of TRAP-I salivary gland sporozoites. The red line indicates the baseline of productive motility observed in the negative control RPMI(P/S). Per condition 184 to 415 sporozoites were analyzed. (B) Gliding motility of MIC2-I salivary gland sporozoites. Per condition 111 to 174 sporozoites were analyzed. (C) Gliding motility of MIC2-I hemolymph sporozoites. Per condition 59 to 200 sporozoites were analyzed. (D) Gliding motility of αX-I hemolymph sporozoites. Per condition 97 to 366 sporozoites were analyzed. (E) Gliding motility of αL-I hemolymph sporozoites. Per condition 167 to 240 sporozoites were analyzed. (F) Classification of movement pattern according to Figure 2—figure supplement 2 of the manuscript. (G) Sequence and charge of tested heptapeptides. The CPPpred Score (https://omictools.com/cpppred-tool) gives the probability of the peptide to be membrane permeable (<0.5; unlikely to cross membranes, >0.5; likely to cross membranes). Note that the assay was not performed with TRAP-I hemolymph sporozoites because we did not observe any specific activation of gliding motility for αX-I and αL-I hemolymph sporozoites in any condition. All assays were performed in duplicates with sporozoites obtained from two mosquito feeding experiments. nd: not determined.
Videos
Video 1
Z-projection through salivary gland infected with aX-I fluo sporozoites.
Shown is an image series in Z-direction of a salivary gland infected with aX-I fluo sporozoites. Images were taken on an Axiovert 200M (Zeiss) with a 63x (N.A. 1.3) objective.
Video 2
TRAP-I and αX-I hemolymph sporozoites gliding in vitro.
Movie showing hemolymph sporozoites expressing mCherry of TRAP-I (shown on the left with a white background) and αX-I (shown on the right with a black background) productively gliding in vitro. Imaging was performed on an Axiovert 200M (Zeiss) with a 10x (NA 0.25) objective. Shown is a three-minute movie with three seconds between frames.
Tables
Table 1
Absolute sporozoite numbers in midgut (MG), hemolymph (HL) and salivary glands (SG) of all analyzed parasite strains.
Sporozoites in the midgut, hemolymph and the salivary glands of infected mosquitoes were counted between day 14 and day 24 post infection of each feeding experiment. Shown is the mean ± SD of all performed experiments per parasite line. Mosquitoes infected with fluorescent parasite lines were pre-selected for fluorescence in the abdomen using a fluorescence binocular microscope while mosquitoes infected with non-fluorescent parasites were not. Hence sporozoite numbers per infected mosquito for fluorescent parasite lines should be higher compared to non-fluorescent lines. n.d. – not determined; bold numbers indicate lower levels of salivary gland invasion.
| Parasite line | No. of MG sporozoites | No. of HL sporozoites | No. of SG sporozoites | SGS pos./total counts | SGS/MGS |
|---|---|---|---|---|---|
| trap(-) | 26,000 (±24.000) | 6000 (±7,000) | 20 | 1/8 | 0.0009 |
| wt | 10,000 (±3,000) | n.d. | 8000 (±7,000) | 4/4 | 0.8 |
| fluo | 108,000 (±70,000) | n.d. | 21,000 (±4,000) | 6/6 | 0.2 |
| TRAP-I | 26,000 (±7,000) | 8,000* | 16,000 (±4,000) | 2/2 | 0.6 |
| MIC2-I | 38,000 (±16,000) | 6,000* | 18,000 (±3,000) | 2/2 | 0.5 |
| αX-I | 35,000 (±13,000) | 4,000* | 210 | 2/2 | 0.006 |
| αL-I | 42,000 (±16,000) | 7,000* | 30 | 1/2 | 0.0006 |
| RevCharge | 70,700 (±12,000) | n.d. | 13,000 (±6,000) | 7/7 | 0.2 |
| trapΔI | 24,000 (±20,000) | 4000 (±5.000) | 60† | 3/14 | 0.003 |
| TRAP-I fluo | 22,000 (±13,000) | 2000 (±2.000) | 17,000 (±6,000) | 8/8 | 0.8 |
| MIC2-I fluo | 21,000 (±17,000) | 1000 (±700) | 7000 (±4,000) | 7/7 | 0.3 |
| αX-I fluo | 37,000 (±7,000) | 6000 (±2,000) | 120 | 6/6 | 0.003 |
| αL-I fluo | 34,000 (±9,000) | 5000 (±3,000) | 90 | 3/6 | 0.003 |
-
*hemolymph sporozoites of the non-fluorescent lines TRAP-I, MIC2-I, αX-I and αL-I were only counted once.
†in one infection 800 SG sporozoites could be counted. Intravenous injection of 5000 salivary gland sporozoites into each of four mice did not lead to infection.
Table 2
Determination of transmission efficacy in vivo.
Transmission efficacy of trap(-), trapΔI, TRAP-I, MIC2-I, αX-I, αL-I and RevCharge as well as the wild type (wt) reference line. Prepatency is the time between sporozoite infection and the first observance of blood stages and is given as the mean of all positive mice of the respective experiment(s). C57BL/6 mice were either injected intravenously (i.v.) with 10,000 salivary gland sporozoites (SGS) or 10,000 hemolymph sporozoites (HLS) or exposed to 10 mosquitoes that received an infected blood meal. Note that mosquitoes infected with fluorescent parasite lines were pre-selected while mosquitoes infected with non-fluorescent parasites were not pre-selected but dissected afterwards to ensure that all mice were bitten by at least one infected mosquito. For strains with strongly decreased salivary gland invasion capacity (aX-I and aL-I) no SGS but 25,000 HLS were injected.
| Parasite line | Route of inoculation | Infected Mice‡ | Prepatency (days) |
|---|---|---|---|
| wild type ANKA | by mosquito bite§ | 4/4 | 3.0 |
| wild type ANKA | 10,000 HLS | 4/4 | 3.0 |
| TRAP-I fluo | by mosquito bite§ | 4/4 | 3.0 |
| TRAP-I fluo | 500,000 MGS | 1/1† | 8.0 |
| TRAP-I fluo | 10,000 HLS (i.v.) | 4/4 | 4.0 |
| TRAP-I fluo | 10,000 SGS (i.v.) | 4/4 | 3.0 |
| MIC2-I fluo | by mosquito bite§ | 4/4 | 3.0 |
| MIC2-I fluo | 10,000 HLS (i.v.) | 4/4 | 3.8 |
| MIC2-I fluo | 10,000 SGS (i.v.) | 8/8 | 3.1 |
| αX-I fluo | by mosquito bite§ | 0/4 | /* |
| αX-I fluo | 500,000 MGS (i.v.) | 2/4 | 8.0 |
| αX-I fluo | 10,000 HLS (i.v.) | 1/4 | 6.0 |
| αX-I fluo | 25,000 HLS (i.v.) | 5/8 | 5.5 |
| αL-I fluo | by mosquito bite§ | 0/4 | /* |
| αL-I fluo | 500,000 MGS (i.v.) | 0/2 | /* |
| αL-I fluo | 10,000 HLS (i.v.) | 0/4 | /* |
| αL-I fluo | 25,000 HLS (i.v.) | 1/6 | 5.0 |
| trap(-) | 500,000 MGS (i.v.) | 0/4 | /* |
| trap(-) | 25,000 HLS (i.v.) | 0/6 | /* |
| trap∆I | by mosquito bite¶ | 0/4 | /* |
| trap∆I | 500,000 MGS (i.v.) | 0/6 | /* |
| trap∆I | 10,000 HLS (i.v.) | 0/4 | /* |
| trap∆I | 25,000 HLS (i.v.) | 0/4 | /* |
| trap∆I | 5,000 SGS (i.v.) | 0/4 | /* |
| TRAP-I | 10,000 HLS (i.v.) | 4/4 | 3.0 |
| MIC2-I | 10,000 HLS (i.v.) | 4/4 | 4.0 |
| αX-I | 10,000 HLS (i.v.) | 3/4 | 5.3 |
| αL-I | 10,000 HLS (i.v.) | 0/4 | /* |
| RevCharge | by mosquito bite¶ | 2/8 | 5.5 |
| RevCharge | 10,000 SGS (i.v.) | 9/9 | 3.9 |
-
*mice did not become positive within ≥10 days post infection.
† three mice had to be sacrificed due to tail infections that occurred after injection.
-
‡ Infected mice/inoculated (exposed) mice.
§ mosquitoes were pre-selected for parasites.
-
¶ mosquitoes were not pre-selected for parasites.
Table 3
Clustered summary of in vivo infections.
Comparison of the sporozoite infectivity to mice of the different lines by adding the data from Table 2 where the respective controls were 100% infective. Data for wild type controls, MIC2-I domain and RevCharge parasites are from infections with hemolymph and salivary glands sporozoites as well as by bite experiments. All others summarize infections with hemolymph sporozoites only, as these parasites did not colonize the salivary glands efficiently.
| Parasite lines | Infected mice* |
|---|---|
| wild type controls | 24/24 |
| MIC2-I domain RevCharge | 20/20 11/17 |
| αX-I domain | 9/16 |
| αL-I domain trap∆I trap(-) | 1/14 0/8† 0/6 |
-
* Infected mice/inoculated (exposed) mice.
† Four additional mice injected with 5000 salivary gland sporozoites also remained uninfected.
Key resources table
| Reagent type (species) or resource | Designation | Source or reference | Identifiers | Additional information |
|---|---|---|---|---|
| Antibody | anti-CSP (mouse monoclonal) | Yoshida et al., 1980 | MR4: MRA-100 | mAb 3D11 |
| Antibody | anti-TRAP (rabbit ployclonal) | This paper | / | / |
| Antibody | anti-rabbit (Goat) | ThermoFisher Scientific | Cat#A-11034 | coupled to AlexaFluor 488 |
| Antibody | anti-rabbit (Goat) | ThermoFisher Scientific | Cat#A10523 | coupled to Cy5 |
| Antibody | anti-mouse (Goat) | ThermoFisher Scientific | Cat#A-11001 | coupled to AlexaFluor 488 |
| Antibody | anti-mouse (Goat) | ThermoFisher Scientific | Cat#A10524 | coupled to Cy5 |
| Antibody | anti-rabbit (Goat) | Bio-Rad | Cat#1705046 | Immun Star (GAR)-HRP |
| Antibody | anti-mouse (sheep) | GE-Healthcare | NXA931-1ML | IgG, HRP linked whole Ab |
| Bacteria (Escherichia coli) | XL1-blue cells | Agilent technologies | Cat#200236 | Chemically competent cells |
| Other | Hoechst 33342 | ThermoFisher Scientific | Cat#H3570 | / |
| Commercial assay or kit | SYBR Green PCR Master Mix | ThermoFisher Scientific | Cat#4309155 | / |
| Cell line (Homo sapiens) | HepG2 | ATCC | HB-8065 | / |
| Strain (Mus musculus) | NMRI | Janvier Labs/Charles River Laboratories | / | / |
| Strain (Mus musculus) | C57BL/6JRj | Janvier Labs/Charles River Laboratories | / | / |
| Strain (Plasmodium berghei) | ANKA | Vincke and Bafort, 1968 | MR4: MRA-671 | / |
| Strain (Plasmodium berghei) | trap(-)rec | this paper | / | ANKA background |
| Strain (Plasmodium berghei) | trapΔI | this paper | / | ANKA background |
| Strain (Plasmodium berghei) | fluo | this paper | / | ANKA background |
| Strain (Plasmodium berghei) | TRAP-I fluo | this paper | / | ANKA background |
| Strain (Plasmodium berghei) | MIC2-I fluo | this paper | / | ANKA background |
| Strain (Plasmodium berghei) | αX-I fluo | this paper | / | ANKA background |
| Strain (Plasmodium berghei) | αL-I fluo | this paper | / | ANKA background |
| Strain (Plasmodium berghei) | TRAP-I non-fluo | this paper | / | ANKA background |
| Strain (Plasmodium berghei) | MIC2-I non-fluo | this paper | / | ANKA background |
| Strain (Plasmodium berghei) | αX-I non-fluo | this paper | / | ANKA background |
| Strain (Plasmodium berghei) | αL-I non-fluo | this paper | / | ANKA background |
| Strain (Plasmodium berghei) | RevCharge non-fluo | this paper | / | ANKA background |
| Sequenced-based reagent | gapdh forward | this paper | PCR primers | TGAGGCCGGTGCTGAGTATGTCG |
| Sequenced-based reagent | gapdh reverse | this paper | PCR primers | CCACAGTCTTCTGGGTGGCAGTG |
| Sequenced-based reagent | 18 s RNA forward | this paper | PCR primers | AAGCATTAAATAAAGCGAATACATCCTTAC |
| Sequenced-based reagent | 18 s RNA reverse | this paper | PCR primers | GGAGATTGGTTTTGACGTTTATGTG |
| Recombinant DNA reagent | TRAP gene sequence: TRAP-I | ThermoFisher Scientific | / | codon modified (E. coli K12) |
| Recombinant DNA reagent | TRAP gene sequence: MIC2-I | ThermoFisher Scientific | / | codon modified (E. coli K12) |
| Recombinant DNA reagent | TRAP gene sequence: αX-I | ThermoFisher Scientific | / | codon modified (E. coli K12) |
| Recombinant DNA reagent | TRAP gene sequence: αL-I | ThermoFisher Scientific | / | codon modified (E. coli K12) |
| Recombinant DNA reagent | TRAP gene sequence: RevCharge | ThermoFisher Scientific | / | codon modified (E. coli K12) |
| Recombinant DNA reagent | pMK-RV | ThermoFisher Scientific | / | KanR |
| Recombinant DNA reagent | Pb238 | Deligianni et al., 2011 Singer et al., 2015 | / | AmpR |
| Recombinant DNA reagent | PbGEM-107890 | Schwach et al., 2015 PlasmoGEM | / | https://plasmogem.sanger.ac.uk/designs/search_result?id=PbGEM-107890 |
| Software, algorithm | Prism 5.0 | GraphPad, San Diego | / | https://www.graphpad.com/scientific-software/prism/ |
| Software, algorithm | PyMOL | The PyMOL Molecular Graphics System, Version 2.0 Schrödinger, LLC | / | https://pymol.org/2/ |
| Software, algorithm | AxioVision | Carl Zeiss Microscopy | / | https://www.zeiss.com/microscopy/int/home.html |
| Software, algorithm | Volocity | PerkinElmer | / | http://www.perkinelmer.de/corporate |
| Software, algorithm | ApE | ApE – A plasmid Editor by M. Wayne Davis | / | http://jorgensen.biology.utah.edu/wayned/ape/ |
| Software, algorithm | ImageJ | Schindelin et al., 2012 | / | https://imagej.nih.gov/ij/ |
| Software, algorithm | Clustal Omega | Sievers et al., 2011 | / | https://www.ebi.ac.uk/Tools/msa/clustalo/ |
| Software, algorithm | Optimizer | Puigbò et al., 2007 | / | http://genomes.urv.es/OPTIMIZER/ |
| Software, algorithm | PlasmoDB (version 26–34) | Aurrecoechea et al., 2009 | / | http://plasmodb.org/plasmo/ |
Author response table 1
Coating protocols used to test gliding motility of sporozoites on different substrates.
Gliding assays were performed in 96-well plates and wells were coated with heparin, ICAM-I, laminin, fibronectin and collagen according to the following protocols (Bilsland, Diamond and Springer, 1994; Gao et al., 2011).
| Coating agent | Concentration | Protocol |
|---|---|---|
| Heparin | 100 U/µL | Heparin (stock: 25000 U/µL) was diluted in Laminin buffer (150 mM NaCl, 50 mM TRIS, pH 7.4) to 100 U/µL. Coating procedure: Per well 150 µL heparin solution was added and incubated overnight at 4°C. Before the gliding assay was started wells were washed once with PBS. |
| ICAM-I | 10 µg/mL | ICAM-I (stock: 2 mg/mL) was diluted in PBS to 10 or 20 µg/mL. Coating procedure: Per well 150 µL of the final solution was added and incubated at 4°C overnight. Before the gliding assays were started wells were washed once with PBS. |
| ICAM-I | 20 µg/mL | |
| Laminin | 25 µg/mL | Laminin (stock: 1 mg/mL) was diluted in Laminin buffer to 25 µg/mL. Coating procedure: Wells were washed with 70 % EtOH to increase hydrophilicity. Subsequently wells were washed three times with H2O to remove remnants of EtOH. Per well 200 µL laminin solution was added and incubated at room temperature for one hour. Before the gliding assay was started wells were washed once with PBS. |
| Fibronectin | 50 µg/mL | Fibronectin (stock: 1 mg/mL) was diluted in Laminin buffer to 50 µg/mL. Coating procedure: As above. |
| Collagen | 2.5 µg/mL | Collagen (stock: 1 mg/mL) was diluted in 0.2 M acetic acid to 2.5 µg/mL. Coating procedure: As above. |
Additional files
-
Supplementary file 1
Primer sequences.
Primers used for the generation and genotyping of the parasite lines presented in this study.
- https://cdn.elifesciences.org/articles/57572/elife-57572-supp1-v1.docx
-
Supplementary file 2
Amino acid sequences of the TRAP variants expressed by the parasite lines TRAP-I, MIC2-I, αX-I, αL-I, and RevCharge.
Shown are the sequences of each TRAP replacement. Residues that are part of the extendable ß-ribbon are written in green, residues that form the remainder of the I domain are written in red, residues of the thrombospondin domain are written in orange, and the remaining native residues of PbTRAP are written in black. Residues written in blue were introduced into wild type PbTRAP to generate a more negative charge on the portion of the I domain surface surrounding the MIDAS in the RevCharge mutant. Residues written in white on a black background were mutated to create a better fitting of the exchanged portion of the I domain with the N- and C-terminal segments of the PbTRAP I domain/extendable ß-ribbon. The calculated pI of the I domain region is shown in parentheses.
- https://cdn.elifesciences.org/articles/57572/elife-57572-supp2-v1.docx
-
Transparent reporting form
- https://cdn.elifesciences.org/articles/57572/elife-57572-transrepform-v1.pdf
Download links
A two-part list of links to download the article, or parts of the article, in various formats.
Downloads (link to download the article as PDF)
Open citations (links to open the citations from this article in various online reference manager services)
Cite this article (links to download the citations from this article in formats compatible with various reference manager tools)
Evolutionarily distant I domains can functionally replace the essential ligand-binding domain of Plasmodium TRAP
eLife 9:e57572.
https://doi.org/10.7554/eLife.57572


