On the importance of statistics in molecular simulations for thermodynamics, kinetics and simulation box size
- Computational Biomolecular Dynamics Group, Max-Planck Institute for Biophysical Chemistry, Germany
Figures
Figure 1
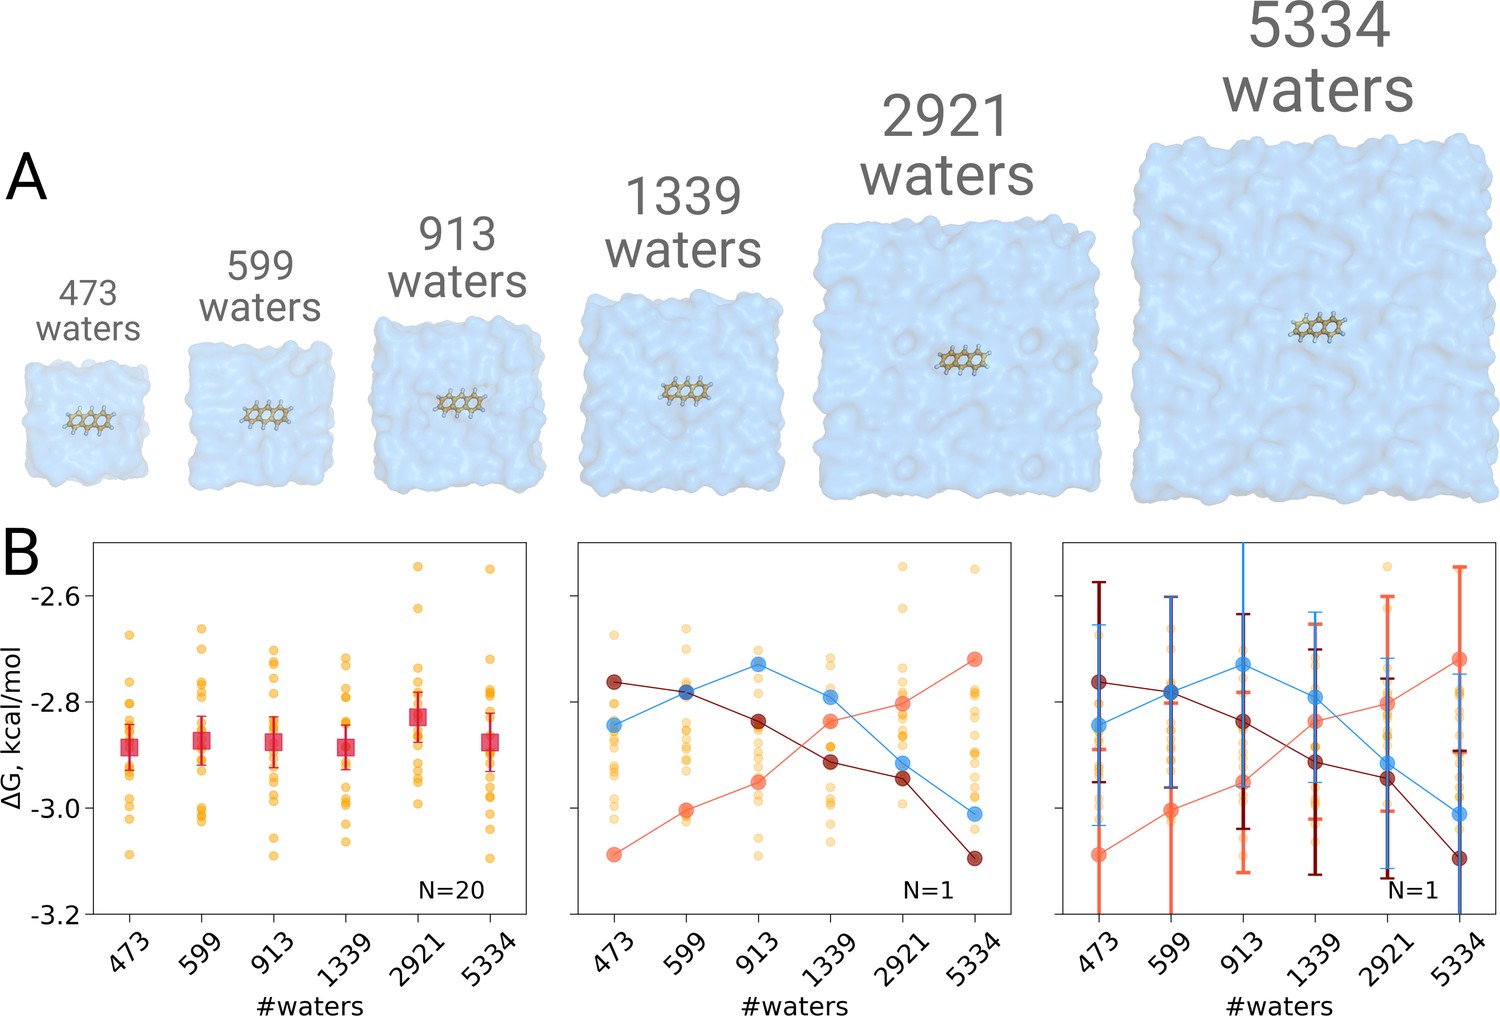
Solvation free energy of anthracene molecule.
The simulations were performed in boxes of 6 different sizes (A). We repeated the calculation 20 times for each simulation box. The outcome of each calculation is depicted as an orange circle in panels B and C. (B) Averages over 20 simulations together with the associated 95% confidence intervals reveal that there is no box size dependence for the solvation free energy (left panel). Three unlikely, yet possible, scenarios are depicted in the middle panel, where results from only one calculation per simulation box are considered. Given this insufficient (N = 1) sampling of solvation free energies, we could reach a false conclusion that the values increase, decrease or increase and then decrease with a larger simulation box. The right panel shows the same trends as in the middle panel, but the estimates have their 95% confidence intervals depicted as well: considering the statistical uncertainty illustrates that all the trends in terms of box size dependence based on anecdotal evidence are not statistically significant.
Figure 2
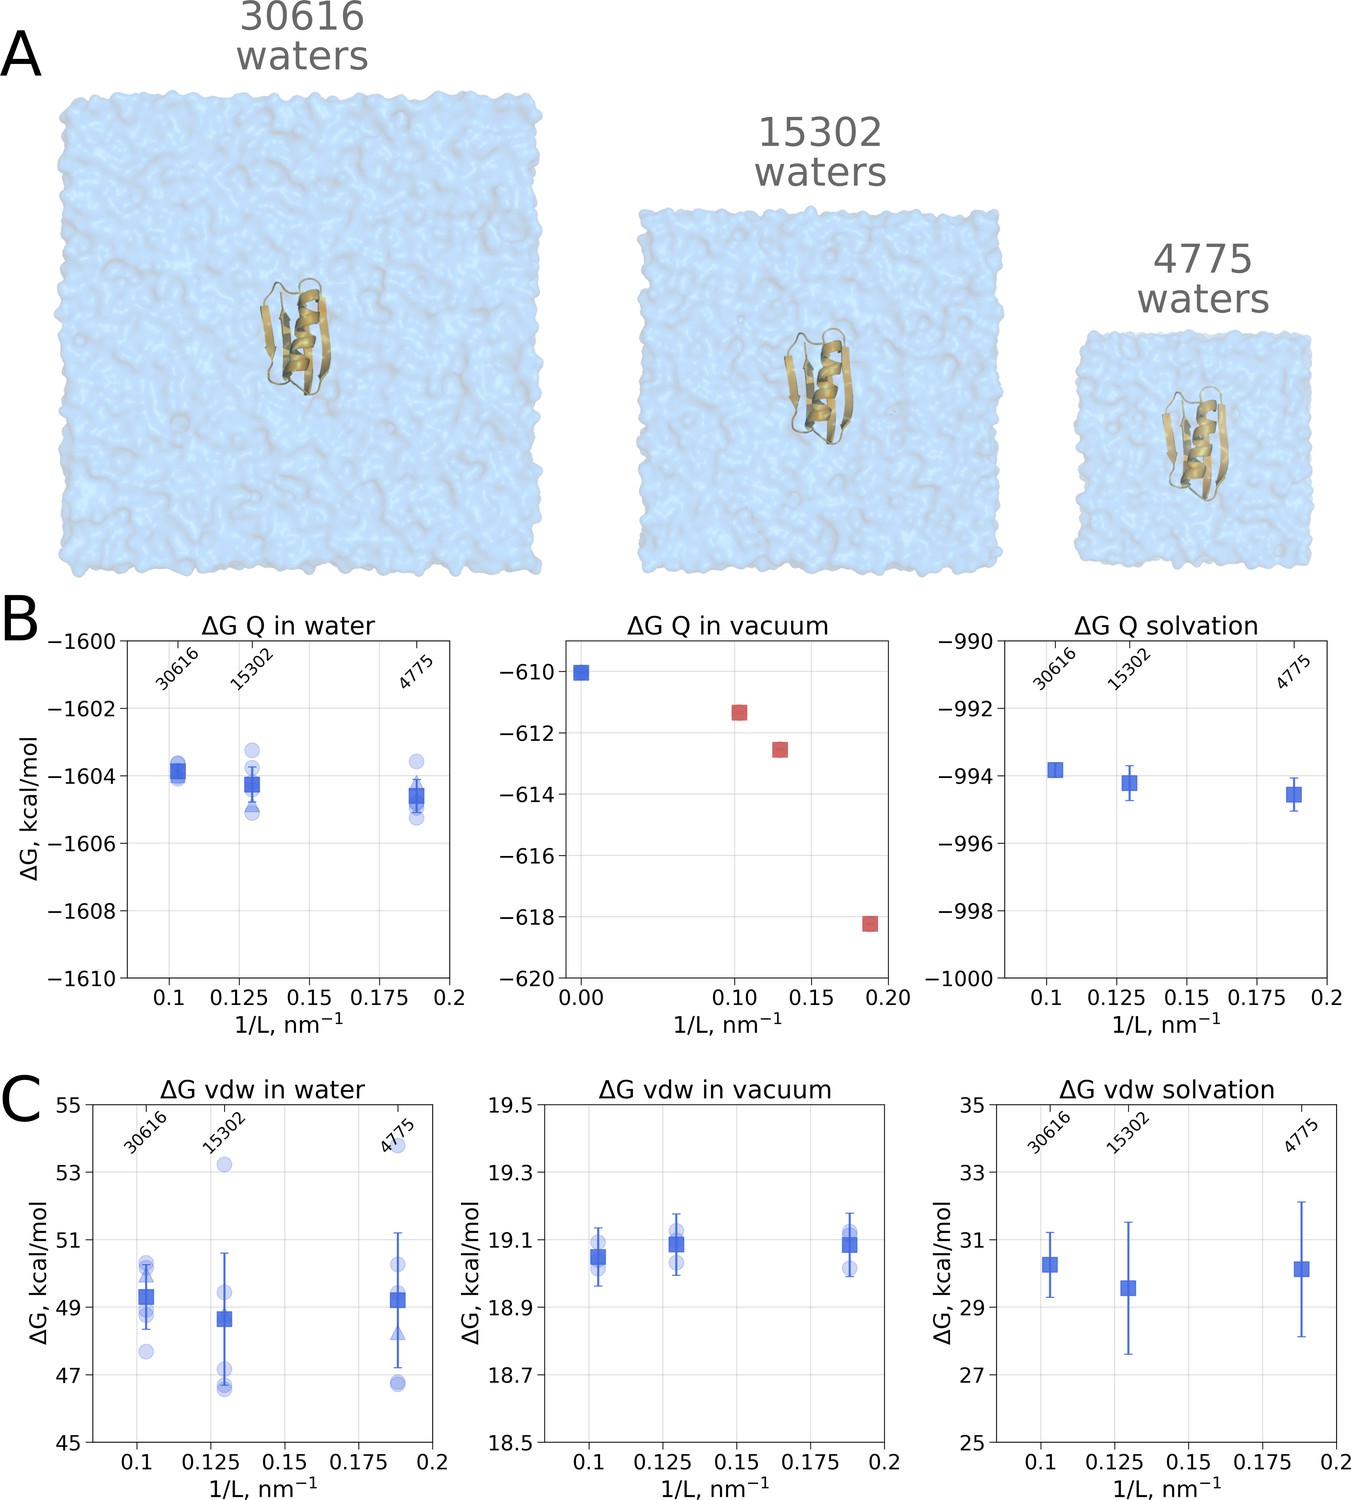
Contributions to the solvation free energy of the GB protein.
The protein was simulated in boxes of 3 different sizes (A). (B) Contribution to solvation from charge introduction in water (left), vacuum (middle) and (right). The latter term was calculated by considering a value (i.e. free energy of switching on protein charges in water) for each of the box sizes (left panel) and (i.e. free energy of switching on protein charges in the gas phase) calculated in the infinite box without periodic boundaries (blue square in the middle panel). Blue markers denote those cases that are box size independent, while red symbols are for the box size-dependent contributions to . (C) Contribution to solvation from switching on van der Waals interactions of the solute. In the panels (B) and (C) circles denote values obtained from individual free energy perturbation (FEP) calculations, triangle symbol marks those FEP runs where Hamiltonian replica exchange (HREX) was used, squares mark averages over the individual calculations. Upper x-axis marks the number of waters in the system.
Figure 3
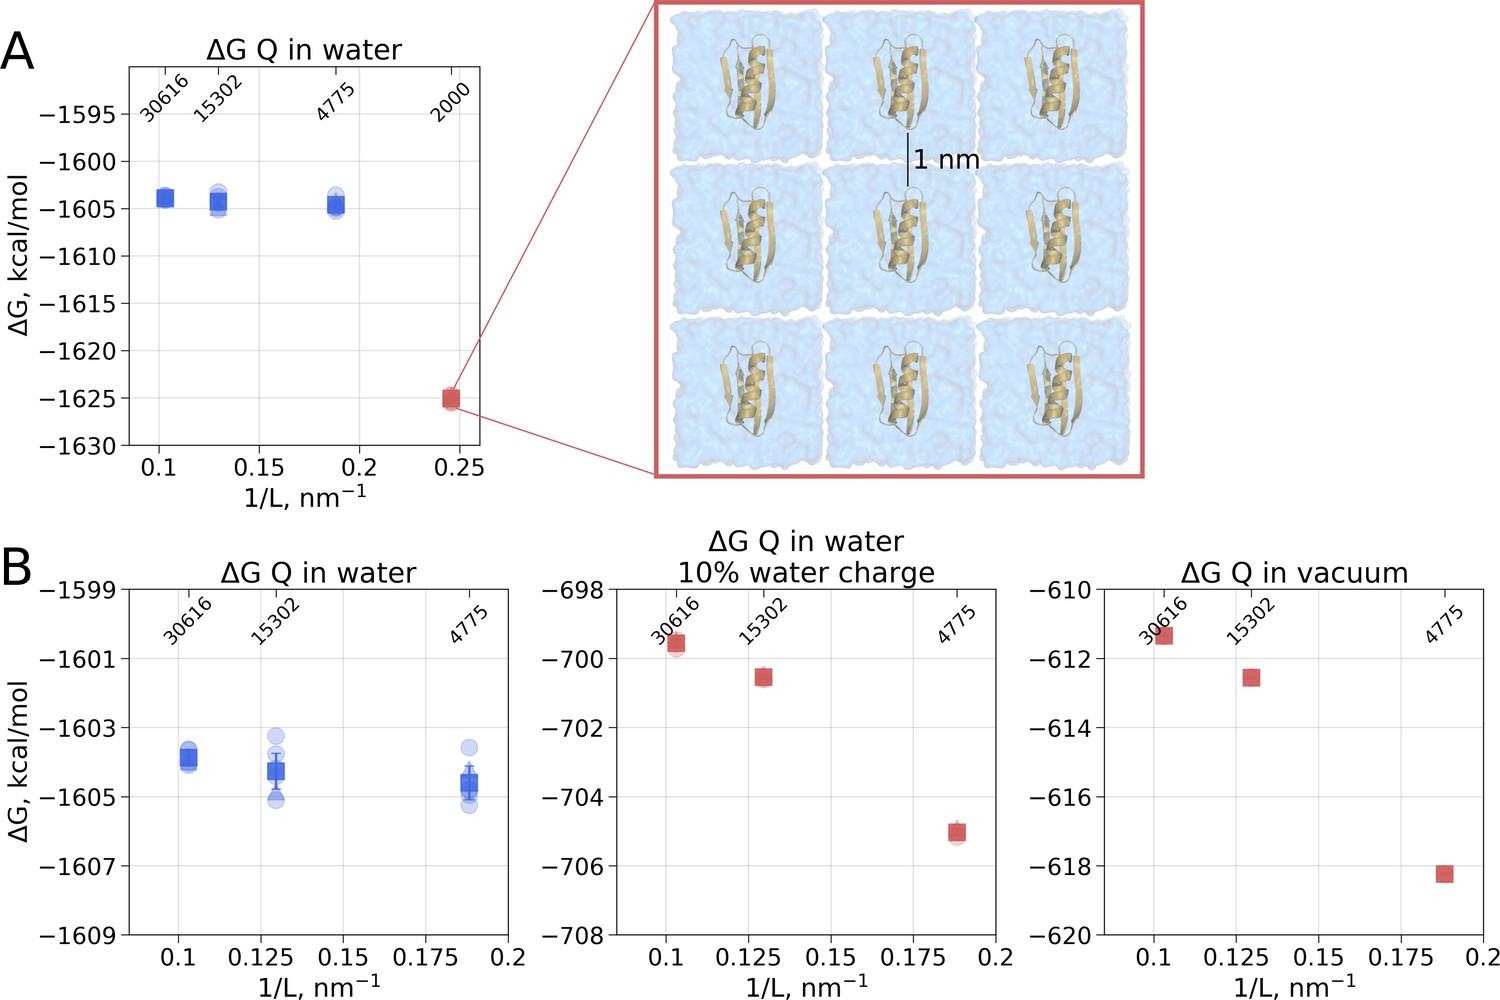
Illustration of artifacts introduced in the solvation calculation upon charge introduction.
(A) Strongly reduced simulation box size has an effect on the calculated value. Protein interactions with its periodic image and interactions of the solvation shells of the solute have a significant impact. (B) The effect of electrostatic screening by water molecules. The values in the panel on the left were obtained with the regular TIP3P water and show no box size dependence. Once water screening is reduced by scaling water charges to 10% of their original value (middle panel), the estimated values start approaching those obtained in vacuum simulations (right panel). In (A) and (B) blue markers denote those cases that are box size independent, while red symbols are for the box size-dependent Circles denote values obtained from individual free energy perturbation (FEP) calculations, triangle symbol marks those FEP runs where Hamiltonian replica exchange (HREX) was used, squares mark averages over the individual calculations. Upper x-axis marks the number of waters in the system.
Figure 4
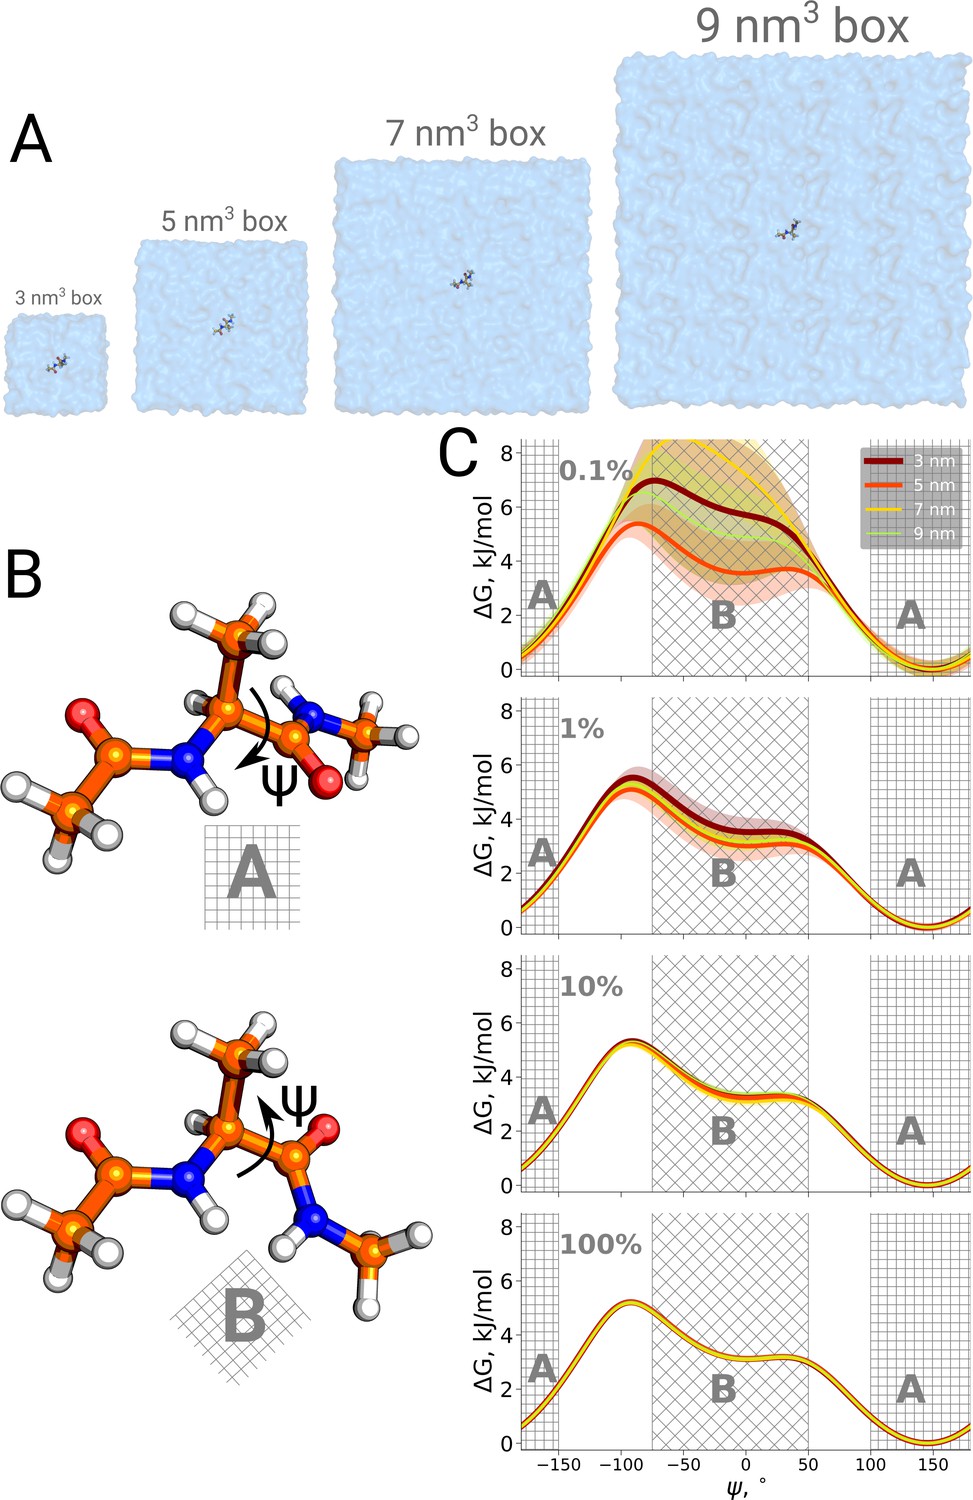
Potential of mean force for alanine dipeptide.
Alanine dipeptide was simulated in boxes of 4 different sizes (A). (B) The molecule undergoes a well defined transition characterized by rotation around its Ψ dihedral backbone angle. (C) Free energy profiles along the reaction coordinate: the Ψ dihedral angle. The sub-panels going from top to bottom depict profiles constructed from an increasing amount of simulation data: 0.1%, 1%, 10% and 100% of the whole available data. Uncertainties are depicted by shaded areas and represent standard errors obtained from 10 independent repeats.
Figure 5
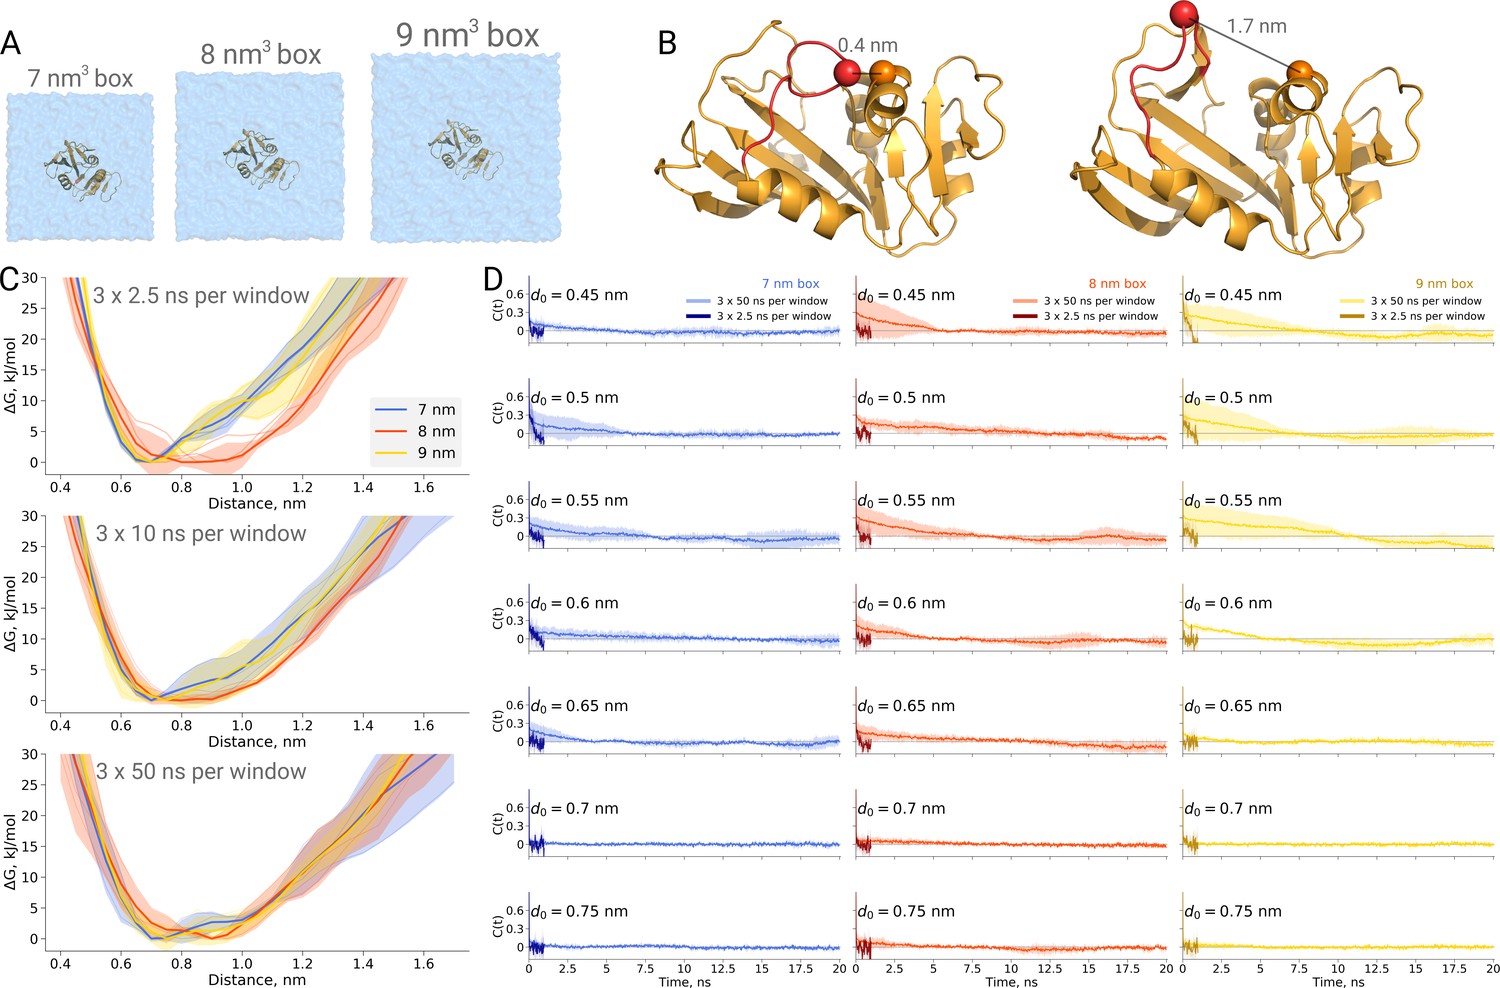
Thermodynamics of dihydrofolate reductase.
Dihydrofolate reductase was simulated in boxes of 3 different sizes (A). (B) The distance between Cα atoms of residues 18 and 45 was used as a reaction coordinate. Here, loop M20 is coloured in red. (C) Free energy profiles along the reaction coordinate were constructed from three simulation repeats. Upper panel: 2.5 ns sampling time of which 0.5 ns were discarded for equilibration. Middle panel: 10 ns sampling time of which 2 ns were discarded for equilibration. Bottom panel: 50 ns sampling time of which 10 ns were discarded for equilibration. (D) Autocorrelation times for the interatomic distance between Cα atoms of residues 18 and 45 for simulations in the boxes of different size. The plots in different rows correspond to the interatomic distances used for a harmonic restraint. The shaded areas denote 95% confidence intervals derived from the standard errors over three repeats assuming a normal distribution.
Figure 6
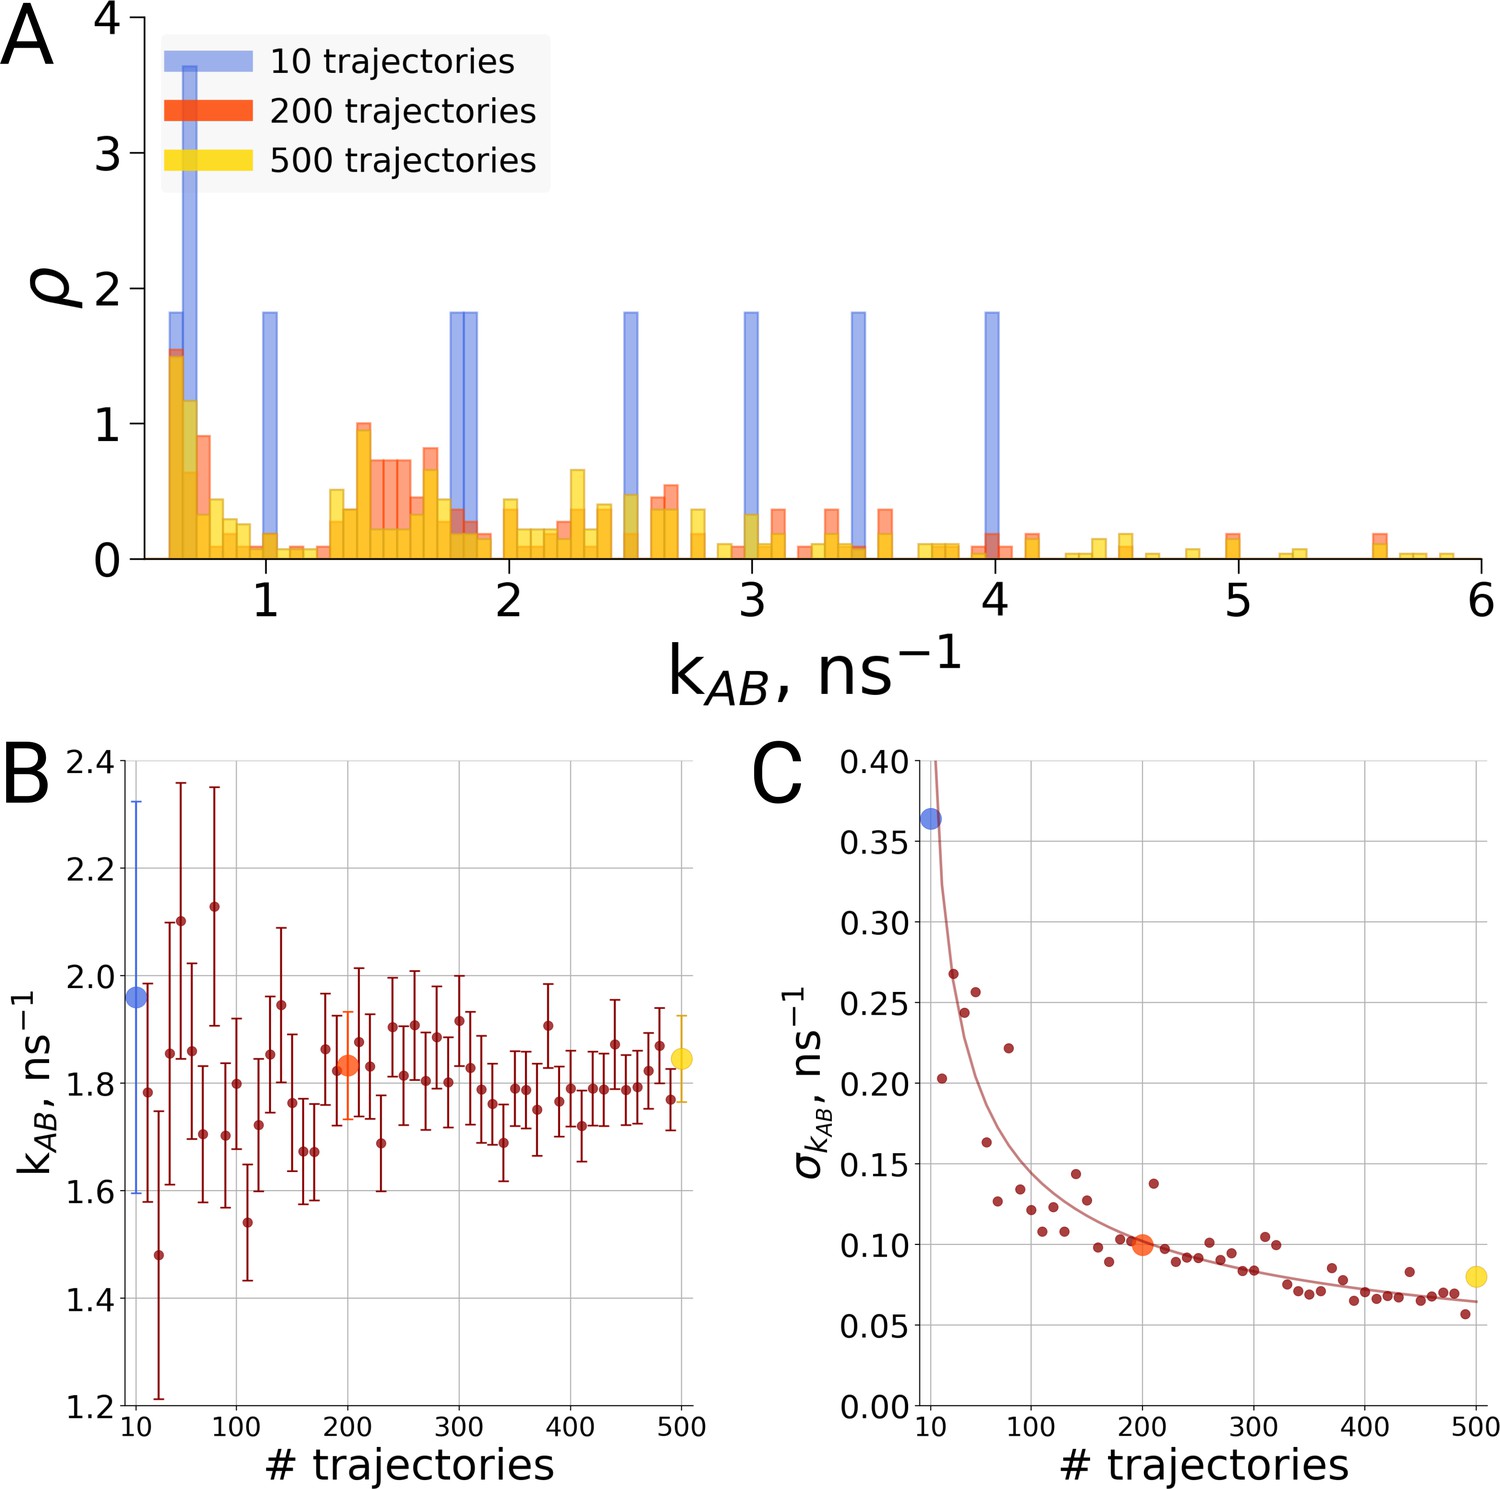
Rate estimate dependence on the number of transitions between the two main conformations of alanine dipeptide (backbone dihedral angle ψ is used as a reaction coordinate), the examined conformations are described in detail in Gapsys and de Groot, 2019.
Panel A shows a distribution of transition frequencies for sample sizes of 10, 200 and 500 trajectories. In B, the rate estimate is shown as a function of the number of trajectories and in C the associated uncertainty is plotted. In B and C the sample sizes of 10, 200 and 500 are highlighted with blue, orange and yellow spheres, respectively. The line in panel C depicts 1/, scaled to the least squares fit uncertainty.
Figure 7
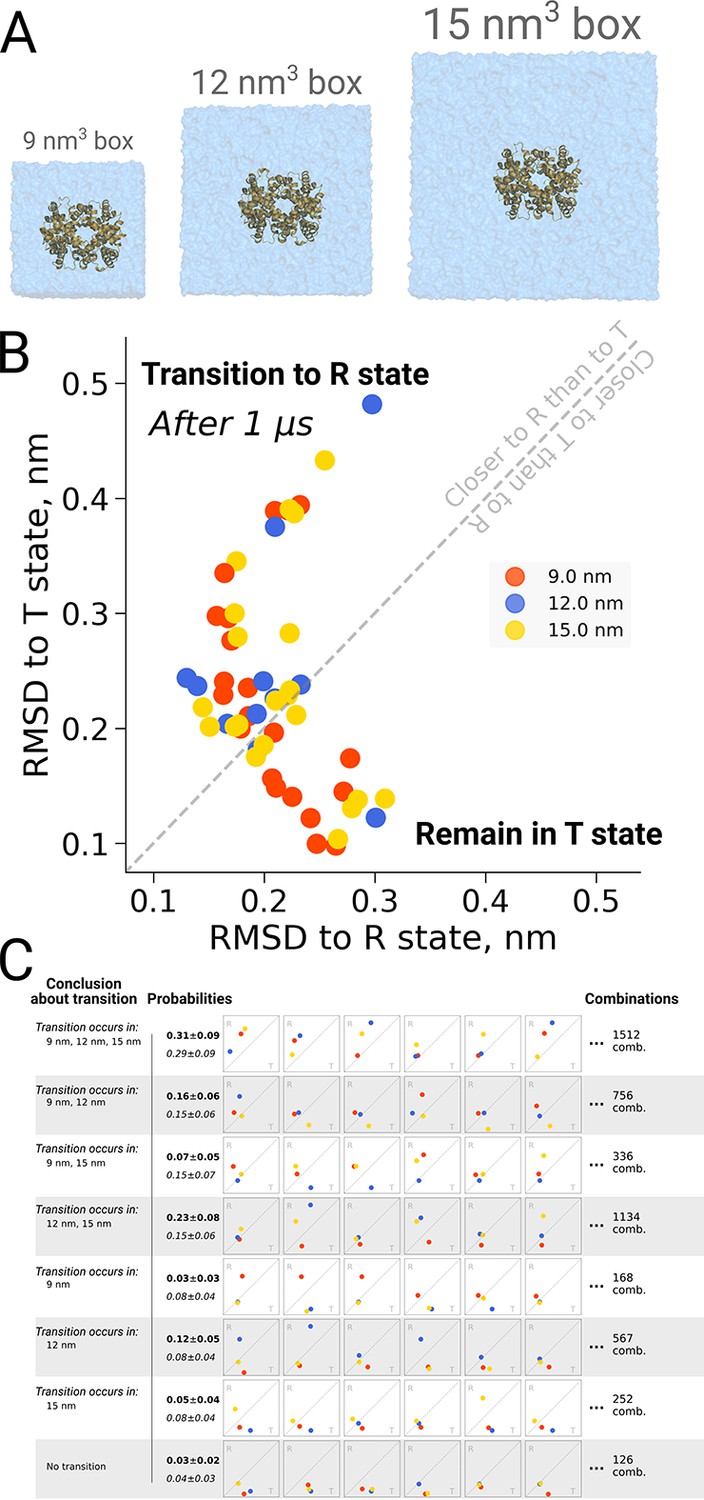
Hemoglobin kinetics.
The simulations of hemoglobin were performed in 3 different simulation boxes (A). Panel B depicts the end states in terms of RMSD to the R and T states after 1 μs of simulation. Here, we used the data from El Hage et al., 2018 and Gapsys and de Groot, 2019. In total, 21 simulations were considered in the 9 nm and 15 nm boxes, and 11 simulations in the 12 nm box. In panel C we illustrate the numerous combinations that could be obtained from these simulations if only one simulation per box had been performed. Each of those individual combinations could lead to one of 8 conclusions about the box size dependence of hemoglobin transitions: the probabilities for these conclusions based on the currently used data are provided in bold font. We also provide probabilities (italic font) for reaching the conclusions with a condition that the same transition in each of the simulation boxes occurs with the same probability (this probability was calculated by considering the data from all the simulation boxes together).
Figure 8

Hemoglobin T state half-life statistics.
The simulations in 3 differently sized boxes were considered (A). The average half-lives together with the associated standard errors were estimated for various numbers of trajectories. In panel B we demonstrate the 1/ behaviour of the standard errors with respect to the number N of the trajectories considered. The error bars in panel B denote standard errors indicating that the differences between the standard errors of the estimated half lives are statistically insignificant.
Figure 9
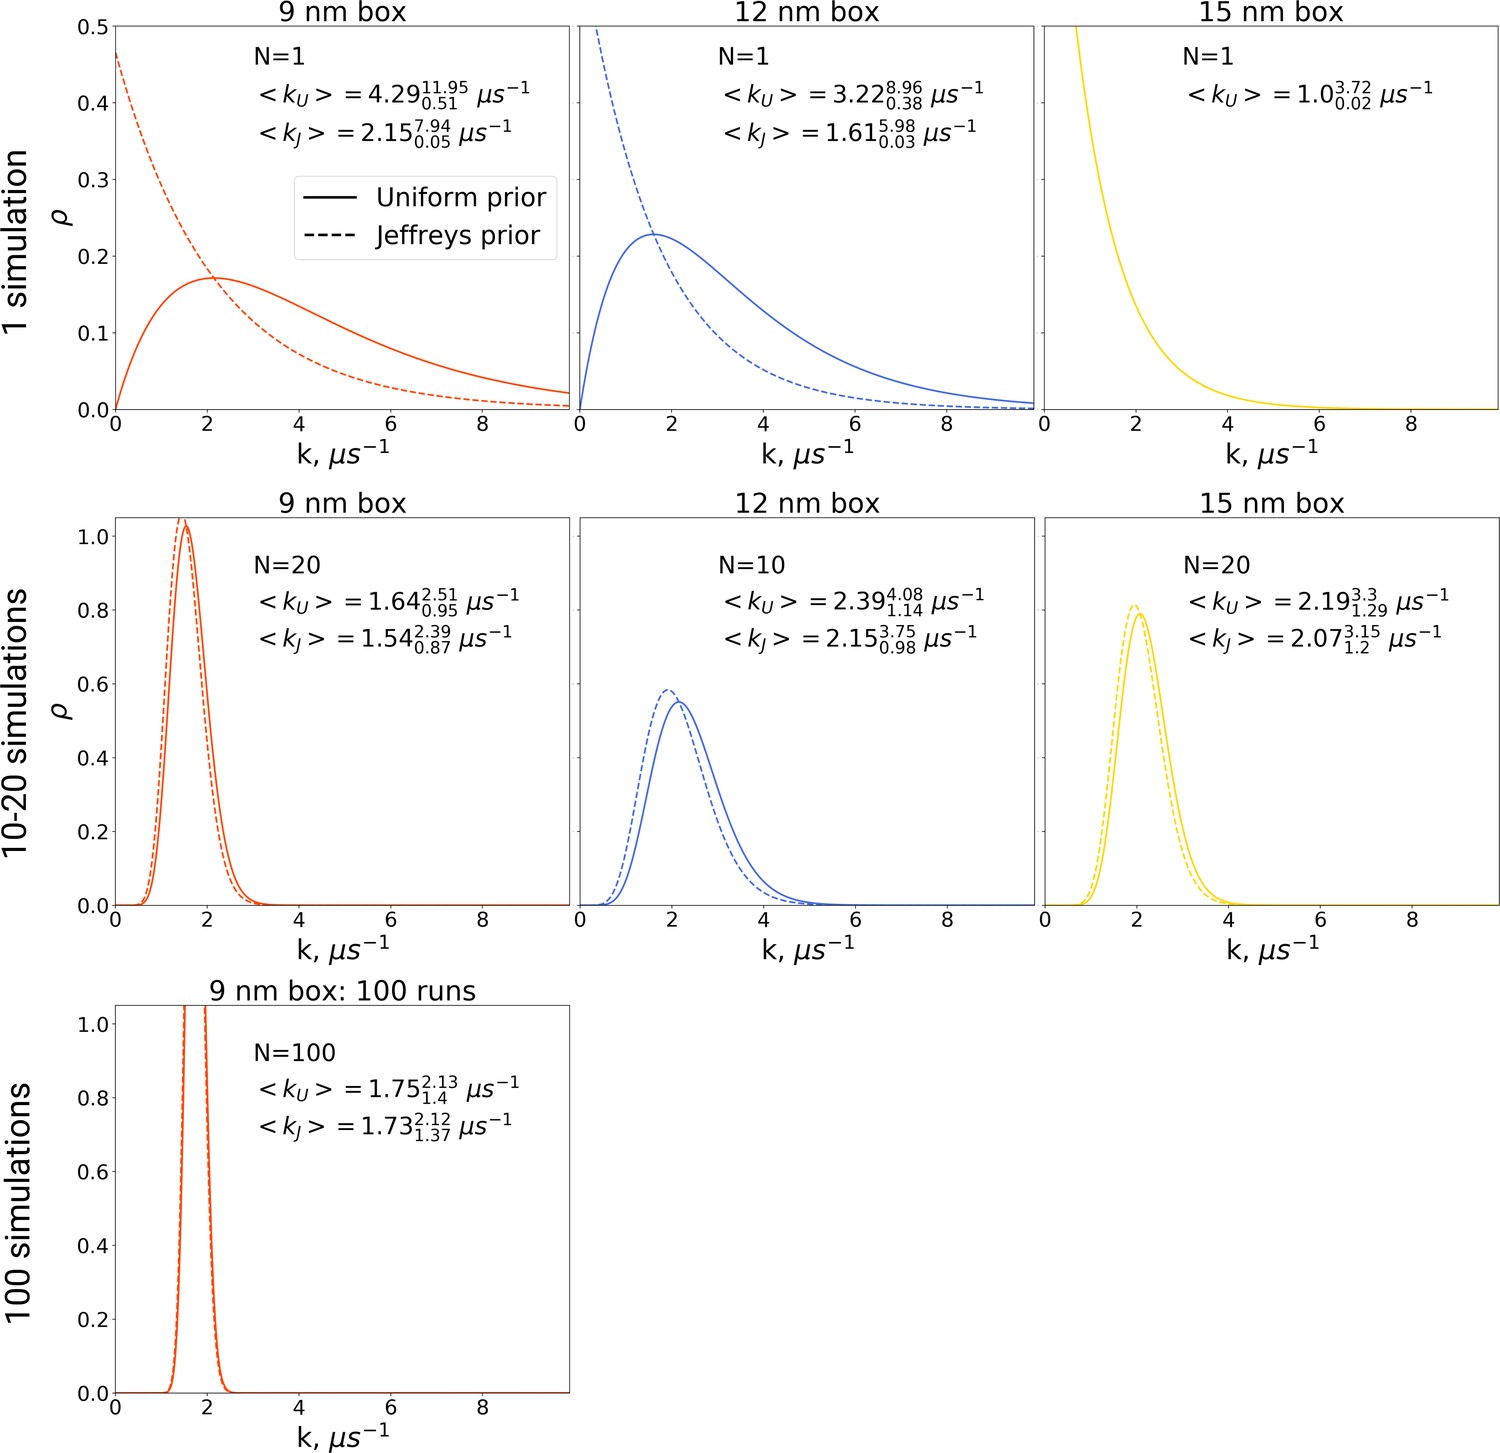
The rate constants for hemoglobin’s T to R transitions were estimated based on Bayesian formalism following the theory by Ensign and Pande, 2009.
The figure shows posterior distributions of the rate constants. Two priors were used: uniform (solid line, subscript U) and Jeffreys prior (dashed line, subscript J). Expected rate estimates with credible 95% intervals are reported in each panel. N marks the number of simulations used to construct the respective distributions. With more simulations performed, the rate constant distributions become narrower. As the Jeffreys prior is only applicable for the cases where at least one barrier crossing event is observed, for the El Hage et al., 2018 hemoglobin simulations in 15 nm box, where no transitions occurred (upper right panel), we only report the rate distribution based on the uniform prior.
Figure 10
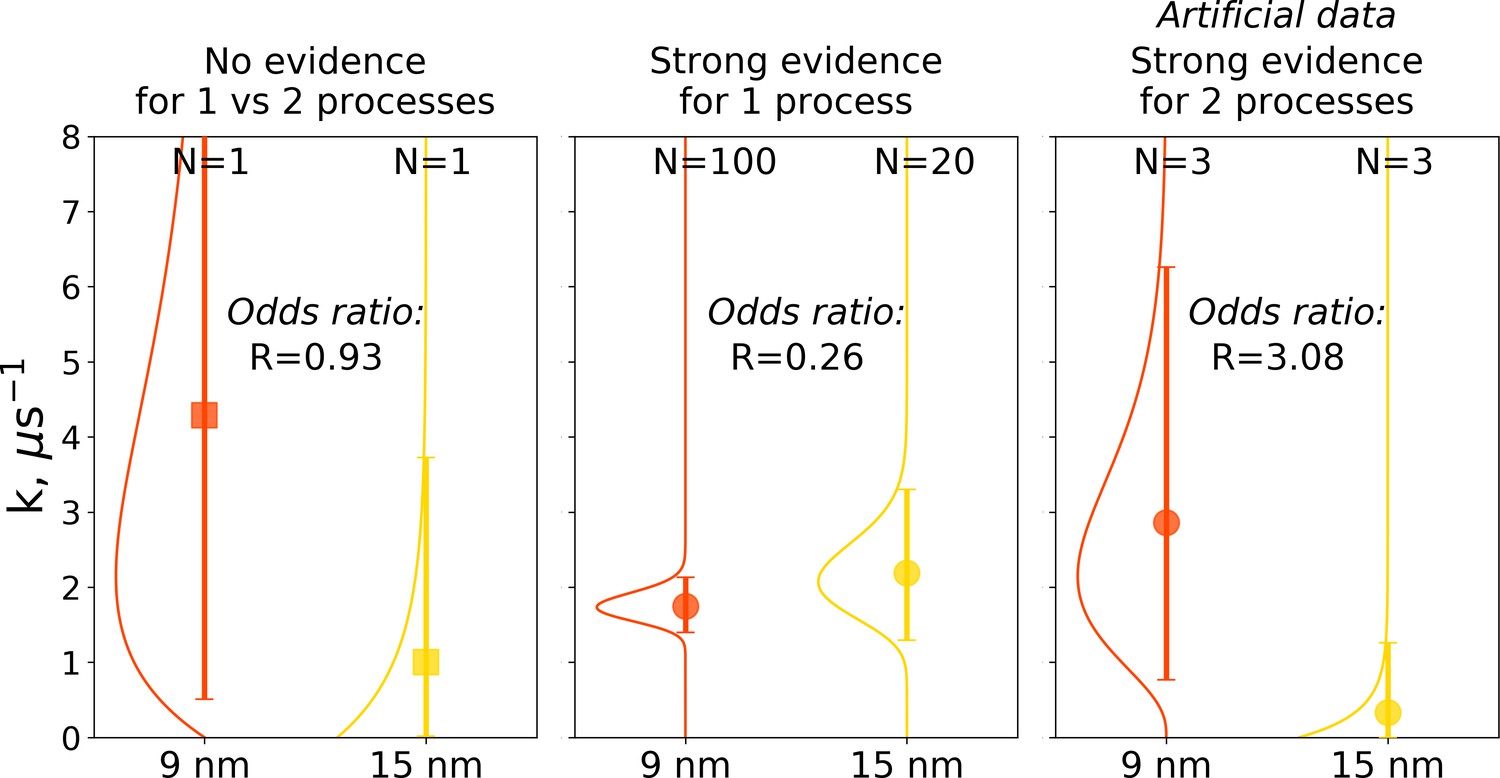
Illustration of Bayes factors (odds ratio) for three scenarios.
The panels show distributions, together with means and 95% credible intervals for hemoglobin’s T to R transition rate constant. The distributions were calculated based on the Bayesian formalism using a uniform prior. In the left panel, data from N = 1 simulations was used: the transition was observed after 0.466 μs in the smaller 9 nm box, but no transition in the larger 15 nm box occurred in 1 μs. In this case, the odds ratio is ∼1 indicating that the data provide no evidence to make a conclusion whether the kinetics in two boxes is governed by one or two disparate processes. The middle panel uses data from 100 simulations for the 9 nm box and 20 trajectories in 15 nm box: numerous transitions in both boxes have been observed within 1 μs. In this scenario, the odds ratio is lower than 0.33, hence providing strong evidence supporting the claim that the kinetics in both boxes is governed by one process. While distributions for the left and middle panels came directly from the simulation data reported in El Hage et al., 2018, Gapsys and de Groot, 2019 and from this work, for an illustration in the panel on the right, we needed to resort to an artificial hypothetical case, as none of the simulation data showed evidence for two separate processes governing kinetics in boxes of different size. Therefore, we constructed a synthetic data set where the observations that a transition in 9 nm box occurs in 0.466 μs and no transition happens in 15 nm box within 1 μs were repeated three times each. This resulted in an odds ratio larger than 3, providing strong evidence that the kinetics in the two boxes is governed by two distinct processes.
Figure 11
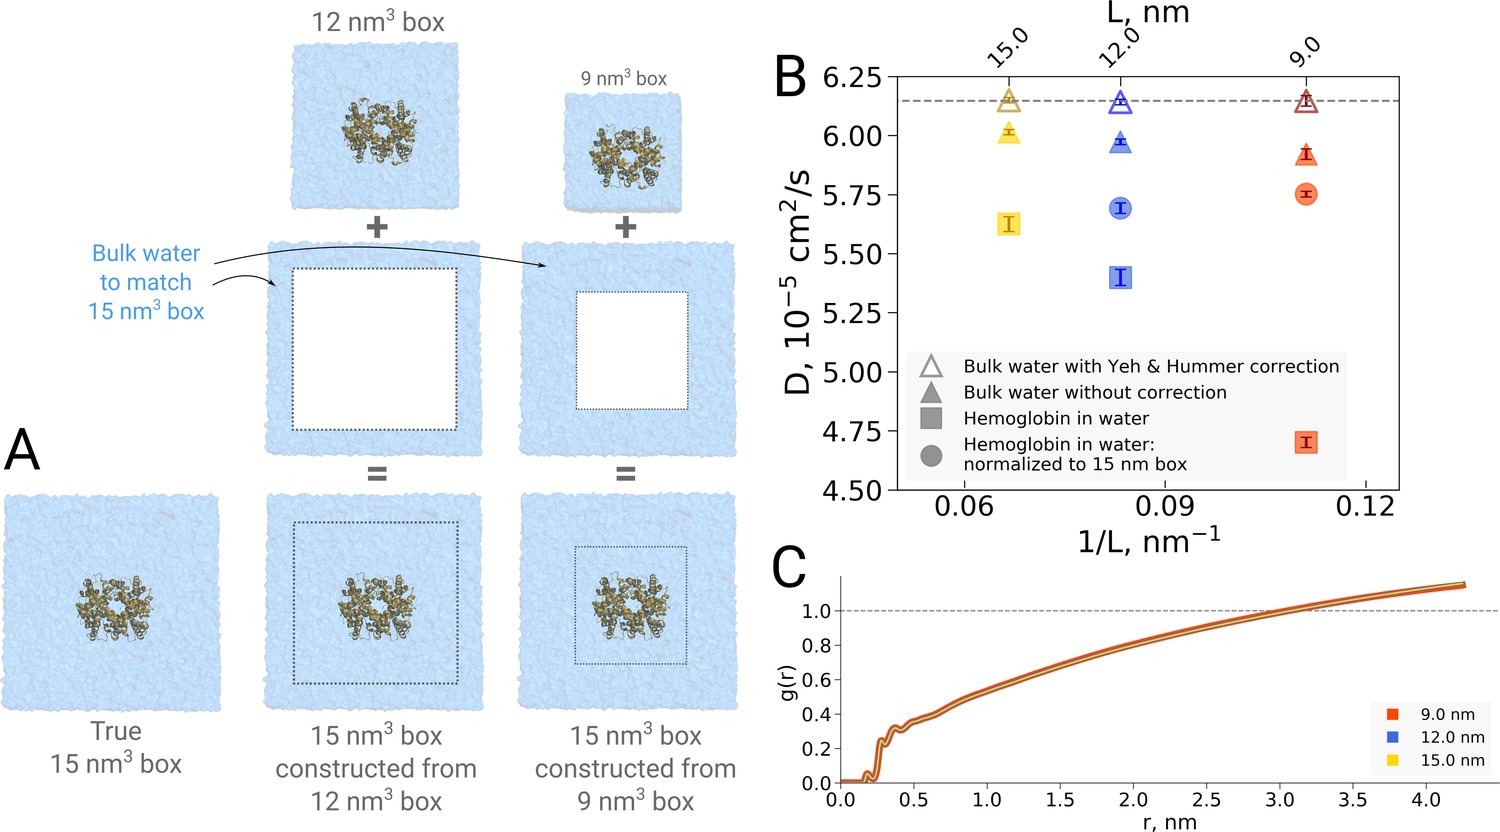
Normalization effects in the analysis of differently sized simulation boxes.
(A) Schematic illustration of the approximate normalization of water diffusion coefficients in smaller boxes against the largest box. Note that no actual rebuilding of simulation boxes was performed, but only the water diffusion coefficients in the smaller boxes were proportionally combined with the bulk water diffusion coefficients. (B) Water diffusion in simulation boxes of varying size. A small effect on the diffusion of bulk water (in the pure water simulations) is observed due to the periodic boundary effects, as described by Yeh and Hummer, 2004 (visualized as triangles). For the Yeh and Hummer correction, a shear water viscosity of kg m−1 s−1 was used. A much stronger effect on the water diffusion constant is observed when a large protein, in this case hemoglobin, is added to the simulation box (square symbols). The apparent strong box size effect manifests due to the fact that only little bulk water (capable of diffusing with the bulk-like diffusion constant) is present in the smaller boxes. To account for the difference in protein to water ratio the smaller boxes (9 nm and 12 nm) were renormalized to the level of 15 nm box by employing the value of bulk water diffusion weighted by the difference in the number of water molecules between the smaller boxes and 15 nm box (circle symbols). The dashed line markes the bulk water diffusion value for water simulation in 9 nm box. (B) Water radial distribution function (RDF) for differently sized hemoglobin boxes, normalized to a sphere of 8.5 nm diameter.
Author response image 1
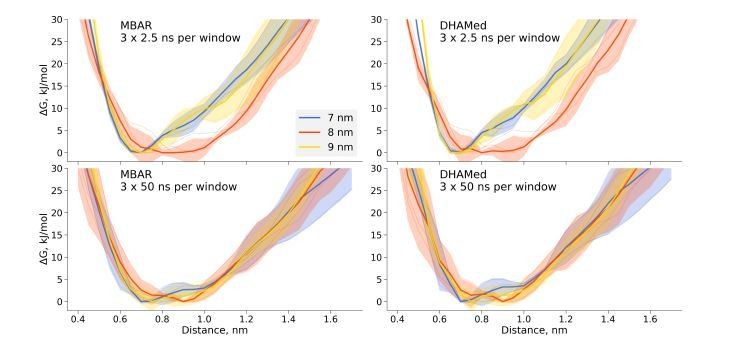
Comparison of the free energy profiles for dihydrofolate reductase as obtained by MBAR and DHAMed.
Tables
Table 1
Odds ratio (Bayes factors) for assessing whether the transitions in simulations of differently sized boxes were governed by disparate processes.
The interpretation of the Bayes factors follows the description by Jeffreys, 1961; Kass and Raftery, 1995.
| Box size | Number of | Odds favouring | Jeffreys conclusion |
|---|---|---|---|
| simulations | two processes | ||
| 9 nm vs 12 nm | 1 vs 1 | 1.25 | barely worth mentioning |
| 9 nm vs 15 nm | 1 vs 1 | 0.93 | barely worth mentioning |
| 12 nm vs 15 nm | 1 vs 1 | 1.03 | barely worth mentioning |
| 9 nm vs 12 nm | 20 vs 10 | 0.43 | barely worth mentioning |
| 9 nm vs 15 nm | 20 vs 20 | 0.38 | barely worth mentioning |
| 12 nm vs 15 nm | 10 vs 20 | 0.33 | substantial evidence for one process |
| 9 nm vs 12 nm | 100 vs 10 | 0.33 | substantial evidence for one process |
| 9 nm vs 15 nm | 100 vs 20 | 0.26 | substantial evidence for one process |
Additional files
Download links
A two-part list of links to download the article, or parts of the article, in various formats.
Downloads (link to download the article as PDF)
Open citations (links to open the citations from this article in various online reference manager services)
Cite this article (links to download the citations from this article in formats compatible with various reference manager tools)
On the importance of statistics in molecular simulations for thermodynamics, kinetics and simulation box size
eLife 9:e57589.
https://doi.org/10.7554/eLife.57589


