Endothelial TGF-β signaling instructs smooth muscle cell development in the cardiac outflow tract
- Department of Developmental Genetics, Max Planck Institute for Heart and Lung Research, Germany
- Scientific Service Group Microscopy, Max Planck Institute for Heart and Lung Research, Germany
- Bioinformatics and Deep Sequencing Platform, Max Planck Institute for Heart and Lung Research, Germany
Figures
Figure 1 with 5 supplements
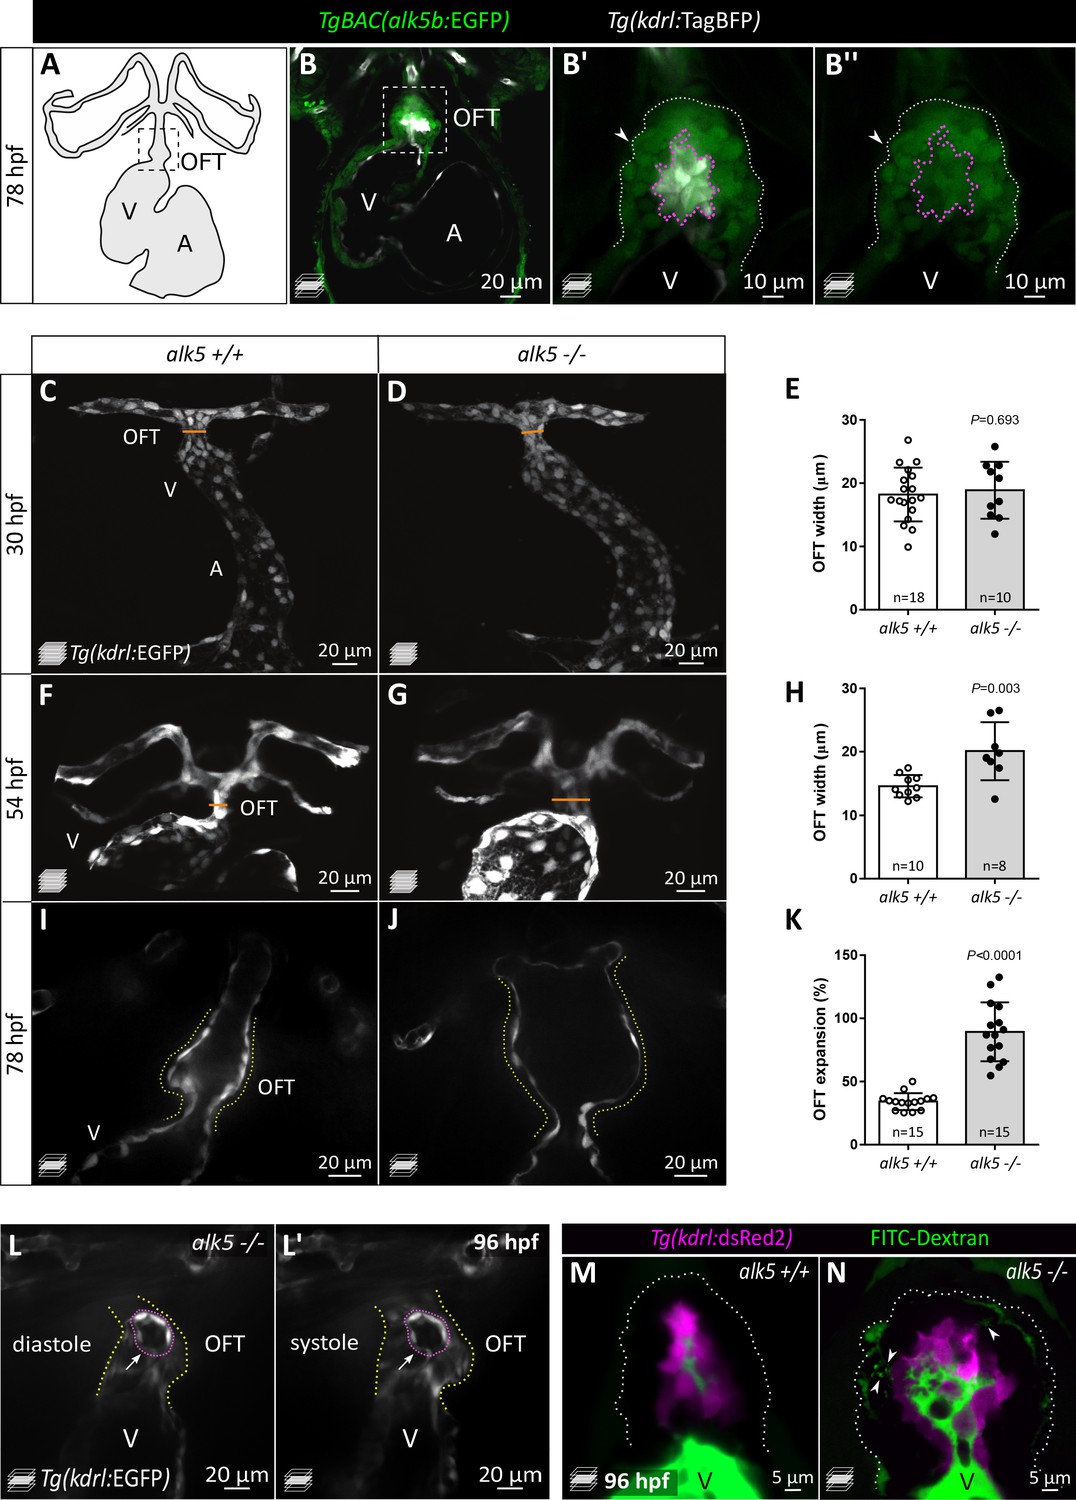
Loss of Alk5 function causes specific defects in cardiac OFT formation.
(A) Schematic of the zebrafish heart and connecting vessels at 78 hpf; ventral view; black, endothelium/endocardium. (B–B’’) Confocal images showing TgBAC(alk5b:EGFP) expression (green) in the 78 hpf zebrafish heart. White, ECs; arrowheads, SMCs; boxed area shown in B’ and B’’; white dotted lines outline the OFT; magenta dotted lines outline ECs. (C–H) Confocal images (C, D, F, G) and quantification (E, H) of OFT width in alk5+/+ and alk5-/- embryos at 30 (C–E) and 54 (F–H) hpf. Orange line shows OFT width graphed in E and H. (I–K) Frames of confocal movies of beating hearts (I, J) and quantification of OFT expansion (K) at 78 hpf. For details about the quantifications, see Materials and methods ‘Defining the landmarks of the OFT’. (L, L’) Frames of confocal movies of 96 hpf alk5-/- beating hearts during ventricular diastole (L) and systole (L’). Pink dotted lines outline ECs surrounding the rupture; arrows point to the site of EC rupture; yellow dotted lines outline the OFT. (M, N) Confocal images of 96 hpf alk5+/+ and alk5-/- OFTs showing the accumulation (arrowheads) of FITC-Dextran (green) between the SMCs in alk5-/- OFTs (7/11; alk5+/+ 0/10). Magenta, ECs; dotted lines outline the OFT. (C–G) Maximum intensity projections. (B, I–N) Single confocal planes. (E, H, K) Plot values represent mean ± SD; p values from t-tests. A- atrium, V- ventricle. Scale bars: (B, C–L’) 20 μm; (B’, B’’) 10 μm; (M, N) 5 μm. See also Figure 1—figure supplement 1.
Figure 1—figure supplement 1
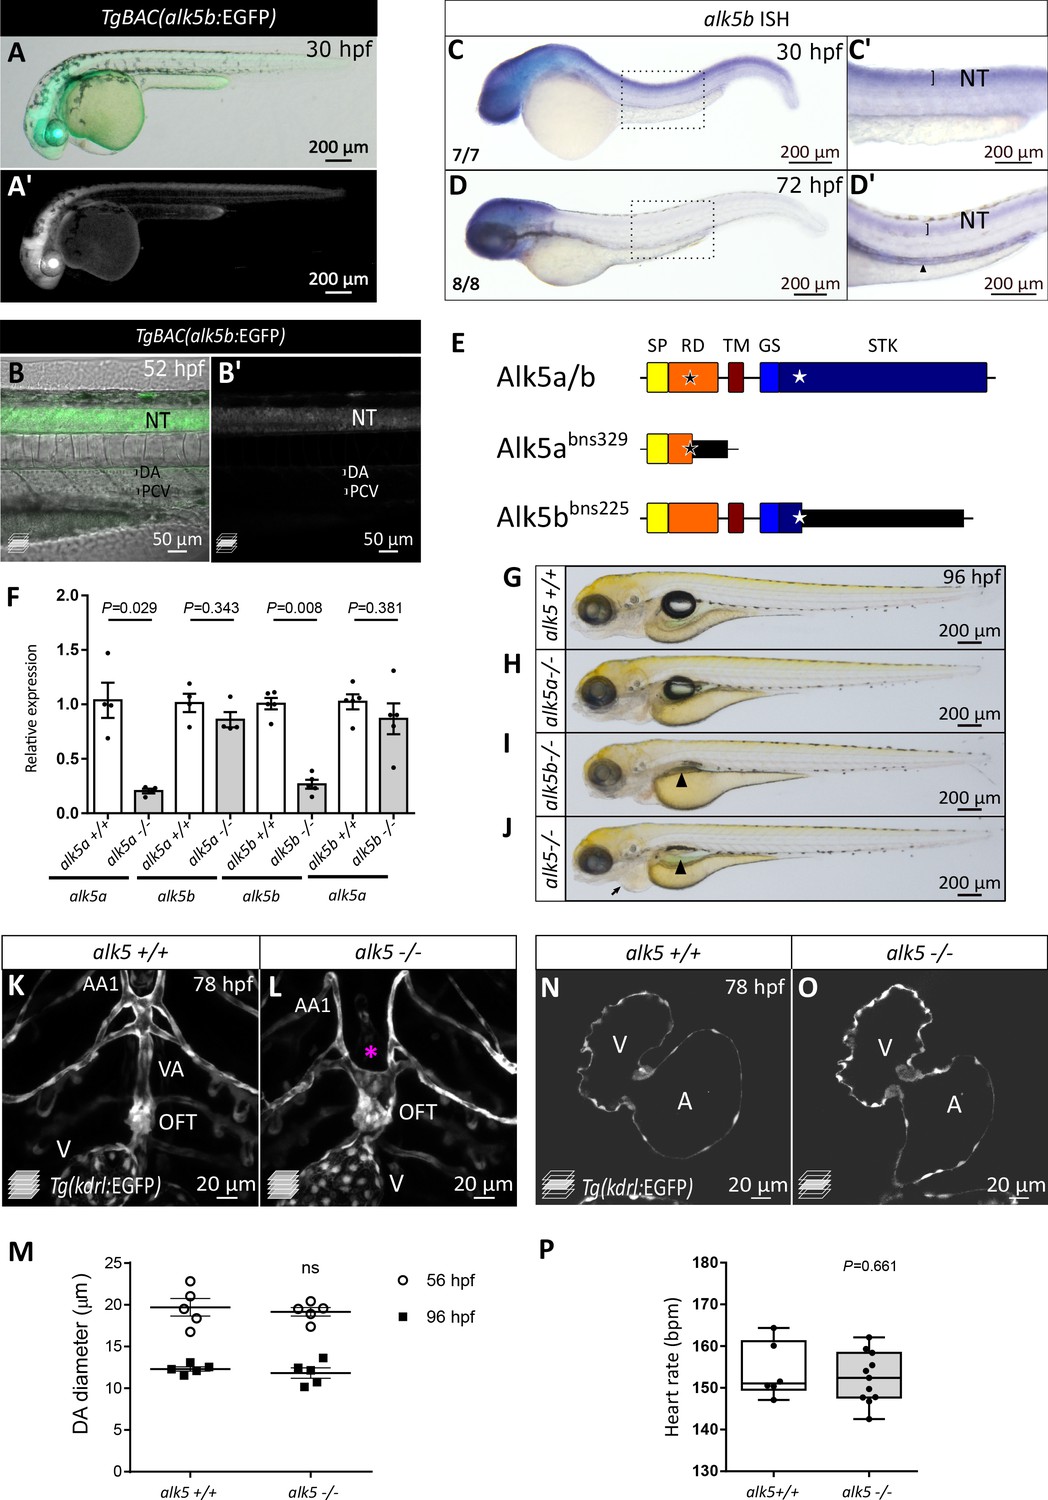
alk5 expression and function in zebrafish embryos and larvae.
(A–B’) Confocal images showing TgBAC(alk5b:EGFP) expression (green/white) in 30 (A) and 52 (B) hpf zebrafish embryos. Expression is high in the neural tube (NT, B). (C–D’) in situ hybridization showing the expression of alk5b in 30 and 72 hpf animals. Arrowhead, gut; boxed areas shown in C’ and D’. (E) Schematics of wild-type and mutated Alk5 proteins. Black and white stars indicate the site of the corresponding mutations in alk5a and alk5b, respectively, and the black rectangle represents new sequence downstream of the mutation. (F) alk5a and alk5b mRNA levels in 30 hpf alk5+/+, alk5a-/- and alk5b-/- embryos; means ± SD; p values from Mann Whitney tests; average Ct values are listed in Supplementary file 2. (G–J) Brightfield images of 96 hpf alk5+/+, alk5a-/-, alk5b-/-, and alk5-/- larvae. Arrowheads, lack of swim bladder; arrow, pericardial edema. (K–L) Confocal images of OFT and connecting vessels in 78 hpf alk5+/+ and alk5-/- larvae (n > 30). Asterisk, absence of the VA in alk5 mutants. (M) Quantification of DA diameter in 56 and 96 hpf alk5+/+ and alk5-/- animals. The same animals were analyzed at the two different time-points; means ± SD. (N, O) Confocal images of 78 hpf alk5+/+ and alk5-/- hearts (n > 30). (P) Quantification of heart rate in 78 hpf alk5+/+ (n = 6) and alk5-/- (n = 11) larvae; means ± SD; p values from Mann Whitney test. SP- signal peptide, RD- receptor domain, TM- transmembrane domain, GS- glycine-serine rich domain, STK- serine-threonine kinase domain, A- atrium, V- ventricle, NT- neural tube, DA- dorsal aorta, PCV- posterior cardinal vein, VA- ventral artery, AA1- aortic arch 1. Scale bars: (A, A’, C-D’ G-J) 200 μm; (B, B’) 50 μm; (K–O) 20 μm.
Figure 1—video 1
Confocal video of the beating heart of a Tg(kdrl:EGFP) alk5+/+ larva at 78 hpf, showing the OFT expansion.
Figure 1—video 2
Confocal video of the beating heart of a Tg(kdrl:EGFP) alk5-/- larva at 78 hpf, showing the OFT expansion.
Figure 1—video 3
Brightfield video of the beating heart of the alk5+/+ and alk5-/- larvae shown in Figure 1—videos 1 and 2 at 78 hpf, showing blood flow in the OFT.
Figure 1—video 4
Confocal video of the beating heart of a Tg(kdrl:EGFP) alk5-/- larva at 96 hpf, showing a hole in the endothelial lining of the OFT.
Arrow points to the site of EC rupture.
Figure 2 with 1 supplement

p-Smad3 is observed in OFT ECs at 24 hpf and reduced in alk5 mutants.
(A, A’) 24 hpf Tg(kdrl:EGFP) alk5+/+ hearts immunostained for p-Smad3 (white). Green, ECs; magenta, CMs. (B, C) Intensity ratio of p-Smad3 immunostaining (normalized to DAPI) between ECs and surrounding cells at 24 and 75 hpf (B) and between OFT ECs and heart ECs in 24 hpf alk5+/+ embryos (C). Every dot represents the ratio for one embryo. (D–E’) 24 hpf Tg(kdrl:EGFP) alk5+/+ (D) and alk5-/- (E) hearts immunostained for p-Smad3 (white). (F) Quantification of p-Smad3 immunostaining (normalized to DAPI) in ECs and surrounding cells comparing 24 hpf alk5+/+ and alk5-/- OFTs. (G–J) Confocal images of the OFT in 75 hpf Tg(kdrl:EGFP) alk5+/- (alk5a-/-;alk5b+/-; G, H) and alk5-/- (I, J) larvae treated with DMSO (G, I) or SIS3 (H, J) from 36 until 75 hpf. Asterisks point to the absence of the VA. (K) OFT maximum area in 75 hpf larvae treated with DMSO or SIS3. (A–J) Dotted lines outline the OFT ECs. (B, C, F, K) Plot values represent means ± SD; p values from Mann Whitney (B, K) and t-test (F). In K, p values refer to the comparisons highlighted. Scale bars: (A, A’, D–E’) 20 μm; (G–J) 15 μm. See also Figure 2—figure supplement 1 and Figure 2—source data 1 and 2.
-
Figure 2—source data 1
Quantification of p-Smads immunostaining in 24 and 75 hpf wild-type animals.
Related to Figure 2 and Figure 2—figure supplement 1.
- https://cdn.elifesciences.org/articles/57603/elife-57603-fig2-data1-v1.xlsx
-
Figure 2—source data 2
Quantification of p-Smads immunostaining in 24 hpf alk5+/+ and alk5-/- embryos.
Related to Figure 2 and Figure 2—figure supplement 1.
- https://cdn.elifesciences.org/articles/57603/elife-57603-fig2-data2-v1.xlsx
Figure 2—figure supplement 1
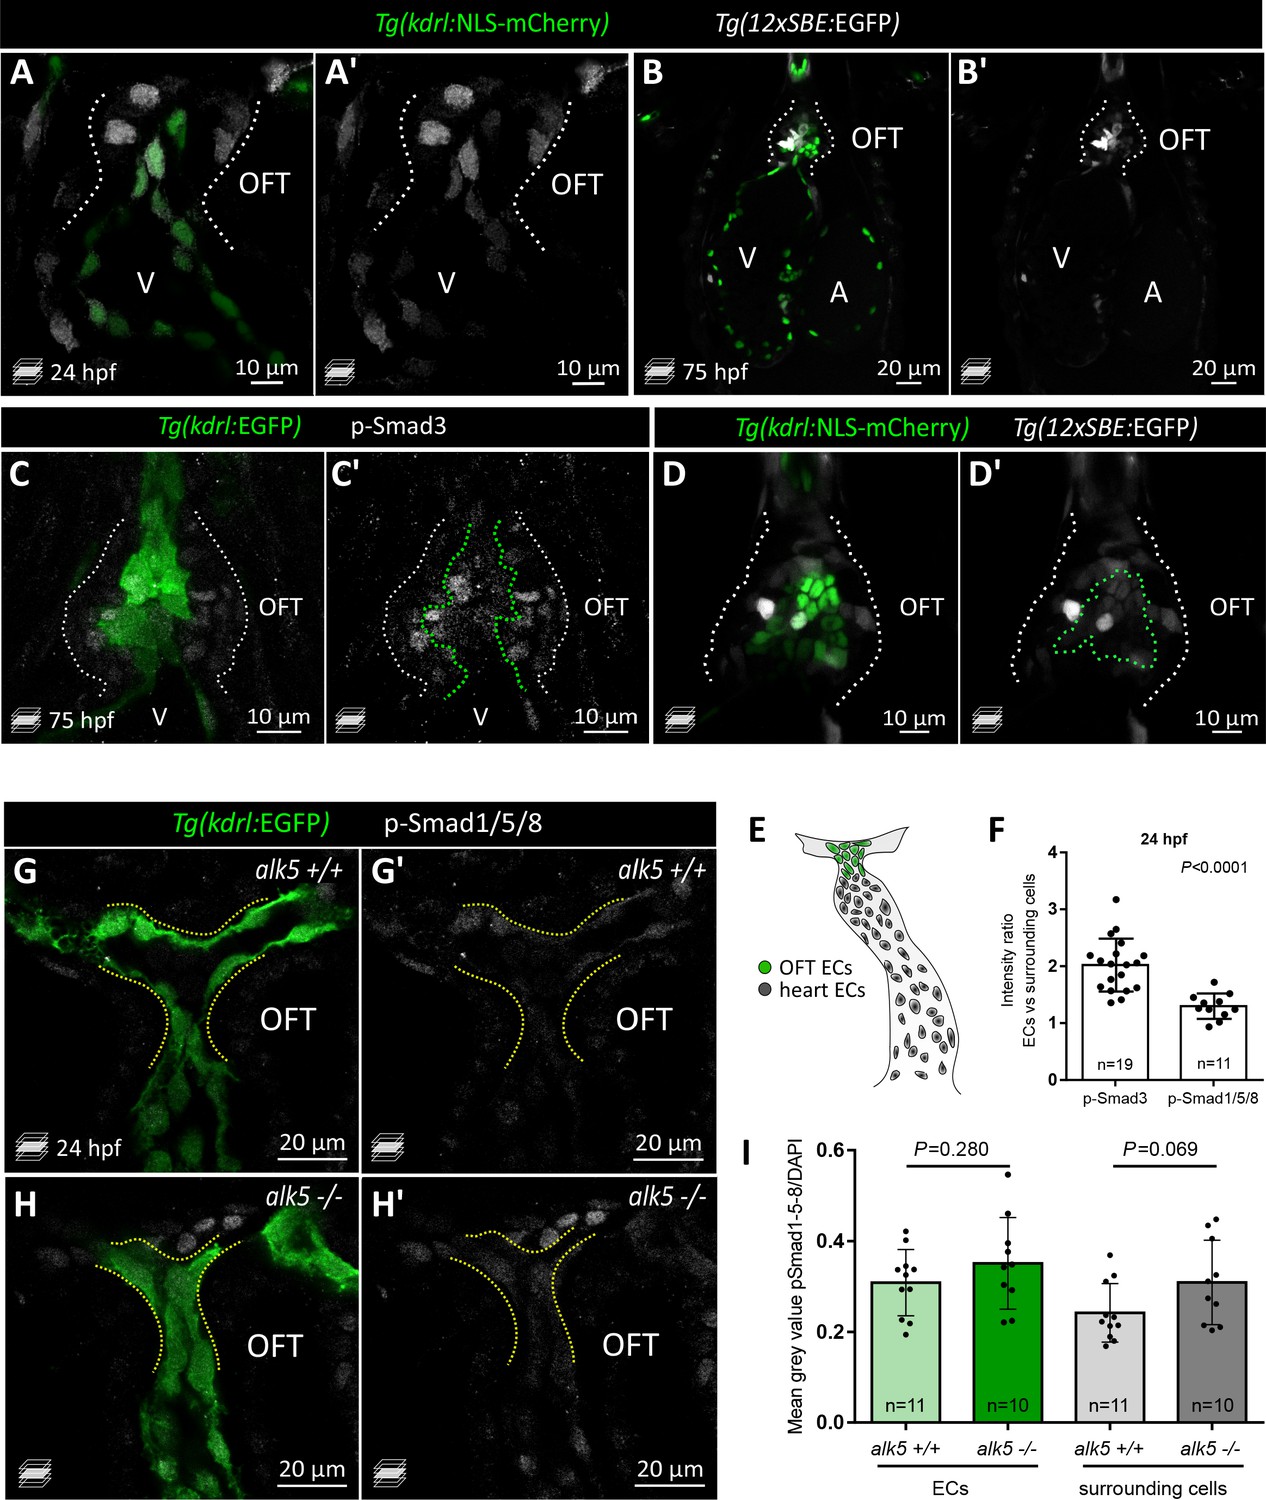
Evidence for p-Smad3 presence and function in OFT ECs at 24 hpf, but no evidence for p-Smad1/5/8 presence.
(A–B’) Confocal images showing Tg(12xSBE:EGFP) expression (white) in 24 (A) and 75 (B) hpf hearts. Green, ECs; white dotted lines outline the OFT. (C–D’) Confocal images of 75 hpf wild-type larvae immunostained for p-Smad3 (white, C) or showing Tg(12xSBE:EGFP) expression (white, D); white dotted lines outline the OFT; green dotted lines outline the ECs. (E) Schematics of a 36 hpf heart showing ECs inside (OFT ECs) and outside (heart ECs) the OFT quantified in Figure 2C. (F) Intensity ratio of p-Smad3 and p-Smad1/5/8 immunostaining (normalized to DAPI) between ECs and surrounding cells in the OFT at 24 hpf. Every dot represents the ratio of ECs vs surrounding cells in each embryo. (G–H’) 24 hpf Tg(kdrl:EGFP) alk5+/+ (G) and alk5-/- (H) hearts immunostained for p-Smad1/5/8 (white). Dotted lines outline OFT ECs. (I) Quantification of p-Smad1/5/8 immunostaining (normalized to DAPI) in ECs and surrounding cells comparing 24 hpf alk5+/+ and alk5-/- OFTs. (F, I) Plot values represent means ± SD; p values from t-tests. Scale bars: (A, A’, C–D’) 10 μm; (B, B’, G–H’) 20 μm.
Figure 3 with 3 supplements
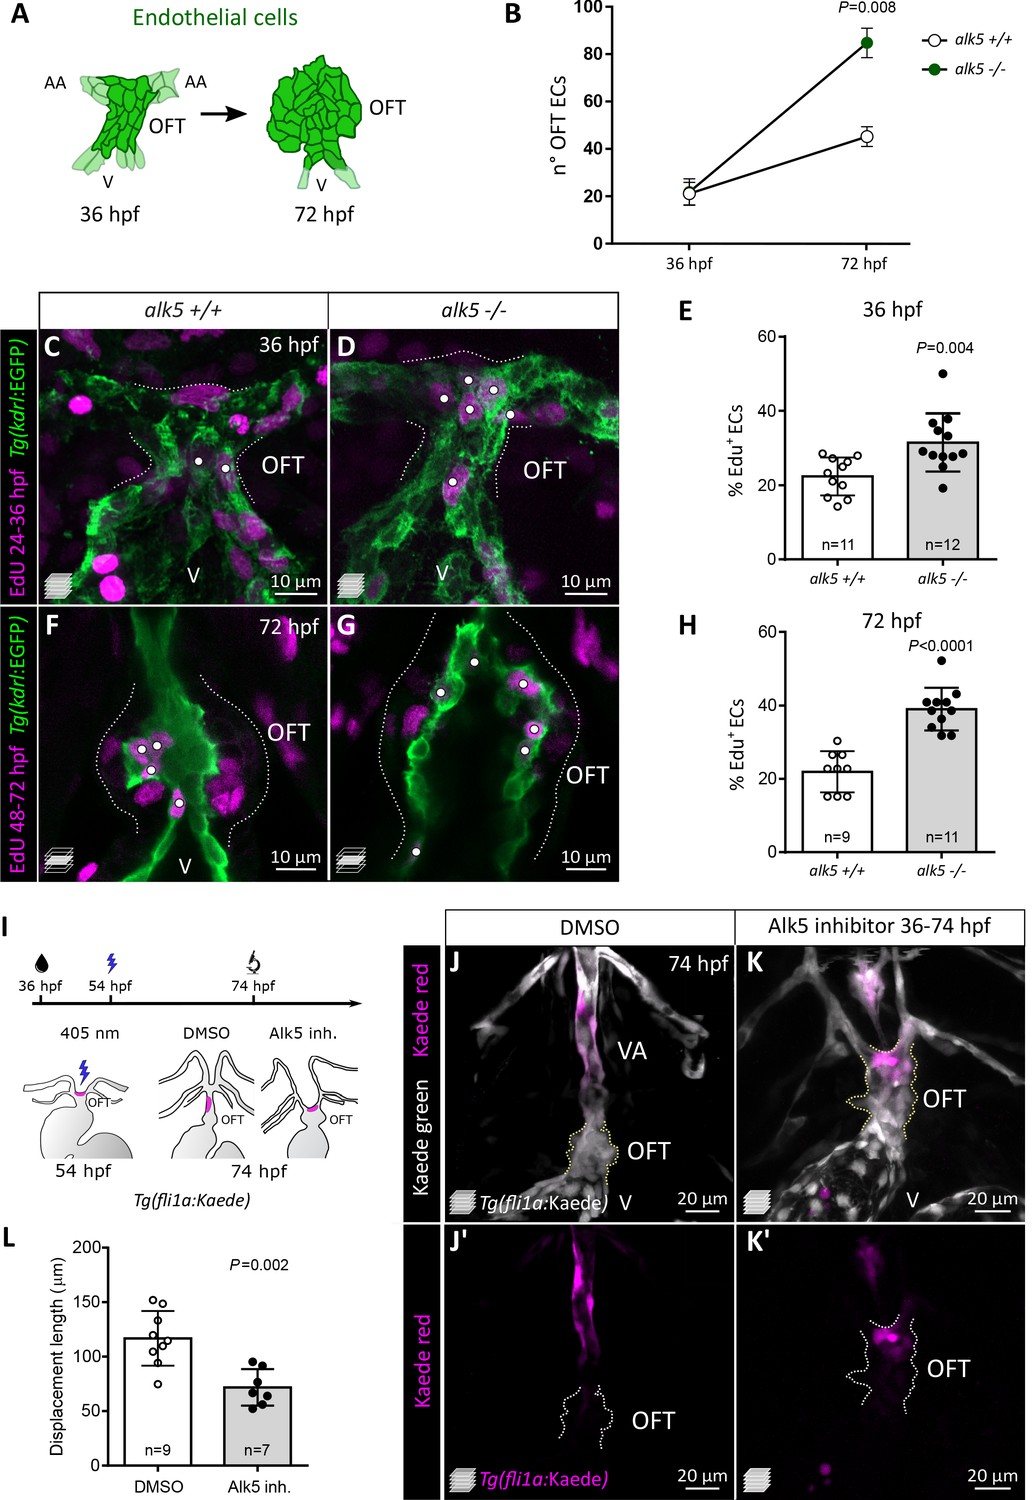
Alk5 restricts EC proliferation in the cardiac OFT and is required for ventral aorta formation.
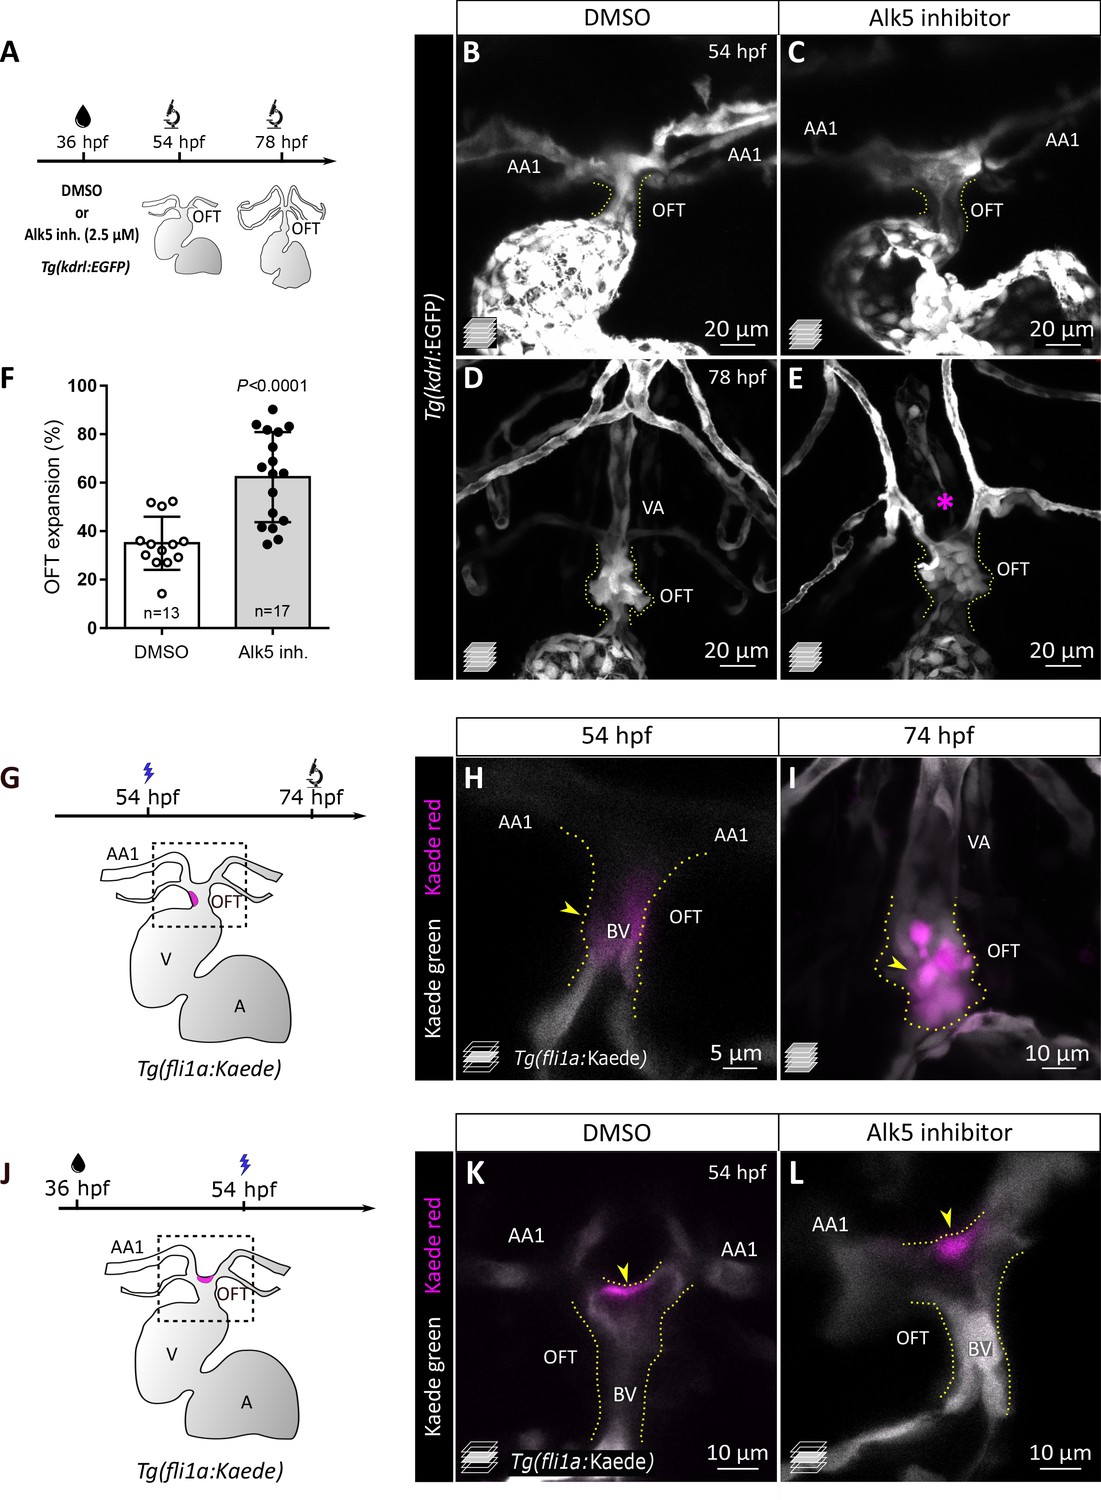
(A) Schematics of OFT ECs at 36 and 72 hpf. (B) Quantification of EC number (darker cells shown in A) in 36 and 72 hpf alk5+/+ and alk5-/- OFTs (36 hpf: n = 11; 72 hpf: n = 6). (C–H) Confocal images (C, D, F, G) and quantification (E, H) of the percentage of EdU+ ECs in Tg(kdrl:EGFP) alk5+/+ and alk5-/- OFTs. Dotted lines outline the OFT; white dots mark EdU+ ECs. All the other EdU+ cells in the OFT region are kdrl:EGFP-. (I) Protocol used for photoconversion experiment. (J–K’) Confocal images of the OFT in 74 hpf Tg(fli1a:Kaede) larvae treated with DMSO or Alk5 inhibitor. Magenta, photoconverted ECs; dotted lines outline the OFT. (L) Quantification of the distance covered by photoconverted ECs between 54 and 72 hpf in DMSO and Alk5 inhibitor-treated larvae. (C, D, J–K’) Maximum intensity projections. (F, G) Single confocal planes. (B, E, H, L) Plot values represent means ± SD; p values from t-tests (E, H) or Mann Whitney (B, L). Scale bars: (C-G) 10 μm; (J–K’) 20 μm. See also Figure 3—figure supplement 1.
Figure 3—figure supplement 1
Phenocopy of alk5 mutants by Alk5 inhibitor treatment.
(A) Protocol used for Alk5 inhibitor treatments. (B–E) Confocal images of Tg(kdrl:EGFP) animals treated with DMSO or Alk5 inhibitor starting at 36 hpf and analyzed at 54 (B, n = 11; C, n = 11) or 78 (D, n = 13; E, n = 17) hpf. Asterisk, absence of the VA in Alk5 inhibitor-treated larvae. (F) Percentage of OFT expansion in 78 hpf control and Alk5 inhibitor-treated larvae; means ± SD; p value from t-test. For details about the quantifications, see Materials and methods ‘Defining the landmarks of the OFT’. (G) Schematics of the area photoconverted in H. (H, I) Confocal images of untreated photoconverted Tg(fli1a:Kaede) embryos at 54 (H, n = 5) and 74 (I, n = 5) hpf. (J) Schematics of the area photoconverted in K and L. (K, L) Confocal images of 54 hpf photoconverted Tg(fli1a:Kaede) DMSO (n = 9) or Alk5 inhibitor treated (n = 7) embryos. (H–L) Magenta, photoconverted ECs in the OFT (yellow arrowheads). (B–L) Dotted lines outline the OFT. (H, K, L) Single confocal planes. (B–E, I) Maximum intensity projections. AA1- 1° aortic arch, VA- ventral artery, BV- bulbo-ventricular canal. Scale bars: (B-E) 20 μm; (I–L) 10 μm; (H) 5 μm.
Figure 3—video 1
Time lapse-imaging of a Tg(fli1a:Kaede) fish treated with DMSO starting at 36 hpf and imaged from 56 to 74 hpf.
Magenta, photoconverted cell.
Figure 3—video 2
Time lapse-imaging of a Tg(fli1a:Kaede) fish treated with Alk5 inhibitor starting at 36 hpf and imaged from 56 to 74 hpf.
Magenta, photoconverted cell.
Figure 4
Alk5 regulates SMC and ECM organization in the cardiac OFT.
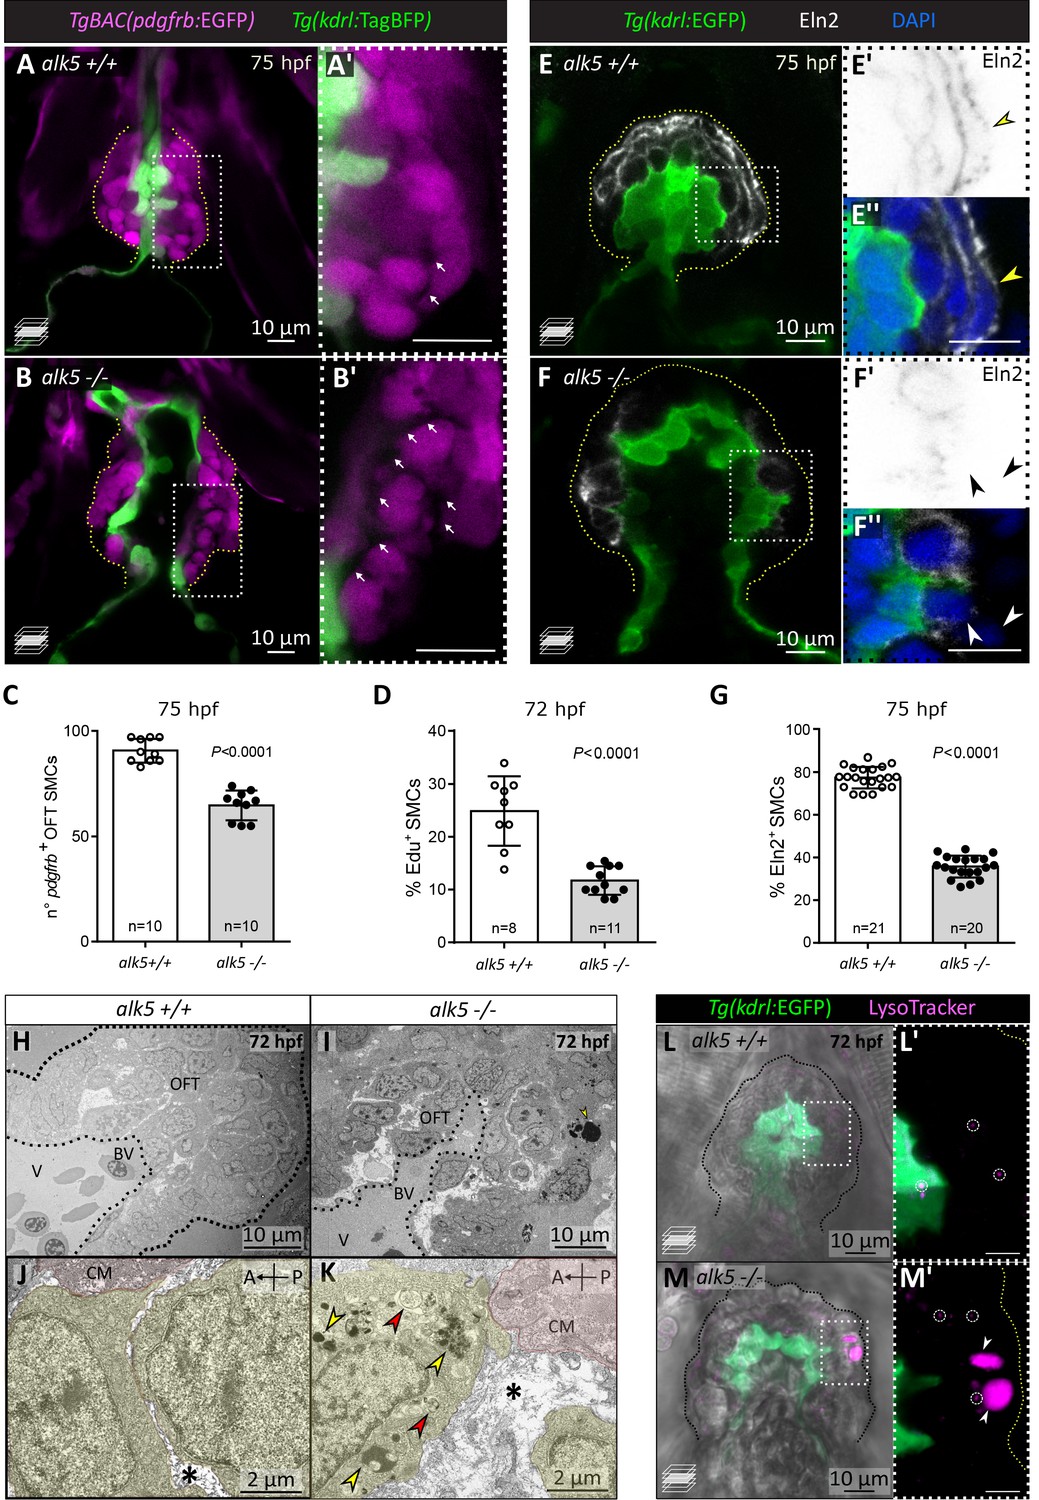
(A–C) Confocal images (A–B’) and quantification (C) of SMCs in 75 hpf alk5+/+ and alk5-/- larvae. Magenta, SMCs; white arrows, extracellular space between SMCs; boxed areas are shown in A’ and B’; dotted lines outline the OFT. (D) Percentage of EdU+ SMCs in 72 hpf alk5+/+ and alk5-/- larvae. (E–F’’) Confocal images of 75 hpf alk5+/+ and alk5-/- larvae immunostained for Elastin2 (Eln2). White arrowheads, SMCs devoid of Eln2; yellow arrowheads, SMCs surrounded by Eln2 immunostaining; boxed areas shown in E’, E’’, F’ and F’’; images in E’ and F’ are shown with inverted colors; dotted lines outline the OFT. (G) Quantification of the percentage of SMCs surrounded by Eln2 immunostaining (per sagittal plane) at 75 hpf. (H–K) TEM images of 72 hpf alk5+/+ and alk5-/- mutant OFTs at different magnifications (n = 3 for each genotype). Yellow, SMCs; red, cardiomyocytes close to the BV canal; asterisks, extracellular space; arrows, electron-dense (yellow) and double-membraned (red) vacuoles; dotted lines outline the OFT. (L–M’) Confocal images of alk5+/+ (n = 5) and alk5-/- (n = 9) animals treated with LysoTracker, labeling lysosomes (small, circles; big, arrowheads); boxed areas are shown in L’ and M’; dotted lines outline the OFT. (C, D, G) Plot values represent means ± SD; p values from t-tests. A- anterior, P- posterior, BV- bulbo-ventricular canal, CM- cardiomyocyte. Scale bars: , (A-I, L–M’) 10 μm; (J, K) 2 μm.
Figure 5 with 2 supplements
alk5 endothelial-specific overexpression is sufficient to restore OFT wall formation and function in alk5 mutants.
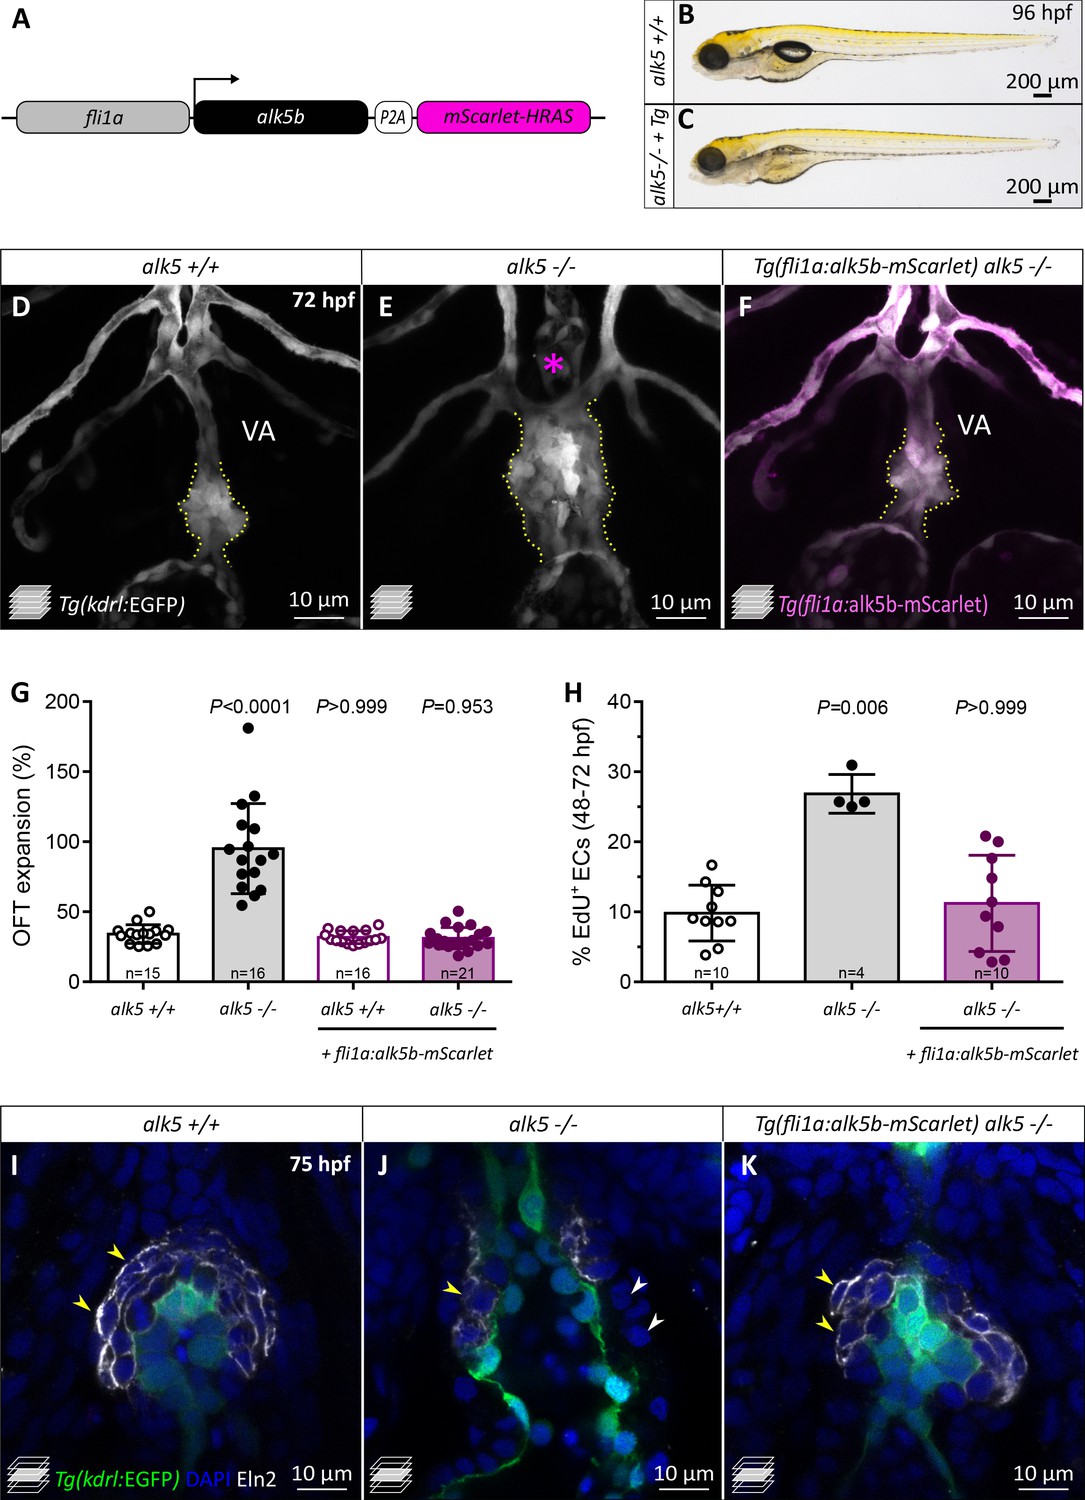
(A) Schematic of the construct used for endothelial-specific rescue experiments. (B, C) Brightfield images of 96 hpf alk5+/+ and alk5-/- larvae carrying the EC-specific alk5b rescue transgene (Tg). (D–F) Confocal images of the OFT in 72 hpf Tg(kdrl:EGFP) larvae, showing the morphological rescue in Tg(fli1a:alk5b-mScarlet) alk5-/- animals (F). Asterisk indicates the absence of the VA in alk5 mutants; dotted lines outline the OFT. (G) Percentage of OFT expansion in 78 hpf alk5+/+, alk5-/-, and Tg(fli1a:alk5b-mScarlet) alk5-/- animals. (H) Percentage of EdU+ ECs in 72 hpf alk5+/+, alk5-/-, and Tg(fli1a:alk5b-mScarlet) alk5-/- animals. (I–K) Confocal images of 75 hpf Tg(kdrl:EGFP) larvae immunostained for Eln2. Arrowheads, SMCs devoid of (white) or surrounded by (yellow) Eln2 immunostaining; I, n = 12; J, n = 13, K, n = 17. (G, H) Plot values represent means ± SD; p values from Kruskal-Wallis test, compared with the first column (alk5+/+). VA- ventral artery; Tg- Tg(fli1a:alk5b-mScarlet). Scale bars: (B, C) 200 μm; (D–F, I–K) 10 μm. See also Figure 5—figure supplement 1.
Figure 5—figure supplement 1
alk5 endothelial-specific overexpression is sufficient to restore OFT wall formation and function in alk5 mutants.
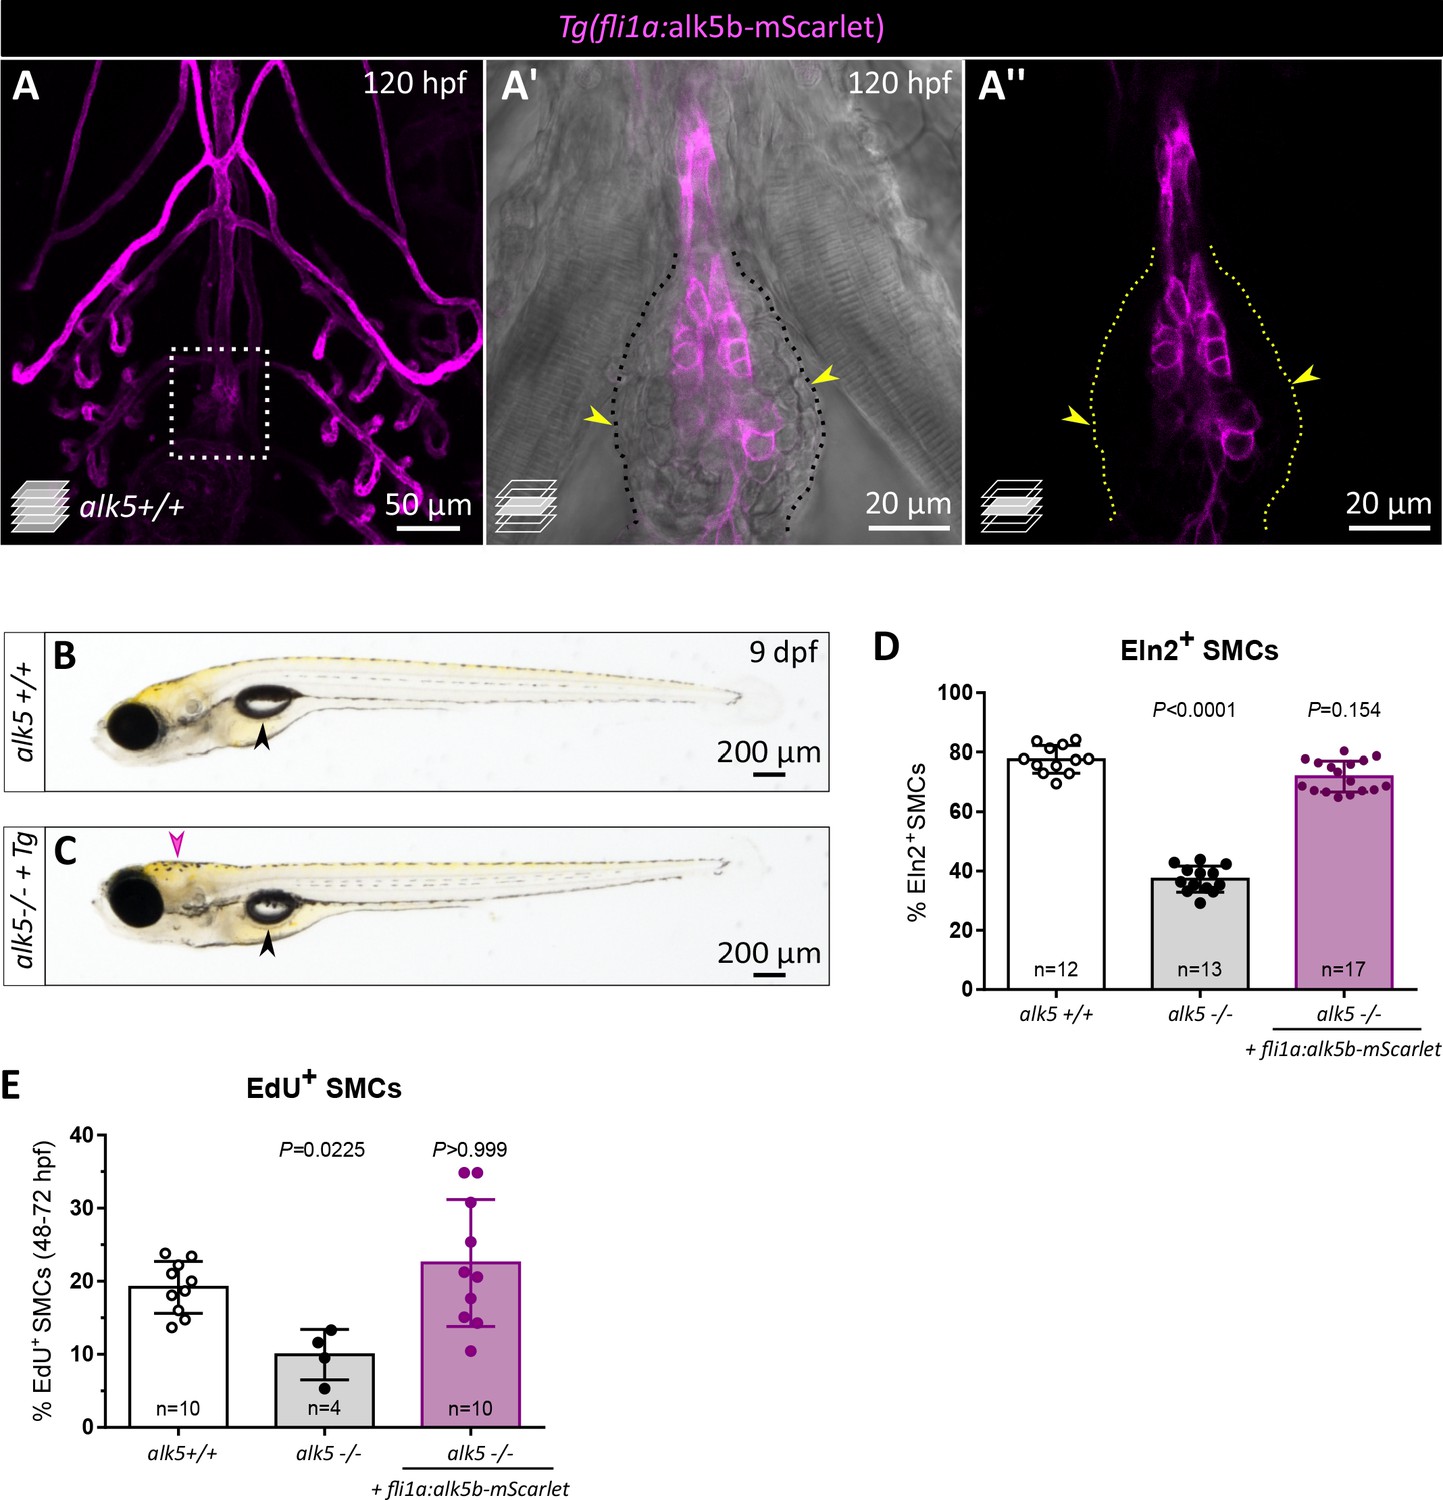
(A–A’’) Ventral view of 120 hpf Tg(fli1a:alk5b-mScarlet) alk5+/+ larvae, showing the restricted expression of the transgene in the ECs. Boxed area is shown in A’ and A’’; dotted lines outline the OFT; arrowheads, SMCs. (B, C) Brightfield images of 9 dpf alk5+/+ (B) and alk5-/- animals carrying the EC-specific rescue transgene (Tg, C) (11/108 alk5 mutants analyzed inflated their swim bladder). Black arrowheads, swim bladder; pink arrowhead, deformation of the head. (D) Percentage of SMCs surrounded by Eln2 immunostaining (per sagittal plane) at 75 hpf. (E) Percentage of EdU+ SMCs in 72 hpf alk5+/+, alk5-/-, and Tg(fli1a:alk5b-mScarlet) alk5-/- animals. (D, E) Means ± SD; p value from Kruskal-Wallis tests, compared with the first column (alk5+/+). Scale bars: (A) 50 μm; (A’, A’’) 20 μm; (B, C) 200 μm.
Figure 5—video 1
Confocal video of the beating heart of a Tg(kdrl:EGFP) alk5-/- larva at 78 hpf, carrying the fli1a:alk5b-mScarlet transgene and showing OFT expansion.
Figure 6 with 2 supplements
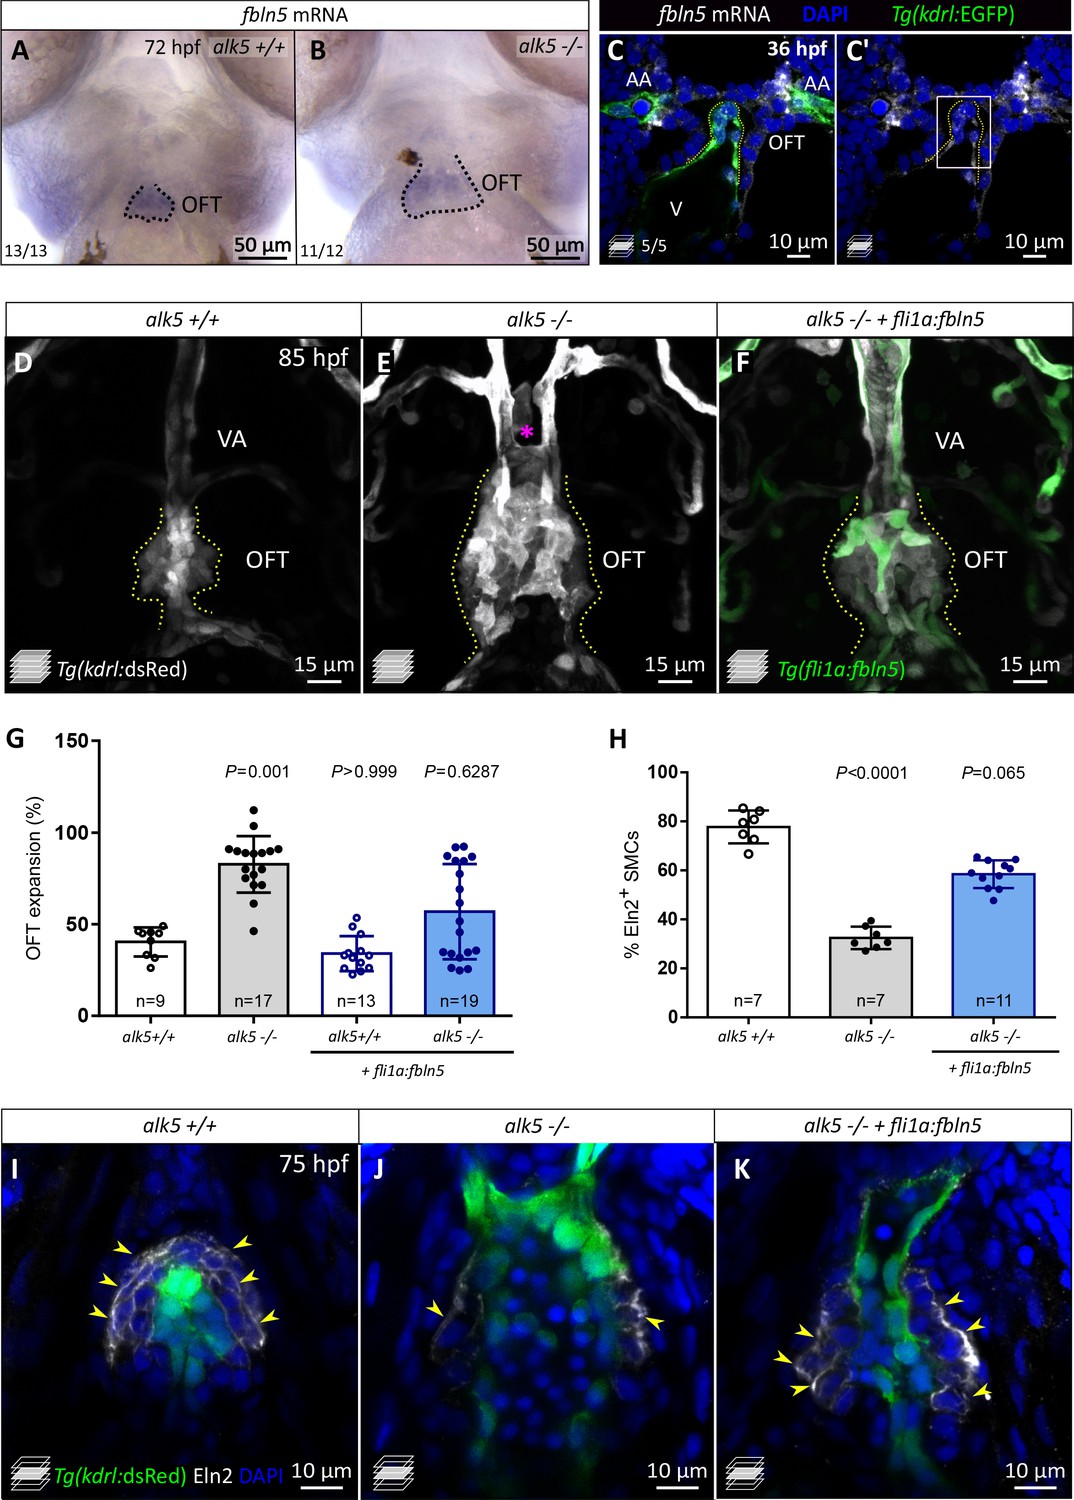
fbln5 endothelial-specific expression partially rescues the cardiac OFT defects in alk5 mutants.
(A, B) Whole-mount in situ hybridization for fbln5 expression in the OFT of 72 hpf alk5+/+ (n = 13) and alk5-/- (n = 12) larvae. Dotted lines outline the OFT. (C, C’) Fluorescent in situ hybridization for fbln5 expression (white) in the OFT of 36 hpf wild-type embryos. Green, ECs. Dotted lines outline the OFT, boxed area is shown in Figure 6—figure supplement 2B,B’. (D–F) Confocal images of 85 hpf Tg(kdrl:dsRed) alk5+/+ (n = 7), alk5-/- (n = 9), Tg(fli1:fbln5) alk5-/- (n = 9) larvae, showing the partial morphological rescue of the OFT and VA in Tg(fli1:fbln5) alk5 -/- larvae (6/9, F). Asterisk indicates the absence of the VA in alk5 mutants; dotted lines outline the OFT. (G) Percentage of OFT expansion in 78 hpf alk5+/+, alk5-/-, and Tg(fli1:fbln5) alk5-/- animals. (H) Percentage of SMCs surrounded by Eln2 immunostaining (per sagittal plane) at 75 hpf. (I–K) Confocal images of 75 hpf larvae immunostained for Eln2. Yellow arrowheads, SMCs surrounded by Eln2 immunostaining; I, n = 7; J, n = 7; K, n = 11. (G, H) Plot values represent means ± SD; p values from Kruskal-Wallis tests, compared with the first column (alk5+/+). AA- aortic arch, VA- ventral artery. Scale bars: (A, B) 50 μm; (C, C’, I–K) 10 μm; (D–F) 15 μm. See also Figure 6—figure supplements 1–2.
Figure 6—figure supplement 1
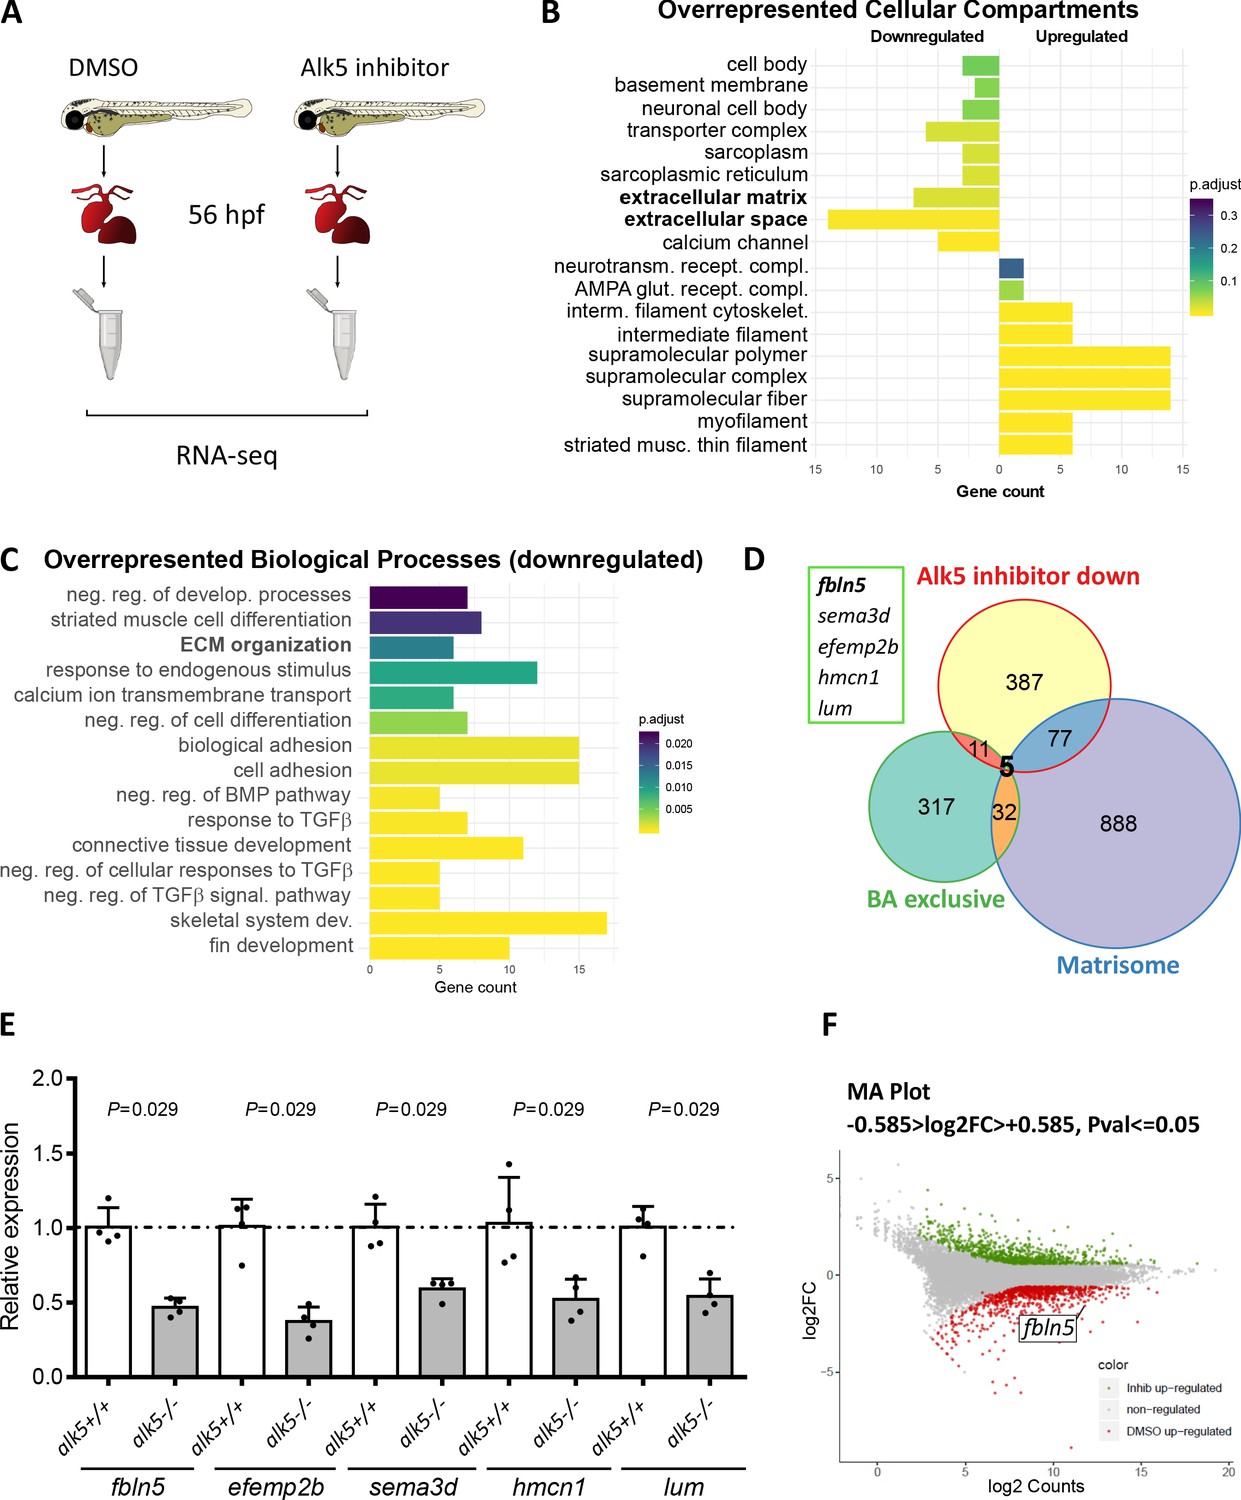
Alk5 regulates the expression of ECM genes in the cardiac OFT, including that of fbln5.
(A) Schematic showing the setting for the RNA-seq on extracted embryonic hearts (56 hpf). (B) Gene ontology bar plot, showing the most overrepresented cellular compartments up- or down-regulated in the Alk5 inhibitor-treated embryos compared with DMSO-treated ones. (C) Gene ontology bar plot, showing some of the most overrepresented biological processes downregulated in the Alk5 inhibitor-treated embryos compared to DMSO-treated ones. (D) Venn diagram depicting the genes downregulated (log2FC < −0.585) in the Alk5 inhibitor-treated embryonic hearts, exclusively expressed in the adult zebrafish BA (Singh et al., 2016), and part of the zebrafish matrisome (Nauroy et al., 2018). The five genes in the intersection are listed in the box. (E) Relative mRNA levels of the five genes in the intersection obtained from 72 hpf alk5+/+ and alk5-/- larval hearts. Means ± SD; p values from Mann Whitney tests; average Ct values are listed in Supplementary file 2. (F) MA plot displaying differentially expressed genes between Alk5 inhibitor-treated and control animals. fbln5 is highlighted among the downregulated genes (red).
Figure 6—figure supplement 2
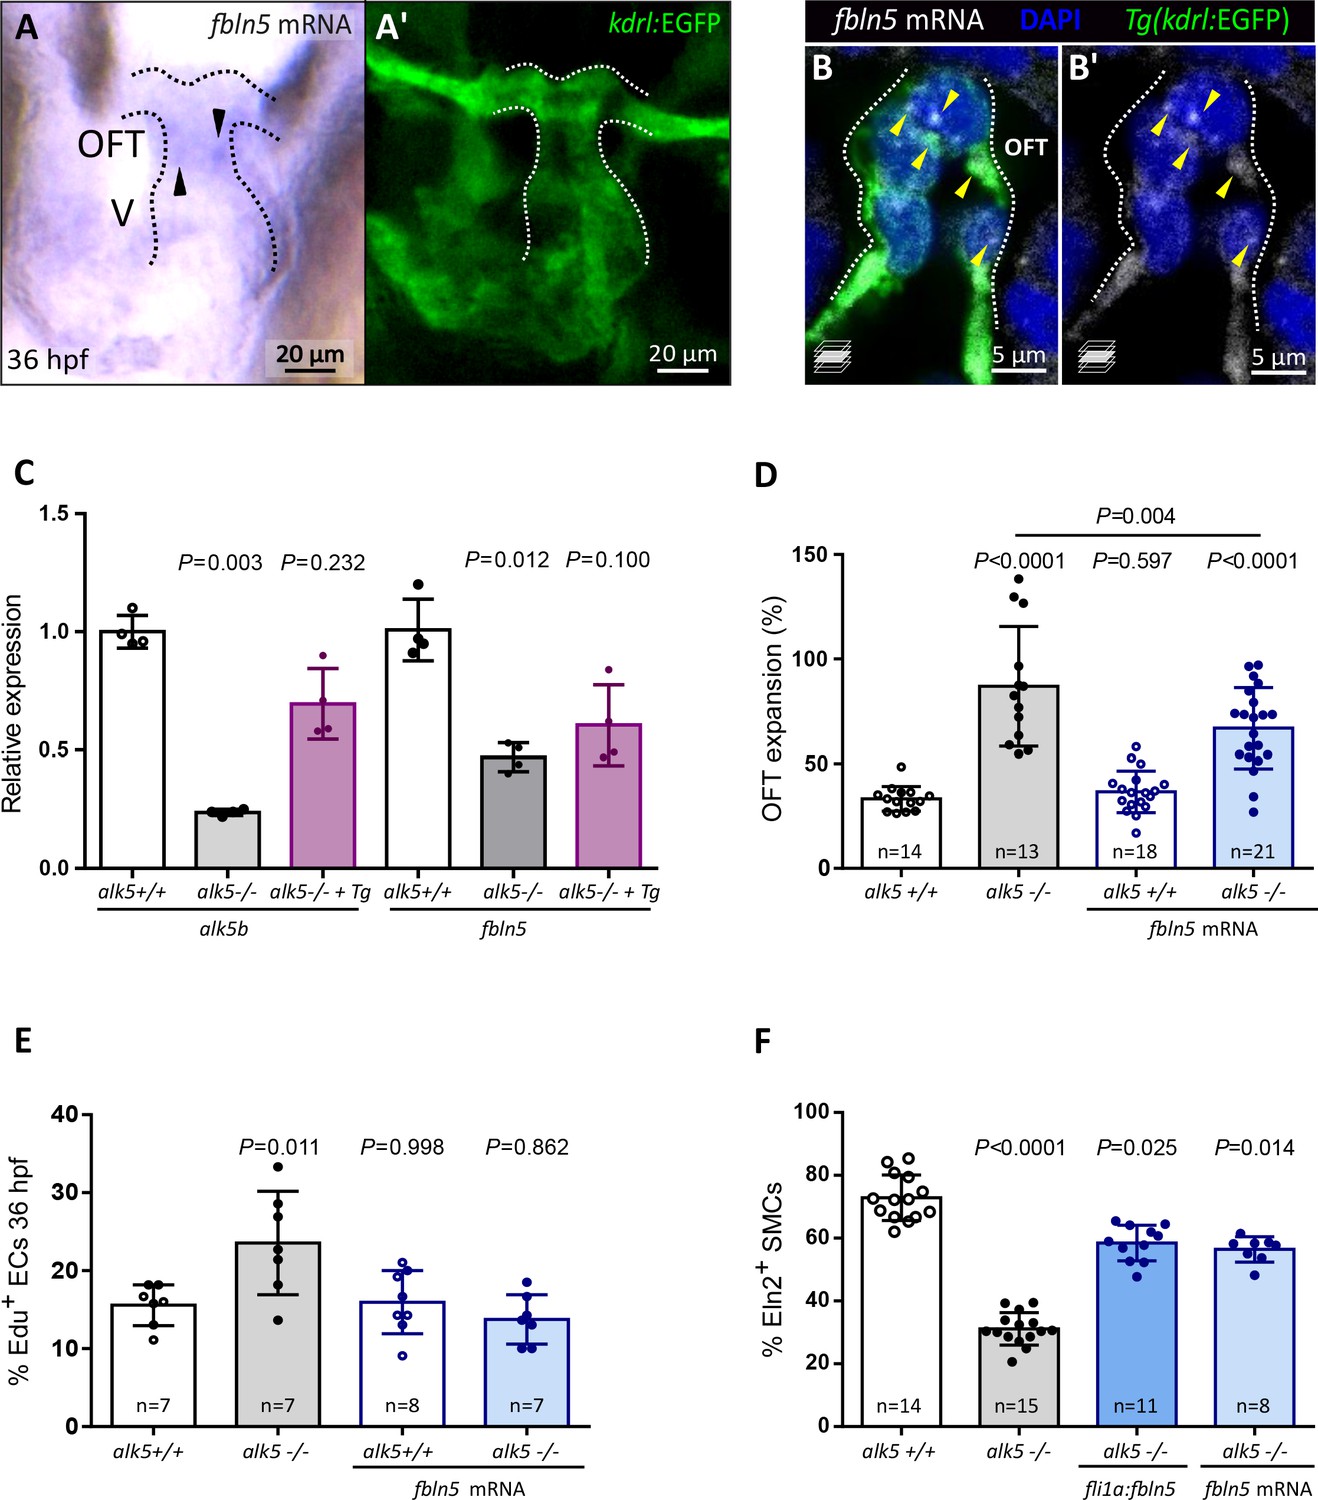
fbln5 is expressed in the cardiac outflow tract endothelium and its global overexpression partially rescues OFT defects in alk5 mutants.
(A, A’) Whole-mount in situ hybridization for fbln5 expression in the OFT of 36 hpf wild-type larvae (n = 6), combined with immunostaining for kdrl:EGFP (A’). Dotted lines outline the OFT, arrows point to regions with higher staining. (B, B’) Higher magnification of Figure 6C. Fluorescent in situ hybridization for fbln5 expression (white) in the OFT of 36 hpf wild-type embryos. Green, ECs; arrows point to punctae of fbln5 mRNA staining in ECs. (C) Relative mRNA levels of alk5b and fbln5 in 72 hpf alk5+/+, alk5-/-, and Tg(fli1a:alk5b-mScarlet) alk5-/- hearts. Average Ct values are listed in Supplementary file 2. (D) Percentage of OFT expansion in 78 hpf alk5+/+, alk5-/-, and alk5-/- larvae injected with fbln5 mRNA. (E) Percentage of EdU+ ECs in 36 hpf Tg(kdrl:EGFP) alk5+/+ and alk5-/- embryos following injection of fbln5 mRNA. (F) Percentage of SMCs surrounded by Eln2 immunostaining (per sagittal plane) in 75 hpf alk5+/+, alk5-/-, Tg(fli1:fbln5) alk5-/-, and alk5-/- larvae injected with fbln5 mRNA. (C–F) Plot values represent means ± SD; p values from Kruskal-Wallis (C, F) or one-way ANOVA (D, E) tests, compared with the first column (alk5+/+) unless otherwise stated (D). Scale bars: (A, A’) 20 μm; (B, B’) 5 μm.
Author response image 1
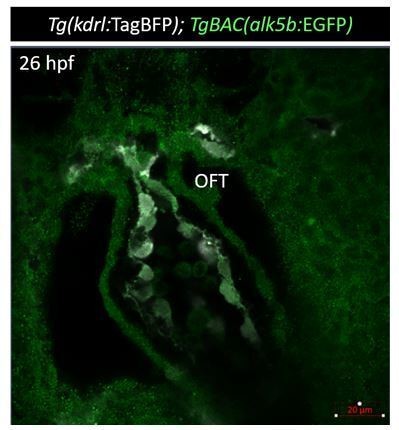
Tg(alk5b:EGFP) expression (green) at 36 hpf.
Author response image 2
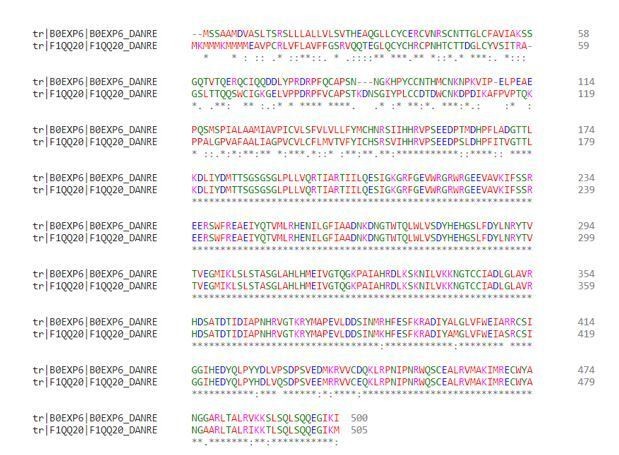
Clustal Omega (Madeira et al., 2019) protein alignment of Alk5a (B0EXP6_DANRE) and Alk5b (F1QQ20_DANRE).
Author response image 3
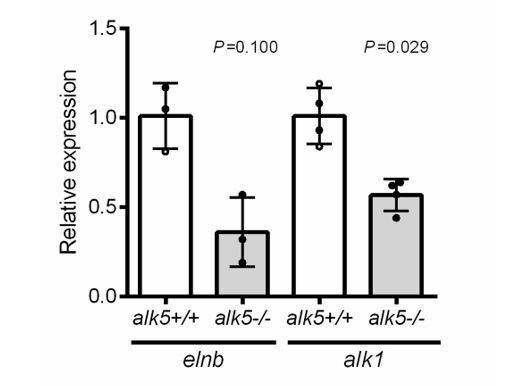
elnb and alk1 expression in 72 hpf alk5+/+ and alk5-/- hearts (p values from Mann Whitney tests).
Tables
Key resources table
| Reagent type (species) or resource | Designation | Source or reference | Identifiers | Additional information |
|---|---|---|---|---|
| Genetic reagent (Danio rerio) | Tg(kdrl:EGFP)s843 | Jin et al., 2005 | ZFIN: s843 | |
| Genetic reagent (D. rerio) | Tg(kdrl:TagBFP)mu293 | Matsuoka et al., 2016 | ZFIN: mu293 | |
| Genetic reagent (D. rerio) | Tg(kdrl:dsRed2)pd27 | Kikuchi et al., 2011 | ZFIN: pd27 | |
| Genetic reagent (D. rerio) | Tg(fli1a:Gaf4ff)ubs4 | Zygmunt et al., 2011 | ZFIN: ubs4 | |
| Genetic reagent (D. rerio) | Tg(UAS:Kaede)rk8 | Herwig et al., 2011 | ZFIN: rk8 | |
| Genetic reagent (D. rerio) | TgBAC(pdgfrb:EGFP)ncv22 | Ando et al., 2016 | ZFIN: ncv22 | |
| Genetic reagent (D. rerio) | Tg(kdrl:NLS-mCherry)is4 | Wang et al., 2010 | ZFIN: is4 | |
| Genetic reagent (D. rerio) | Tg(12xSBE:EGFP)ia16 | Casari et al., 2014 | ZFIN: ia16 | |
| Genetic reagent (D. rerio) | TgBAC(tgfbr1b:EGFP,cryaa:CFP)bns330 | This manuscript | ZFIN: bns330 | |
| Genetic reagent (D. rerio) | Tg(fli1a:tgfbr1b-P2A-mScarlet-Hsa.HRAS)bns421 | This manuscript | ZFIN: bns421 | |
| Genetic reagent (D. rerio) | tgfbr1abns329 | This manuscript | ZFIN: bns329 | |
| Genetic reagent (D. rerio) | tgfbr1bbns225 | This manuscript | ZFIN: bns225 | |
| Antibody | Anti-GFP (chicken polyclonal) | AvesLab | Cat#: GFP-1020 | 1:400 |
| Antibody | Anti-Elastin2 (rabbit polyclonal) | Miao et al., 2007 | 1:100 | |
| Antibody | Anti-tRFP (rabbit polyclonal) | Evrogen | Cat# AB233 | 1:200 |
| Antibody | Secondaries Alexa FluorTM 488-568-647 IgG (H+L) (goat polyclonal) | Thermo Fisher Scientific | 1:500 | |
| Antibody | Anti-Smad3 (phospho S423 + S425) antibody (rabbit monoclonal) | Abcam | Cat# ab52903 | 1:100 |
| Antibody | nti-phospho-Smad1/5 (Ser463/465)/Smad9 (Ser465/467) (rabbit monoclonal) | Cell Signaling Technology | Cat# 13820 | 1:100 |
| Antibody | Anti-dsRed (rabbit polyclonal) | Takara Bio Clontech | 632496 | 1:200 |
| Antibody | Anti-Alcama/Dm-Grasp (mouse monoclonal) | DSHB | ZN-8 | 1:50 |
| Commercial assay or kit | Click-iT EdU Cell Proliferation Kit for Imaging, Alexa Fluor 647 dye | Thermo Fisher Scientific | Cat# C10340 | |
| Commercial assay or kit | In-Fusion HD Cloning Plus | Takara Bio | Cat# 638910 | |
| Commercial assay or kit | DyNAmo ColorFlash SYBR Green qPCR Mix | Thermo Scientific | Cat# F416S | |
| Chemical compound, drug | E-616452 | Cayman Chemical | 14794 | |
| Chemical compound, drug | SIS3 | Calbiochem/Merck | 566405 | |
| Chemical compound, drug | EdU | Thermo Fisher Scientific | Cat# A10044 | |
| Chemical compound, drug | FITC-dextran 2000 kDa | Sigma | Cat# 52471 | |
| Chemical compound, drug | LysoTracker Deep Red | Thermo Fisher Scientific | Cat# L12492 | |
| Commercial assay or kit | miRNeasy micro Kit | Qiagen | Cat# 217084 | |
| Commercial assay or kit | mMessage mMachine T3 Transcription Kit | Thermo Fisher Scientific | Cat# AM1348 | |
| Commercial assay or kit | mMessage mMachine T7 Transcription Kit | Thermo Fisher Scientific | Cat# AM1344 | |
| Commercial assay or kit | DIG RNA labeling kit | Roche | Cat# 11277073910 | |
| Commercial assay or kit | Maxima First Strand cDNA kit | Thermo Fisher Scientific | Cat# K1641 | |
| Commercial assay or kit | MegaShortScript T7 | Thermo Fisher Scientific | Cat# AM1354 | |
| Commercial assay or kit | RNA Clean and Concentrator Kit | Zymo Research | Cat# R1013 | |
| Software, algorithm | ZEN Blue 2012 | Zeiss, Germany | ||
| Software, algorithm | ZEN Black 2012 | Zeiss, Germany | ||
| Software, algorithm | Imaris - Version 8.4.0 | Bitplane, UK | ||
| Software, algorithm | GraphPad Prism 6 | GraphPad Software, USA | ||
| Software, algorithm | FIJI/ImageJ | Schindelin et al., 2012 |
Author response table 1
Expression of some bona fide TGF-β targets in 56 hpf hearts from DMSO treated vs.Alk5 inhibitor treated larvae.
| Gene | Base Mean DMSO | Base Mean Inhibitor | Log2FC Inhib/DMSO |
|---|---|---|---|
| loxa | 750 | 353 | -1.08 |
| ctgfa | 2672 | 1252 | -1.09 |
| serpine1 | 244 | 915 | 1.90 |
| acta2 | 588 | 2171 | 1.88 |
| junba | 238 | 361 | 0.60 |
| junbb | 567 | 608 | 0.10 |
Additional files
-
Supplementary file 1
List of differentially expressed genes (>1 or <-1 log2FC) from RNA-seq dataset of 56 hpf dissected hearts from DMSO and Alk5 inhibitor-treated embryos.
- https://cdn.elifesciences.org/articles/57603/elife-57603-supp1-v1.xlsx
-
Supplementary file 2
Average Ct values of genes by RT-qPCR.
- https://cdn.elifesciences.org/articles/57603/elife-57603-supp2-v1.xlsx
-
Supplementary file 3
RT-qPCR primer list.
- https://cdn.elifesciences.org/articles/57603/elife-57603-supp3-v1.xlsx
-
Transparent reporting form
- https://cdn.elifesciences.org/articles/57603/elife-57603-transrepform-v1.pdf
Download links
A two-part list of links to download the article, or parts of the article, in various formats.
Downloads (link to download the article as PDF)
Open citations (links to open the citations from this article in various online reference manager services)
Cite this article (links to download the citations from this article in formats compatible with various reference manager tools)
Endothelial TGF-β signaling instructs smooth muscle cell development in the cardiac outflow tract
eLife 9:e57603.
https://doi.org/10.7554/eLife.57603


