Lack of evidence for associative learning in pea plants
- Plant Biology, University of California, Davis, United States
Figures
Figure 1 with 1 supplement
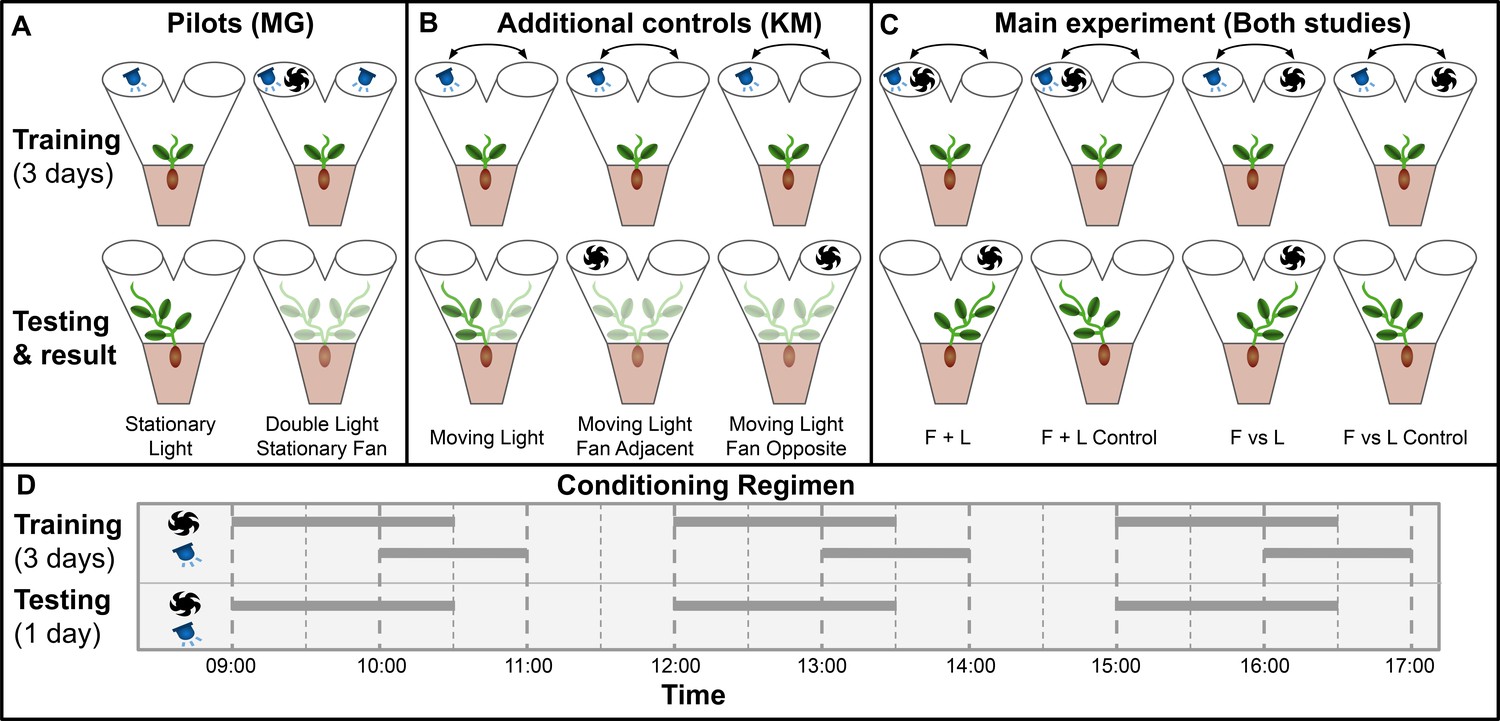
main Visual summary of all experimental conditions tested in both studies.
(A) Pilot studies used in Gagliano et al. Top row shows maze fan and light configuration for training period, bottom row shows configuration during testing day and the maze arm into which plants grew. (B) Additional controls used in this study to address the same questions as the pilot studies in Gagliano et al. (C) Main experimental conditions.Results shown are from gagliano et al. in Gagliano et al., 2016. Results here are simplified, for more detailed results from both studies see Figures 2 and 3. (D) Conditioning regimen. Horizontal bars indicate time periods for which fans and lights were active, the x-axis indicates time of day.
Figure 1—figure supplement 1

Y maze detail.
(A) Charlotte two in. 45 degree PVC Wye joint (Model # PVC 00600 1000) was cut at 22.5 degree angle (following the seam) using a chop saw, resulting in a bilaterally symmetrical Y shape. Maze dimensions were 55 mm base diameter, 105 mm total height, bifurcation at 65 mm height, 95 mm overall width at bifurcation point, each arm measured 60 mm diameter by 40 mm length, as per the original study. This maze is attached to the pot 1–2 days after emergence of the seedling from the soil surface. Critically, the attachment of the maze is done before condition and orientation (left vs right) is assigned to prevent bias. (B) Finished Y maze attached to pot. Attachment is achieved via circumferential black tape (to prevent light leakage) with additional longer strips as needed to straighten maze as much as possible. Pot is of dimensions 5 cm diameter at top, 4 cm diameter at bottom, 6 cm height and has one central hole of approximately 2 mm diameter cut into the bottom. (C) Y mazes attached to plants within controlled environment chamber. Each Y maze has two open ends, which have four possible electronic device configurations: N shows nothing, L shows an LED alone, F shows fan alone, and FL shows fan and LED together. These lights and fans were then moved from one maze arm to the other according to the training schedule. LEDs are attached to the lateral aspect of each Y terminus to maximize directionality of light. In these experiments, Y mazes are grouped in sets of 10 which are interconnected by a thin wooden shim which is tightly wedged between the two arms of the Y maze. This stabilizes the mazes from tipping over, a problem that plagued initial attempts.
Figure 2
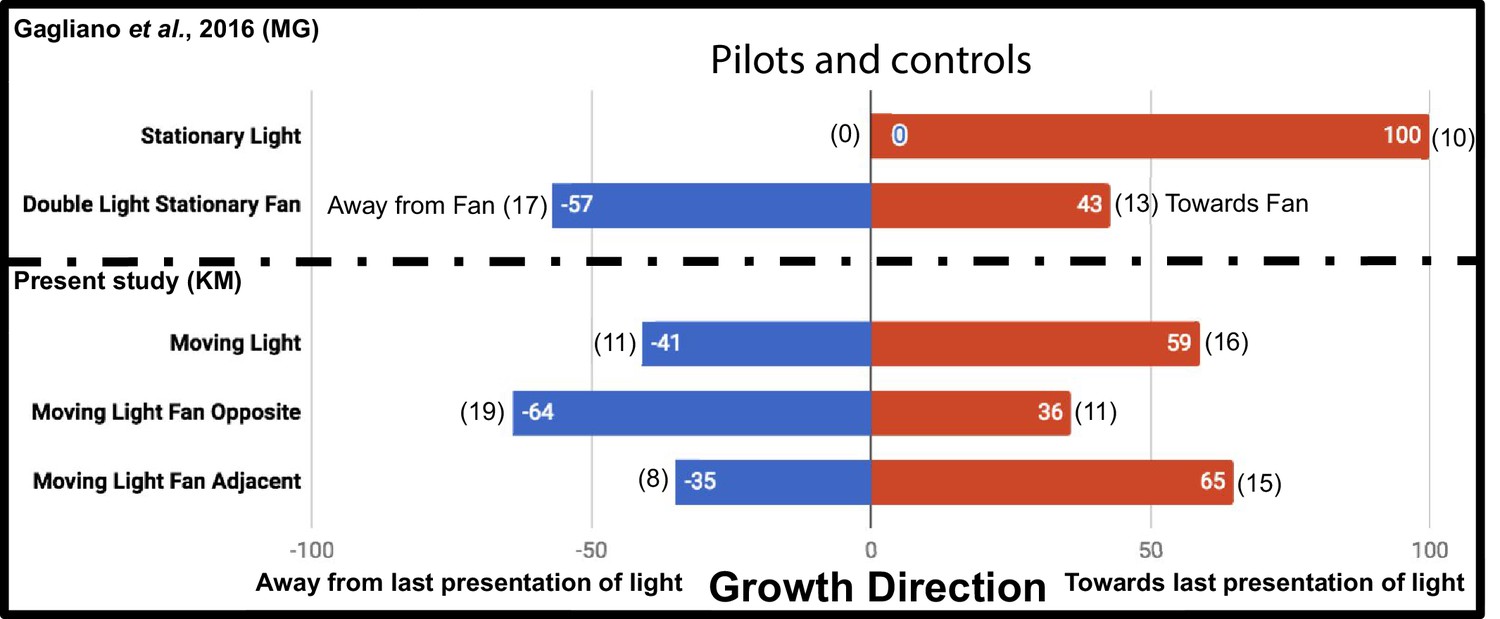
Results of plant growth in control conditions from the present study (KM) and the Gagliano et al., 2016 experiment (MG).
Numbers in bars indicate percentage, numbers in parentheses indicate raw data, number of plants growing into each maze arm.
Figure 3

Results of plant growth in the four main conditions from this experiment (bars labeled KM) and the Gagliano et al., 2016 paper (bars labeled MG).
Numbers in parentheses indicate sample size. Data are pooled from the Gagliano et al. ‘Experiment 1’ and the Light group of their ‘Experiment 2’.
Tables
Table 1
Sample size summary table.
This experiment (Columns labeled KM) suffered significant attrition due to variance in plant growth rate. Sample sizes from the Gagliano et al., 2016 paper (MG) are shown for comparison, grouping results from their ‘Experiment 1’ and the light condition of ‘Experiment 2’. Raw data available in Source data 1.
| Condition | Plants tested KM | Plants counted KM | Plants counted MG |
|---|---|---|---|
| Stationary Light | 0 | 0 | 20 |
| Double Light Stationary Fan | 0 | 0 | 30 |
| Moving Light | 50 | 27 | 0 |
| Moving Light Fan Opposite | 70 | 30 | 0 |
| Moving Light Fan Adjacent | 40 | 23 | 0 |
| F + L | 95 | 61 | 31 |
| F + L Control | 95 | 60 | 20 |
| F vs L | 65 | 42 | 13 |
| F vs L Control | 65 | 40 | 9 |
Additional files
-
Source data 1
Raw data for all experiments performed and statistical summaries of these data and Gagliano et al., 2016 data.
- https://cdn.elifesciences.org/articles/57614/elife-57614-data1-v1.xlsx
-
Transparent reporting form
- https://cdn.elifesciences.org/articles/57614/elife-57614-transrepform-v1.docx
Download links
A two-part list of links to download the article, or parts of the article, in various formats.
Downloads (link to download the article as PDF)
Open citations (links to open the citations from this article in various online reference manager services)
Cite this article (links to download the citations from this article in formats compatible with various reference manager tools)
Lack of evidence for associative learning in pea plants
eLife 9:e57614.
https://doi.org/10.7554/eLife.57614


