Aversive stimuli bias corticothalamic responses to motivationally significant cues
- The Solomon H Snyder Department of Neuroscience, Brain Science Institute, Kavli Neuroscience Discovery Institute, The Johns Hopkins University School of Medicine, United States
Figures
Figure 1 with 1 supplement
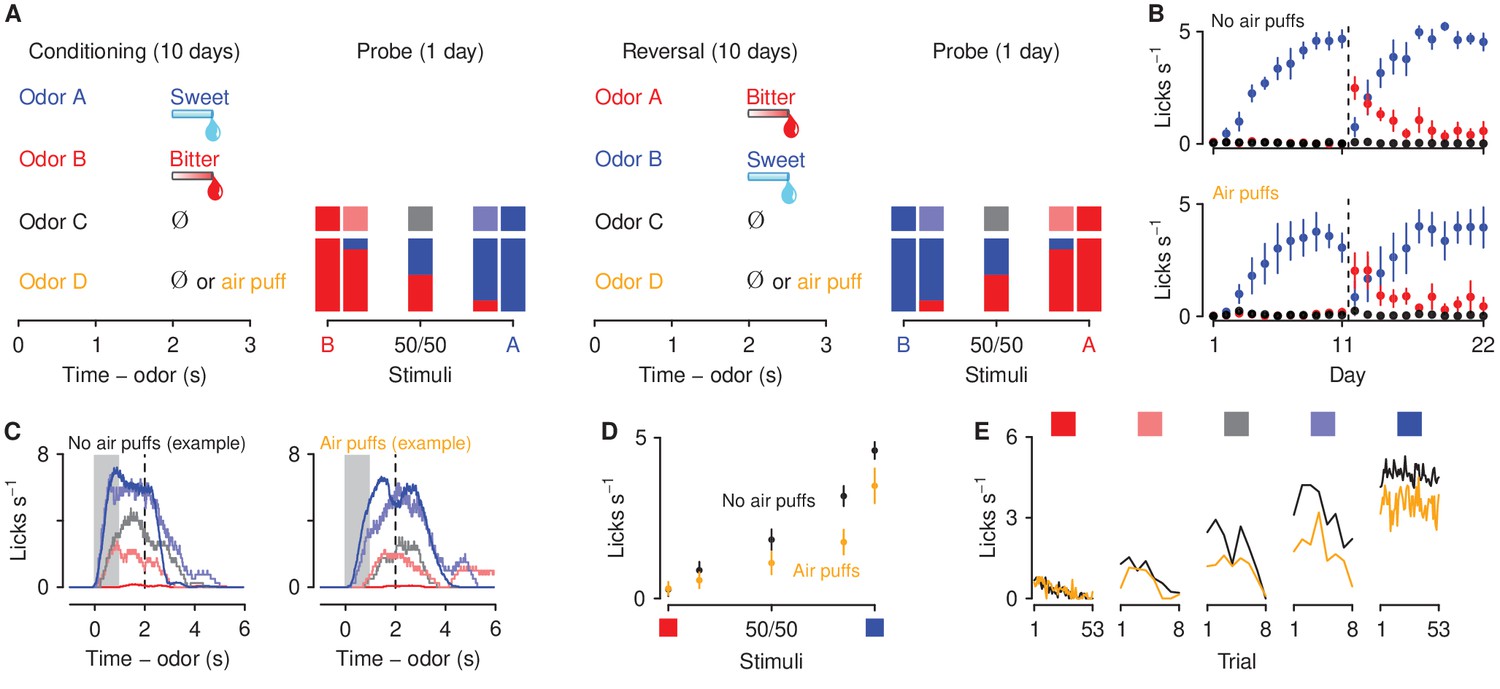
Behavioral responses to motivationally-significant predictive cues are modulated by history of aversive stimuli.
(A) Task design and experimental timeline. During ten conditioning sessions, odors (A, B, C, and D) predicted an appetitive sucrose solution, an aversive denatonium solution, no outcome, and either no outcome or an unavoidable air puff, respectively. During the first probe test, A and B were mixed in three different ratios: 85%B/15%A (light red), 50%B/50%A (gray), 15%B/85%A (light blue). After completion of 10 reversal training sessions, in which A and B contingencies were reversed, mice were re-trained in a second probe test. (B) Licking rates in no air puff (top, 7 mice) or air puff (bottom, 5 mice) groups across days, during odor and delay period, for sucrose (blue), denatonium (red), and no-outcome (black) trials. Dashed lines indicate reversals on day 11. (C) Licking behavior from a representative test session from a mouse without (left) and one with (right) exposure to air puffs. Color gradations between blue and red indicate odor mixtures as in (A). Gray bars indicate a period of odor presentation. Dashed lines indicate outcome delivery. (D) Licking rates during sucrose (blue square) and denatonium (red square) trials and during the eight probe trials for no air puff (black) and air puff (orange) groups, during odor and delay period. (E) Mean trial-by-trial licking rates during sucrose (blue square) and denatonium (red square) trials and during the eight probe trials for each ambiguous cue (light red, gray, light blue squares) for no air puff (black) and air puff (orange) groups, during odor and delay period. Line and error bars represent mean ± SEM.
Figure 1—figure supplement 1

Mean ± SEM licking rates during anticipation periods (CS and delay), for mice exposed (orange) or unexposed (black) to air puffs.
Left: first probe (Day 11). Right: second probe after reversal (Day 22).
Figure 2 with 1 supplement
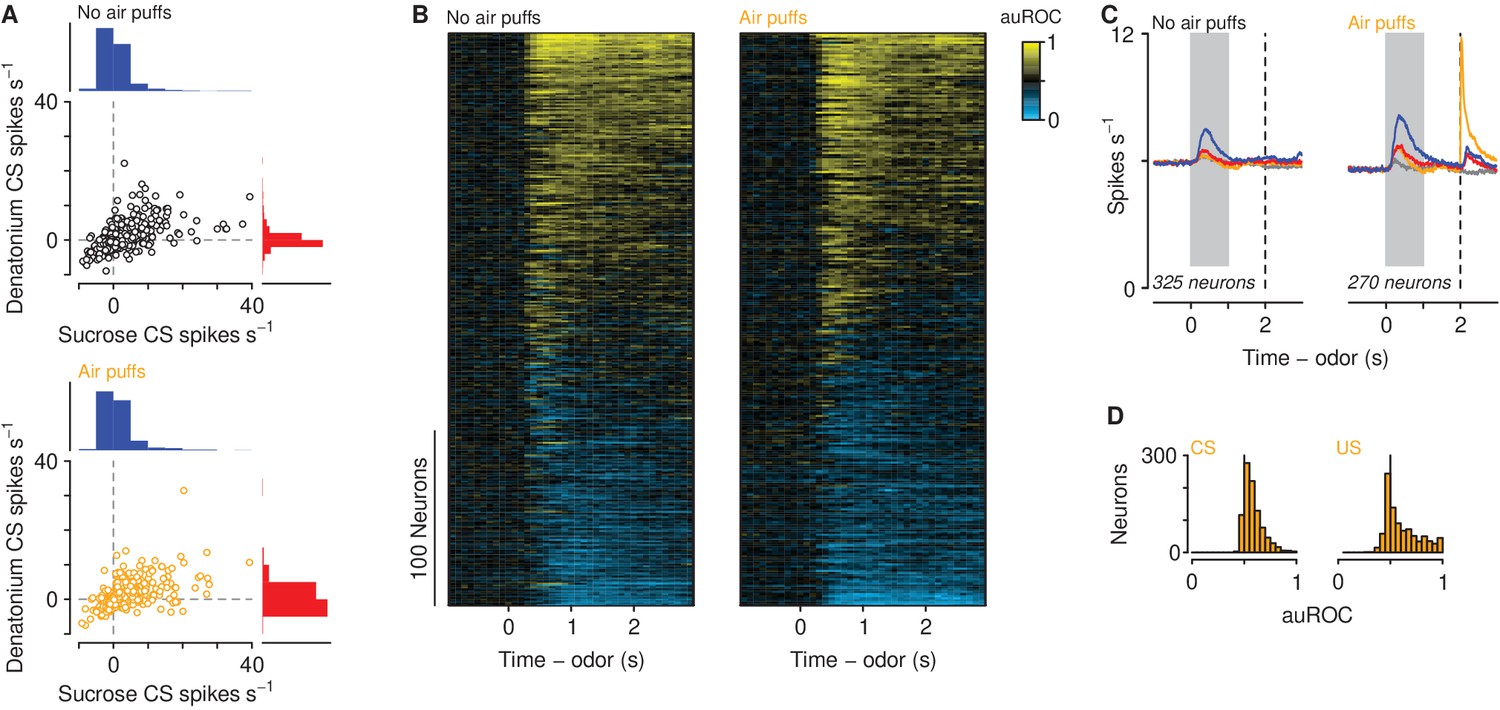
Neuronal responses across learning.
(A) Firing rates of neurons in mice unexposed (top) and exposed (bottom) to air puffs relative to pre-CS firing rates. Histogram scale bars: 700 neurons (top), 500 neurons (bottom). (B) Discriminability (auROC) between sucrose and denatonium trials of neurons in mice unexposed (left) and exposed (right) to air puffs with significant firing rate changes during the cue. Increases (yellow) and decreases (cyan) in firing rate in sucrose trials relative to denatonium trials. Each row represents one neuron. (C) Average firing rates of all neurons with auROC values greater than 0.7 or less than 0.3 in at least one bin in no air puff (left) and air puff (right) mice during sucrose (blue), denatonium (red), no-outcome (gray) and air puff (orange) trials. Gray bars indicate a period of odor presentation. Dashed lines indicate outcome delivery. (D) auROC values for responses to air puff-predicting CSs (left) and air puff (right).
Figure 2—figure supplement 1

Drawings illustrate recording sites in mPFC in no air puff (left) and air puff exposed (right) mice.
Boxes indicate approximate location of recording sites in each mouse, taking into account any vertical distance traveled during training and the approximate lateral spread of the tetrode bundle.
Figure 3
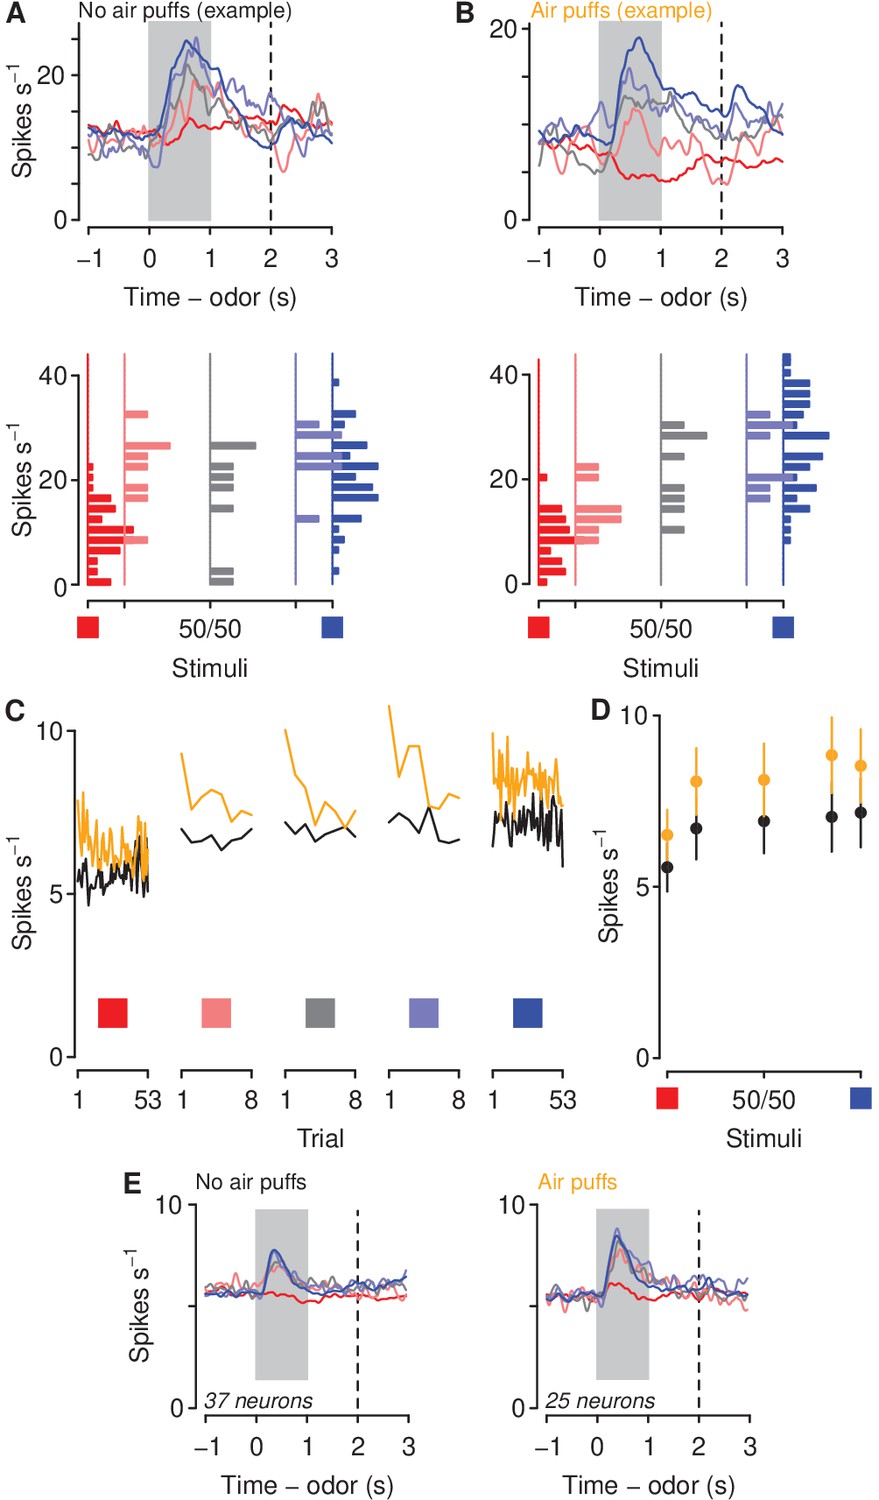
Aversive stimuli increase mPFC firing rates to motivationally relevant cues.
(A–B) Average firing rates (top) and histograms of firing rates during odor and delay period (bottom) from example neurons in a mouse unexposed (A) and exposed (B) to air puffs. Red: denatonium trials. Blue: sucrose trials. Graded colors indicate mixtures as in Figure 1A. Gray bars indicate a period of odor presentation. Dashed lines indicate outcome delivery. (C) Mean trial-by-trial firing rates during sucrose (blue square) and denatonium (red square) trials and during the eight probe trials for each ambiguous cue (light red, gray, light blue squares) for no air puff (black) and air puff (orange) groups, during odor and delay period. Firing rates were calculated during the CS. (D) Mean ± SEM firing rates during sucrose (blue square) and denatonium (red square) trials and during the eight probe trials for no air puff (black) and air puff (orange) groups, during odor and delay period. (E) Mean firing rates of mPFC neurons in mice unexposed (left) or exposed to air puffs (right).
Figure 4 with 1 supplement
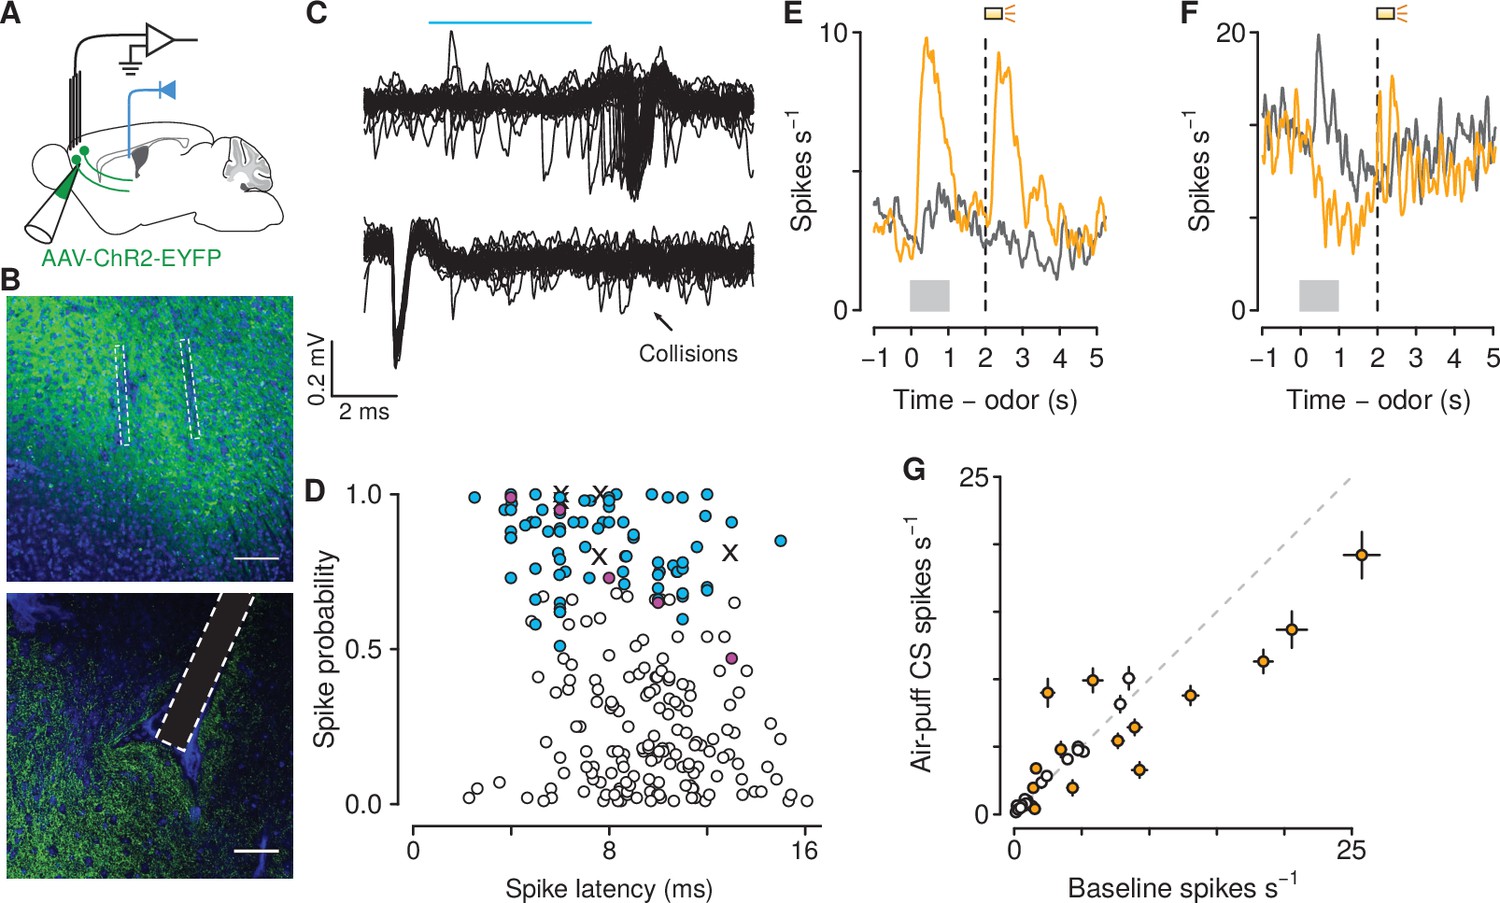
Air-puff-predicting stimuli modulate mPFC→PVT neuron firing rates.
(A) Schematic drawings of viral stereotaxic injection of AAV1-CaMKII-ChR2-eYFP and tetrode bundle into mPFC and optic fiber over PVT. (B) eYFP (green), and DAPI (blue) in mPFC (top) and PVT (bottom) coronal sections from BL6 mice that received AAV1-CaMKII-ChR2-eYFP and tetrode bundle into mPFC and an optic fiber over PVT (scale bar, 100 μm). (C) Example of an identified corticothalamic neuron responding to a sequence of light stimuli (cyan) with action potentials (top) but not when the light stimuli followed spontaneous action potentials (bottom). (D) Antidromically-tagged corticothalamic neurons (blue) and antidromically-tagged corticothalamic neurons that passed collision tests (magenta). White points are neurons that were not identified. Crosses are neurons that passed collision tests, but were not recorded during behavior. (E–F) Average firing rates from example mPFC→PVT neurons showing firing rate increase (E) or decrease (F) to the air puff-predicting cue. Orange: air puff trials. Gray: CS - trials. Gray bars indicate odor presentation. Dashed lines indicate outcome delivery. (G) Scatter plot showing relationship between the change in firing rate to the air puff-predicting cue compared to baseline firing activity. Orange: neurons in which the firing rate during the air puff-predicting cue was significantly different from baseline firing activity (-test, ).
Figure 4—figure supplement 1
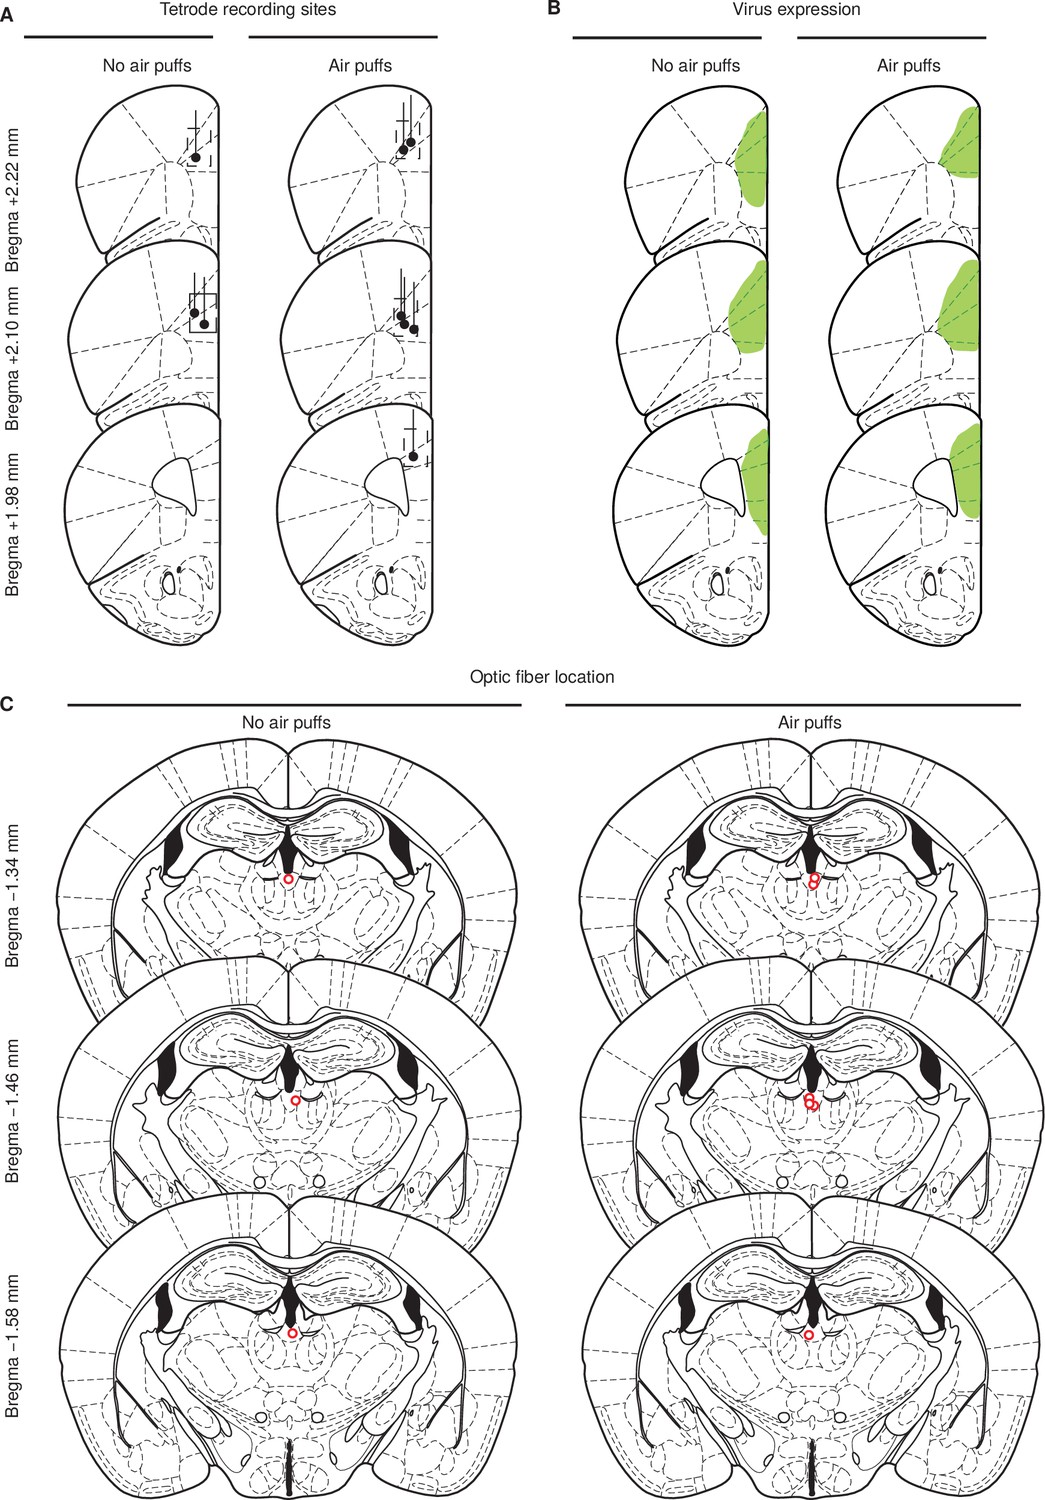
Electrode and optic fiber locations.
(A) Drawings illustrate recording sites in mPFC in no air puff (left, ) and air puff exposed (right, ) mice. Boxes indicate approximate location of recording sites in each mouse, taking into account any vertical distance traveled during training and the approximate lateral spread of the tetrode bundle. (B) Traces showing virus expression in no air puff (left) and air puff (right) groups. (C) Locations of fiber tips in no air puff (left) and air puff (right) groups in PVT.
Figure 5
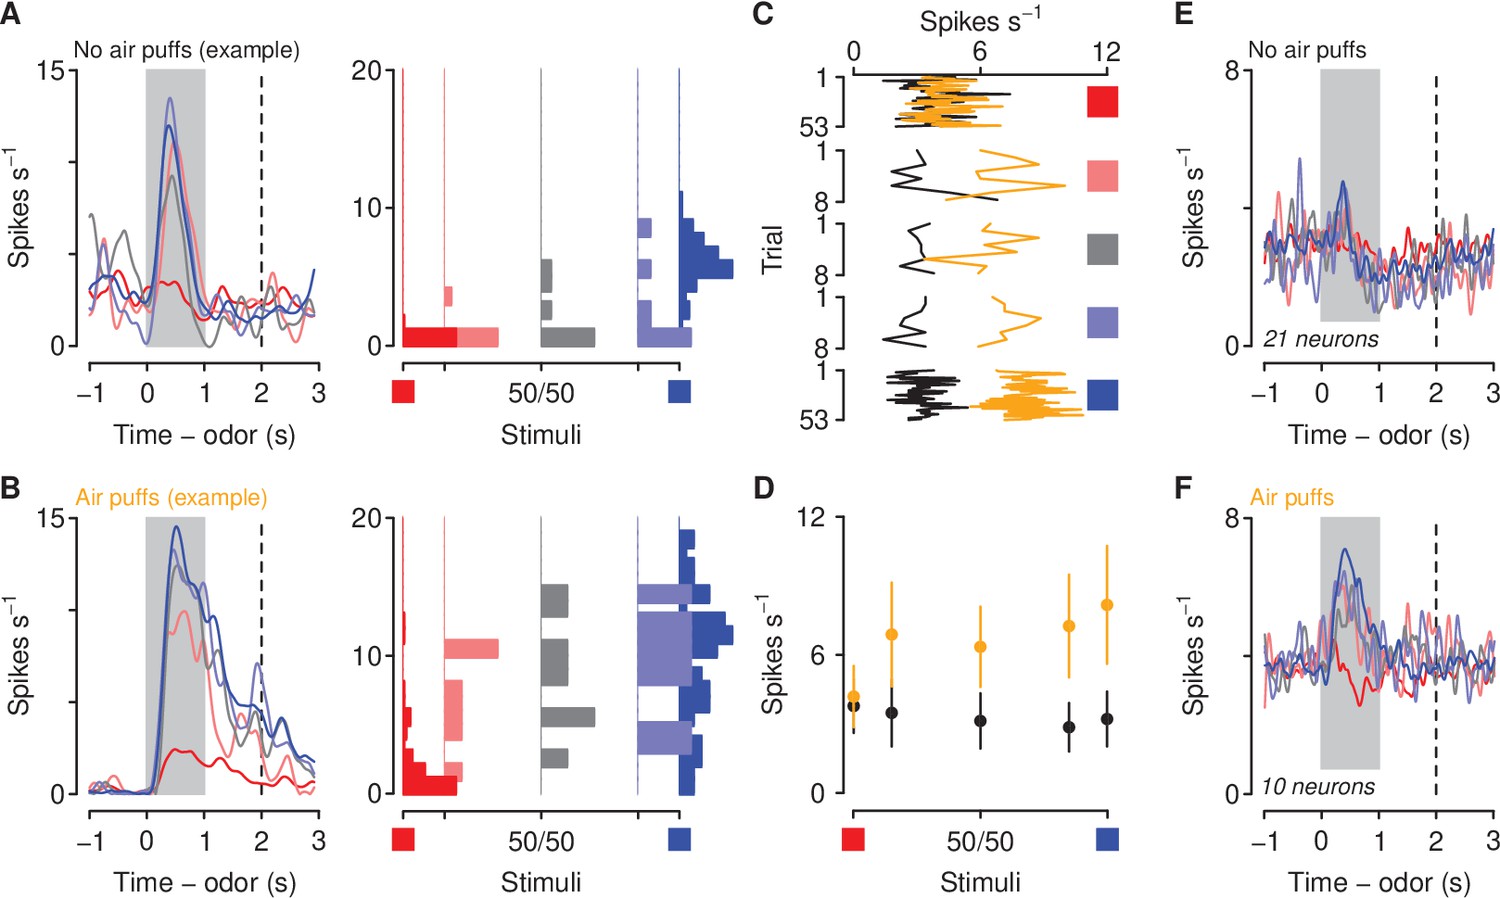
Aversive stimuli increase corticothalamic firing rates to motivationally-relevant cues.
(A–B) Average firing rates (left) and histograms of firing rates during odor and delay period (right) from example neurons in a mouse unexposed (A) and exposed (B) to air puffs. Red: denatonium trials. Blue: sucrose trials. Graded colors indicate mixtures as in Figure 1A. Gray bars indicate a period of odor presentation. Dashed lines indicate outcome delivery. (C) Mean trial-by-trial firing rates during sucrose (blue square) and denatonium (red square) trials and during the eight probe trials for each ambiguous cue (light red, gray, light blue squares) for no air puff (black) and air puff (orange) groups, during odor and delay period. (D) Mean ± SEM firing rates during sucrose (blue square) and denatonium (red square) trials and during the eight probe trials for no air puff (black) and air puff (orange) groups, during odor and delay period. (E) Mean firing rates of corticothalamic neurons in mice unexposed to air puffs. (F) Mean firing rates of corticothalamic neurons in mice exposed to air puffs.
Figure 6 with 2 supplements
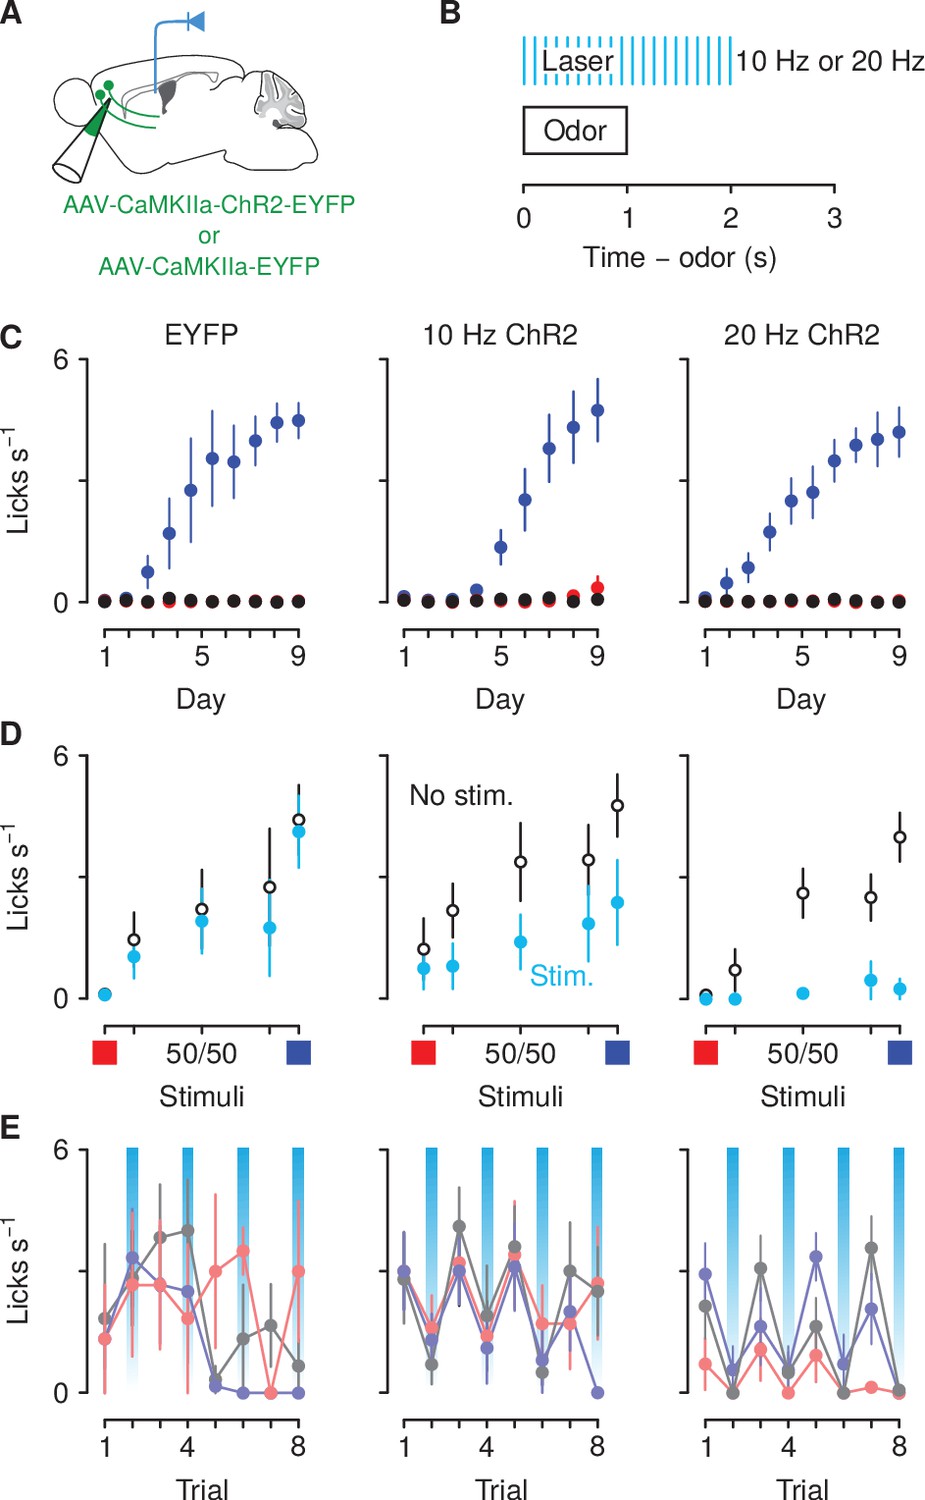
Optogenetic excitation of corticothalamic neurons negatively biases responses to motivationally-relevant stimuli.
(A) Schematic of viral stereotaxic injection of AAV1/5-CaMKIIa-ChR2-eYFP or AAV1/5-CaMKIIa-eYFP into mPFC and optic fiber over PVT. (B) Optical stimulation was delivered during presentation of the cue and during the 1 s delay before outcome delivery. (C) Licking rates in eYFP (left, ), 10 Hz ChR2-eYFP (center, ), and 20 Hz ChR2-eYFP (right, ) groups across conditioning, during odor and delay period, for sucrose (blue), denatonium (red), and no-outcome (black) trials. (D) Licking rates during sucrose (blue square) and denatonium (red square) trials and during the eight probe trials of each mixed stimulus for eYFP (left), 10 Hz ChR2-eYFP (center) and 20 Hz ChR2-eYFP (right) groups, during odor and delay period, with (light blue) or without (white) laser stimulation. (E) Trial-by-trial licking rates during 85%A/15%B (light red), 50%A/50%B (gray), 15%A/85%B (light blue) trials for eYFP (left), 10 Hz ChR2-eYFP (center) and 20 Hz ChR2-eYFP (right) groups, during odor and delay period, with (light blue shadows) or without laser stimulation. Line and error bars represent the mean ± SEM.
Figure 6—figure supplement 1
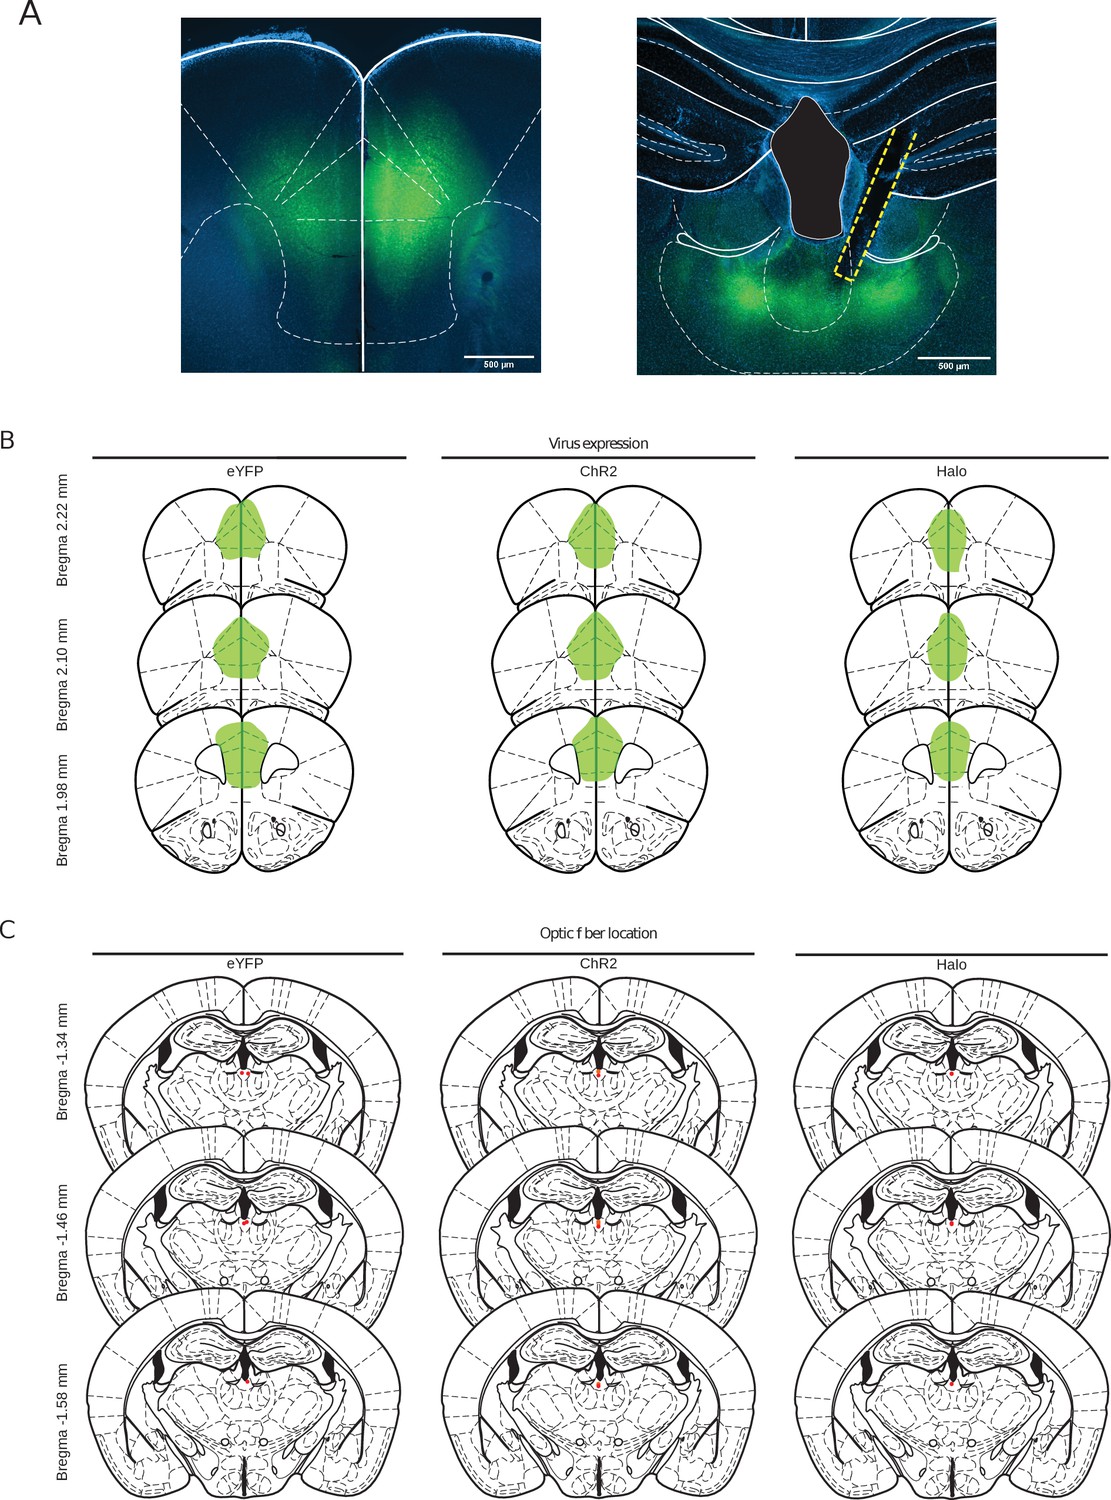
Virus expression and optic fiber locations.
(A) eYFP (green) and DAPI (blue) expression in a mPFC (left) and PVT (right) coronal section from a BL6 mouse that received AAV1-CaMKIIα-Halo-eYFP into mPFC and an optic fiber over PVT (scale bar, 500 μm). (B) Traces showing the expression of eYFP (left), ChR2-eYFP (middle) and Halo-eYFP (right) groups. (C) Locations of fiber tips in eYFP (left), ChR2-eYFP (middle, red=10 Hz and orange=20 Hz) and Halo (right) groups in PVT.
Figure 6—figure supplement 2

mPFC→PVT stimulation did not suppress licking for unexpected rewards.
Left: optical stimulation was delivered during the presentation of reward delivery and lasted for 1500 ms, Right: licking behavior in 10 Hz ChR2-eYFP (left) and 20 Hz ChR2-eYFP (right) groups across trials with no stimulation (black) and trials with stimulation (light blue). Line and error bars represent the mean ± SEM.
Figure 7
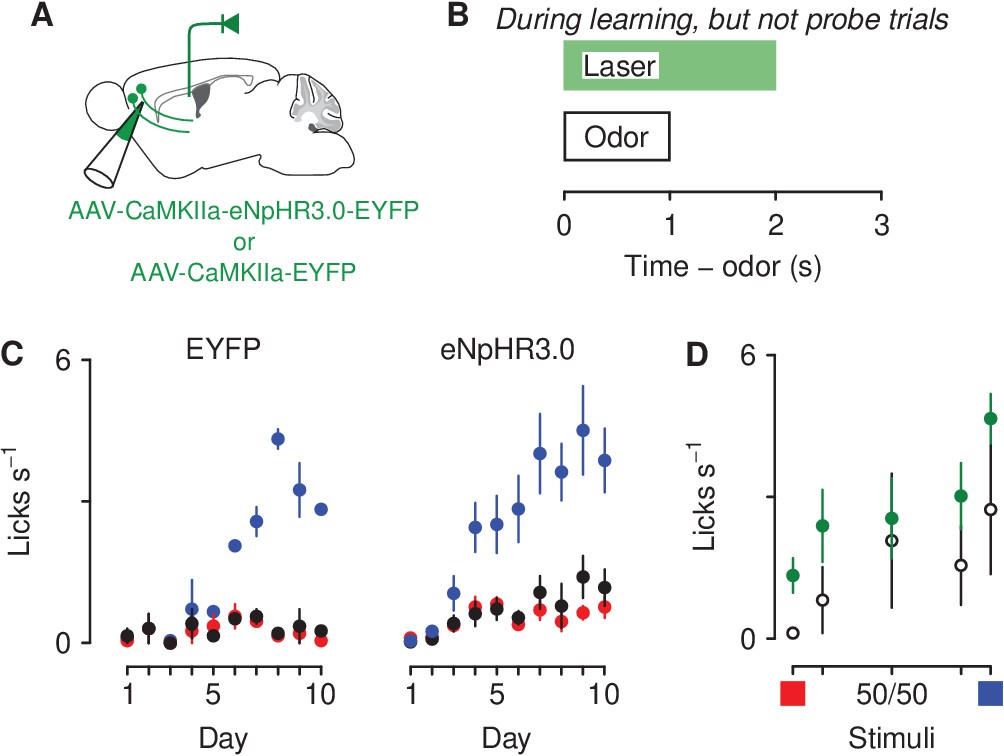
Optogenetic inhibition of corticothalamic neurons prevents negatively bias responses to motivationally-relevant stimuli.
(A) Schematic of viral stereotaxic injection of AAV1-CaMKIIa-eNpHR3.0-EYFP or AAV1-CaMKIIa-EYFP into mPFC and optic fiber over PVT. (B) Optical stimulation was delivered during presentation of the air-puff-predicting cue, during the 1 s delay before air-puff delivery and during air-puff delivery, only during learning. (C) Licking rates in EYFP (left, ), eNpHR3.0-eYFP (right, ) groups across conditioning, during odor and delay period (sucrose: blue, denatonium: red, no-outcome: black). (D) Licking rates during sucrose (blue square) and denatonium (red square) trials and during the eight probe trials of each mixed stimulus for EYFP (white circles), eNpHR3.0-EYFP (green circles) groups, during odor and delay period. Line and error bars represent the mean ± SEM.
Additional files
Download links
A two-part list of links to download the article, or parts of the article, in various formats.
Downloads (link to download the article as PDF)
Open citations (links to open the citations from this article in various online reference manager services)
Cite this article (links to download the citations from this article in formats compatible with various reference manager tools)
Aversive stimuli bias corticothalamic responses to motivationally significant cues
eLife 10:e57634.
https://doi.org/10.7554/eLife.57634


