Diverse nucleosome Site-Selectivity among histone deacetylase complexes
- Division of Genetics, Department of Medicine, Brigham and Women’s Hospital, United States
- Department of Biological Chemistry and Molecular Pharmacology, Harvard Medical School, United States
- Leicester Institute of Structural and Chemical Biology, Department of Molecular and Cell Biology, University of Leicester, United Kingdom
Figures
Figure 1
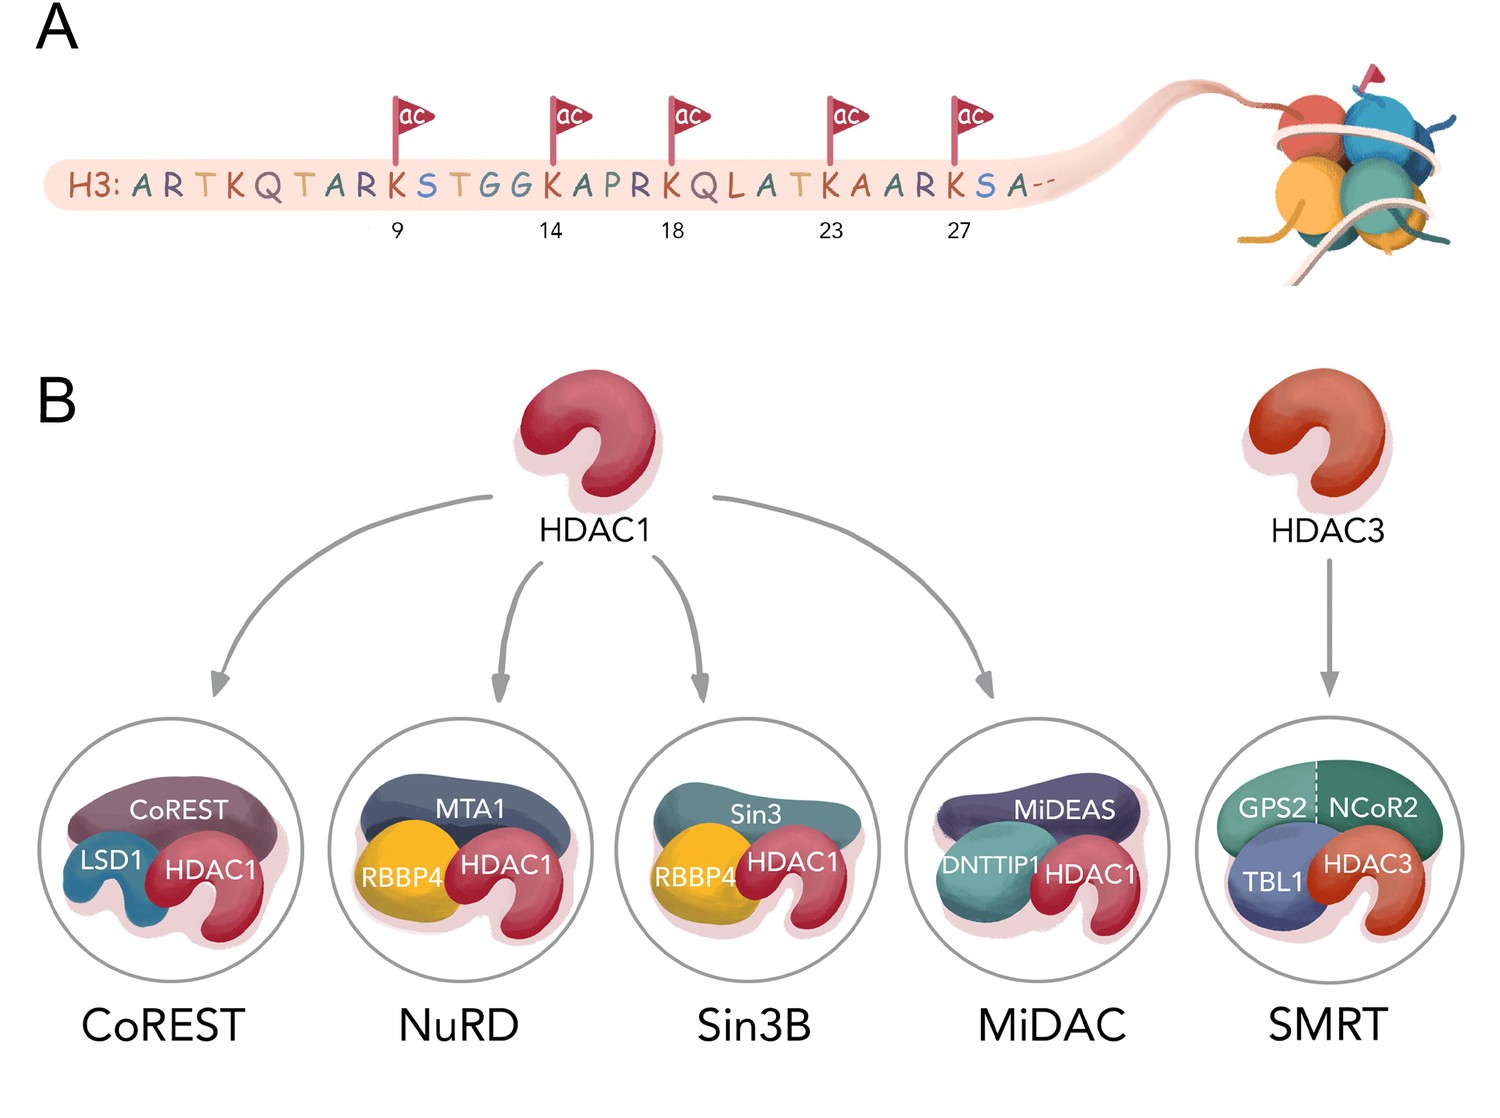
Histone H3 tail acetylation and HDAC complexes.
(A) Different acetylation sites on H3 N-terminal tail studied in this manuscript; (B) Components of four well- established HDAC1 complexes CoREST (LSD1, HDAC1, CoREST1), NuRD (MTA1, HDAC1, RBBP4), Sin3B (Sin3, HDAC1, RBBP4), MiDAC (MIDEAS, HDAC1, DNTTP1), and one HDAC3 complex SMRT (GPS2-NCoR2 chimera, HDAC3, and TBL1 ).
Figure 2 with 3 supplements
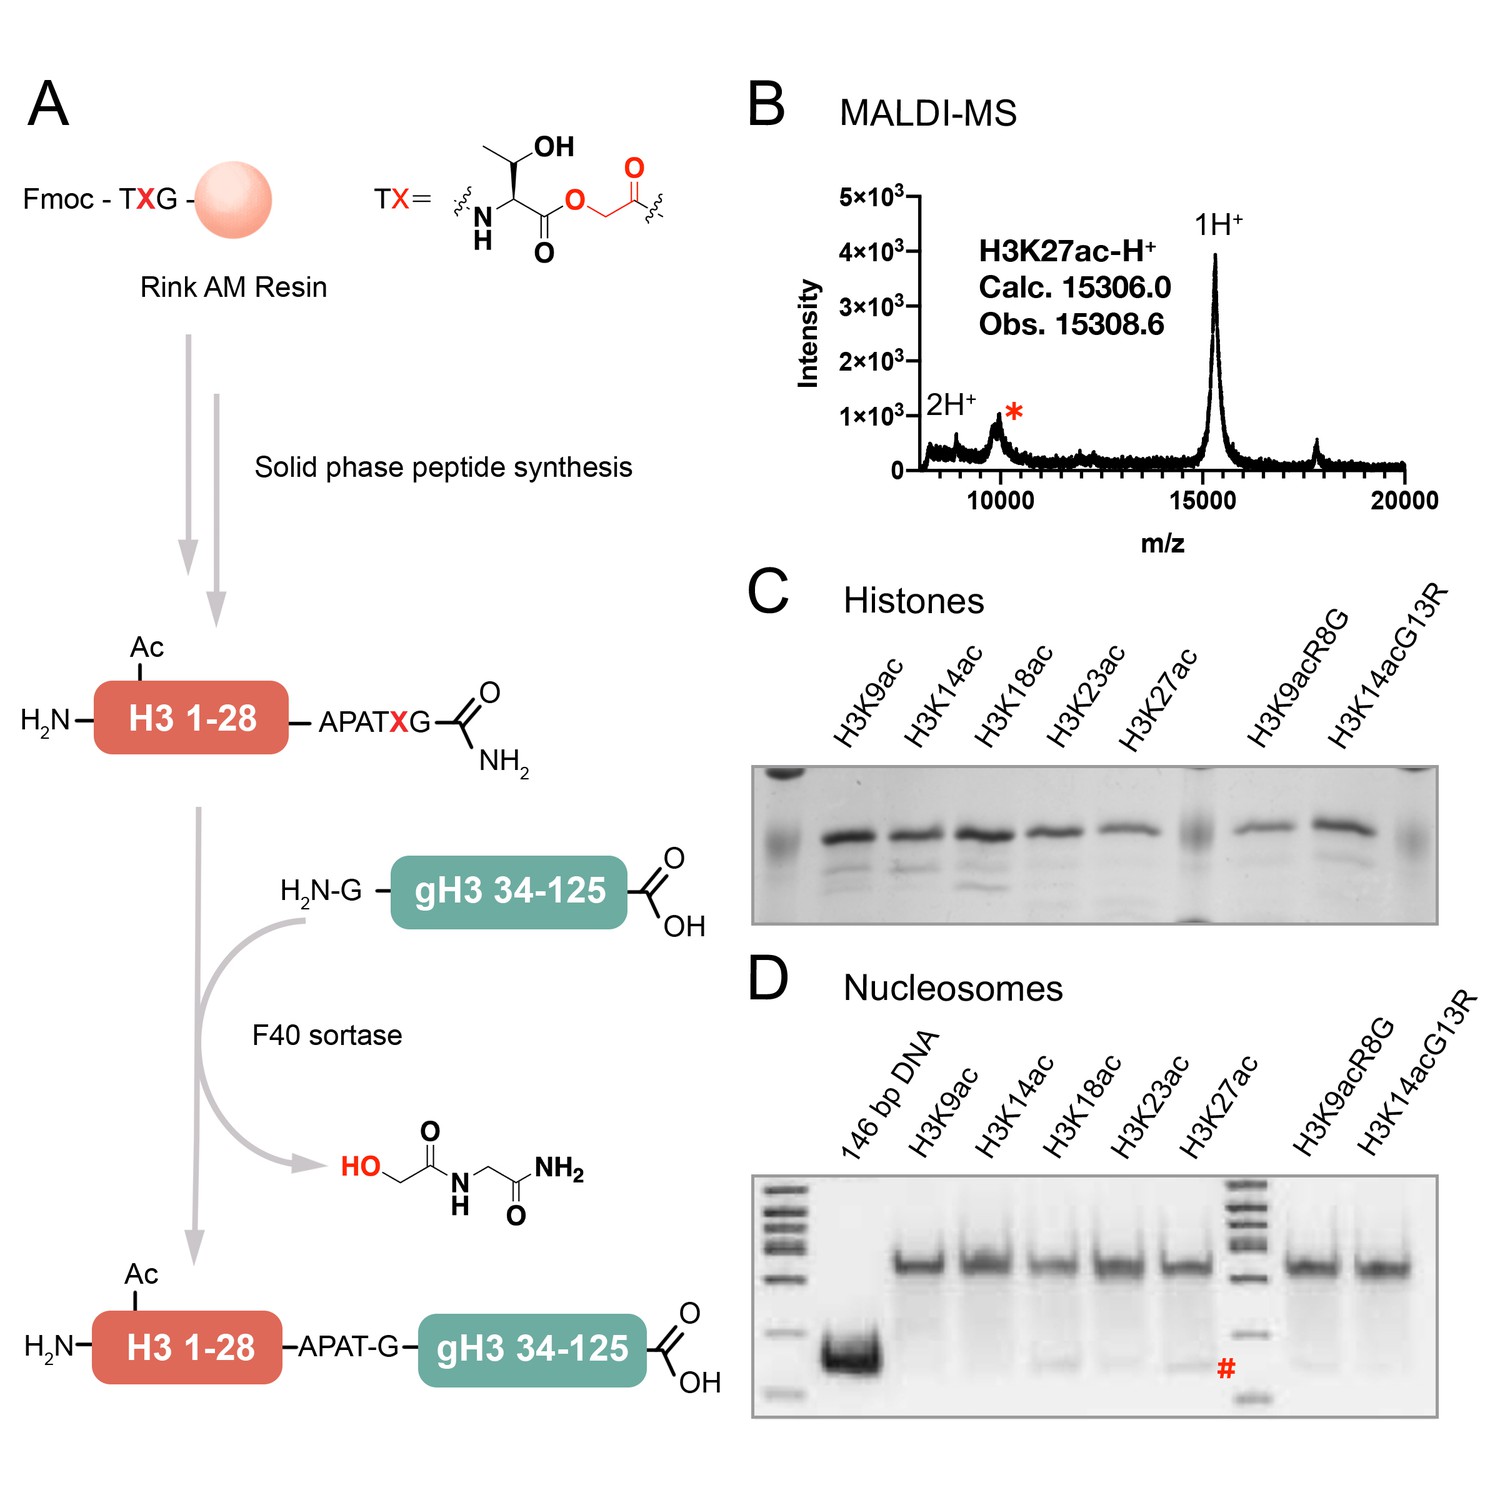
The semi-synthesis of full-length histone H3 with site-specific acetylations.
(A) Synthesis of H3 proteins with site-specific acetylations; gH3: globular region of histone H3; (B) MALDI-MS for a semi-synthetic histone H3 product, using H3K27ac as an example, *: an unknown minor impurity; (C) SDS-PAGE of all the H3 proteins with acetylations, as H3K9ac, H3K14ac, H3K18ac, H3K23ac, H3K27ac, H3K9acR8G, H3K14acG13R; (D) Native 6% TBE gel of the nucleosome folding results with acetylated H3s, each showing ≥95% purity. #: minor free DNA band.
Figure 2—figure supplement 1
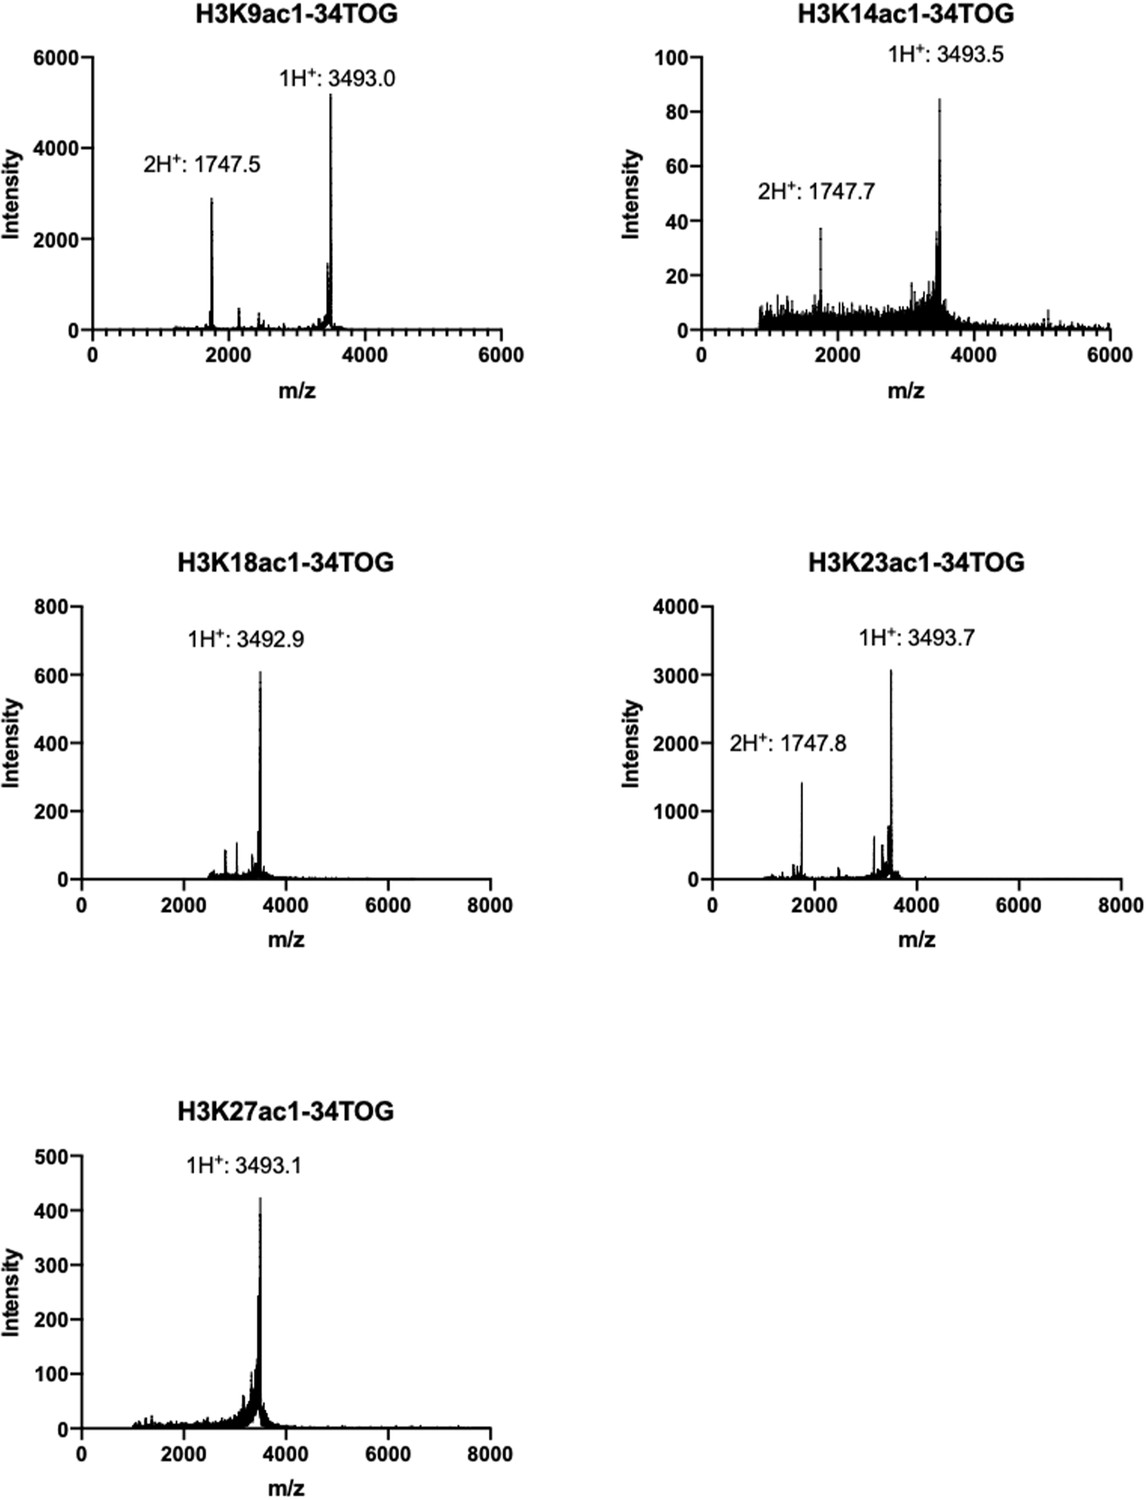
MALDI-TOF spectra for H3K9/14/18/23/27ac 1–34 TOG peptides.
Figure 2—figure supplement 2
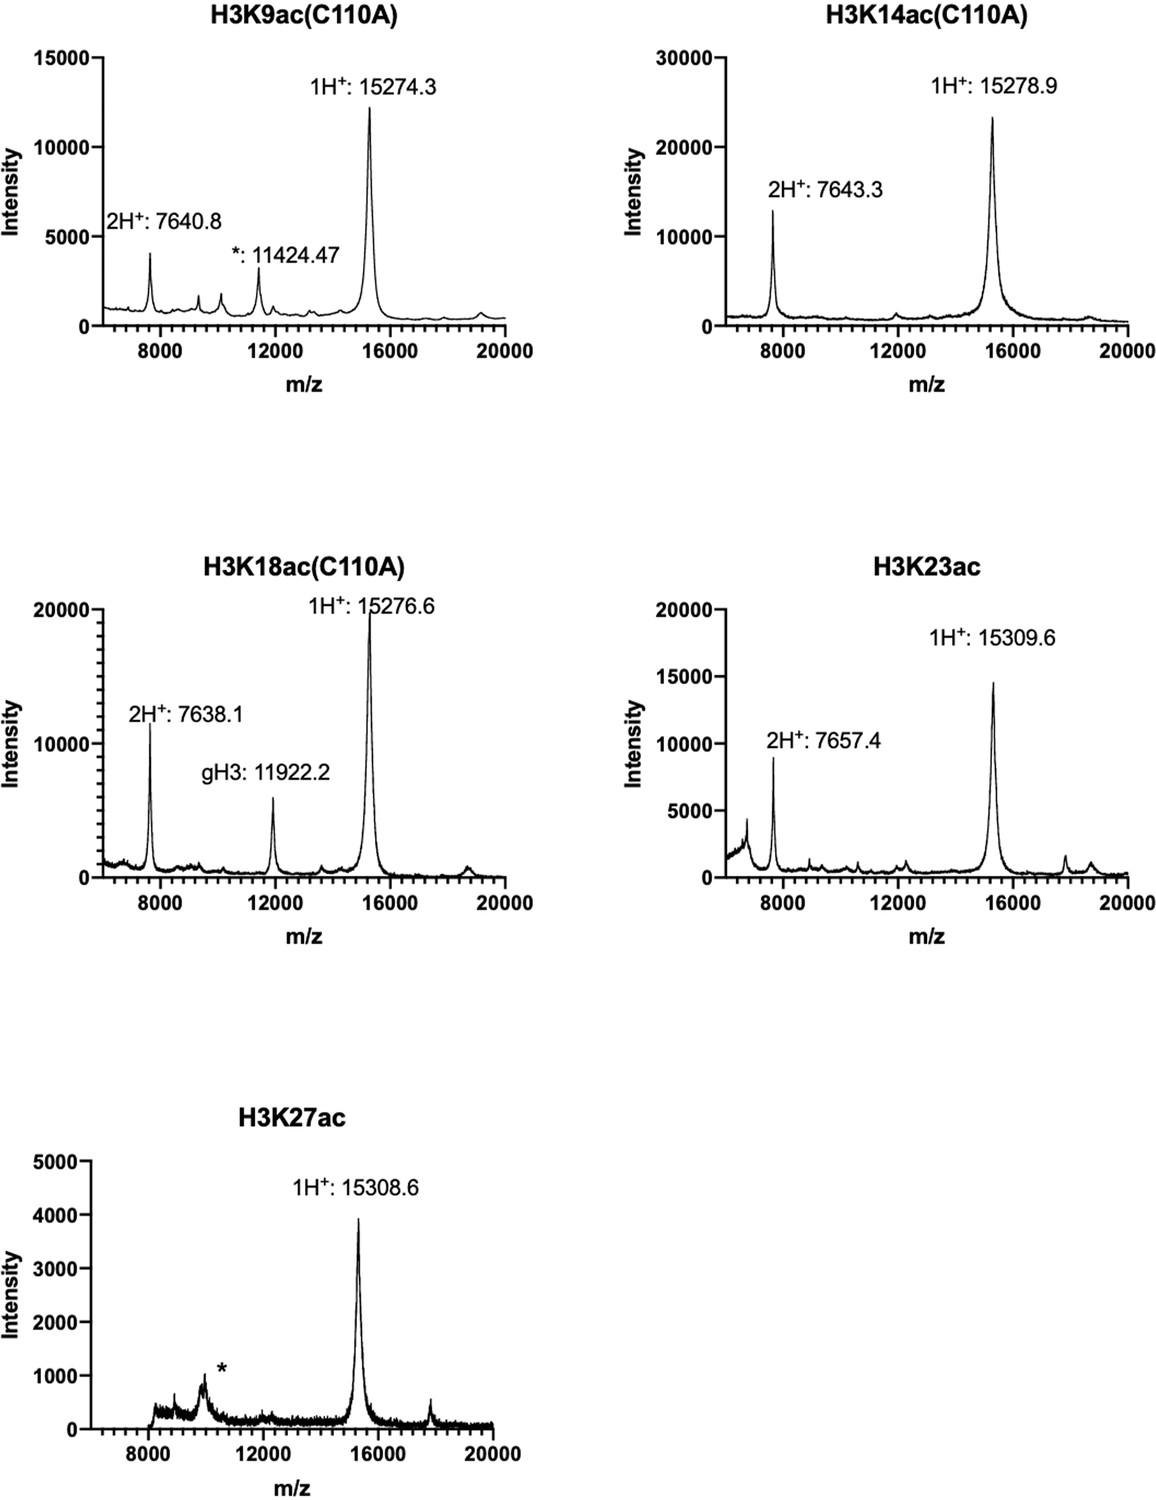
MALDI-TOF spectra for H3K9/14/18/23/27ac full length histone proteins.
Final product with single charged peak (1H+) and double charged peak (2H+) are labeled; minor gH3 impurity is also labeled; For H3K9ac(C110A) and H3K27ac, *: an unknown minor impurity.
Figure 2—figure supplement 3
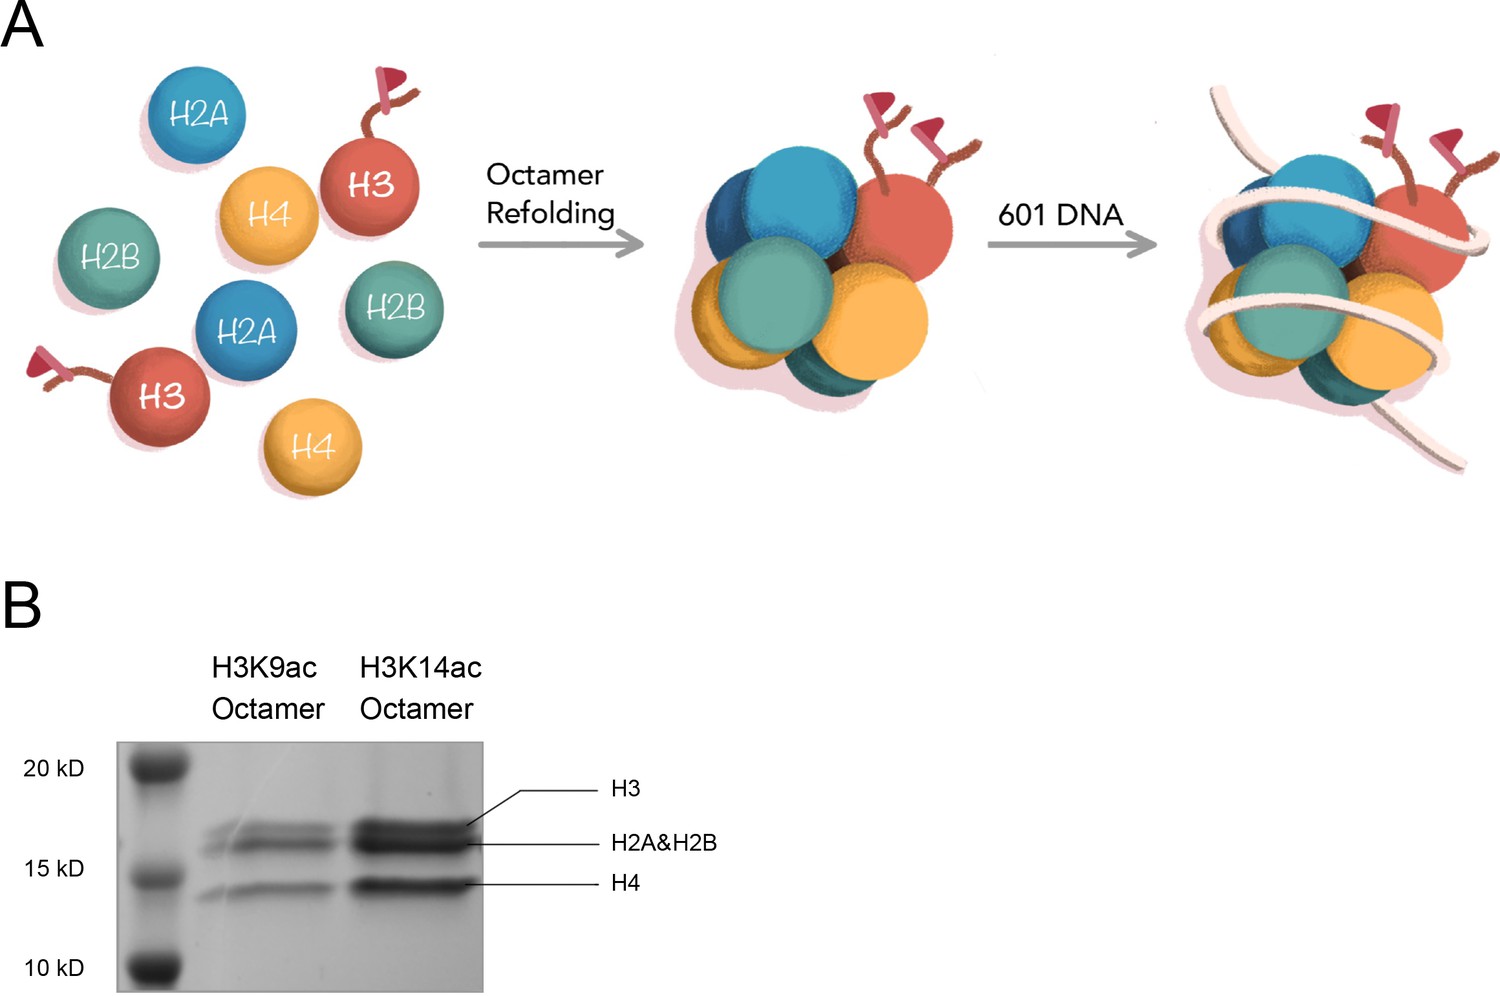
The assembly of H3 proteins with acetylations into corresponding nucleosomes.
(A) Assembly of nucleosome with site-specific acetylated H3 in vitro with 146 bp Widom 601 DNA; (B) SDS-PAGE for octamer, using H3K9ac and H3K14ac as examples.
Figure 3 with 2 supplements
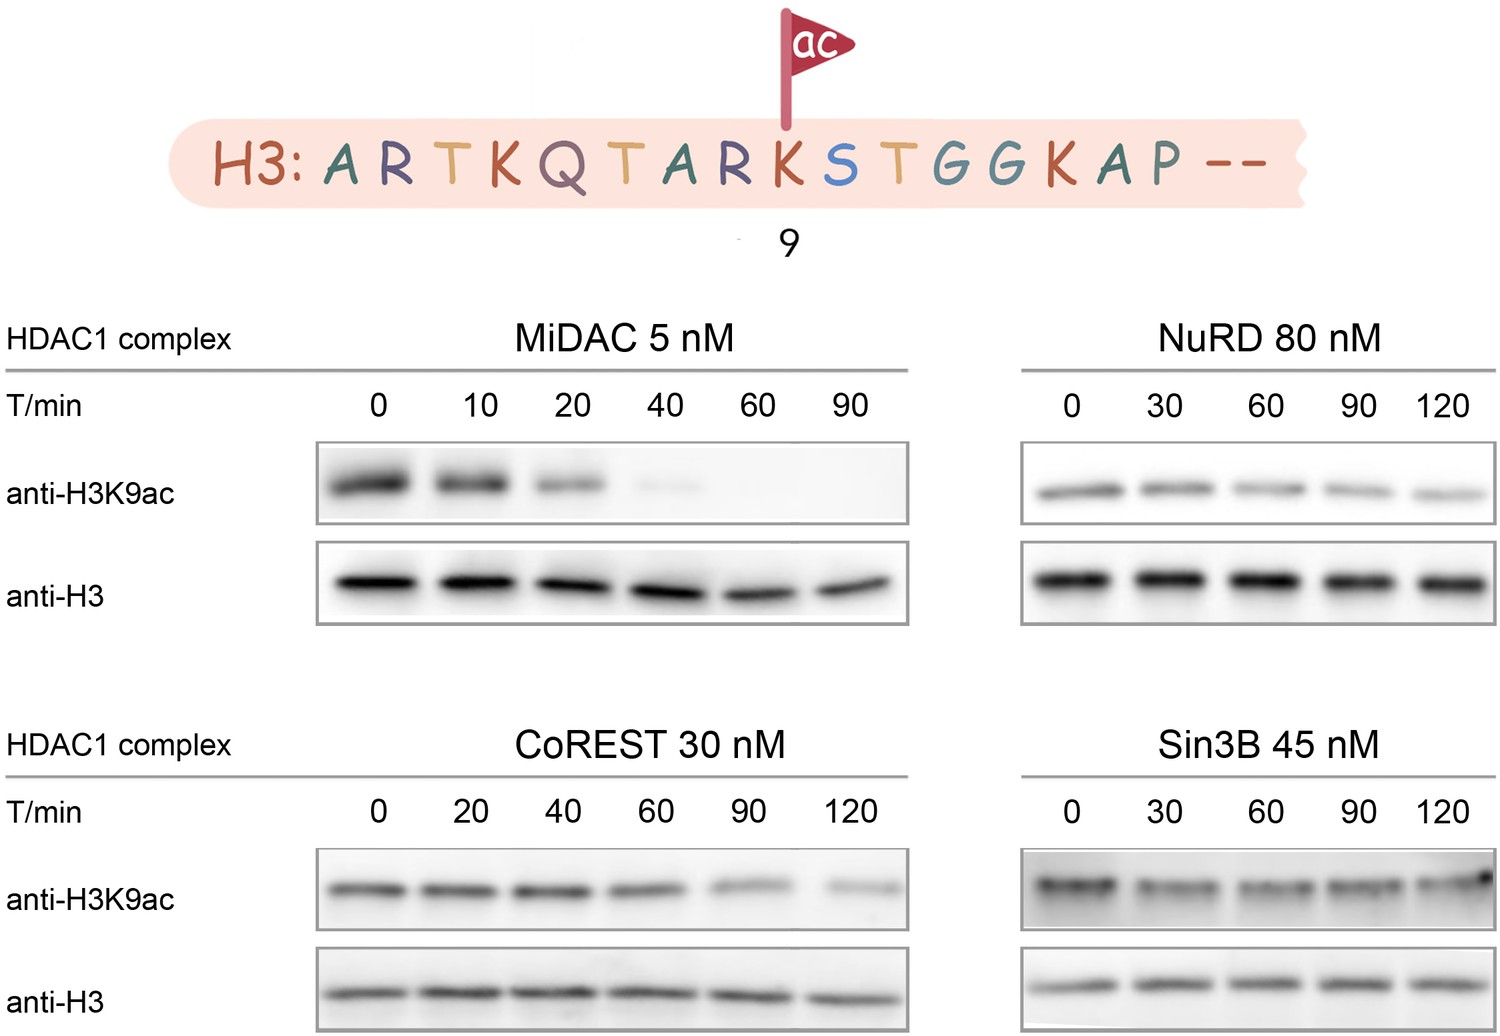
Typical results for Western-blot based deacetylation activity assay using different complexes on nucleosome with H3K9ac (n = 2 for each assay).
Figure 3—figure supplement 1
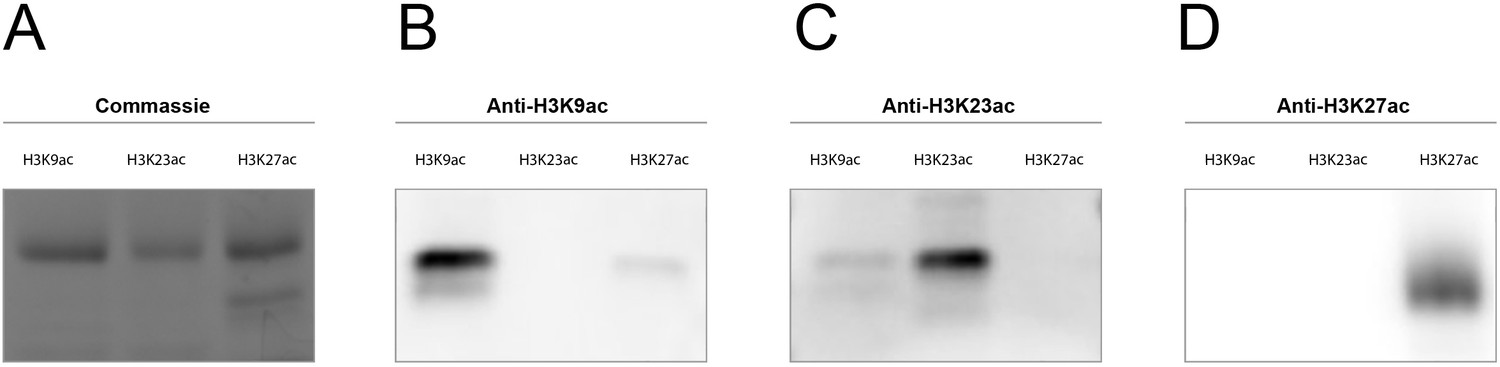
Primary antibody specificity test for anti-H3K23ac and anti-H3K27ac.
SDS-PAGE with histone H3K9ac, H3K23ac and H3K27ac was stained by (A) Coomassie, or transferred to membrane followed by blotting with (B) anti-H3K9ac, (C) anti-H3K23ac, or (D) anti-H3K27ac, separately.
Figure 3—figure supplement 2
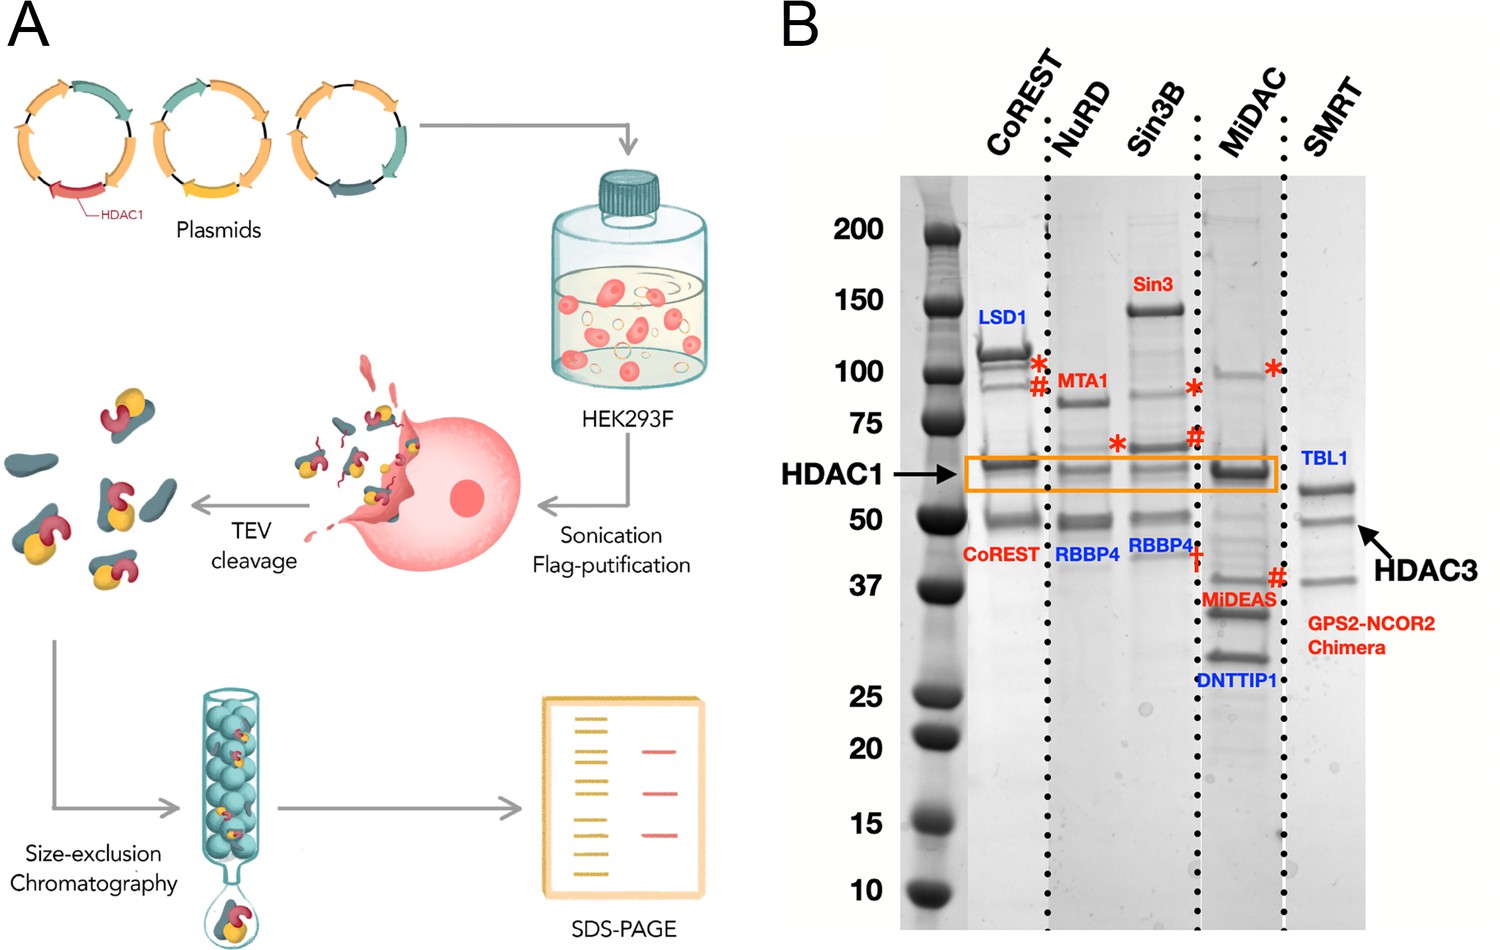
The expression of HDAC complexes.
CoREST including LSD1 (1–852), HDAC1 (1–482), Flag tagged CoREST1(86–485); NuRD including Flag tagged MTA1 (1–715), HDAC1 (1–482), RBBP4 (1–425); Sin3B including Flag tagged Sin3B (1–1162), HDAC1 (1–482), RBBP4(1–425); MiDAC including Flag tagged MIDEAS (628-887), HDAC1 (1–482), DNTTP1(1–329), and SMRT including Flag tagged GPS2-NCOR2 chimera ((1-49 - 220-480)), HDAC3 (1–428), TBL1(1-526) in HEK293F cells. (A) Scheme of the expression and purification of HDAC1 and HDAC3 complexes from mammalian HEK293F cells; (B) SDS-PAGE for four HDAC1 and HDAC3 complexes. The HDAC1 and HDAC3 are shown with black arrows. The scaffold proteins are shown in red, and the third components of each complex are shown in blue. The impurity bands and calculated purity of each HDAC complexes as for CoREST 84% purity, *: impurity band 1, #: impurity band 2; for NuRD 93% purity, *: impurity band 1; for Sin3B, 63% purity, *: impurity band 1, #: impurity band 2, †: impurity band 3; for MiDAC 84% purity, *: impurity band 1, #: impurity band 2; for SMRT 99% purity, no significant impurity band.
Figure 4 with 6 supplements
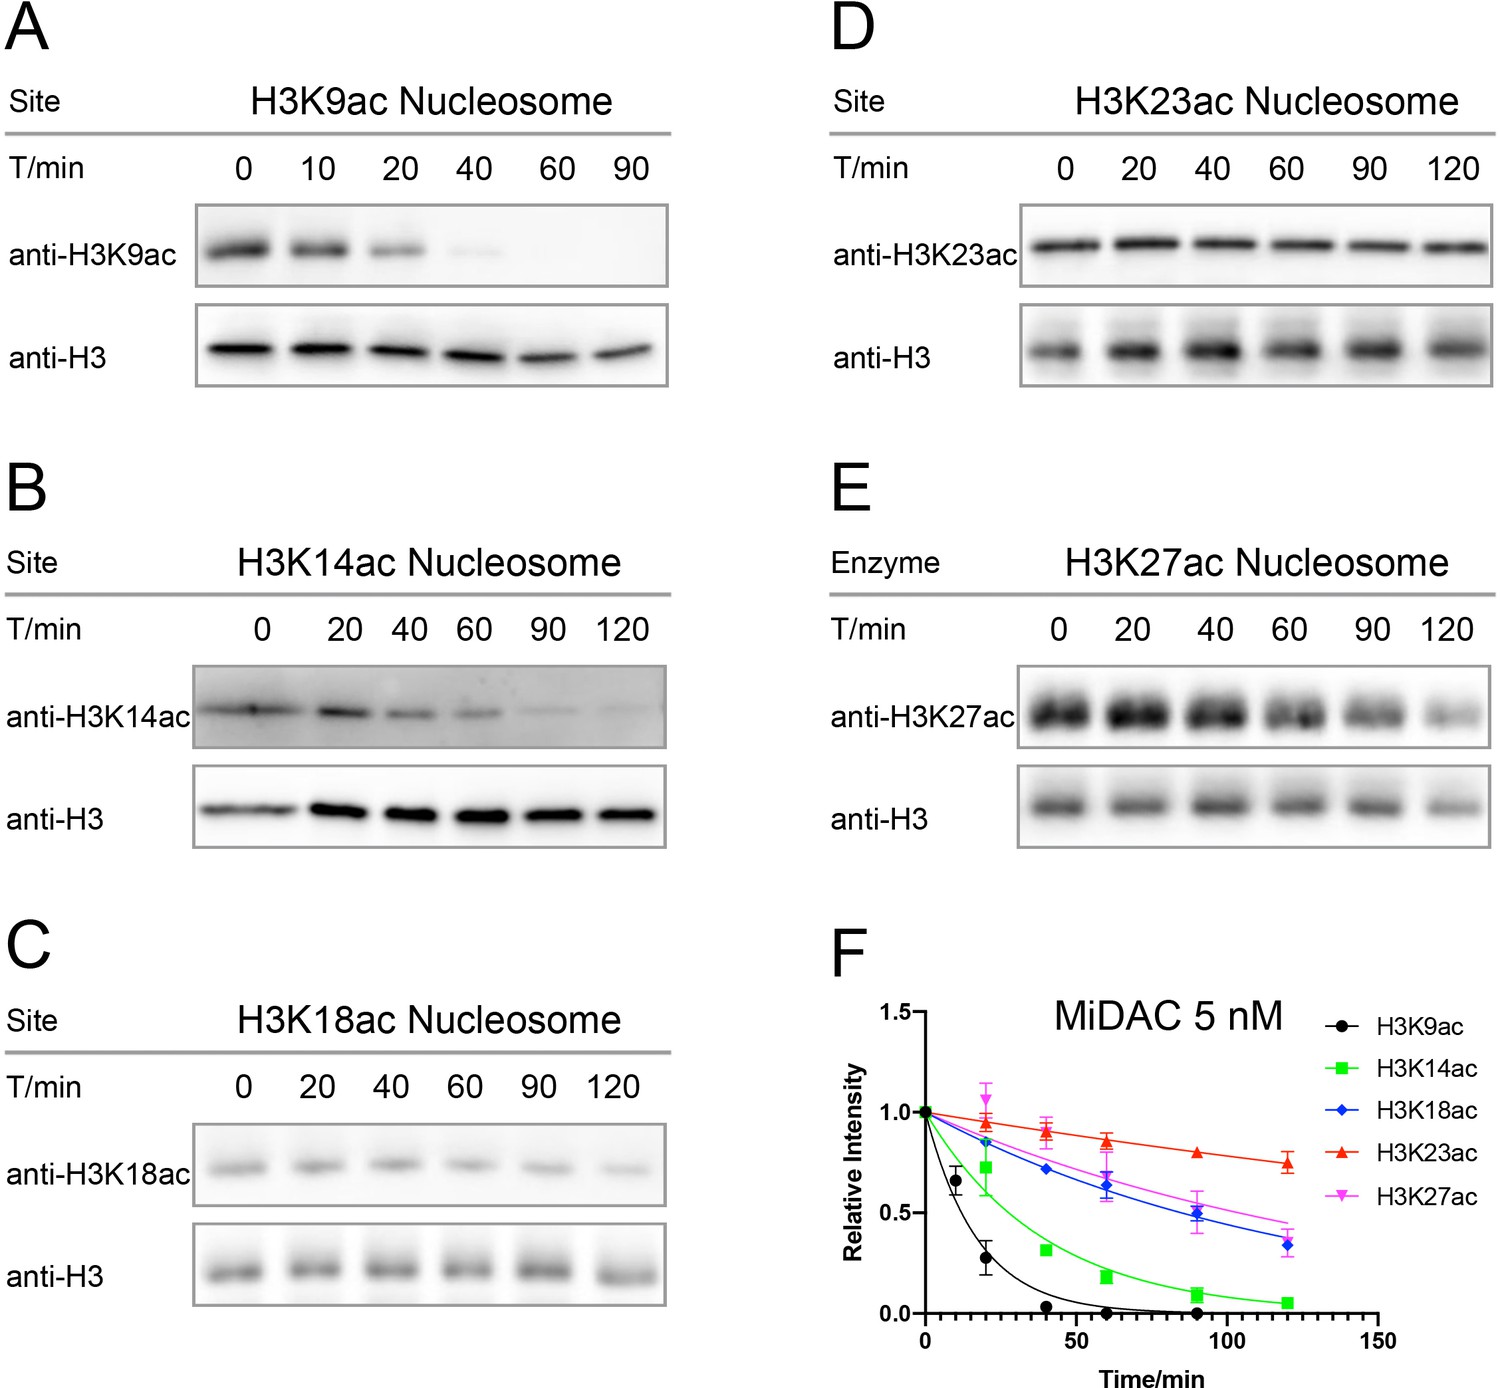
Typical results for Western-blot based deacetylation activity assay with 5 nM MiDAC on different nucleosomes with site-specific acetylation.
(A) nucleosome with H3K9ac, n = 2, V/E = 1.2 ± 0.19 min−1; (B) nucleosome with H3K14ac, n = 3, V/E = 0.52 ± 0.034 min−1; (C) nucleosome with H3K18ac, n = 2, V/E = 0.17 ± 0.0051 min−1; (D) nucleosome with H3K23ac, n = 4, V/E = 0.048 ± 0.0071 min−1; (E) nucleosome with H3K27ac, n = 5, V/E = 0.18 ± 0.036 min−1, and (F) the curve fitting for kinetics analysis.
Figure 4—figure supplement 1
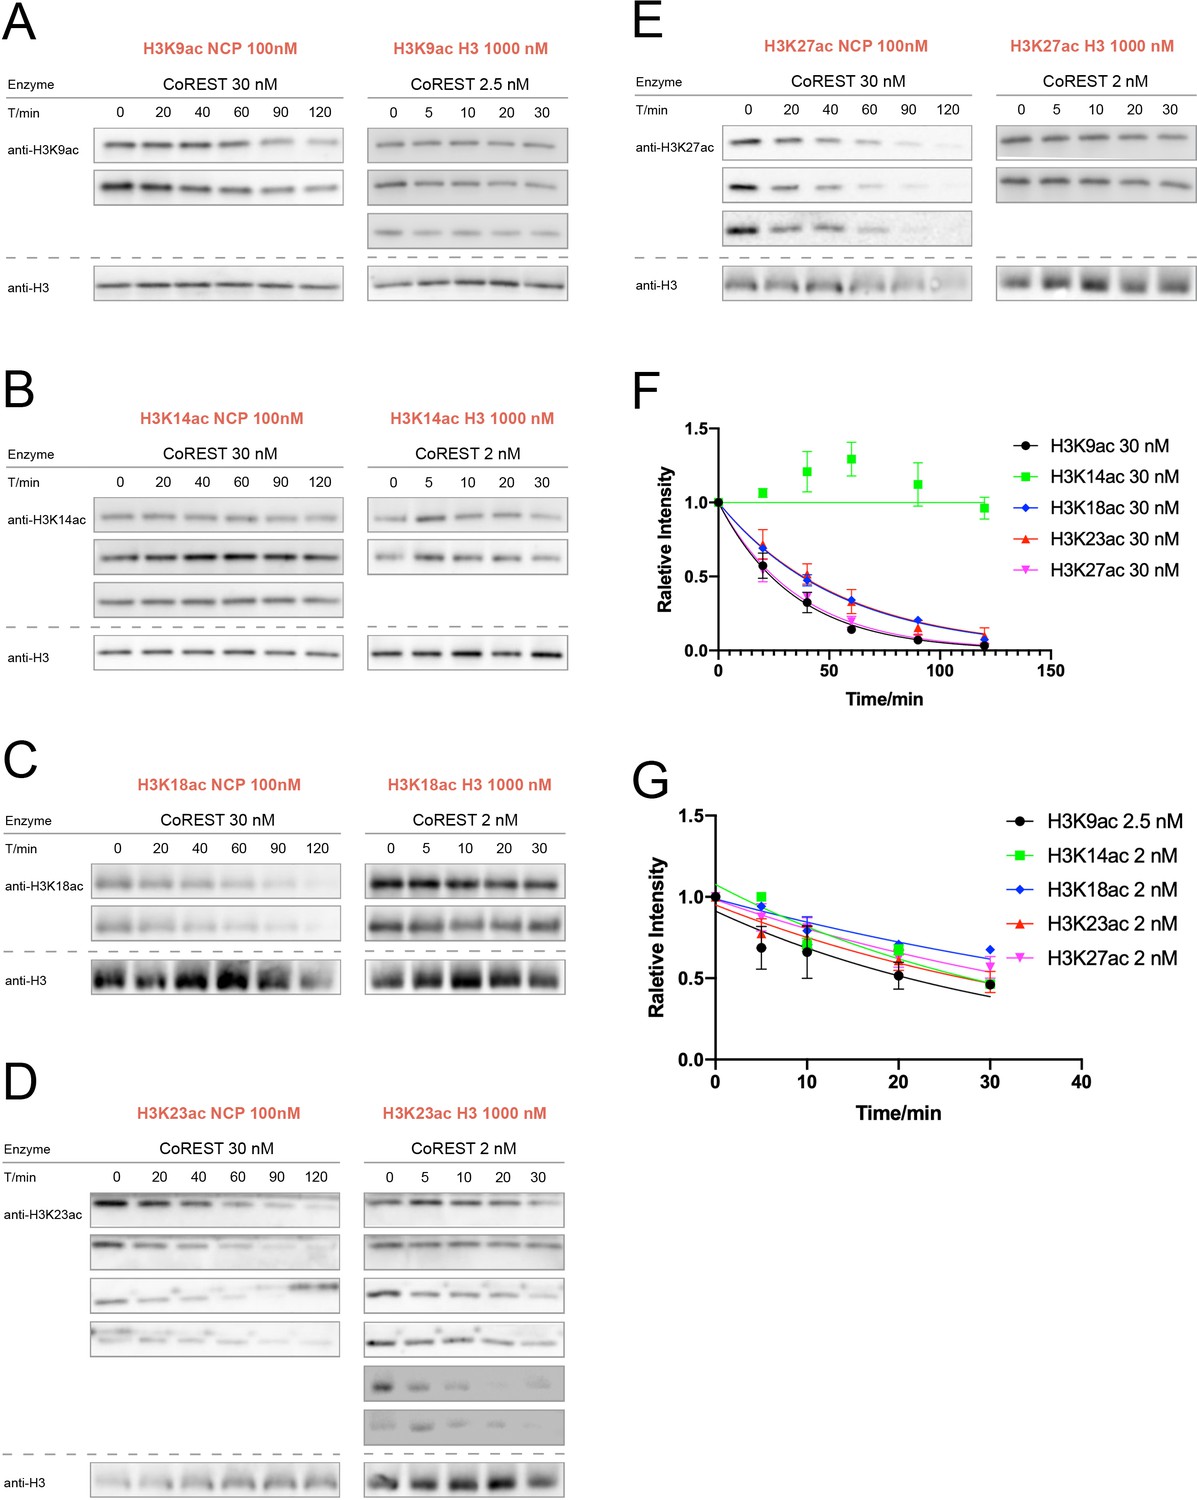
CoREST (CoREST-LSD1-HDAC1) activity assay over nucleosomes or histones with acetylation at different sites.
(A) H3K9ac (n = 2 for nucleosome assay; n = 3 for histone assay), (B) H3K14ac (n = 3 for nucleosome assay; n = 2 for histone assay); n = 3 for histone assay), (C) H3K18ac (n = 2 for nucleosome assay; n = 2 for histone assay), (D) H3K23ac (n = 4 for nucleosome assay; n = 6 for histone assay), (E) H3K27ac (n = 3 for nucleosome assay; n = 2 for histone assay). (F) Curve fitting for nucleosome kinetics with 30 nM CoREST labeled in the graph, and G. Curve fitting for histone kinetics with 2 or 2.5 nM CoREST labeled in the graph.
Figure 4—figure supplement 2
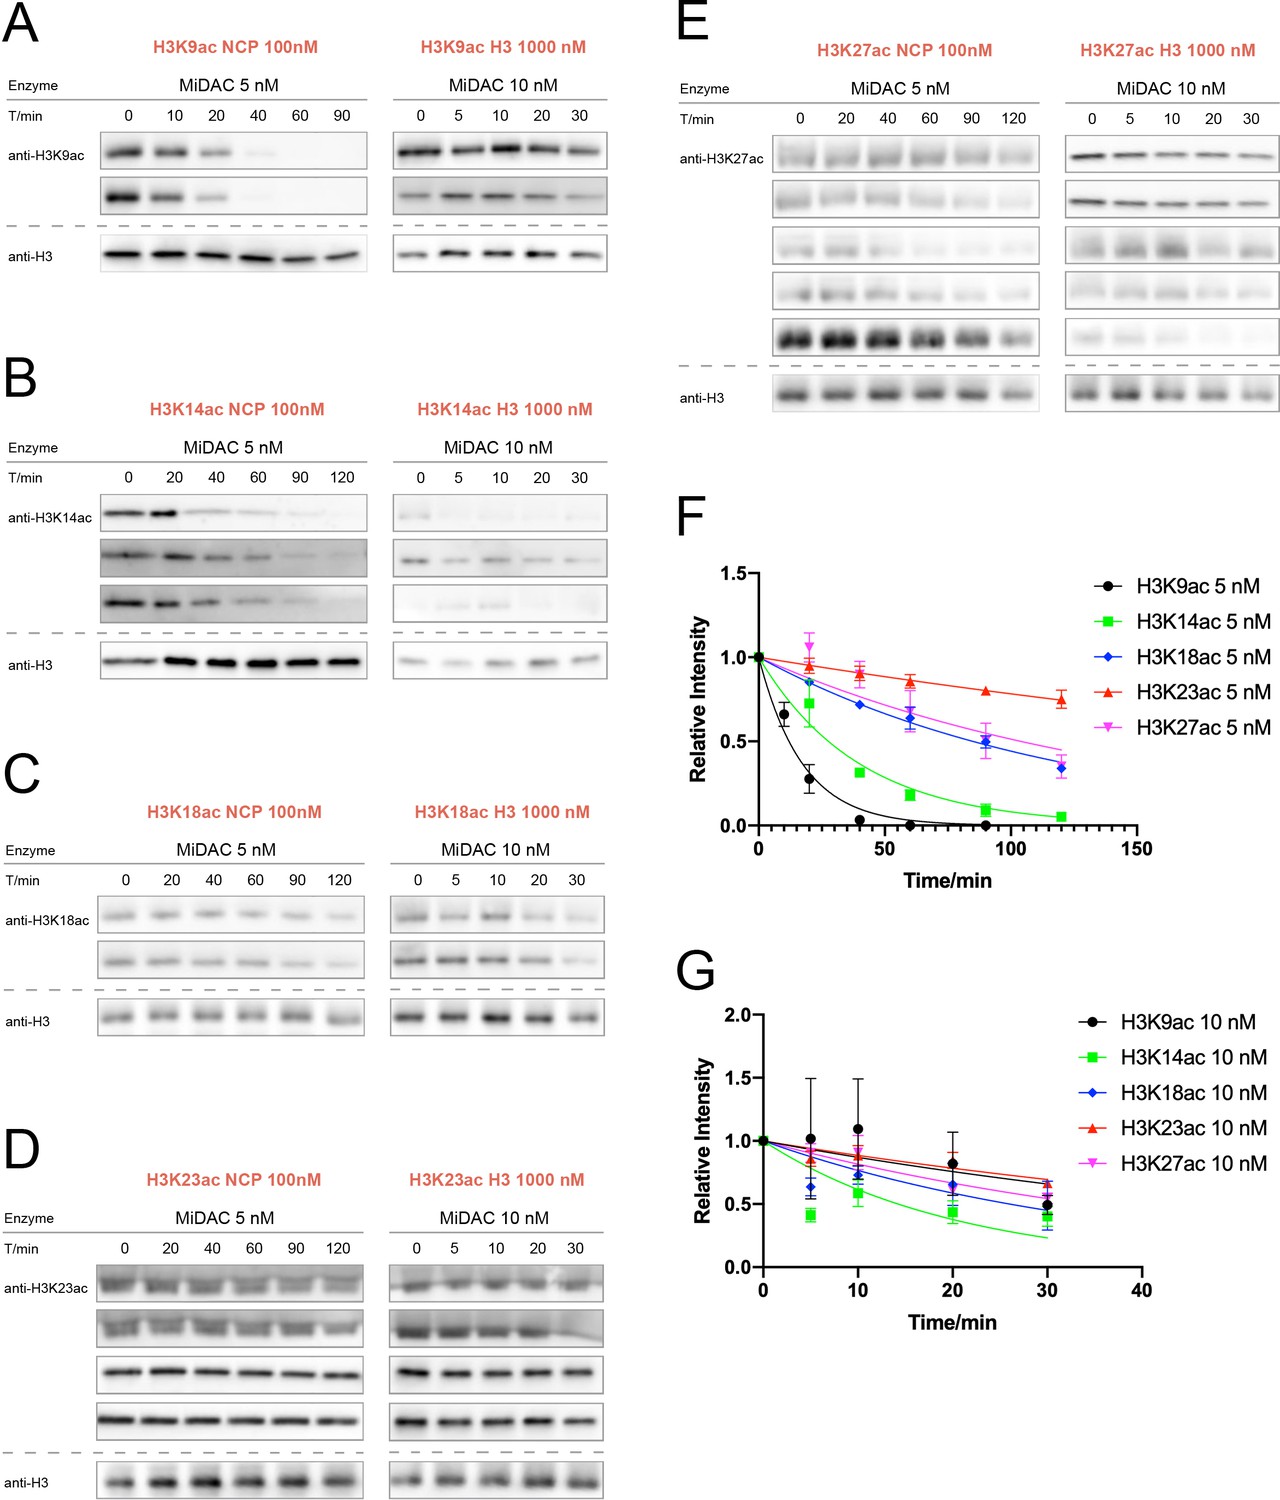
MiDAC (MiDEAS-DNTTIP1-HDAC1) activity assay over nucleosomes or histones with acetylation at different sites.
(A) H3K9ac (n = 2 for nucleosome assay; n = 2 for histone assay), (B) H3K14ac (n = 3 for nucleosome assay; n = 3 for histone assay), (C) H3K18ac (n = 2 for nucleosome assay; n = 2 for histone assay), (D) H3K23ac (n = 4 for nucleosome assay; n = 4 for histone assay), (E) H3K27ac (n = 5 for nucleosome assay; n = 5 for histone assay). (F) Curve fitting for nucleosome kinetics with 5 nM MiDAC labeled in the graph, and G. Curve fitting for histone kinetics with 10 nM MiDAC labeled in the graph.
Figure 4—figure supplement 3
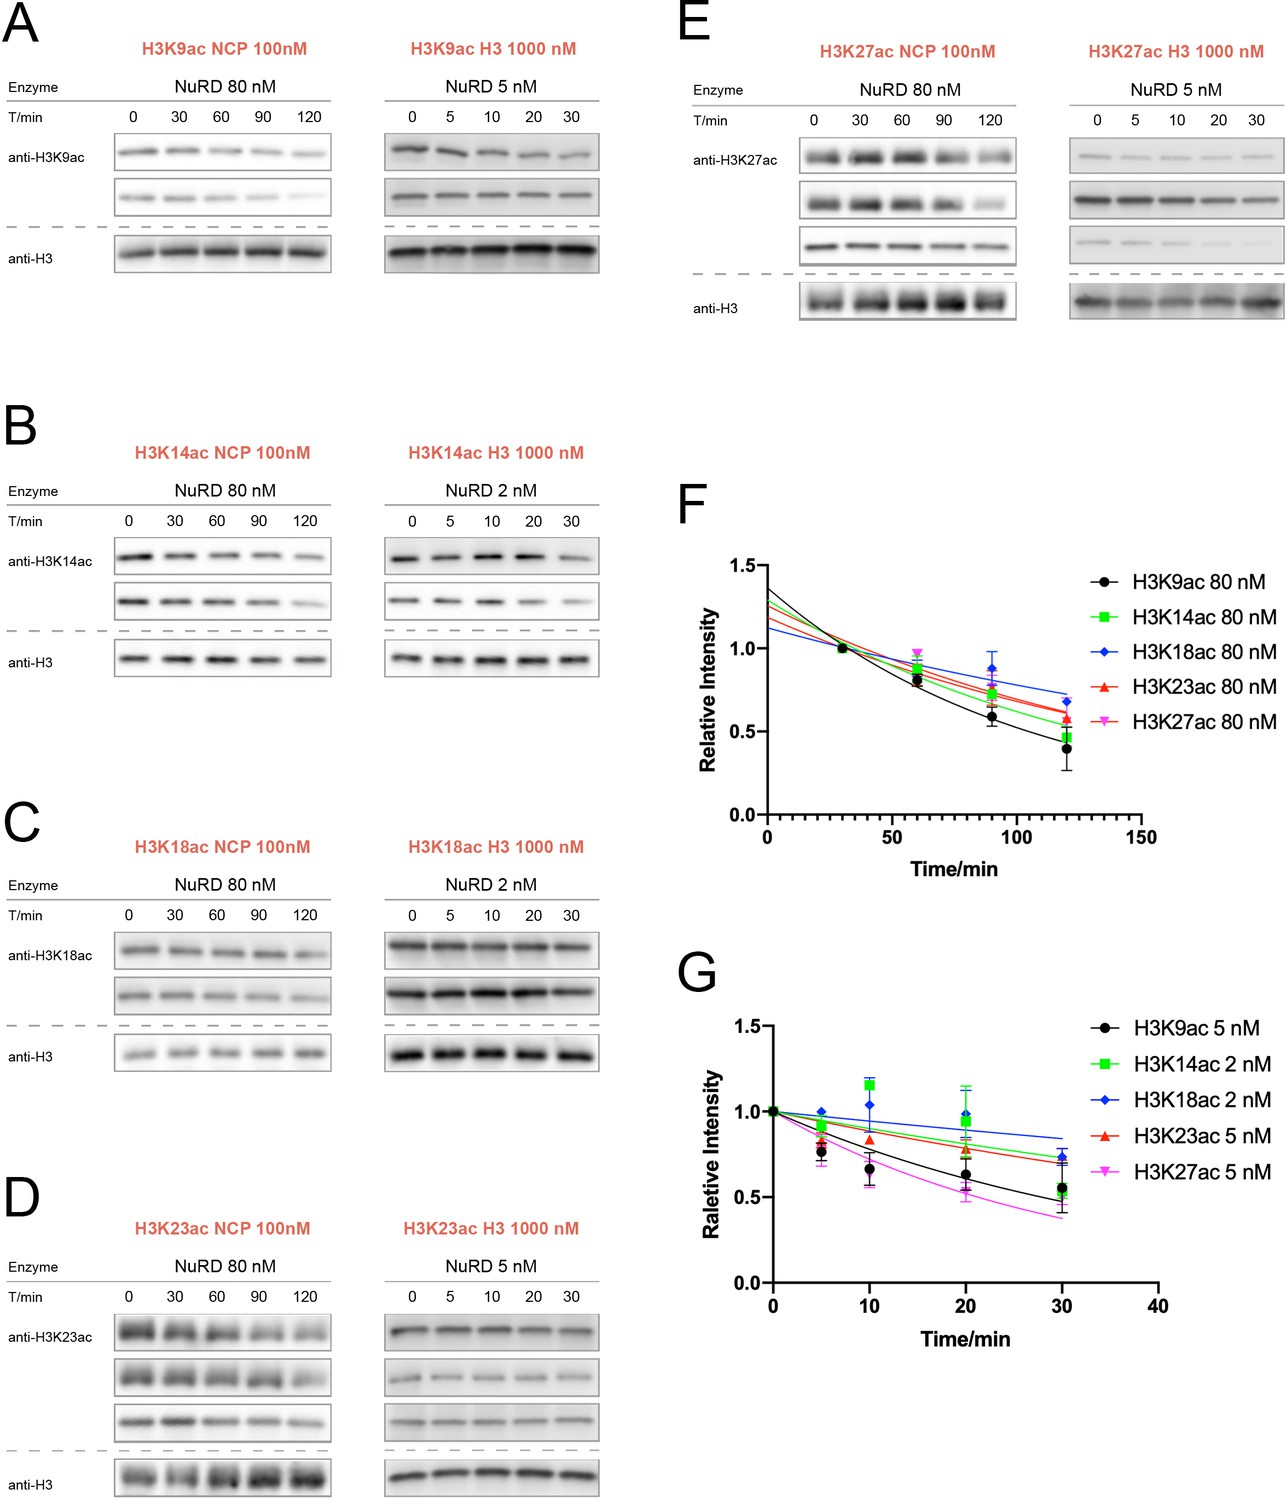
NuRD (MTA1-RBBP4-HDAC1) activity assay over nucleosomes or histones with acetylation at different sites.
(A) H3K9ac (n = 2 for nucleosome assay; n = 2 for histone assay), (B) H3K14ac (n = 2 for nucleosome assay; n = 2 for histone assay), (C) H3K18ac (n = 2 for nucleosome assay; n = 2 for histone assay), (D) H3K23ac (n = 3 for nucleosome assay; n = 3 for histone assay), (E) H3K27ac (n = 3 for nucleosome assay; n = 3 for histone assay). (F) Curve fitting for nucleosome kinetics with 80 nM NuRD labeled in the graph, and G. Curve fitting for histone kinetics with 2 or 5 nM NuRD labeled in the graph.
Figure 4—figure supplement 4
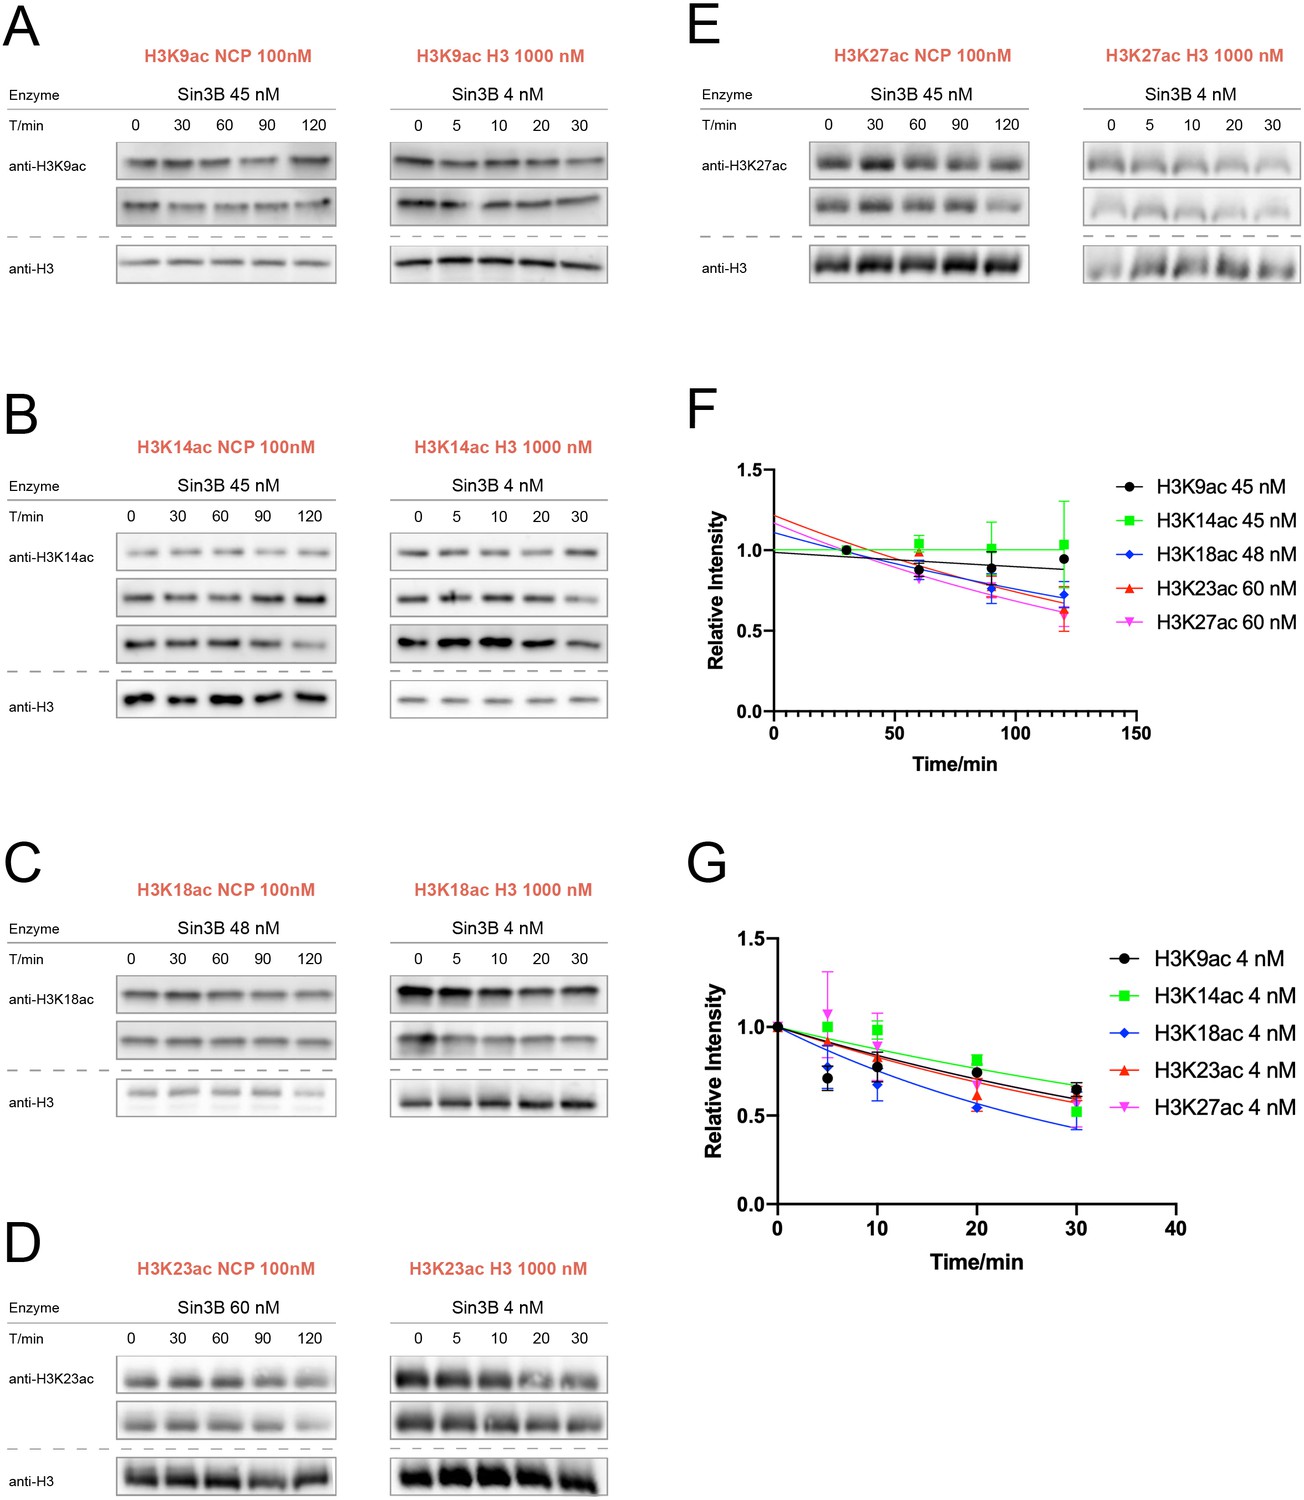
Sin3B (Sin3-HDAC1-RBBP4) activity assay over nucleosomes or histones with acetylation at different sites.
(A) H3K9ac (n = 2 for nucleosome assay; n = 2 for histone assay), (B) H3K14ac (n = 3 for nucleosome assay; n = 3 for histone assay), (C) H3K18ac (n = 2 for nucleosome assay; n = 2 for histone assay), (D) H3K23ac (n = 2 for nucleosome assay; n = 2 for histone assay), (E) H3K27ac (n = 2 for nucleosome assay; n = 2 for histone assay). (F) Curve fitting for nucleosome kinetics with 45, 48 or 60 nM Sin3B labeled in the graph, and (G) Curve fitting for histone kinetics with 4 nM Sin3B labeled in the graph.
Figure 4—figure supplement 5
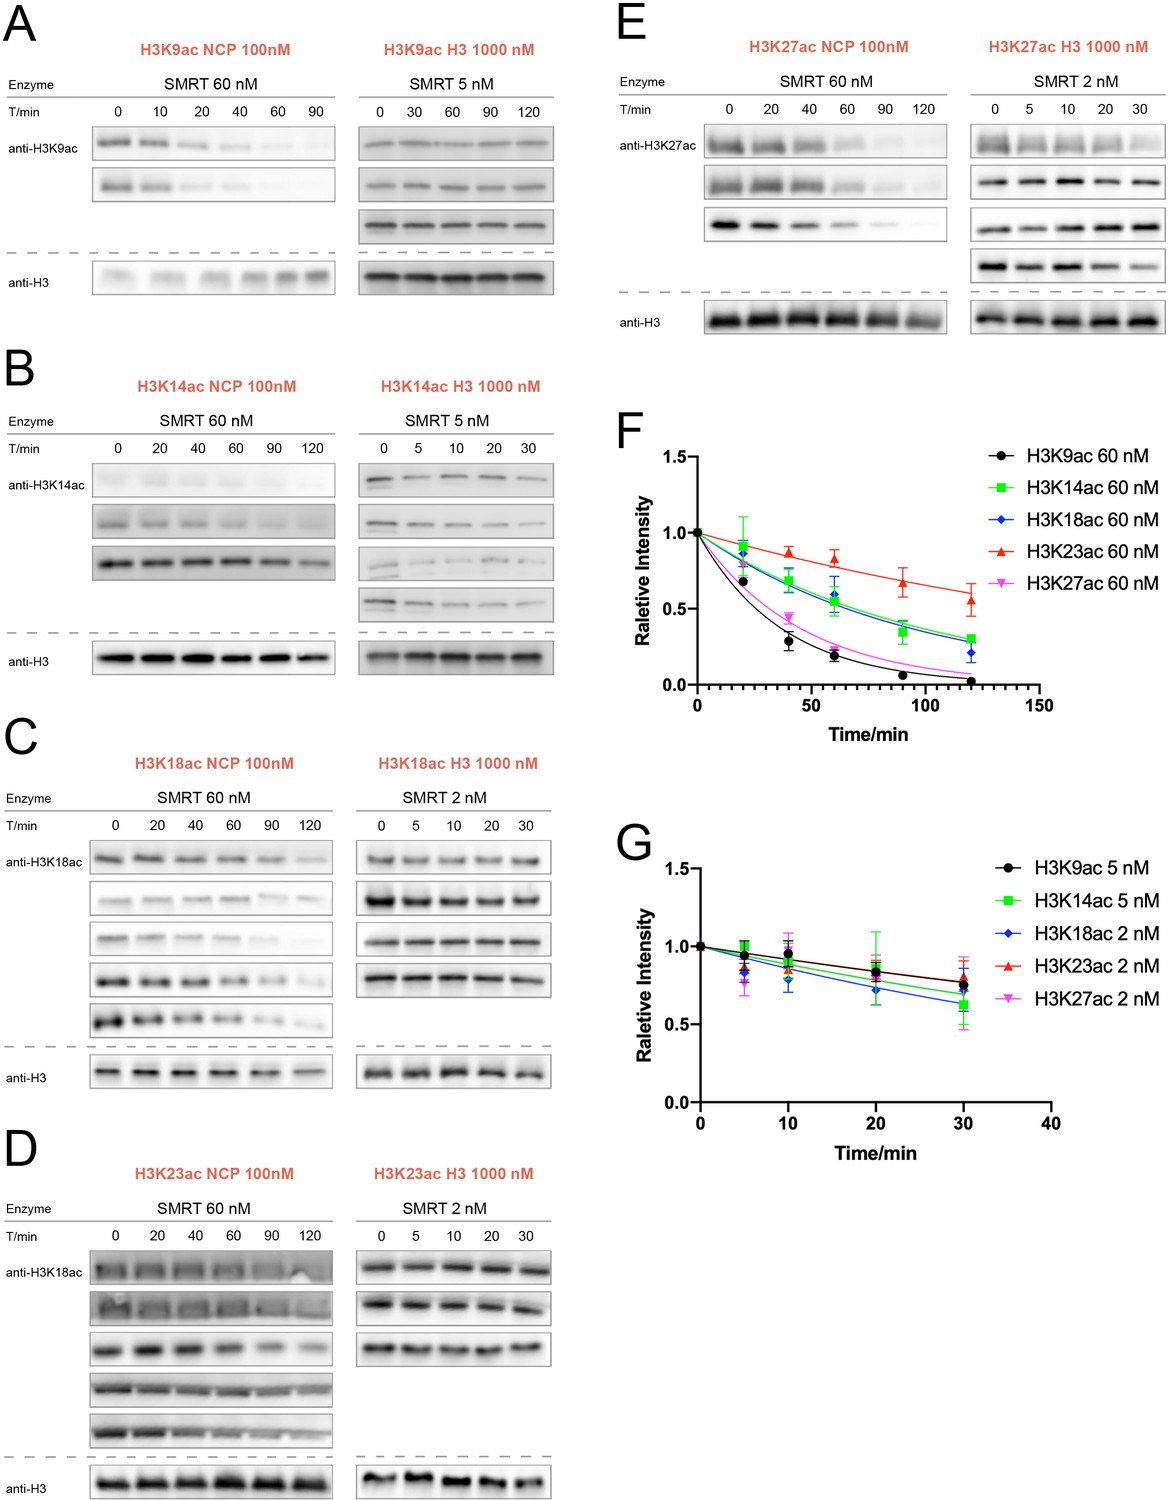
SMRT (GPS2-NCoR2 chimera-HDAC3-TBL1) activity assay over nucleosomes or histones with acetylation at different sites.
(A) H3K9ac (n = 2 for nucleosome assay; n = 3 for histone assay), (B) H3K14ac (n = 3 for nucleosome assay; n = 4 for histone assay), (C) H3K18ac (n = 5 for nucleosome assay; n = 4 for histone assay), (D) H3K23ac (n = 5 for nucleosome assay; n = 3 for histone assay), (E) H3K27ac (n = 3 for nucleosome assay; n = 4 for histone assay). (F) Curve fitting for nucleosome kinetics with 60 nM SMRT labeled in the graph, and (G) Curve fitting for histone kinetics with 2 or 5 nM SMRT labeled in the graph.
Figure 4—figure supplement 6
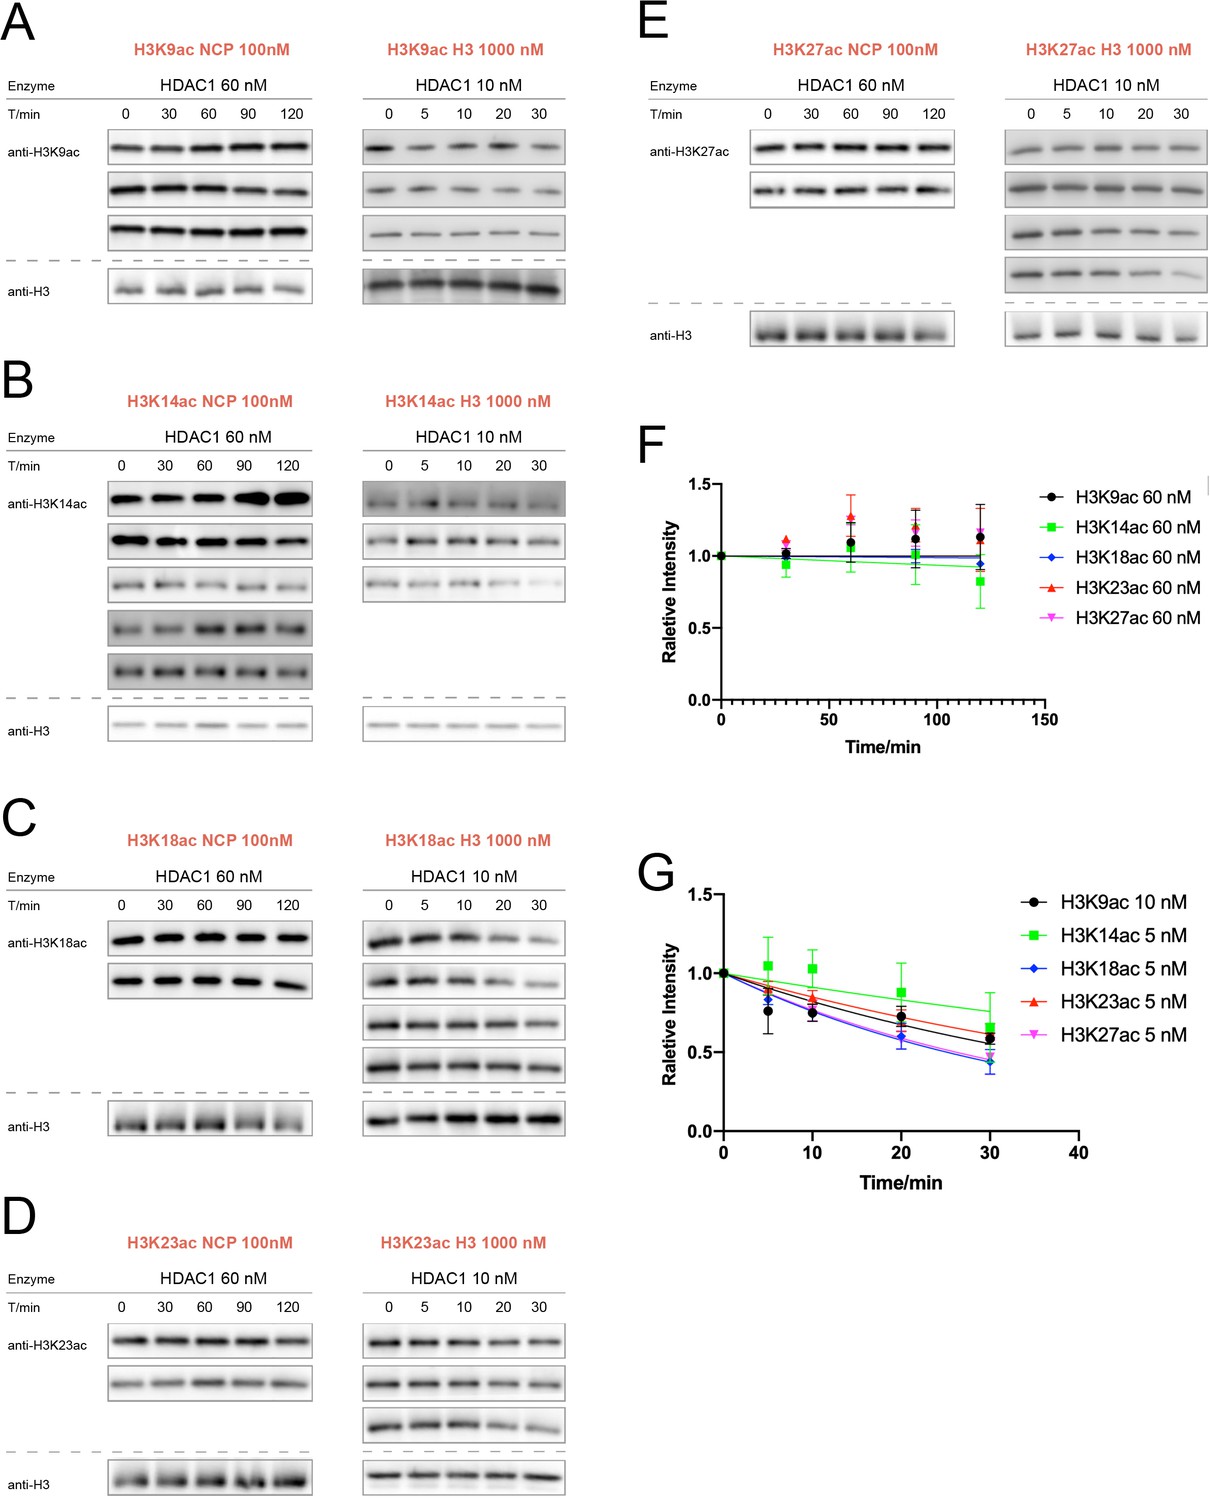
HDAC1 activity assay over nucleosomes or histones with acetylation at different sites.
(A) H3K9ac (n = 3 for nucleosome assay; n = 3 for histone assay), (B) H3K14ac (n = 5 for nucleosome assay; n = 3 for histone assay), (C) H3K18ac (n = 2 for nucleosome assay; n = 4 for histone assay), (D) H3K23ac (n = 2 for nucleosome assay; n = 3 for histone assay), (E) H3K27ac (n = 2 for nucleosome assay; n = 4 for histone assay). (F) Curve fitting for nucleosome kinetics with 60 nM HDAC1 labeled in the graph; and (G) Curve fitting for histone kinetics with 5 or 10 nM HDAC1 labeled in the graph.
Figure 5 with 3 supplements
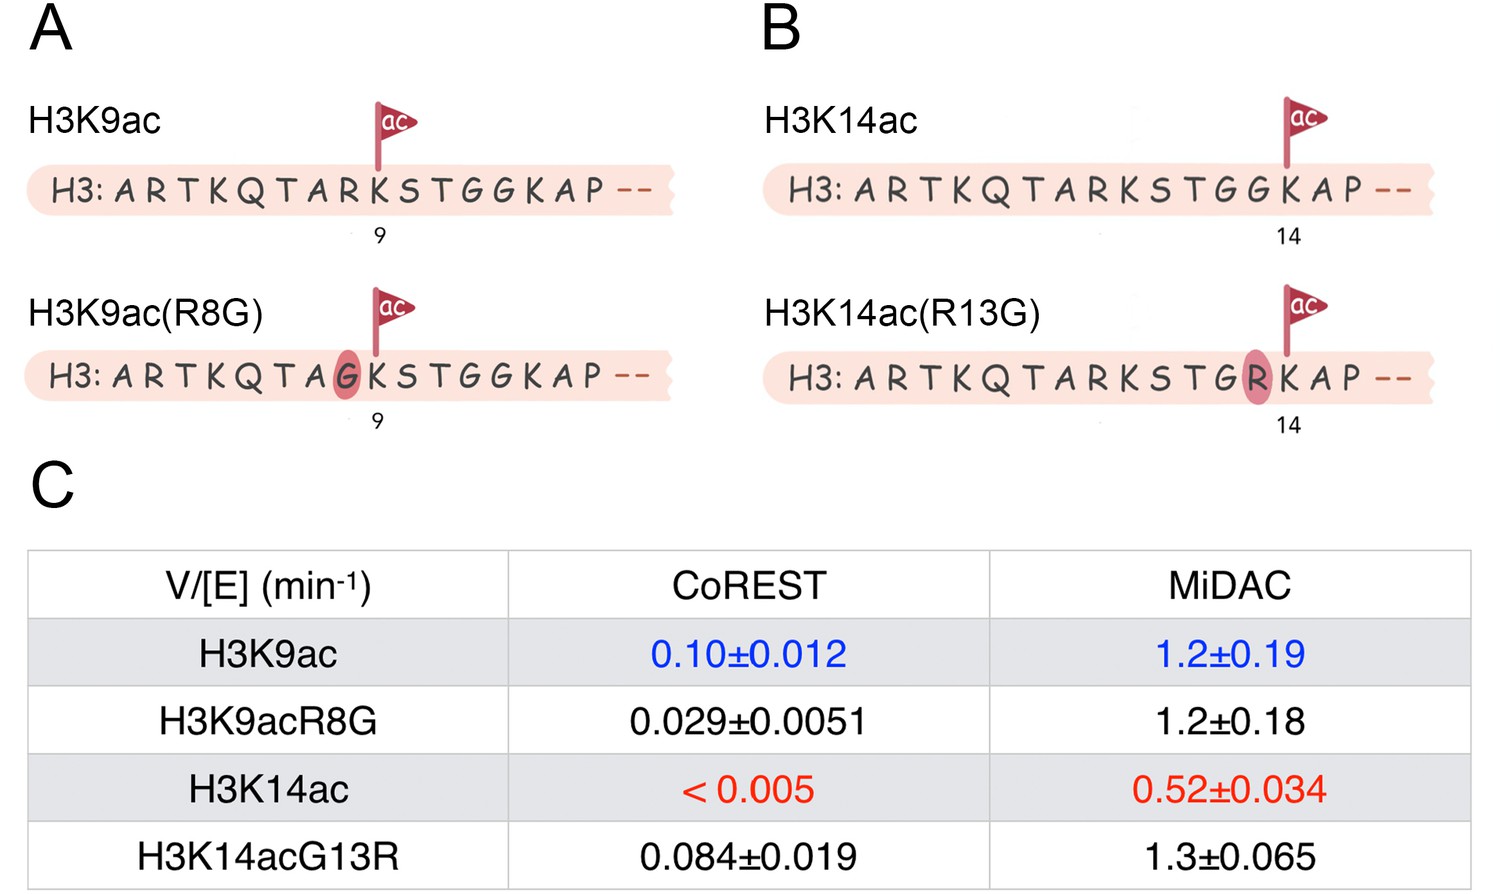
Scheme and kinetics for CoREST and MiDAC complex activity on nucleosome with mutations H3K9acR8G (n = 3 for CoREST assay, n = 5 for MiDAC assay) and 14acG13R (n = 6 for CoREST assay, n = 3 for MiDAC assay).
(A) The sequence of H3K9acR8G comparing with WT-H3K9ac; (B) The sequence of H3K14acG13R comparing with WT-H3K14ac; (C) Table for the rate constants of different complexes on nucleosomes with H3K9ac/9acR8G/14ac/14acG13R. The reaction conditions were similar to the enzymatic reactions on H3K9/14/18/23/27ac nucleosomes described in Table 1.
Figure 5—figure supplement 1
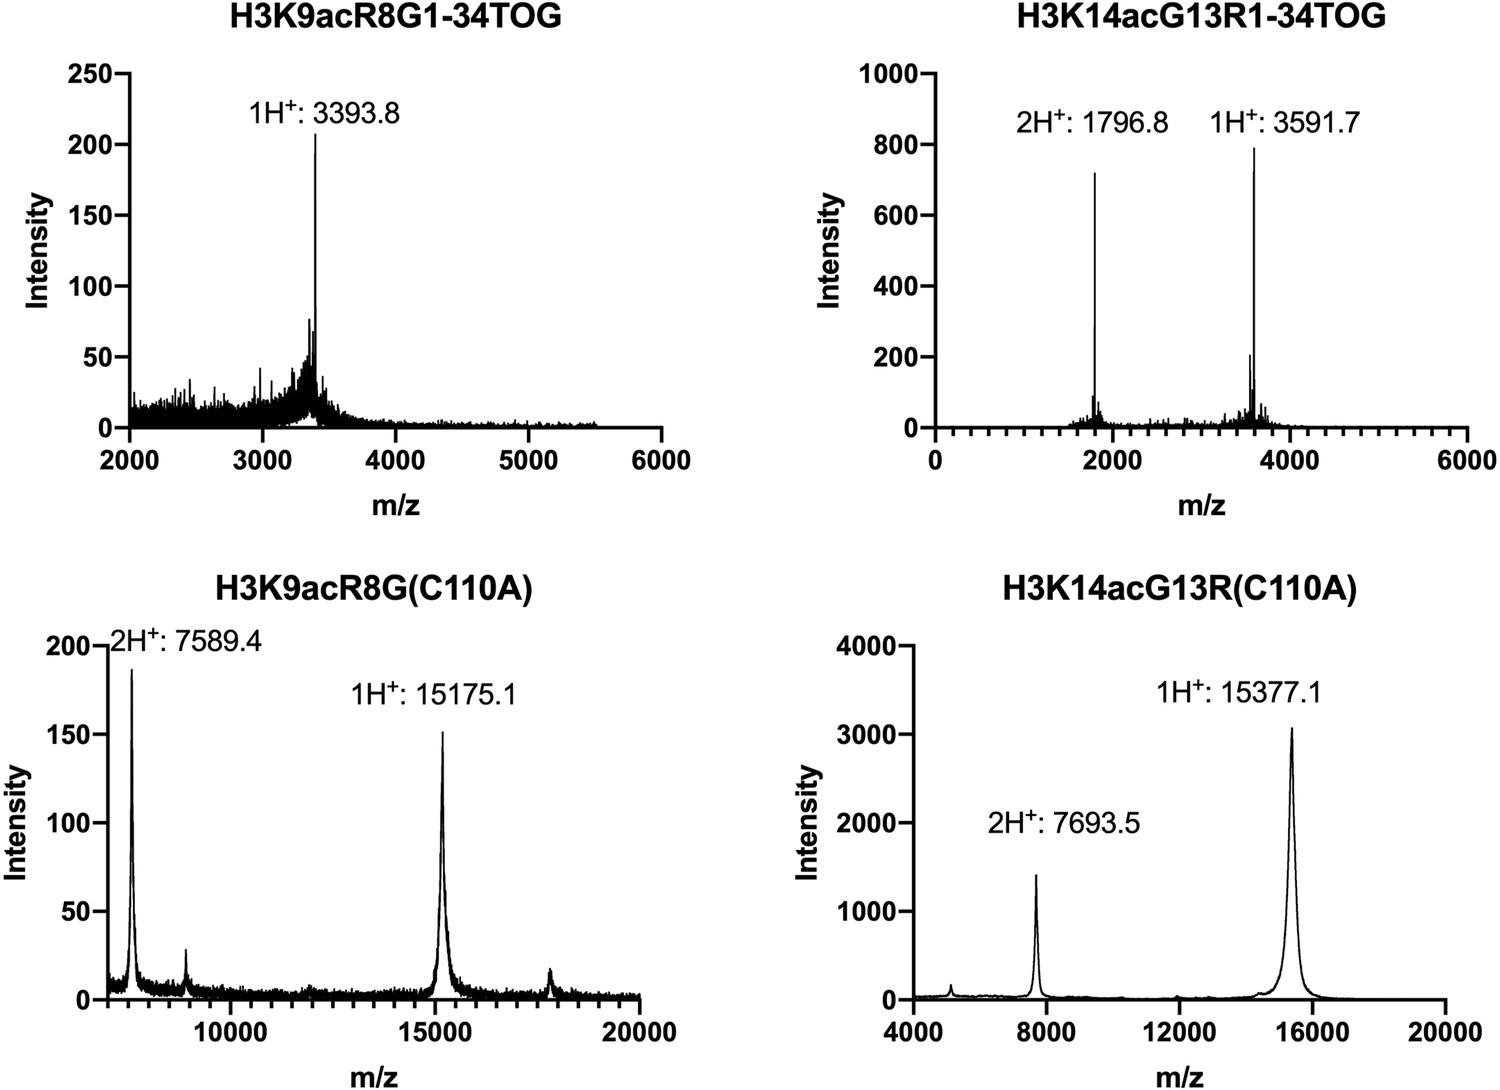
MALDI-TOF spectra for H3K9acR8G H3K14acG13R 1–34 peptides, and their corresponding full length histone proteins.
Figure 5—figure supplement 2
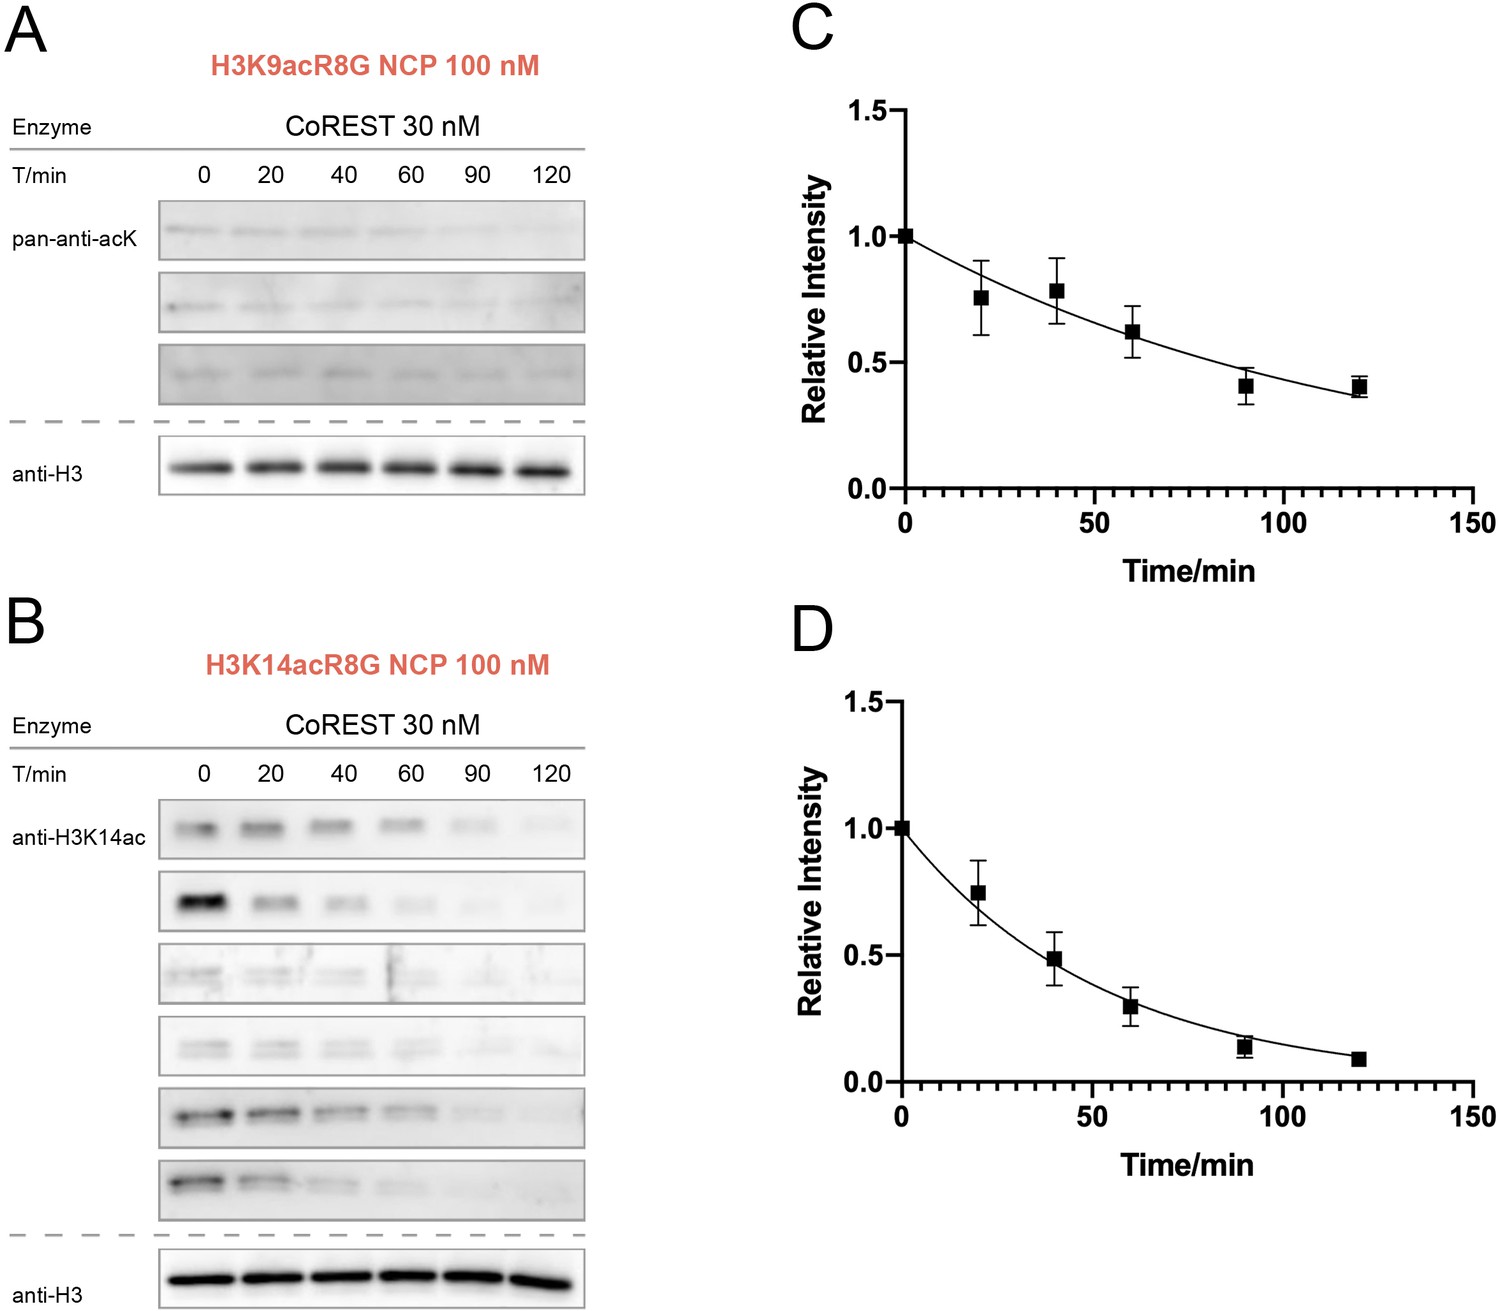
CoREST activity assay over nucleosomes with H3K9acR8G or H3K14acG13R.
(A) H3K9acR8G (n = 3 for nucleosome assay), (B) H3K14acG13R (n = 6 for nucleosome assay). (C) Curve fitting for H3K9acR8G nucleosome kinetics with 30 nM CoREST, and (D) Curve fitting for H3K14acG13R nucleosome kinetics with 30 nM CoREST.
Figure 5—figure supplement 3
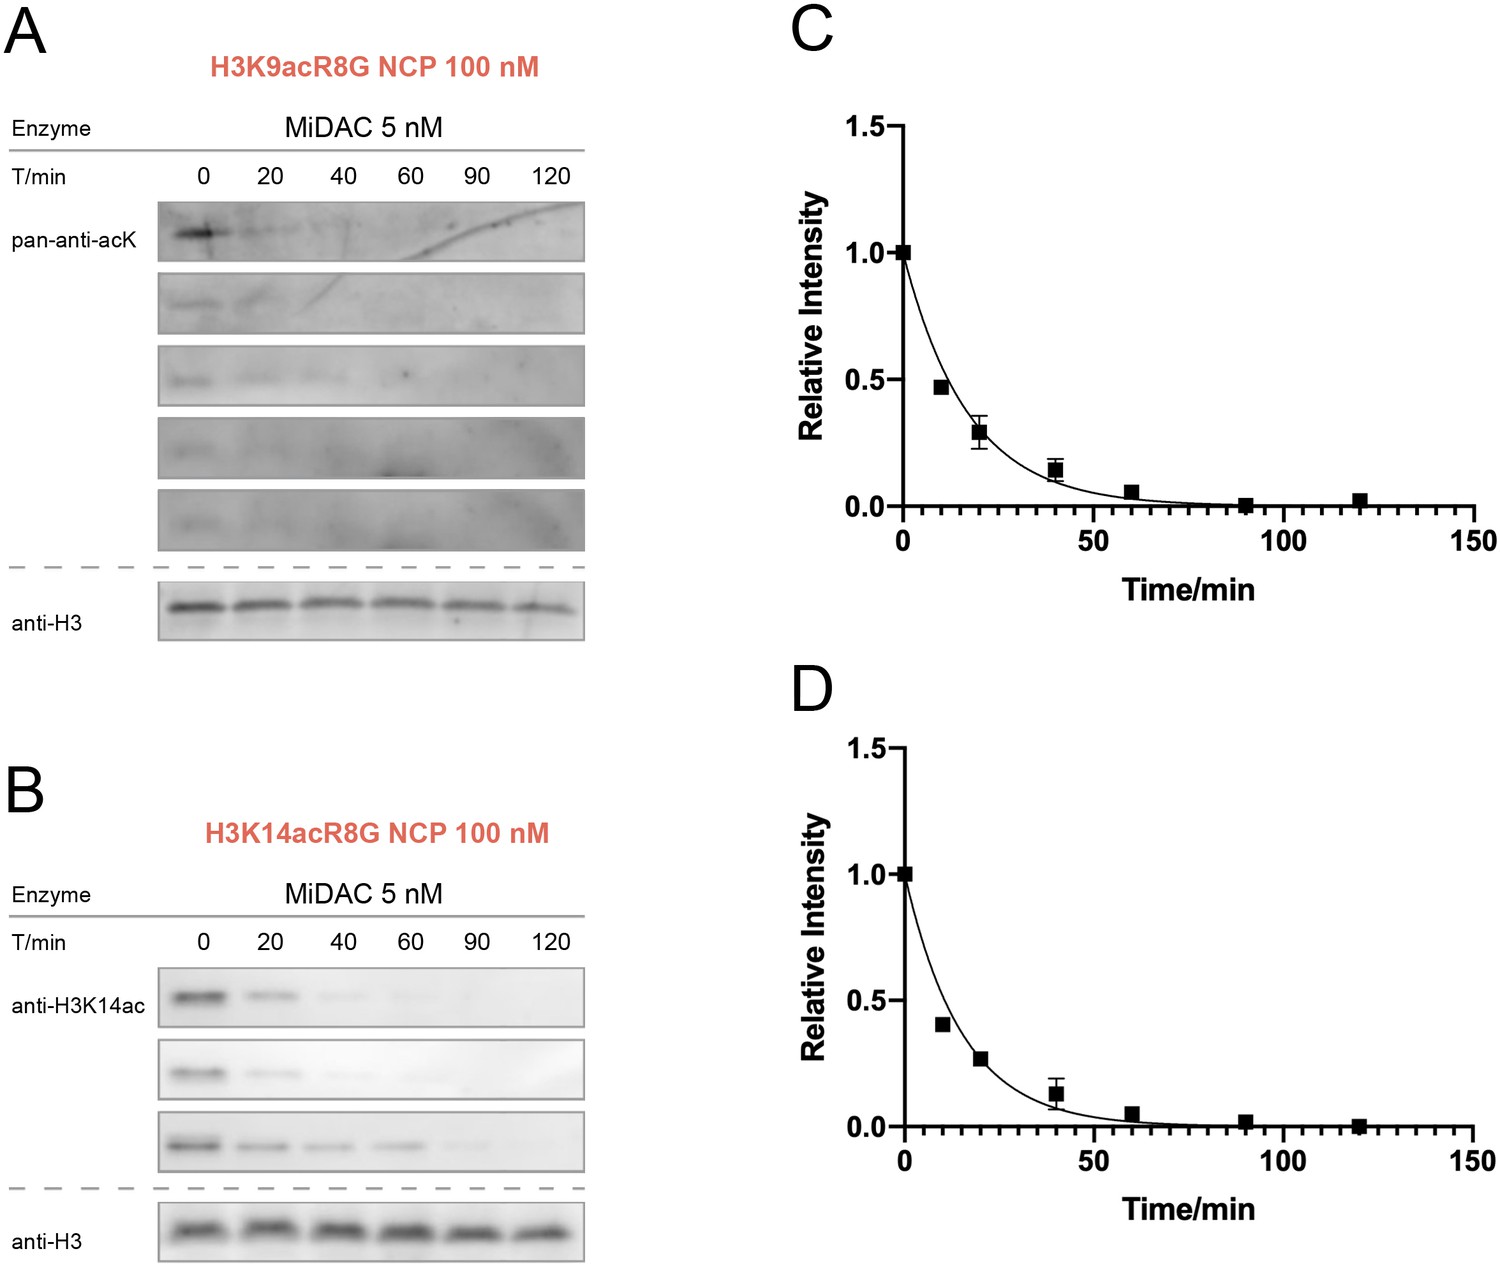
MiDAC activity assay over nucleosomes with H3K9acR8G or H3K14acG13R.
(A) H3K9acR8G (n = 5 for nucleosome assay), (B) H3K14acG13R (n = 3 for nucleosome assay). (C) Curve fitting for H3K9acR8G nucleosome kinetics with 5 nM MiDAC, and (D) Curve fitting for H3K14acG13R nucleosome kinetics with 5 nM MiDAC.
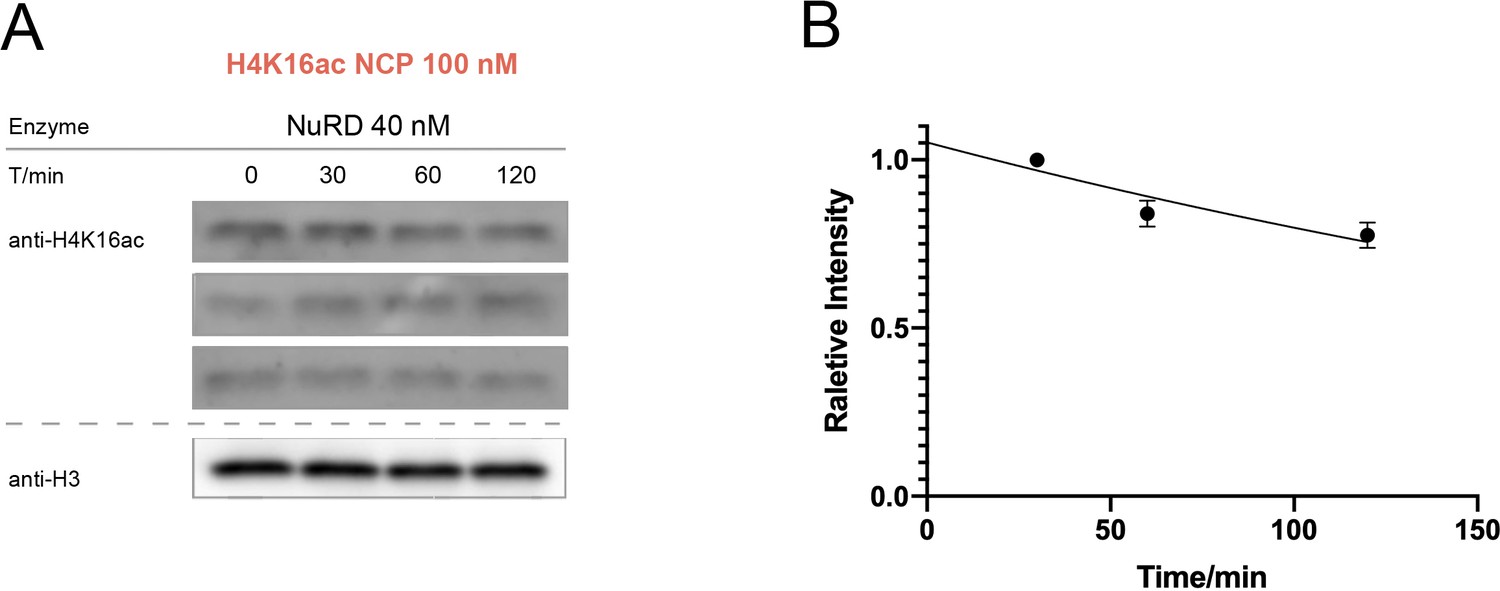
Figure 6 with 1 supplement
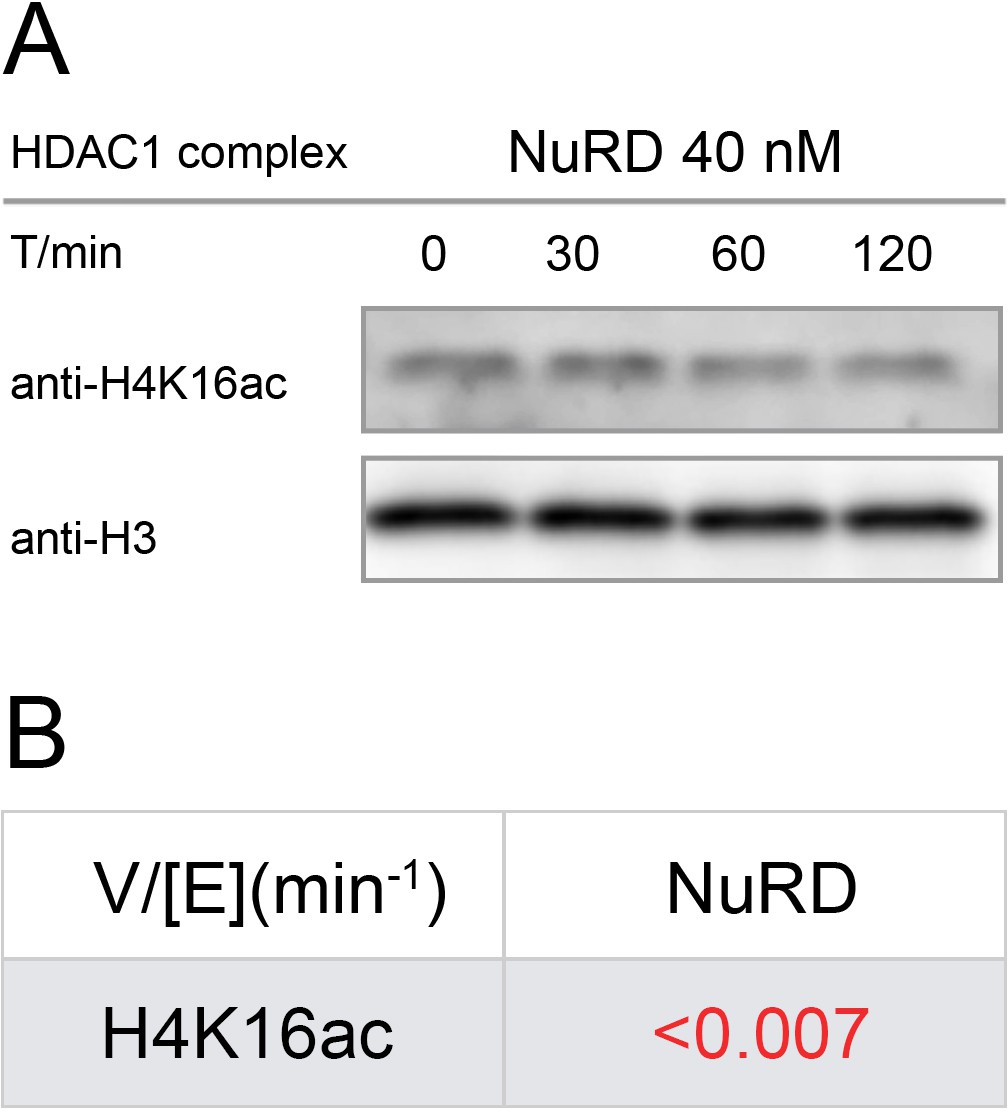
Western-blot and kinetics of NuRD complex activity on nucleosome with H4K16ac.
(A) Western-blot based deacetylation activity assay with 40 nM NuRD complex (HDAC1-MTA1-RBBP4) on H4K16ac nucleosomes blot with site-specific acetylation antibody and anti-H3 antibody to show the overall nucleosome amount remaining unchanged (n = 3); (B) rate constant of NuRD complex deacetylation on H4K16ac nucleosome. The reaction conditions were similar to the enzymatic reactions on H3K9/14/18/23/27ac nucleosomes described in Table 1.
Figure 6—figure supplement 1
NuRD activity assay over H4K16ac nucleosome.
(A) H4K16ac nucleosome (n = 3 for nucleosome assay), and (B) Curve fitting for the nucleosome kinetics with 40 nM NuRD.
Tables
Table 1
Rate constants of different HDAC1/HDAC3 complexes on various histone proteins with site-specific acetylation.
Kinetic values shown are ± S.E.M. For each enzymatic reaction on histone proteins: the semi-synthetic H3K9/14/18/23/27ac histone H3 proteins (1.0 μM) were incubated with different HDAC1 and HDAC3 complexes at the following concentrations (2 nM CoREST, 10 nM MiDAC, 5 nM NuRD, 4 nM Sin3B, 2 nM SMRT, and 5 nM HDAC1, n = 2–5) under a reaction buffer of 50 mM HEPES 7.5 containing 100 mM KCl, 100 μM IP6, and 0.2 mg/mL BSA at 37 °C. The reaction time was counted, and multiple samples were taken at different time points between 0–30 min. The complexes include CoREST, NuRD, Sin3B, MiDAC, and SMRT, together with free HDAC1 enzyme. The kinetic data were divided by a factor of 5 in order to be comparable with the kinetic data on nucleosomes.
| Normalized V/[E] (min−1) | HDAC1 | CoREST(RCOR1) | MiDAC(MiDEAS) | NuRD(MTA1) | Sin3B(Sin3) | SMRT(NCoR2) |
|---|---|---|---|---|---|---|
| H3K9ac | 0.30 ± 0.046 | 2.1 ± 0.38 | 0.42 ± 0.086 | 0.84 ± 0.38 | 0.56 ± 0.15 | 0.44 ± 0.10 |
| H3K14ac | 0.65 ± 0.40 | 2.8 ± 0.18 | 0.79 ± 0.29 | 1.5 ± 0.58 | 1.1 ± 0.093 | 0.78 ± 0.34 |
| H3K18ac | 1.1 ± 0.27 | 1.8 ± 0.37 | 0.45 ± 0.29 | 0.86 ± 0.32 | 1.2 ± 0.24 | 1.5 ± 0.57 |
| H3K23ac | 0.64 ± 0.10 | 2.6 ± 0.55 | 0.22 ± 0.037 | 0.36 ± 0.12 | 0.93 ± 0.20 | 0.65 ± 0.32 |
| H3K27ac | 1.1 ± 0.25 | 2.0 ± 0.35 | 0.43 ± 0.038 | 1.5 ± 0.48 | 1.1 ± 0.31 | 1.8 ± 0.80 |
Table 2
Rate constants of different HDAC1 and HDAC3 complexes on various nucleosomes with site-specific acetylation on H3.
Kinetic values shown are ± S.E.M. For each enzymatic reaction on nucleosomes: the semi-synthetic H3K9/14/18/23/27ac nucleosomes (100 nM) were incubated with different HDAC1 and HDAC3 complexes at the following concentrations (30 nM CoREST, 5 nM MiDAC, 80 nM NuRD, 45 nM Sin3B, 60 nM SMRT, and 60 nM HDAC1, n = 2–5), under a reaction buffer of 50 mM HEPES 7.5 containing 100 mM KCl, 100 μM IP6, and 0.2 mg/mL BSA at 37 °C. The reaction time was counted, and multiple samples were taken at different time points generally between 0–120 min (The MiDAC complex on H3K9ac was between 0–90 min). The complexes include CoREST, NuRD, Sin3B, MiDAC, and SMRT, together with free HDAC1 enzyme.
| V/[E] (min−1) | HDAC1 | CoREST(RCOR1) | MiDAC(MiDEAS) | NuRD(MTA1) | Sin3B(Sin3) | SMRT(NCoR2) |
|---|---|---|---|---|---|---|
| H3K9ac | N.D. | 0.10 ± 0.012 | 1.2 ± 0.19 | 0.012 ± 0.0032 | 0.0050 ± 0.0043 | 0.046 ± 0.0045 |
| H3K14ac | N.D. | <0.005 | 0.52 ± 0.034 | 0.0091 ± 0.00080 | <0.005 | 0.019 ± 0.0022 |
| H3K18ac | N.D. | 0.062 ± 0.0019 | 0.17 ± 0.0051 | 0.0046 ± 0.00088 | 0.0082 ± 0.0030 | 0.021 ± 0.0039 |
| H3K23ac | N.D. | 0.067 ± 0.010 | 0.048 ± 0.0071 | 0.0071 ± 0.00083 | 0.0084 ± 0.0033 | 0.0081 ± 0.0028 |
| H3K27ac | N.D. | 0.093 ± 0.0088 | 0.18 ± 0.036 | 0.0077 ± 0.0028 | 0.0089 ± 0.00053 | 0.039 ± 0.0027 |
Key resources table
| Reagent type (species) or resource | Designation | Source or reference | Identifiers | Additional information |
|---|---|---|---|---|
| Gene (X. laevis) | Histone H2A, H2B, H4 (X. laevis) | DOI: 10.7554/eLife.37231 | Construct shared by Cynthia Wolberger (Johns Hopkins) | |
| Gene (X. laevis) | Histone gH3 (X. laevis) | DOI: 10.7554/eLife.37231 DOI: 10.1021/ja205630g | Construct shared by Dirk Schwarzer (Tübingen) | |
| Gene (S. aureus) | F40-sortase (Originally mutated fromS. aureus sortase A) | DOI: 10.7554/eLife.37231 DOI: 10.1021/ja205630g | Construct shared by Dirk Schwarzer (Tübingen) | |
| Gene (E. coli) | 146 bp 601 DNA (Widom sequence forE. coliexpression) | DOI: 10.7554/eLife.37231 | Construct shared by Song Tan (Penn State) | |
| Strain, strain background (E. coli) | BL21 Rosetta (DE3) pLysS (E. coli) | Sigma-Aldrich | Cat# 70956–4 | Competent cells |
| Cell line (Homo-sapiens) | HEK293F (Homo-sapiens) | Thermo Fisher Scientific | RRID:CVCL_6642 | Transfected with plasmids to express different HDAC1 complexes. Mycoplasma tested negative. Authenticated by the venfor. Not on ICLAC misidentified cell line registry. |
| Antibody | Anti-H3K9ac (Rabbit) | Cell Signaling | Cat# 9671, RRID:AB_331532 | WB (1:2000) |
| Antibody | Anti-H3K14ac (Rabbit) | EMP Millipore | Cat# 07–353, RRID:AB_310545 | WB (1:2000) |
| Antibody | Anti-H3K18ac (Rabbit) | EMP Millipore | Cat# 07–354, RRID:AB_ 441945 | WB (1:2000) |
| Antibody | Anti-H3K23ac (Rabbit) | EMP Millipore | Cat# 07–355, RRID:AB_310546 | WB (1:2000) |
| Antibody | Anti-H3K27ac (Rabbit) | Cell Signaling | Cat# 8173, RRID:AB_10949503 | WB (1:2000) |
| Antibody | Anti-H3 (Rabbit) | Abcam | Cat# ab1791, RRID:AB_302613 | WB (1:5000) |
| Antibody | Anti-H4K16ac (Rabbit) | Active Motif | Cat# 39167, RRID:AB_2636968 | WB (1:5000) |
| Antibody | HRP conjugated anti-Rabbit secondary (Goat) | Cell Signaling | Technology Cat# 7074, RRID:AB_2099233 | WB (1:2000) |
| Peptide, recombinant protein | HDAC1/HSP70 | BPS Bioscience | Cat# 50051 | |
| Peptide, recombinant protein | Nucleosome with H4K16ac | Epicypher | Cat# 16–0354 | |
| Chemical compound | 20 Fmoc-amino acids | EMP Millipore DOI: 10.7554/eLife.37231 | Fmoc-Gly-OH as example: Cat# 852001 | |
| Software, algorithm | ImageJ | DOI: 10.7554/eLife.37231 Download fromimagej.nih.gov/ij/ | RRID:SCR_003070 | |
| Software, algorithm | GraphPad Prism Eight | DOI: 10.7554/eLife.37231 Download fromwww.graphpad.com | RRID:SCR_002798 |
Additional files
Download links
A two-part list of links to download the article, or parts of the article, in various formats.
Downloads (link to download the article as PDF)
Open citations (links to open the citations from this article in various online reference manager services)
Cite this article (links to download the citations from this article in formats compatible with various reference manager tools)
Diverse nucleosome Site-Selectivity among histone deacetylase complexes
eLife 9:e57663.
https://doi.org/10.7554/eLife.57663


