The testis protein ZNF165 is a SMAD3 cofactor that coordinates oncogenic TGFβ signaling in triple-negative breast cancer
- Department of Pharmacology, University of Texas Southwestern Medical Center, United States
- Harold C. Simmons Comprehensive Cancer Center, University of Texas Southwestern Medical Center, United States
- Hamon Center for Therapeutic Oncology Research, University of Texas Southwestern Medical Center, United States
Figures
Figure 1 with 1 supplement
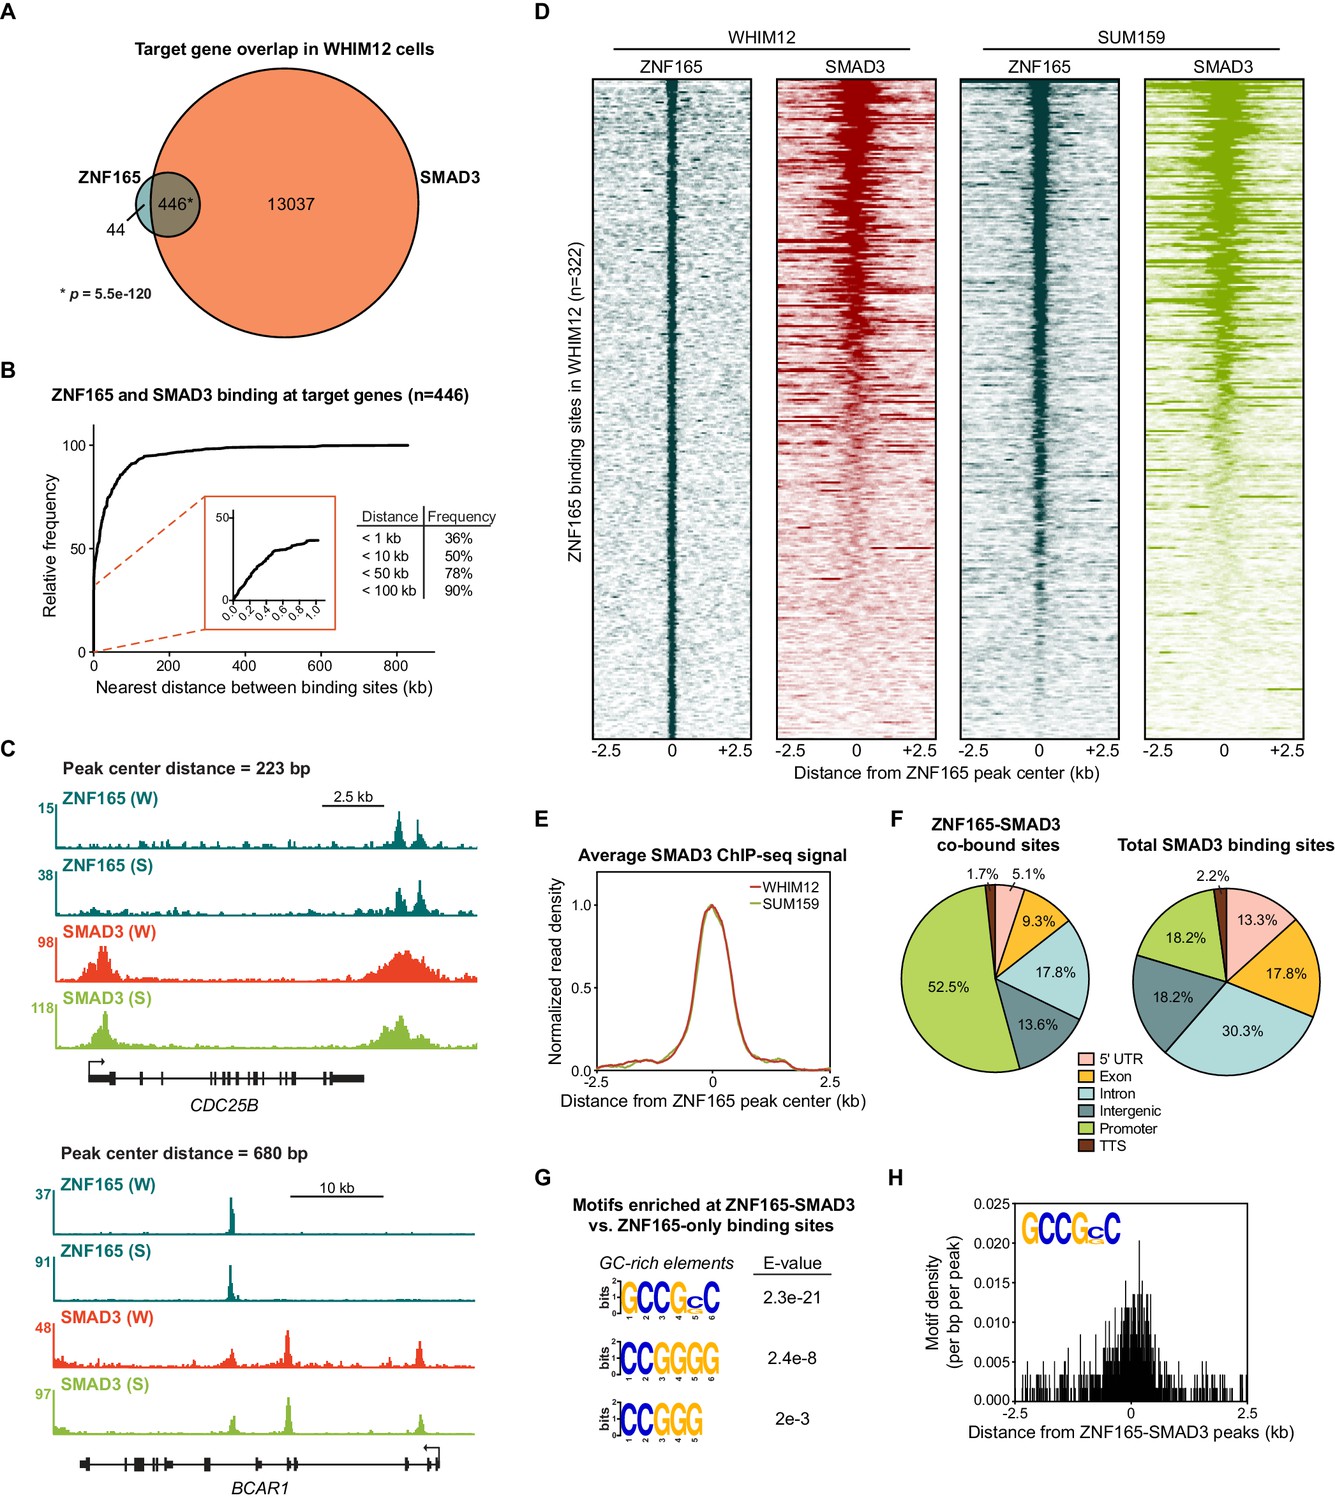
SMAD3 is enriched at ZNF165 binding sites in TNBC cells.
(A) Venn diagram displaying the overlap between ZNF165 and SMAD3 target genes in WHIM12 cells as identified by GREAT (ver 3.0.0). Significance was determined using the hypergeometric distribution. (B) Cumulative frequency distribution of the nearest distance between ZNF165 and SMAD3 binding sites associated with each shared target gene. Distance was calculated using the peak coordinates of each factor nearest to one another. (C) Browser tracks of ChIP-seq data showing peaks for ZNF165 and SMAD3 near the CDC25B and BCAR1 loci with overlapping distances of 223 and 680 bp, respectively. (W) WHIM12, (S) SUM159. (D) Heatmaps of ChIP-seq data for ZNF165 and SMAD3 in the indicated TNBC cell lines. All peaks within each heatmap are centered ±2.5 kb from the ZNF165 peaks identified in WHIM12 cells (n = 322). (E) Normalized read density (per bp per peak) for SMAD3 plotted ±2.5 kb from the ZNF165-SMAD3 co-bound peaks identified in WHIM12 cells (n = 118). (F) Pie charts displaying the distribution of genomic features bound by ZNF165-SMAD3 (n = 118) or only SMAD3 (n = 27,979) in WHIM12 cells. (G) Motifs enriched at ZNF165-SMAD3 co-bound sites within WHIM12 cells. The 204 ZNF165 binding sites not occupied by SMAD3 were used as a control set of sequences to identify differentially enriched motifs at the shared sites (n = 118). (H) Motif density (per bp per peak) for the GCCG(G|C)C motif plotted ±2.5 kb from the ZNF165-SMAD3 co-bound peaks in WHIM12 cells.
Figure 1—figure supplement 1

SMAD3 is enriched at ZNF165 binding sites in TNBC cells.
(A) Venn diagram displaying the peak overlap between ZNF165 binding sites identified in WHIM12 and SUM159 cells. P-value was calculated using the hypergeometric distribution. (B) Venn diagram displaying the peak overlap between ZNF165 and SMAD3 in WHIM12 cells. Genes associated with the 118 co-bound peaks are listed in Supplementary file 1. P-value was calculated using the hypergeometric distribution. (C) As in (B) except using peaks identified in SUM159 cells. (D) Heatmaps of SMAD3 ChIP-seq data in WHIM12, SUM159, and MDA-MB-231 cells. All peaks within each heatmap are centered ±2.5 kb from the SMAD3 peaks identified in WHIM12 cells (n = 27,979). Data for MDA-MB-231 cells were obtained from EGAS00001001570 (Tufegdzic Vidakovic et al., 2015). (E) Venn diagram displaying the overlap between SMAD3 peaks identified in each cell line. (F) Browser tracks of ChIP-seq data showing peaks for ZNF165 and SMAD3 near the CDC25B and BCAR1 loci with overlapping distances of 223 and 680 bp, respectively. (W) WHIM12, (S) SUM159, (M) MDA-MB-231. (G) Gene set enrichment analysis (GSEA) of ZNF165-responsive genes in WHIM12 cells. Transcriptome data for ZNF165 knockdown was obtained from GSE63984 (Maxfield et al., 2015). Genes included within this gene set are listed in Supplementary file 2. (H) Kaplan-Meier plot displaying distant metastasis free survival in breast cancer patients with high (red) or low (black) ZNF165 expression. P-value and hazard ratio (HR) were calculated using the logrank test.
Figure 2 with 1 supplement
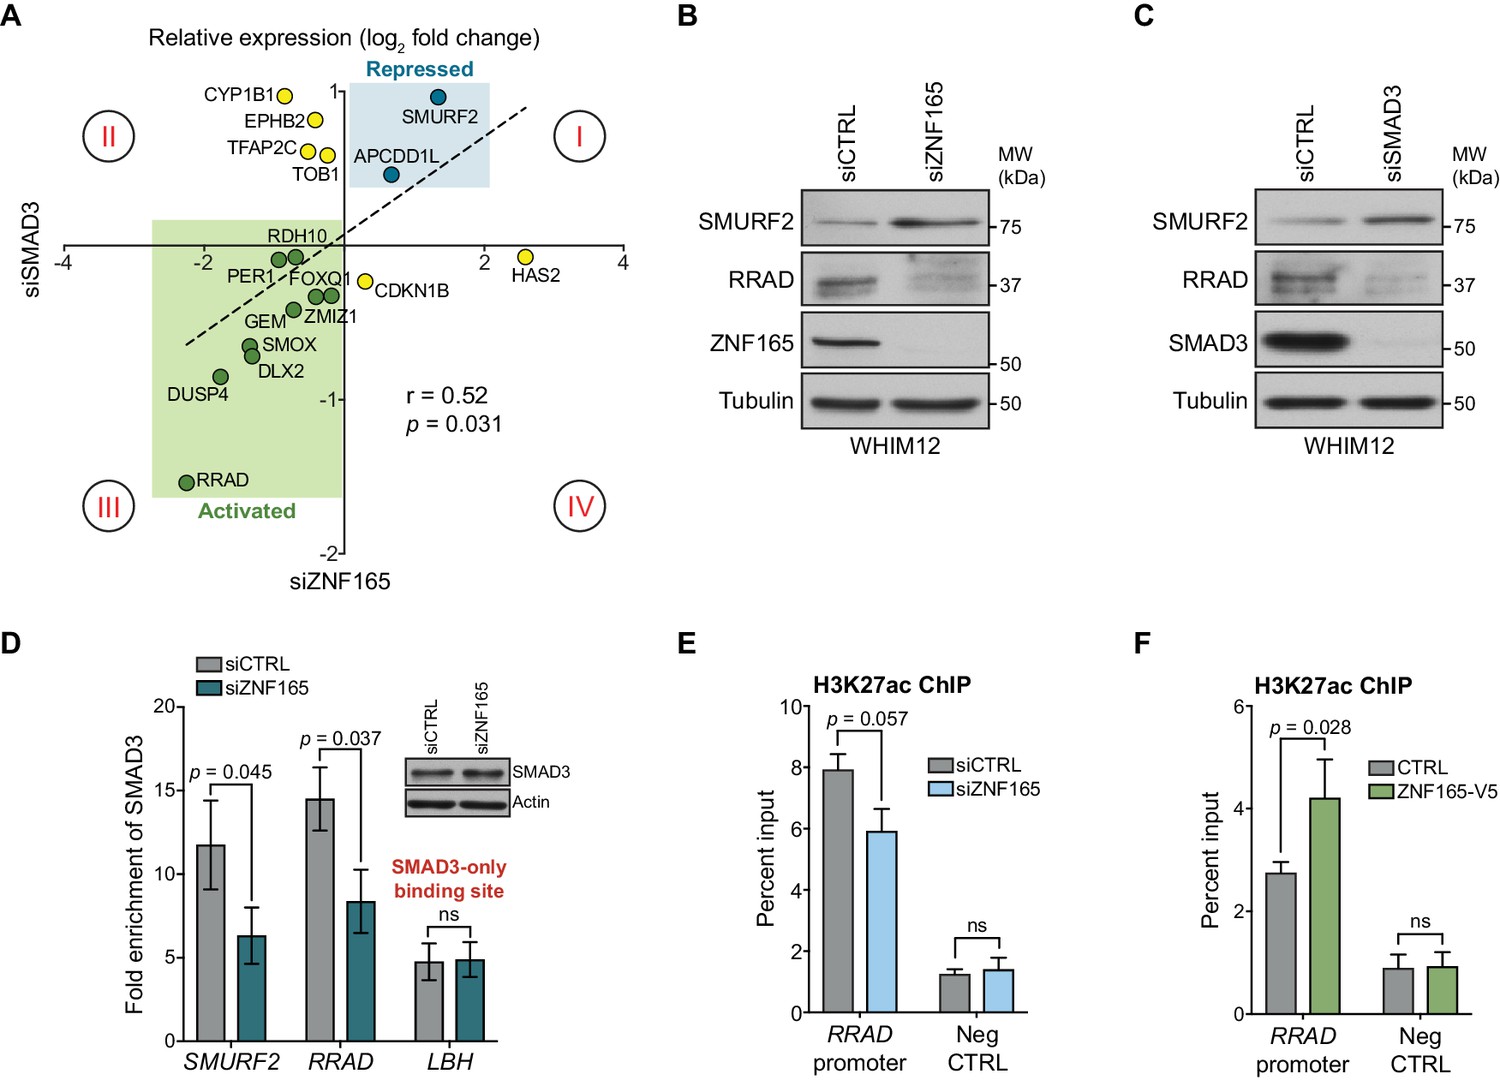
ZNF165 and SMAD3 cooperate to modulate TGFβ-responsive gene expression.
(A) WHIM12 cells were transfected with siRNA for 48 hr, and qPCR was used to quantify relative expression (log2 fold change) of ZNF165-SMAD3 target genes upon depletion of ZNF165 (x-axis) or SMAD3 (y-axis). The Pearson correlation coefficient is indicated by r. Data are representative of four independent experiments. (B) WHIM12 cells were transfected with siRNA for 72 hr. Whole cell lysates were collected and immunoblotted for the indicated proteins. Data are representative of two independent experiments. (C) As in (B) except cells were transfected with siRNA targeting SMAD3. (D) SUM159 cells were transfected with siRNA for 32 hr and subjected to SMAD3 ChIP followed by qPCR using primers targeting the indicated binding sites. Fold enrichment was determined by dividing the percent input values for SMAD3 by those for IgG. Error bars represent mean ± SEM. P-values were calculated using an unpaired, two-tailed Student’s t-test. Data are representative of four independent experiments. (E) SUM159 cells were transfected with siRNA for 32 hr and subjected to H3K27ac ChIP followed by qPCR using primers targeted to the RRAD promoter or a negative control region. Error bars represent mean + SEM. P-value was calculated using an unpaired, two-tailed Mann-Whitney test. Data are representative of four independent experiments. (F) SUM159 cells stably expressing ZNF165-V5 or control cDNA were subjected to H3K27ac ChIP followed by qPCR using primers targeted to the RRAD promoter or a negative control region. Error bars represent mean + SEM. P-value was calculated using an unpaired, two-tailed Mann-Whitney test. Data are representative of four independent experiments.
Figure 2—figure supplement 1
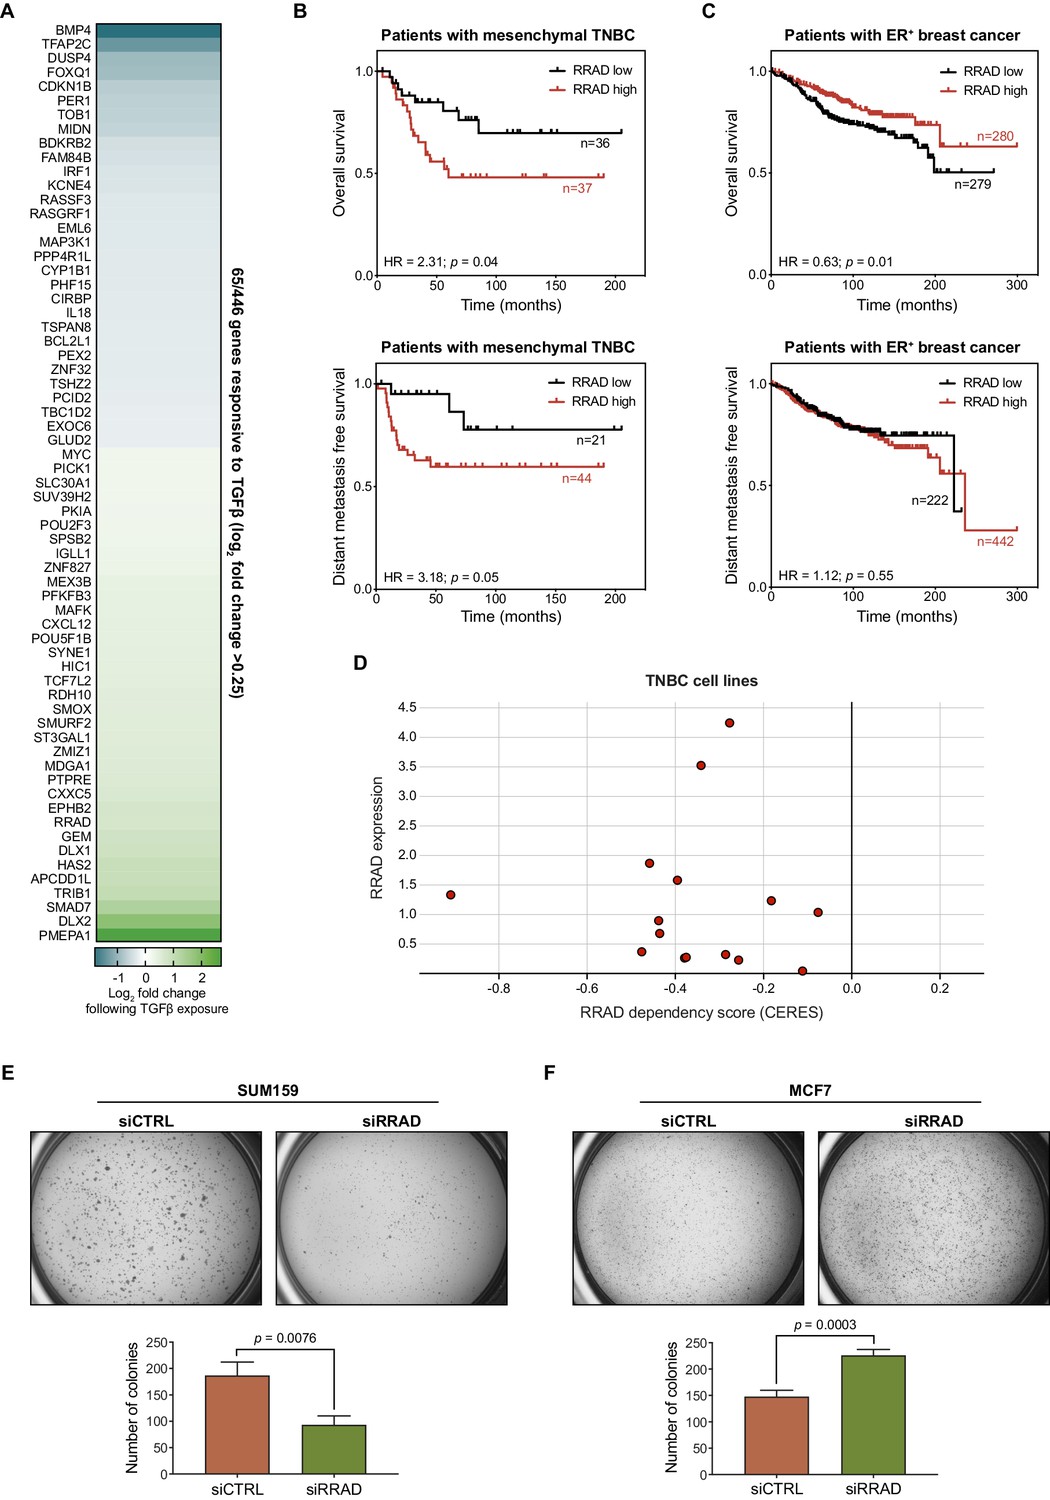
ZNF165 and SMAD3 activate RRAD expression to drive neoplastic behaviors in TNBC.
(A) Heatmap plotting the log2 fold-change in expression of 65/446 shared ZNF165-SMAD3 target genes (cutoff >0.25) following TGFβ exposure in WHIM12 cells. Expression data were obtained from GSE63986 (Maxfield et al., 2015). (B) Kaplan-Meier plots displaying overall survival and distant metastasis free survival (DMFS) for patients with the mesenchymal subtype of TNBC and high or low RRAD expression. P-values and hazard ratios (HRs) were calculated using the logrank test. (C) As in (B) except for patients with ER+ breast cancer. (D) TNBC cell line dependency scores calculated from CRISPR-mediated perturbation (as determined by CERES) plotted against RRAD expression (log2(TPM+1)) (Barretina et al., 2012; Meyers et al., 2017). Negative dependency scores represent a decrease in viability. Data were obtained from the Cancer Dependency Map (depmap.org). (E) Soft agar growth assays for SUM159 cells transfected with indicated siRNAs. Error bars represent mean + SEM. P-value was calculated using an unpaired, two-tailed Student’s t-test. Data are representative of three independent experiments. (F) As in (E) except using MCF7 cells.
Figure 3

ZNF165 physically associates with SMAD3 in a TGFβ-dependent manner.
(A) Forty-eight hours after transfection with HA-SMAD3 and/or ZNF165-myc cDNA, HEK293T cells were subjected to immunoprecipitation with HA antibody. Immunoblotting was performed with indicated antibodies. Data are representative of two independent experiments. (B) ChIP was performed in SUM159 cells stably expressing ZNF165-V5 with antibodies against phosphorylated SMAD3 (Ser423/425) or IgG, and the precipitated material was immunoblotted with indicated antibodies. Data are representative of two independent experiments. (C) SUM159 cells were pre-treated with SB-431542 at the indicated concentrations for 15 min, followed by stimulation with 5 ng mL−1 TGFβ for 30 min. Immunoblotting was performed with indicated antibodies. Data are representative of two independent experiments. (D) Proximity ligation assays (PLAs) performed using antibodies against endogenous ZNF165 and SMAD3 in SUM159 cells, where either antibody alone was used as a negative control. Cells were pre-treated with 20 μM SB-431542 or DMSO for 15 min, followed by stimulation with 5 ng mL−1 TGFβ for 30 min. Scale bar, 10 μm. The mean PLA signal (number of foci per nucleus) is quantified (right), where each data point represents the mean signal calculated within one image. P-value was calculated using an unpaired, two-tailed Student’s t-test. Ten images were used per condition and data are representative of three independent assays. (E) As in (D) except antibodies against endogenous ZNF165 and SMAD4 were used.
Figure 4 with 1 supplement

ZNF446 is an obligate component of the ZNF165-SMAD3 transcriptional complex.
(A) ZNF165 interactors that contain a SCAN domain as identified from a systematic yeast two-hybrid screening approach (interactome.dfci.harvard.edu). A domain map of ZNF165 is shown above for reference. (B) Forty-eight hours after transfection with indicated siRNAs, RNA was extracted from WHIM12 or SUM159 cells and qPCR was used to determine the relative expression of SMURF2. Log2 fold-change values normalized to control knockdown samples are displayed. Error bars represent mean + SEM. P-values were calculated for each sample using a one-tailed Mann-Whitney test. Data are representative of three independent experiments. (C) Forty-eight hours after transfection with indicated cDNA, HEK293T lysates were subjected to immunoprecipitation with V5 antibody. Immunoblotting was performed with indicated antibodies. Data are representative of three independent experiments. (D) SUM159 nuclear lysates were immunoprecipated with antibodies against endogenous ZNF165 or IgG. Immunoblotting was performed with indicated antibodies. Data are representative of two independent experiments. (E) Proximity ligation assays (PLAs) performed using antibodies against endogenous ZNF446 and SMAD3 in SUM159 cells, where either antibody alone was used as a negative control. Cells were pre-treated with 20 μM SB-431542 or DMSO for 15 min, followed by stimulation with 5 ng mL−1 TGFβ for 30 min. Scale bar, 10 μm. The mean PLA signal (number of foci per nucleus) is quantified (right), where each data point represents the mean signal calculated within one image. P-value was calculated using an unpaired, two-tailed Student’s t-test. Ten images were used per condition and data are representative of three independent assays. (F) As in (E) except antibodies against endogenous ZNF446 and SMAD4 were used.
Figure 4—figure supplement 1
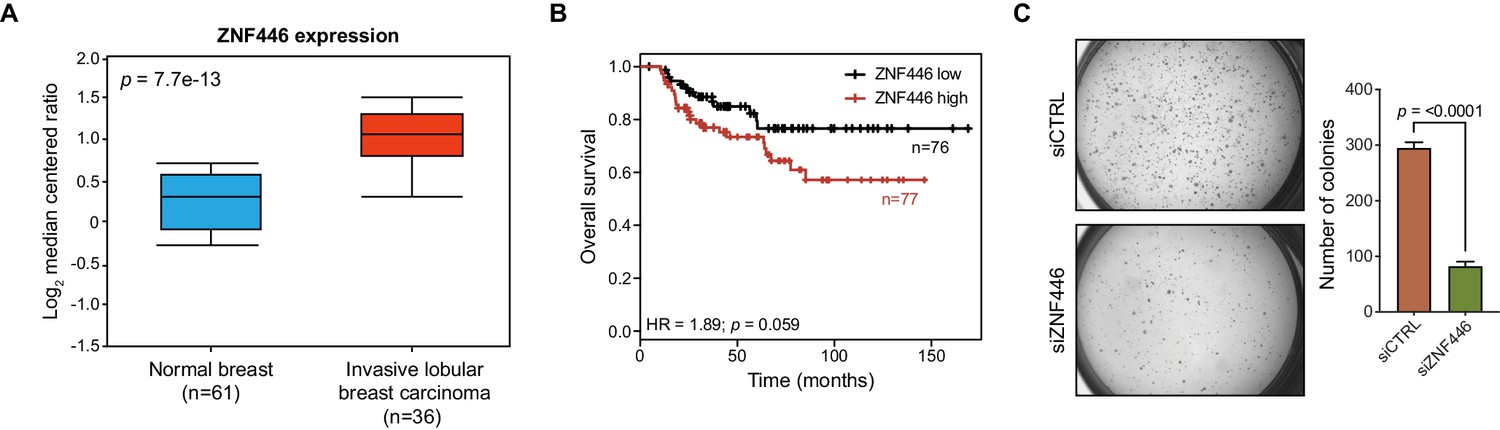
ZNF446 expression is elevated in breast cancer and associated with poor prognosis.
(A) Box-plot showing ZNF446 expression values (log2 median centered ratio) from normal breast and invasive lobular breast carcinoma. Data were obtained from TCGA and p-value was calculated using an unpaired, two-tailed Student’s t-test. (B) Kaplan-Meier plot displaying overall survival of patients with the basal-like subtype of breast cancer and either low or high ZNF446 expression. P-value and hazard ratio (HR) were calculated using the logrank test. (C) Soft agar growth assays for SUM159 cells transfected with indicated siRNAs. Error bars represent mean + SEM. P-value was calculated using an unpaired, two-tailed Student’s t-test. Data are representative of three independent experiments.
Figure 5 with 1 supplement
ZNF446 co-occupies a subset of ZNF165 and SMAD3 binding sites in TNBC cells.
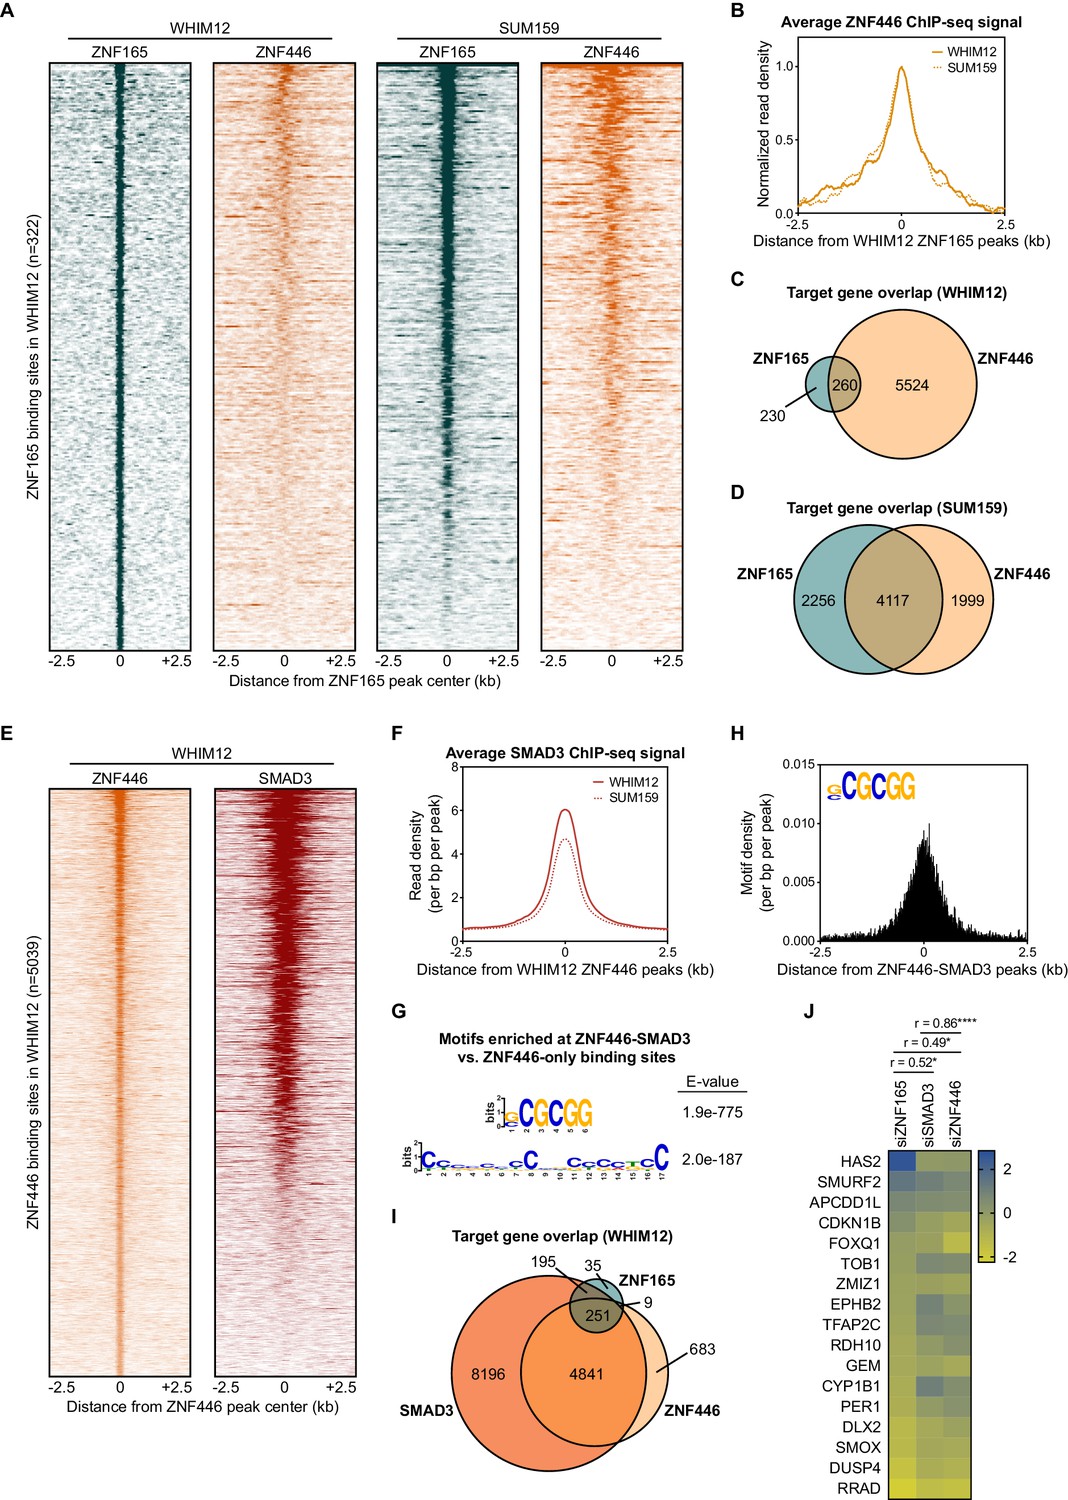
(A) Heatmaps of ChIP-seq data for ZNF165 and ZNF446 in the indicated TNBC cell lines. All peaks within each heatmap are centered ±2.5 kb from the WHIM12 ZNF165 peaks (n = 322). (B) Normalized read density (per bp per peak) for ZNF446 plotted ±2.5 kb from the ZNF165 peaks identified in WHIM12 cells (n = 322). (C) Venn diagram displaying the overlap between ZNF165 and ZNF446 target genes in WHIM12 cells as identified by GREAT (ver 3.0.0). P-value (p<0.0001) was calculated using the hypergeometric distribution. (D) As in (C) except using target genes identified for ZNF165 and ZNF446 in SUM159 cells. (E) Heatmaps of ChIP-seq data for ZNF446 and SMAD3 in WHIM12 cells. All peaks within each heatmap are centered ±2.5 kb from the ZNF446 peaks (n = 5,039). (F) Read density (per bp per peak) for SMAD3 plotted ±2.5 kb from the ZNF446 peaks identified in WHIM12 cells (n = 5,039). (G) Motifs enriched at ZNF446-SMAD3 co-bound sites within WHIM12 cells. The ZNF446 binding sites not occupied by SMAD3 (n = 2,587) were used as a control set of sequences to identify differentially enriched motifs at the shared sites (n = 2,376). (H) Motif density (per bp per peak) for the (G|C)CGCGG motif plotted ±2.5 kb from the ZNF446-SMAD3 co-bound peaks in WHIM12 cells. (I) Venn diagram displaying the overlap between ZNF165, SMAD3, and ZNF446 target genes from WHIM12 cells as identified by GREAT (ver 3.0.0). (J) Heatmap displaying log2 fold-changes of ZNF165-SMAD3 targets in response to depletion of ZNF446, as well as either ZNF165 or SMAD3. The Pearson correlation coefficient is indicated by r. Significance is indicated by asterisks, where *=p < 0.05 and ****=p < 0.0001. Data are representative of four independent experiments.
Figure 5—figure supplement 1
ZNF446 co-occupies a subset of ZNF165 and SMAD3 binding sites in TNBC cells.
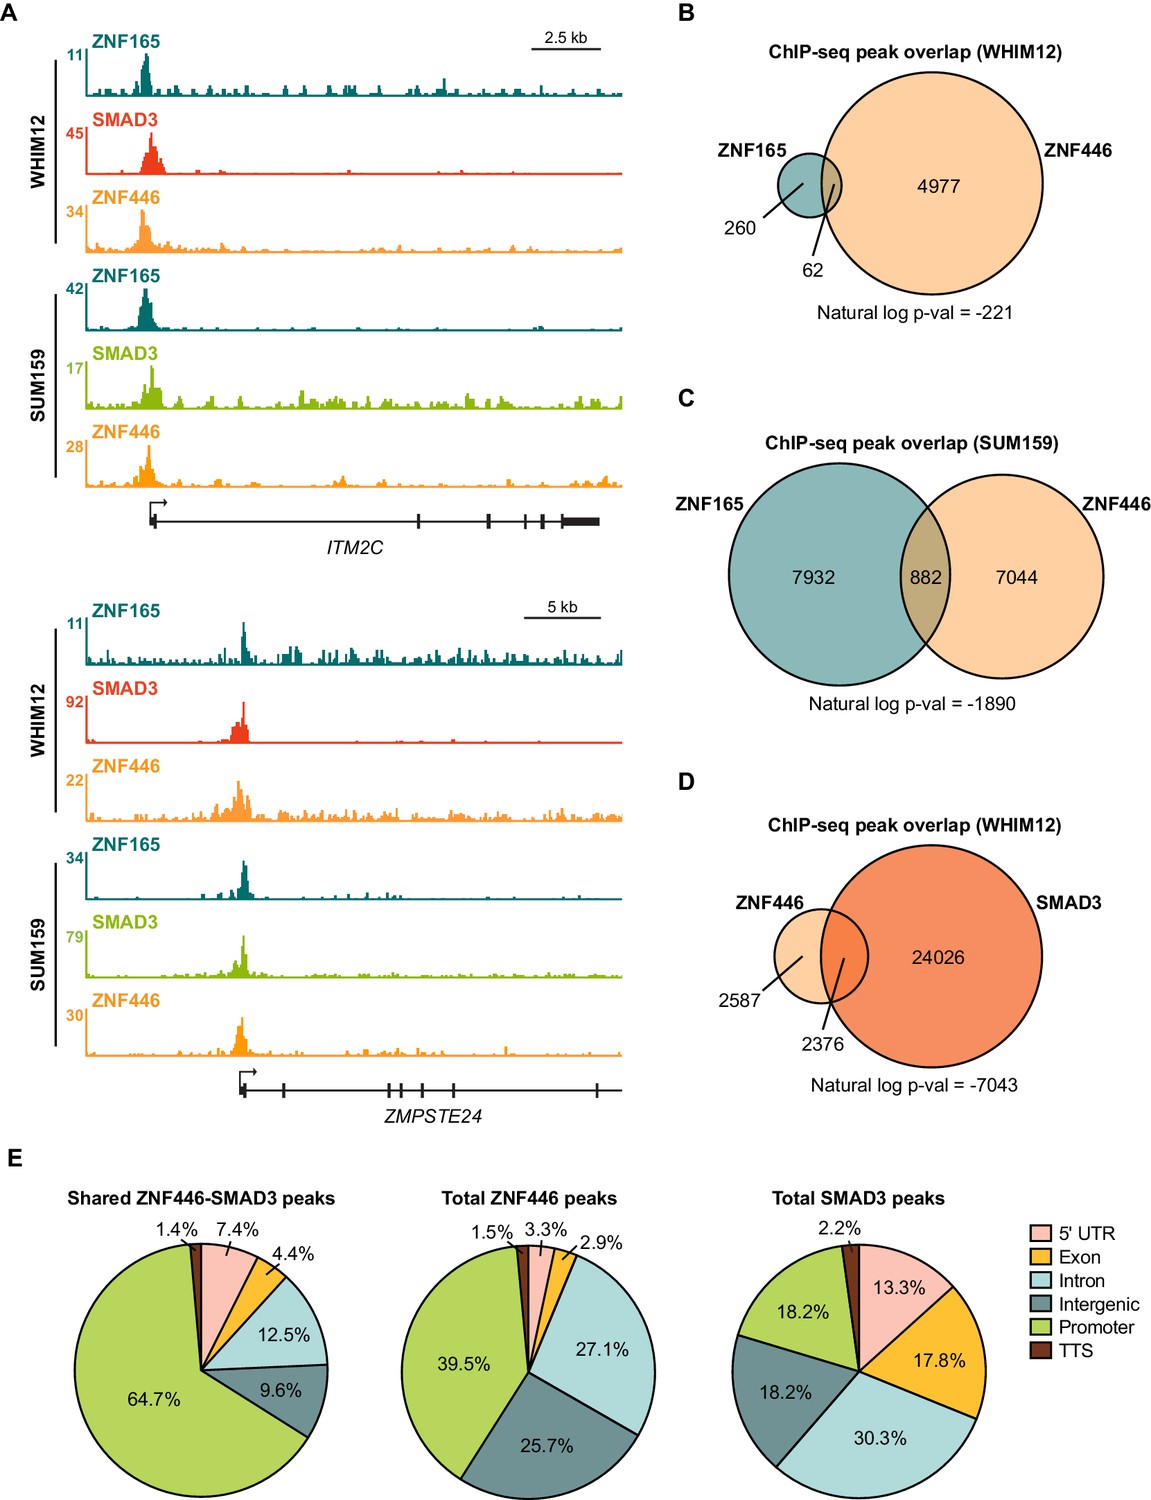
(A) Browser tracks of ChIP-seq data showing peaks for ZNF165, SMAD3, and ZNF446 near the ITM2C and ZMPSTE24 loci in WHIM12 or SUM159 cells. (B) Venn diagram displaying the peak overlap between ZNF165 and ZNF446 in WHIM12 cells. P-value was calculated using the hypergeometric distribution. (C) As in (B) except using peaks identified in SUM159 cells. (D) Venn diagram displaying the peak overlap between ZNF446 and SMAD3 in WHIM12 cells. P-value was calculated using the hypergeometric distribution. (E) Pie charts displaying the distribution of genomic features bound by ZNF446-SMAD3 or either transcription factor alone in WHIM12 cells.
Figure 6 with 1 supplement
TRIM27 is essential for ZNF165 transcriptional activity and tumor growth in vivo.
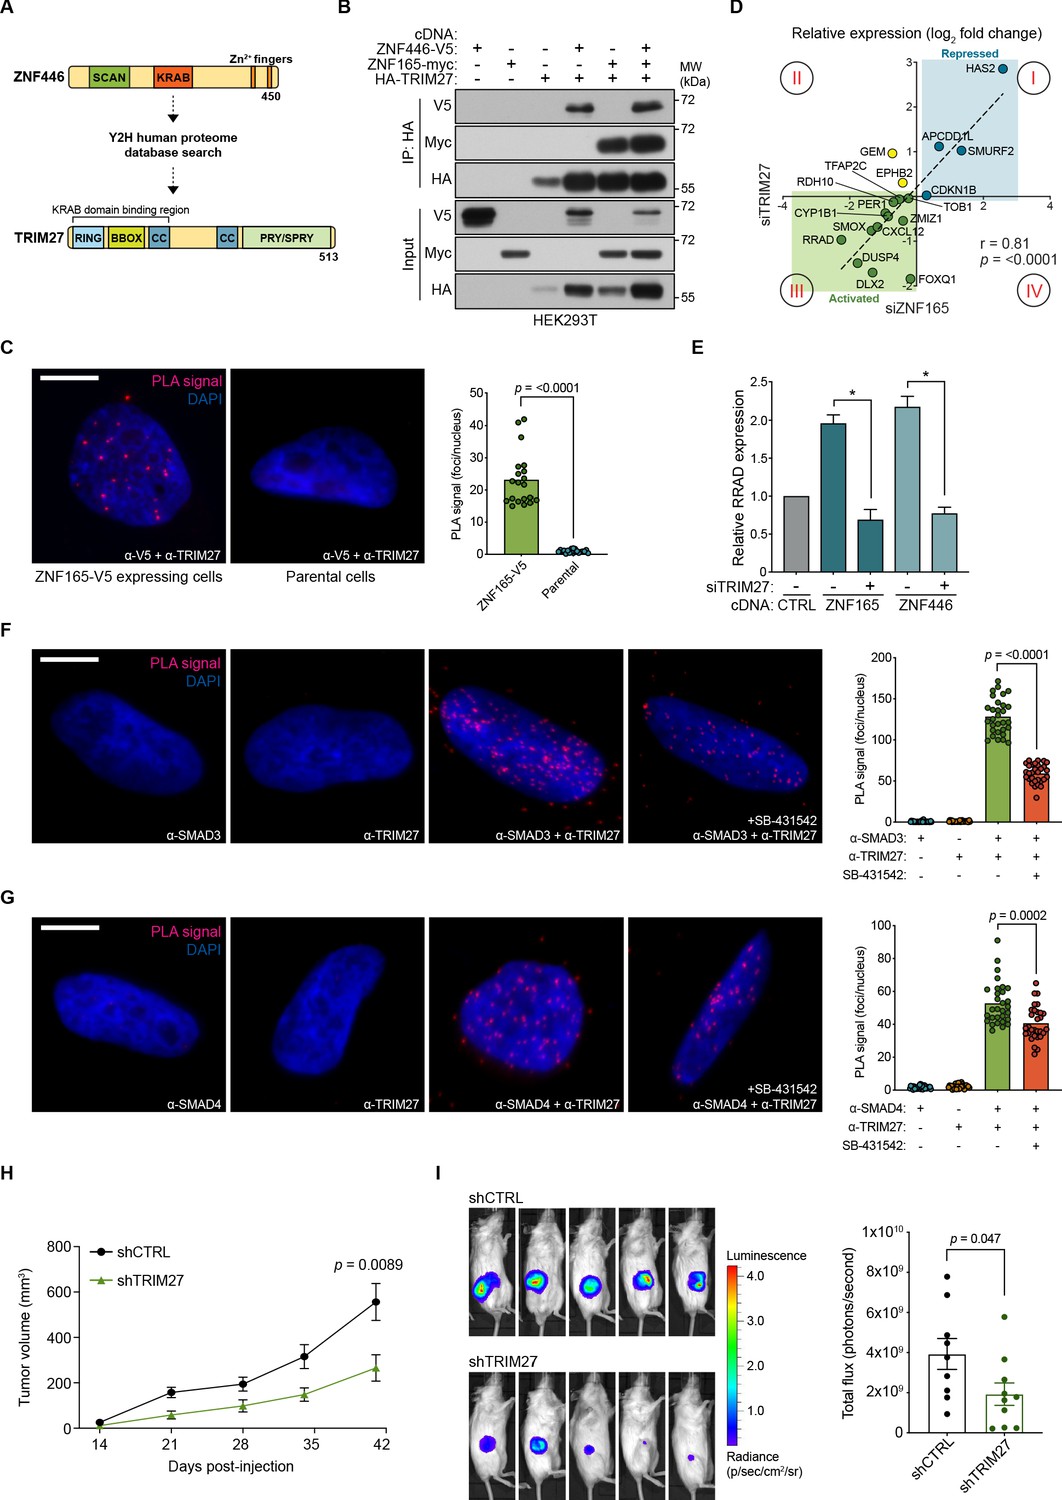
(A) Cartoon maps showing the domains of ZNF446 and TRIM27. The KRAB-binding domain of TRIM27 is highlighted for reference. (B) Forty-eight hours after transfection with indicated cDNA, HEK293T lysates were subjected to immunoprecipitation with HA antibody. Immunoblotting was performed using indicated antibodies. Data are representative of three independent experiments. (C) Proximity ligation assays (PLAs) performed using V5 and TRIM27 antibodies in SUM159 cells stably expressing ZNF165-V5. Parental SUM159 cells were used as a negative control with the V5/TRIM27 antibody combination. Scale bar, 10 μm. The mean PLA signal (number of foci per nucleus) is quantified (right), where each data point represents the mean signal calculated within one image. P-values were calculated using an unpaired, two-tailed Student’s t-test. Five images were used per condition and data are representative of four independent assays. (D) WHIM12 cells were transfected with siRNA for 48 hr and qPCR was used to quantify relative expression (log2 fold change) of shared ZNF165-SMAD3 target genes upon depletion of ZNF165 (x-axis) or TRIM27 (y-axis). The Pearson correlation coefficient is indicated by r. Data are representative of three independent experiments. (E) SUM159 cells stably expressing indicated cDNA were transfected with siRNA targeting TRIM27 for 48 hr. Relative RRAD expression was measured using qPCR and the data were normalized to the CTRL sample (grey). Error bars represent mean + SEM. P-values were calculated using an unpaired, two-tailed Mann-Whitney test. Significance is indicated by asterisks, where *=p < 0.05. Data are representative of four independent experiments. (F) PLAs performed using antibodies against endogenous TRIM27 and SMAD3 in SUM159 cells, where either antibody alone was used as a negative control. Cells were pre-treated with 20 μM SB-431542 or DMSO for 15 min, followed by stimulation with 5 ng mL−1 TGFβ for 30 min. Scale bar, 10 μm. The mean PLA signal (number of foci per nucleus) is quantified (right), where each data point represents the mean signal calculated within one image. P-value was calculated using an unpaired, two-tailed Student’s t-test. Ten images were used per condition and data are representative of three independent assays. (G) As in (F) except antibodies against endogenous TRIM27 and SMAD4 were used. (H) Tumor volumes from mice orthotopically injected with SUM159T-Luciferase cells stably expressing shRNAs against TRIM27 (n = 10) or a non-targeting control (n = 9). P-value was calculated using an unpaired, two-tailed Student’s t-test. (I) Representative images of bioluminescence (BLI) measurements taken for mice from each group. BLI data was quantified (right) and the p-value was calculated using an unpaired, two-tailed Student’s t-test.
Figure 6—figure supplement 1
Analysis of TRIM27 expression and contribution to neoplastic behaviors in TNBC.
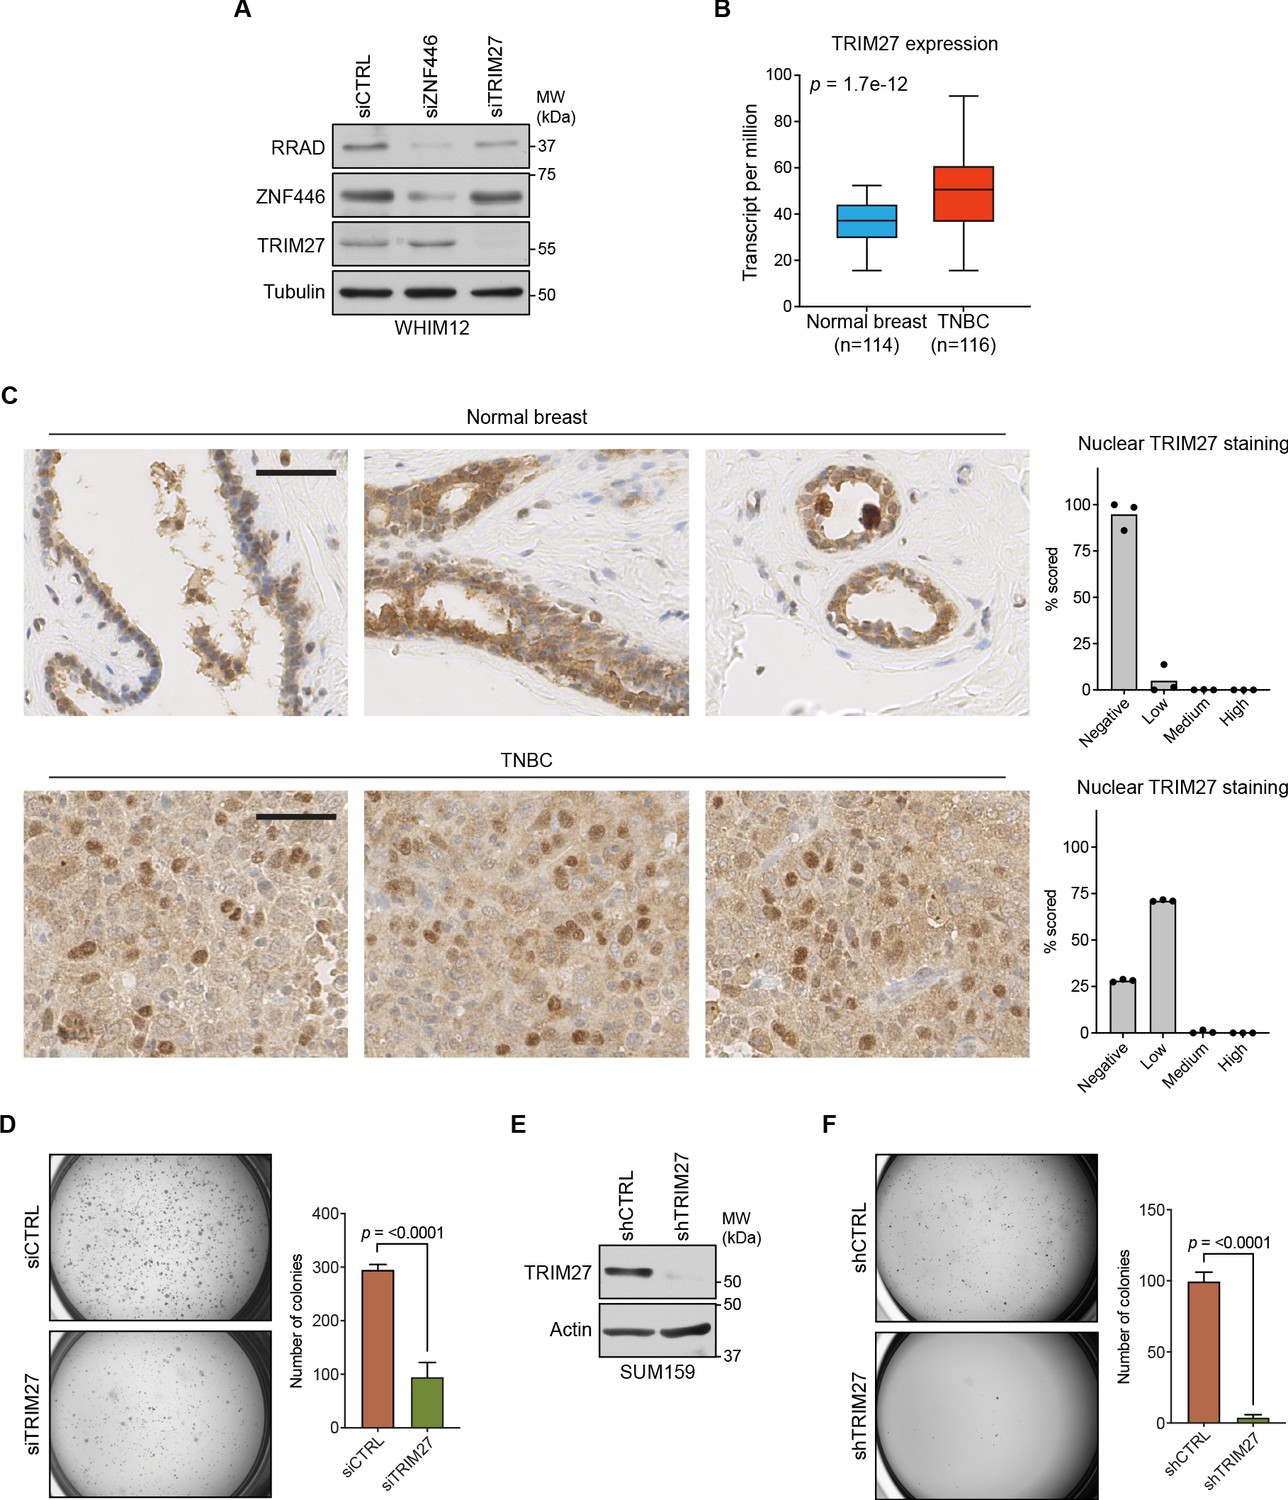
(A) WHIM12 cells were transfected with indicated siRNA for 72 hr. Whole cell lysates were collected and immunoblotted for the indicated proteins. Data are representative of two independent experiments. (B) Box-plot showing TRIM27 expression values (transcript per million) from normal breast and TNBC. Data were obtained from TCGA and the p-value was calculated using an unpaired, two-tailed Student’s t-test. (C) Immunohistochemistry (IHC) staining for TRIM27 in patient-derived normal breast and TNBC tissues. Scale bar, 50 μm. Nuclear staining was scored (right) using IHC Profiler (Varghese et al., 2014). (D) Soft agar growth assays for SUM159 cells transfected with indicated siRNAs. Error bars represent mean + SEM. P-value was calculated using an unpaired, two-tailed Student’s t-test. Data are representative of three independent experiments. (E) SUM159T-Luciferase cells were transduced with indicated shRNAs. After 72 hr, whole cell lysates were collected and immunoblotted for the indicated proteins. Data are representative of two independent experiments. (F) Soft agar growth assays for SUM159T-Luciferase cells transduced with indicated shRNAs. Error bars represent mean + SEM. P-value was calculated using an unpaired, two-tailed Student’s t-test. Data are representative of three independent experiments.
Figure 7
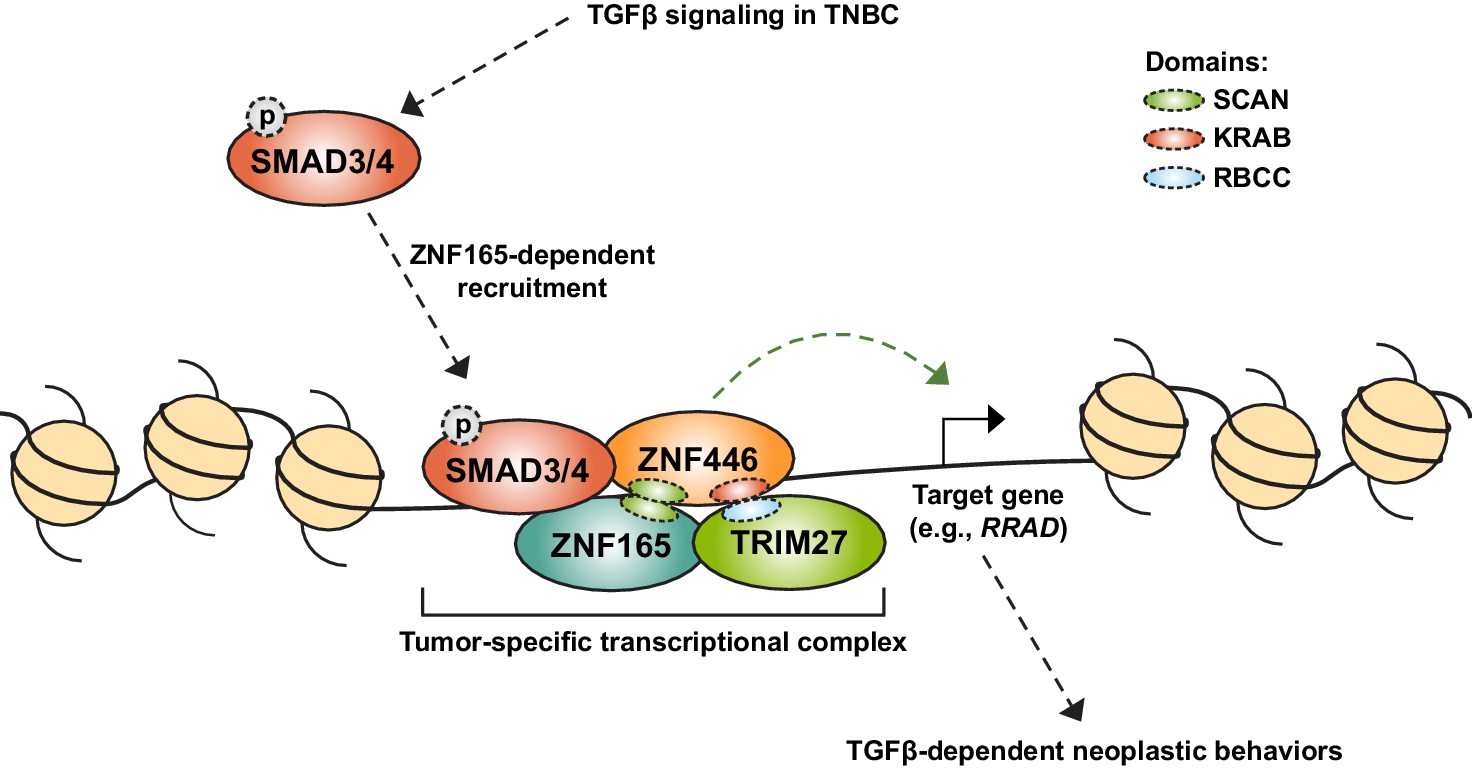
Model for assembly of a neomorphic ZNF165 transcriptional complex in TNBC.
Aberrant expression of testis-specific ZNF165 in TNBC co-opts somatic transcriptional machinery to modulate TGFβ-dependent transcription. The ZNF165 SCAN domain mediates interaction with ZNF446, and together these factors associate with SMAD3 at shared binding sites throughout the genome and alter gene expression to promote neoplastic behaviors. Via its KRAB domain, ZNF446 likely recruits the co-activator/co-repressor TRIM27, which is essential for ZNF165 transcriptional activity and tumor growth in vivo. Given the testis/tumor-restricted expression of ZNF165, disruption of this complex holds potential as a therapeutic strategy to specifically inhibit pro-tumorigenic TGFβ signaling in TNBC.
Tables
Key resources table
| Reagent type (species) or resource | Designation | Source or reference | Identifiers | Additional information |
|---|---|---|---|---|
| Strain, strain background (Mus musculus) | NOD.Cg-PrkdcscidIl2rgtm1Wjl/SzJ; NSG | The Jackson Laboratory | Stock no. 005557; RRID:IMSR_JAX:005557 | |
| Cell line (Homo sapiens) | HEK293T | ATCC | CRL-3216; RRID:CVCL_0063 | |
| Cell line (H. sapiens) | MCF7 | ATCC | HTB-22; RRID:CVCL_0031 | |
| Cell line (H. sapiens) | WHIM12 | Li et al., 2013 | ||
| Cell line (H. sapiens) | SUM159 | Asterand | RRID:CVCL_5423 | |
| Cell line (H. sapiens) | SUM159T-Luciferase | Westcott et al., 2015 | ||
| Antibody | anti-HA (Rat monoclonal) | Roche | Cat #11867423001; RRID:AB_390918 | IB (1:1000), IP (1 μg) |
| Antibody | anti-c-Myc (Rabbit polyclonal) | Santa Cruz Biotechnology | sc-789; RRID:AB_631274 | IB (1:1000) |
| Antibody | anti-V5 (Rabbit monoclonal) | Cell Signaling Technology | Cat #13202; RRID:AB_2687461 | IB (1:1000) |
| Antibody | anti-SMAD3 (Rabbit polyclonal) | Abcam | ab28379; RRID:AB_2192903 | IB (1:1000), PLA (1:200), ChIP-qPCR (1.5 μg), ChIP-seq (10 μg) |
| Antibody | anti-phospho-SMAD3 (Rabbit monoclonal) | Cell Signaling Technology | Cat #9520; RRID:AB_2193207 | IB (1:1000), ChIP (5 μg) |
| Antibody | anti-SMURF2 (Mouse monoclonal) | Santa Cruz Biotechnology | sc-393848 | IB (1:500) |
| Antibody | anti-RRAD (Goat polyclonal) | Thermo Fisher Scientific | PA537885; RRID:AB_2554493 | IB (1:1000) |
| Antibody | anti-ZNF165 (Mouse monoclonal) | Novus Biologicals | H00007718-M02; RRID:AB_1717273 | IB (1:1000) |
| Antibody | anti-ZNF165 (Rabbit polyclonal) | Atlas Antibodies | HPA007247; RRID:AB_2797217 | IB (1:1000), PLA (1:200), IP (5 μg) |
| Antibody | anti-Tubulin (Rabbit monoclonal) | Cell Signaling Technology | Cat #2128; RRID:AB_823664 | IB (1:1000) |
| Antibody | anti-ZNF446 (Rabbit polyclonal) | Proteintech | 16218–1-AP | IB (1:1000), PLA (1:200) |
| Antibody | anti-TRIM27 (Rabbit monoclonal) | Cell Signaling Technology | Cat #15099; RRID:AB_2798707 | IB (1:1000) |
| Antibody | anti-V5 (Mouse monoclonal) | Thermo Fisher Scientific | R960-25; RRID:AB_2556564 | PLA (1:500), IP (1 μg) |
| Antibody | anti-SMAD3 (Mouse monoclonal) | Santa Cruz Biotechnology | sc-101154; RRID:AB_1129525 | PLA (1:200) |
| Antibody | anti-SMAD4 (Mouse monoclonal) | Santa Cruz Biotechnology | sc-7966; RRID:AB_627905 | PLA (1:200) |
| Antibody | anti-TRIM27 (Rabbit polyclonal) | Proteintech | 12205–1-AP; RRID:AB_2256660 | PLA (1:200), IHC (1:200) |
| Antibody | anti-H3K27ac (Rabbit polyclonal) | Abcam | ab4729; RRID:AB_2118291 | ChIP-qPCR (2 μg) |
| Antibody | Normal rabbit IgG (Rabbit polyclonal) | Cell Signaling Technology | Cat #2729; RRID:AB_1031062 | IP (1 μg), ChIP-qPCR (1.5–5 μg) |
| Antibody | anti-V5 (Rabbit polyclonal) | Abcam | ab9116; RRID:AB_307024 | ChIP-seq (5 μg) |
| Peptide, recombinant protein | Human Transforming Growth Factor-β1 | Cell Signaling Technology | Cat #8915 | |
| Chemical compound, drug | SB-431542 | Tocris Bioscience | Cat #1614 | |
| Commercial assay or kit | KAPA HyperPrep Kit | KAPA Biosystems | KK8502 | |
| Commercial assay or kit | Duolink In Situ PLA Probe Anti-Mouse PLUS | Sigma-Aldrich | DUO92001; RRID:AB_2810939 | |
| Commercial assay or kit | Duolink In Situ PLA Probe Anti-Rabbit MINUS | Sigma-Aldrich | DUO92005; RRID:AB_2810942 | |
| Commercial assay or kit | Duolink In Situ Detection Reagent Red | Sigma-Aldrich | DUO92008 | |
| Software, algorithm | ImageJ (Fiji) | Schindelin et al., 2012 | RRID:SCR_002285 | ver 2.0.0 |
| Software, algorithm | Bowtie2 | Langmead and Salzberg, 2012 | RRID:SCR_005476 | ver 2.3.2 |
| Software, algorithm | SAMtools | Li et al., 2009 | RRID:SCR_002105 | ver 1.6 |
| Software, algorithm | DeepTools | Ramírez et al., 2016 | RRID:SCR_016366 | ver 2.3.5 |
| Software, algorithm | Integrative Genomics Viewer | Robinson et al., 2011 | RRID:SCR_011793 | ver 2.3.93 |
| Software, algorithm | HOMER | Heinz et al., 2010 | RRID:SCR_010881 | ver 4.9 |
| Software, algorithm | GREAT | McLean et al., 2010 | RRID:SCR_005807 | ver 3.0.0 |
| Software, algorithm | MEME | Bailey et al., 2009 | RRID:SCR_001783 | ver 5.1.1 |
| Software, algorithm | GSEA | Subramanian et al., 2005 | RRID:SCR_003199 | ver 4.0.3 |
Additional files
-
Supplementary file 1
GREAT (ver. 3.0.0) analysis of the 118 ZNF165/SMAD3 co-bound regions determined using default association rules.
- https://cdn.elifesciences.org/articles/57679/elife-57679-supp1-v2.docx
-
Supplementary file 2
Genes included in the EPITHELIAL_MESENCHYMAL_TRANSITION gene set with corresponding enrichment values for WHIM12 cells depleted of ZNF165.
- https://cdn.elifesciences.org/articles/57679/elife-57679-supp2-v2.docx
-
Supplementary file 3
Interactome data for ZNF165 and ZNF446 obtained from the CCSB Interactome Database.
- https://cdn.elifesciences.org/articles/57679/elife-57679-supp3-v2.xls
-
Supplementary file 4
Sequence-based reagents used for gene expression analysis, ChIP, and knockdown experiments.
- https://cdn.elifesciences.org/articles/57679/elife-57679-supp4-v2.xls
-
Transparent reporting form
- https://cdn.elifesciences.org/articles/57679/elife-57679-transrepform-v2.pdf
Download links
A two-part list of links to download the article, or parts of the article, in various formats.
Downloads (link to download the article as PDF)
Open citations (links to open the citations from this article in various online reference manager services)
Cite this article (links to download the citations from this article in formats compatible with various reference manager tools)
The testis protein ZNF165 is a SMAD3 cofactor that coordinates oncogenic TGFβ signaling in triple-negative breast cancer
eLife 9:e57679.
https://doi.org/10.7554/eLife.57679


