KAT2-mediated acetylation switches the mode of PALB2 chromatin association to safeguard genome integrity
- Sir William Dunn School of Pathology, University of Oxford, United Kingdom
- CHU de Québec Research Center, Oncology Division; Department of Molecular Biology, Medical Biochemistry and Pathology, Laval University Cancer Research Center, Canada
- Department of Biochemistry, University of Oxford, United Kingdom
- Advanced Proteomics Facility, University of Oxford, United Kingdom
- The Francis Crick Institute, United Kingdom
- Institut de Génétique et de Biologie Moléculaire et Cellulaire, France
- Centre National de la Recherche Scientifique, France
- Institut National de la Santé et de la Recherche Médicale, France
- Université de Strasbourg, France
Figures
Figure 1 with 1 supplement
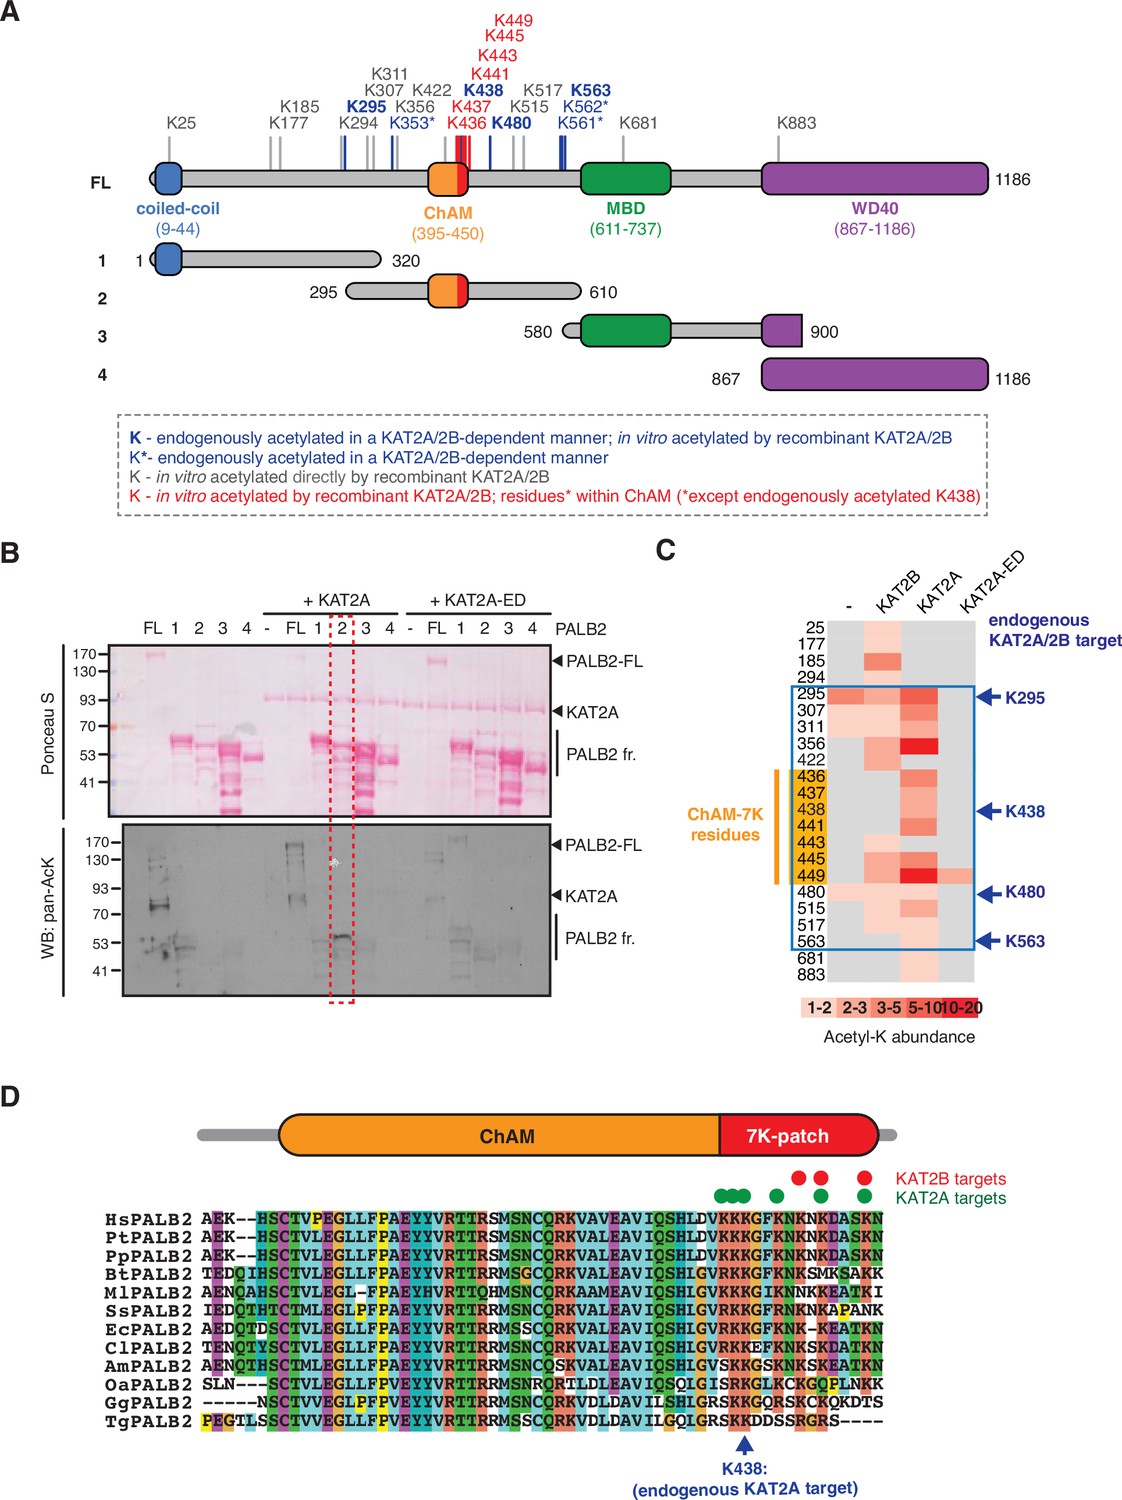
KAT2A/2B acetylate PALB2 within a 7K-patch in its ChAM domain.
(A) PALB2 lysine residues identified as acceptors of KAT2A/2B-dependent acetylation in vivo and in vitro by tandem MS analyses are shown in blue and black, respectively. An asterisk indicates residues that are only detected in endogenous PALB2, but not in PALB2 acetylated in vitro. The acetylated lysine residues within the ChAM are highlighted in red. Full-length PALB2 (FL,~131,3 kDa) and fragments 1–4 used for in vitro acetylation assays are also shown. 1: PALB2 1–320 (36.2 kDa), 2: 295–610 (35.6 kDa), 3: 580–900 (35.3 kDa) and 4: 867–1186 (35.3 kDa). (B) In vitro acetylation of PALB2 by KAT2A and catalytically inactive KAT2A-ED. Purified GST-fusions of PALB2 full-length (158.1 kDa) and fragments 1 (63 kDa), 2 (62.4 kDa), 3 (62.1 kDa), and 4 (62.1 kDa) (depicted in A) were incubated with either purified Flag-KAT2A or Flag-KAT2A-ED in the presence of acetyl-CoA, followed by SDS-PAGE. Total and acetylated proteins were visualized by Ponceau S and anti-acetyl lysine (pan-AcK) western blot, respectively. PALB2 fragment 2 acetylation by KAT2A is highlighted with a red dashed box. (C) A heat map of acetylated lysine residues, as identified by quantitative MS analysis of in vitro acetylated PALB2 FL or fragment 2 by KAT2B, KAT2A or a catalytically inactive KAT2A (KAT2A-ED). The abundance of each acetyl-lysine was evaluated as previously described (Fournier et al., 2016). The lysine residues which were detected as endogenous acetylation acceptor are shown to the left. (D) ChAM protein sequences from twelve PALB2 orthologues were aligned using MUSCLE (EMBL-EBI sequence analysis tool) and visualised using the ClustalW software with default colour-coding. Lysine residues acetylated by KAT2A and KAT2B in vitro are respectively highlighted by red and green dots. Hs (Homo sapiens, human), Pt (Pan troglodytes, chimpanzee), Pp (Pan paniscus, bonobo), Bt (Bos taurus, cow), Ml (Myotis lucifugus, little brown bat), Ss (Sus scrofa, wild boar), Ec (Equus caballus, horse), Cl (Canis lupus familiaris, dog), Am (Ailuropoda melanoleuca, giant panda), Oa (Ovis aries, sheep), Gg (Gallus gallus, red junglefowl), Tg (Taeniopygia guttata, zebra finch).
-
Figure 1—source data 1
Original images for Figure 1B.
- https://cdn.elifesciences.org/articles/57736/elife-57736-fig1-data1-v2.pdf
Figure 1—figure supplement 1

PALB2 is directly acetylated by KAT2B.
(A) PALB2 FL and fragments 1–4 were acetylated in vitro by KAT2B with 14C-labelled acetyl-CoA, and following SDS-PAGE, acetylated proteins and total proteins were detected by 14C-autoradiography and Coomassie blue staining, respectively. RAD51 was not identified as a target of KAT2A/2B in vivo (Fournier et al., 2016) and was used as a negative control. (B) In vitro acetylation of PALB2 by KAT2B. Purified PALB2 full-length and fragments 1–4 (Figure 1A) were incubated with purified Flag-KAT2B in the presence of acetyl-CoA, followed by SDS-PAGE. Total and acetylated proteins were visualized by Ponceau S staining and anti-acetyl lysine (pan-AcK) western blot, respectively. PALB2 full-length and fragment 2 acetylated by KAT2B are highlighted by black arrows.
-
Figure 1—figure supplement 1—source data 1
Original images for Figure 1—figure supplement 1A.
- https://cdn.elifesciences.org/articles/57736/elife-57736-fig1-figsupp1-data1-v2.pdf
-
Figure 1—figure supplement 1—source data 2
Original images for Figure 1—figure supplement 1B.
- https://cdn.elifesciences.org/articles/57736/elife-57736-fig1-figsupp1-data2-v2.pdf
Figure 2 with 2 supplements
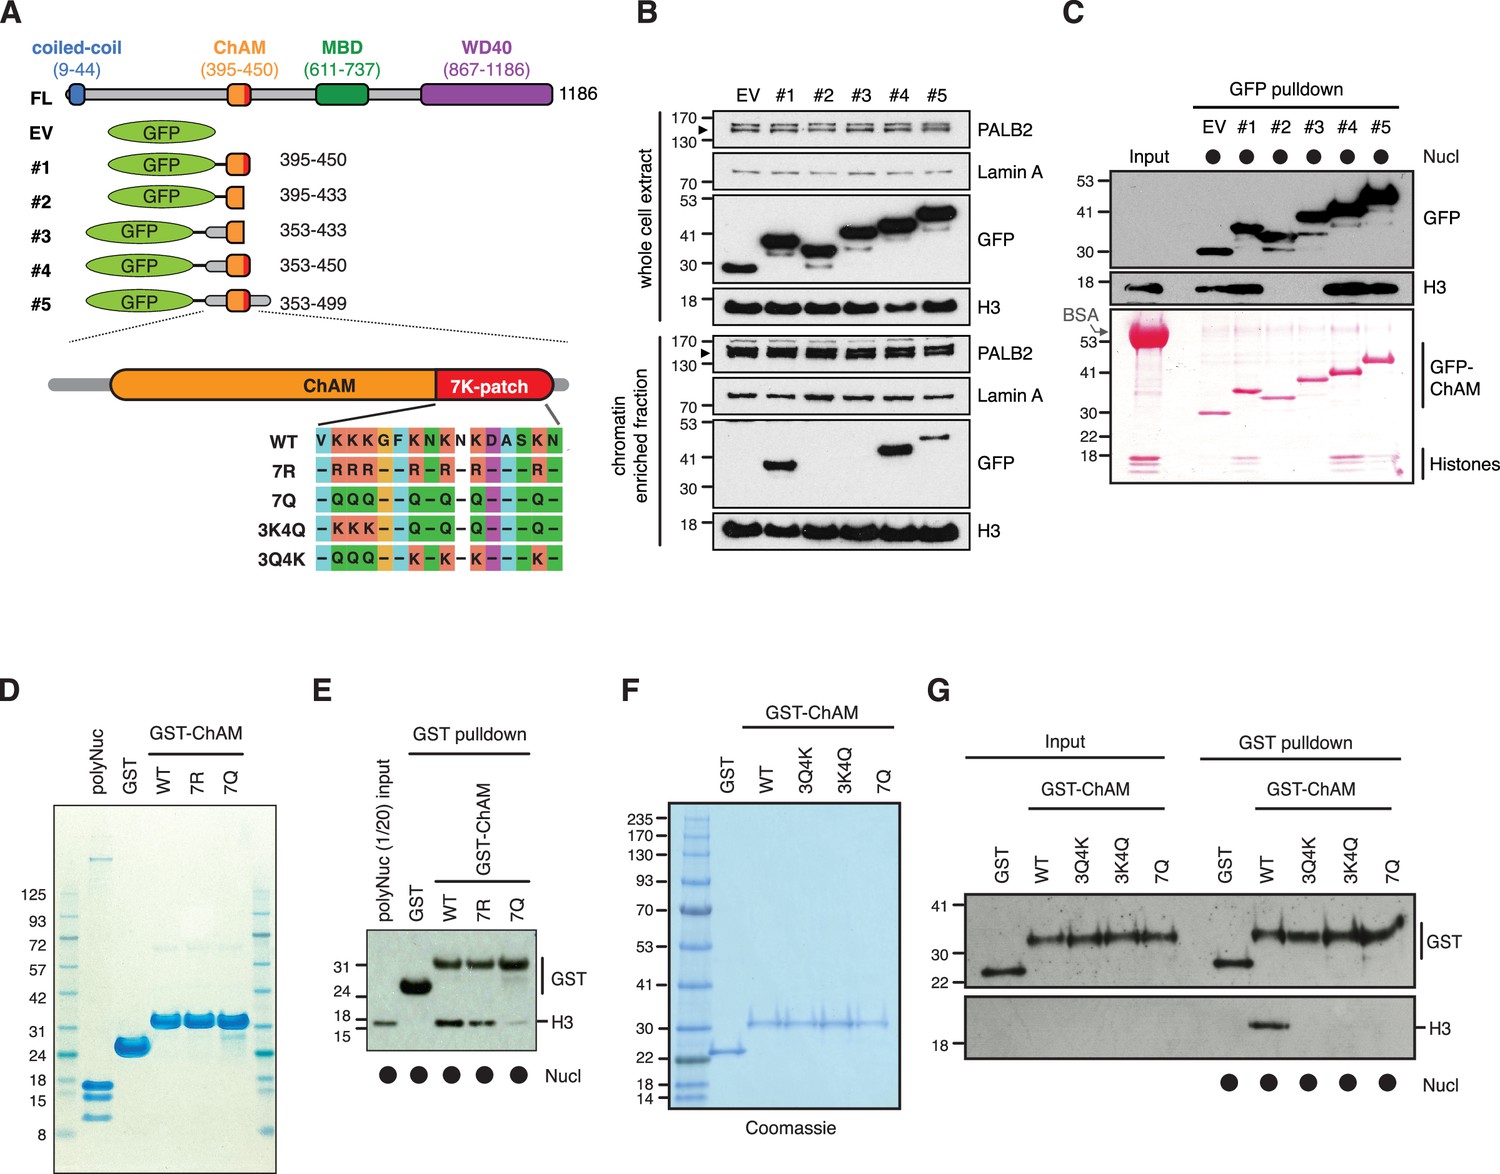
The 7K-patch promotes ChAM nucleosome association.
(A) Diagram showing the full-length (FL) PALB2, GFP-ChAM fragments #1 to #5 and GST-ChAM variants used in this study. ChAM C-terminal lysine-rich patch (7K-patch, residues 436–449) is highlighted in red. (B) Western blot analysis assessing the chromatin enrichment of GFP-ChAM fragments transiently expressed in HEK293T cells. Empty GFP vector (EV) was used as a negative control. Whole-cell extract was also prepared to compare GFP-ChAM fragments expression levels. Lamin A and histone H3 were used as controls for the cellular fractionation. (C) In vitro nucleosome binding assay using GFP and GFP-ChAM fragments. Partially purified human nucleosomes captured by GFP and GFP-ChAM fragments immobilised on beads were detected by anti-histone H3 western blot and Ponceau S staining. (D) Coomassie blue staining of GST and GST-ChAM 7R and 7Q variants purified from E. coli and separated by SDS-PAGE. (E) In vitro binding assays using immobilised GST-ChAM 7R and 7Q variants and purified HeLa poly-nucleosomes. GST was used as a negative control. The nucleosome binding efficiency was assessed by anti-histone H3 western blot. (F) Coomassie blue staining of GST and GST-ChAM 3Q4K, 3K4Q and 7Q variants purified from E. coli and separated by SDS-PAGE. (G) In vitro binding assays using immobilised GST-ChAM 3Q4K, 3K4Q and 7Q variants and purified HeLa mononucleosomes. GST was used as a negative control. The nucleosome binding efficiency was assessed by anti-histone H3 western blot.
-
Figure 2—source data 1
Original images for Figure 2B.
- https://cdn.elifesciences.org/articles/57736/elife-57736-fig2-data1-v2.pdf
-
Figure 2—source data 2
Original images for Figure 2C.
- https://cdn.elifesciences.org/articles/57736/elife-57736-fig2-data2-v2.pdf
-
Figure 2—source data 3
- https://cdn.elifesciences.org/articles/57736/elife-57736-fig2-data3-v2.pdf
-
Figure 2—source data 4
- https://cdn.elifesciences.org/articles/57736/elife-57736-fig2-data4-v2.pdf
Figure 2—figure supplement 1
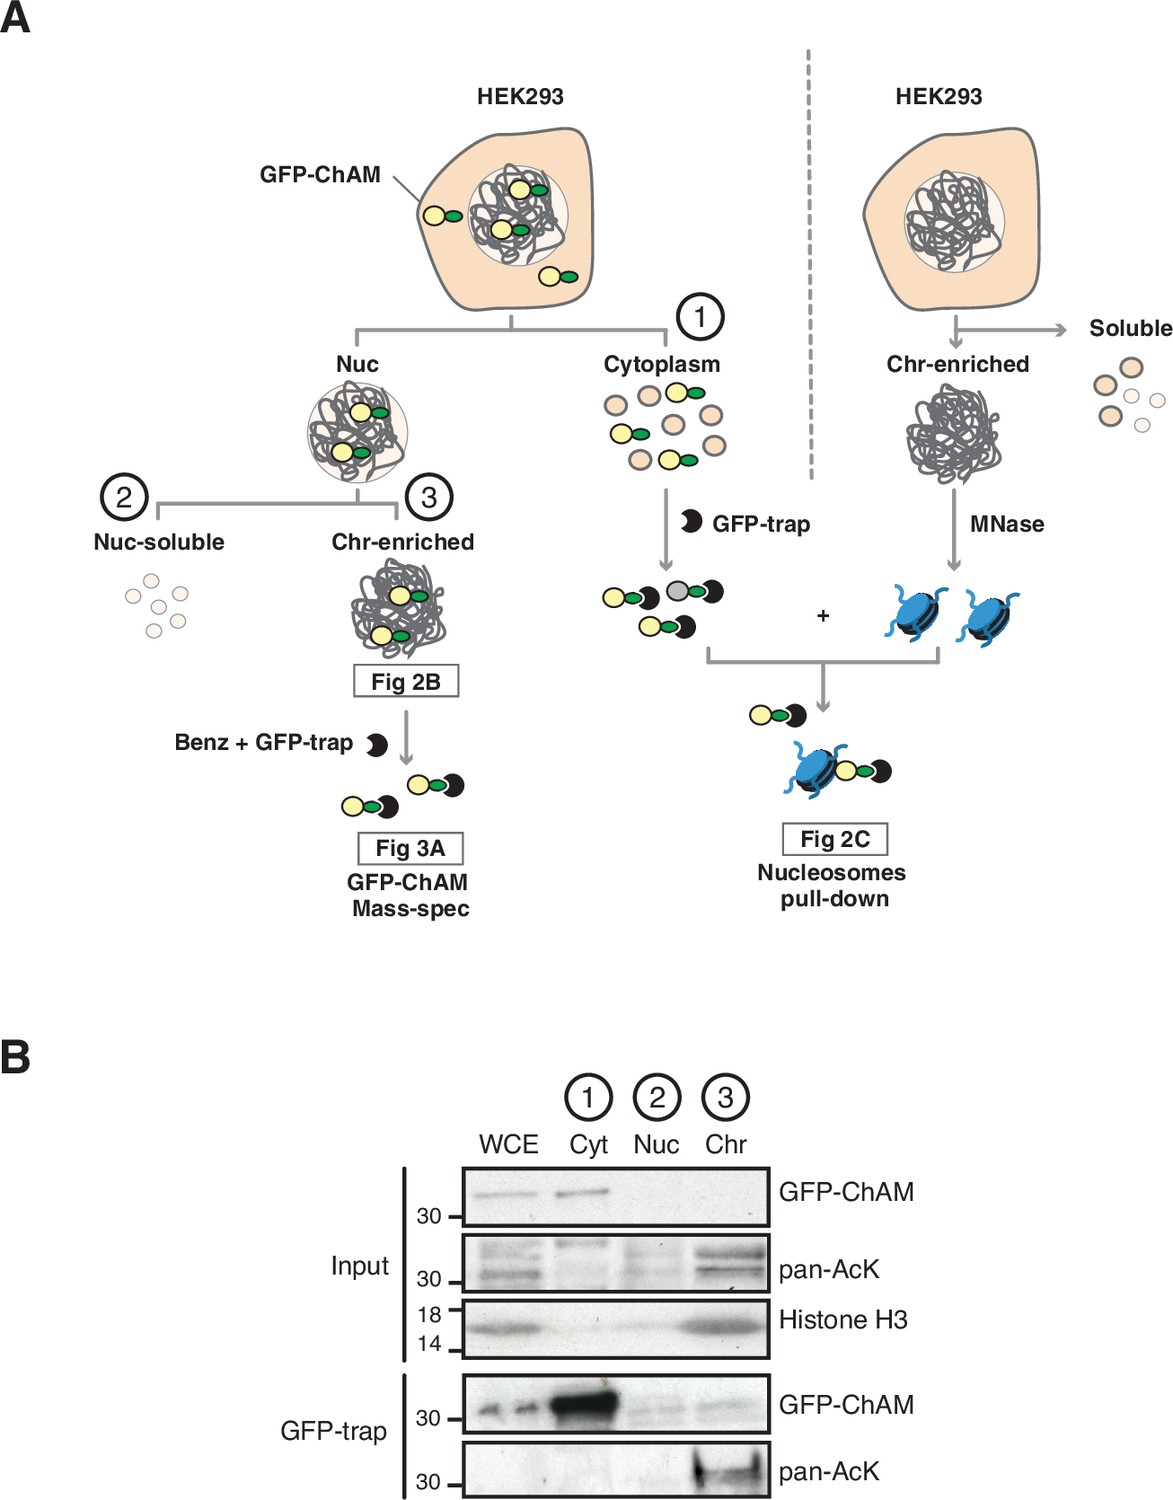
Chromatin-associated ChAM is highly acetylated in vivo.
(A) Depiction of experimental procedures for subcellular fractionation of HEK293T cells transiently expressing GFP-ChAM variants. Chromatin enriched GFP-ChAM was detected by western blot (Figure 2B), or following benzonase treatment, affinity purified using GFP-trap and was analysed for acetylation by MS (Figure 3A). For nucleosome binding assay, shown in Figure 2C, nucleosomes were partially purified from separate, non-transfected HEK293T, and incubated with GFP-ChAM purified from cytoplasmic fraction of transfected HEK293T. (B) Subcellular distribution of GFP-ChAM overexpressed in HEK293T cells, in cytoplasmic (Cyt), nuclear soluble (Nuc) and chromatin-enriched (Chr) fractions. Histone H3 was used as a control for cellular fractionation. GFP-ChAM and acetylated GFP-ChAM were respectively detected by anti-GFP and anti-acetyl-lysine (pan-AcK) antibodies.
-
Figure 2—figure supplement 1—source data 1
Original images for Figure 2—figure supplement 1B.
- https://cdn.elifesciences.org/articles/57736/elife-57736-fig2-figsupp1-data1-v2.pdf
Figure 2—figure supplement 2

Structural modelling of PALB2.
(A) Depiction of lysine (K), acetyl-lysine (K-ac), arginine (R) and glutamine (Q) structures, showing differences in size and charge for each residue. (B) AlphaFold2-based structural prediction of full-length PALB2. The coiled-coil, ChAM, MBD, and WD40 domains are highlighted in blue, pink, green, and red, respectively. The side chains of the 7K-patch are shown in atoms in the inset. The position of the K438 residue, the endogenous target of KAT2A/2B, is indicated by an arrow. (C) The ChAM variant amino acid sequence analysed by AlphaFold 2. (D) AlphaFold2 model structures of WT ChAM, 7R and 7Q in an atom-filled representation (left) and an overlay of five ribbon representations (right). Predicted volumes and surface area are shown at the bottom of each model in the left panel. Blue and red indicate positive and negative charges, respectively. The position of the K438 residue is indicated by an arrow in the right panel.
Figure 3 with 5 supplements
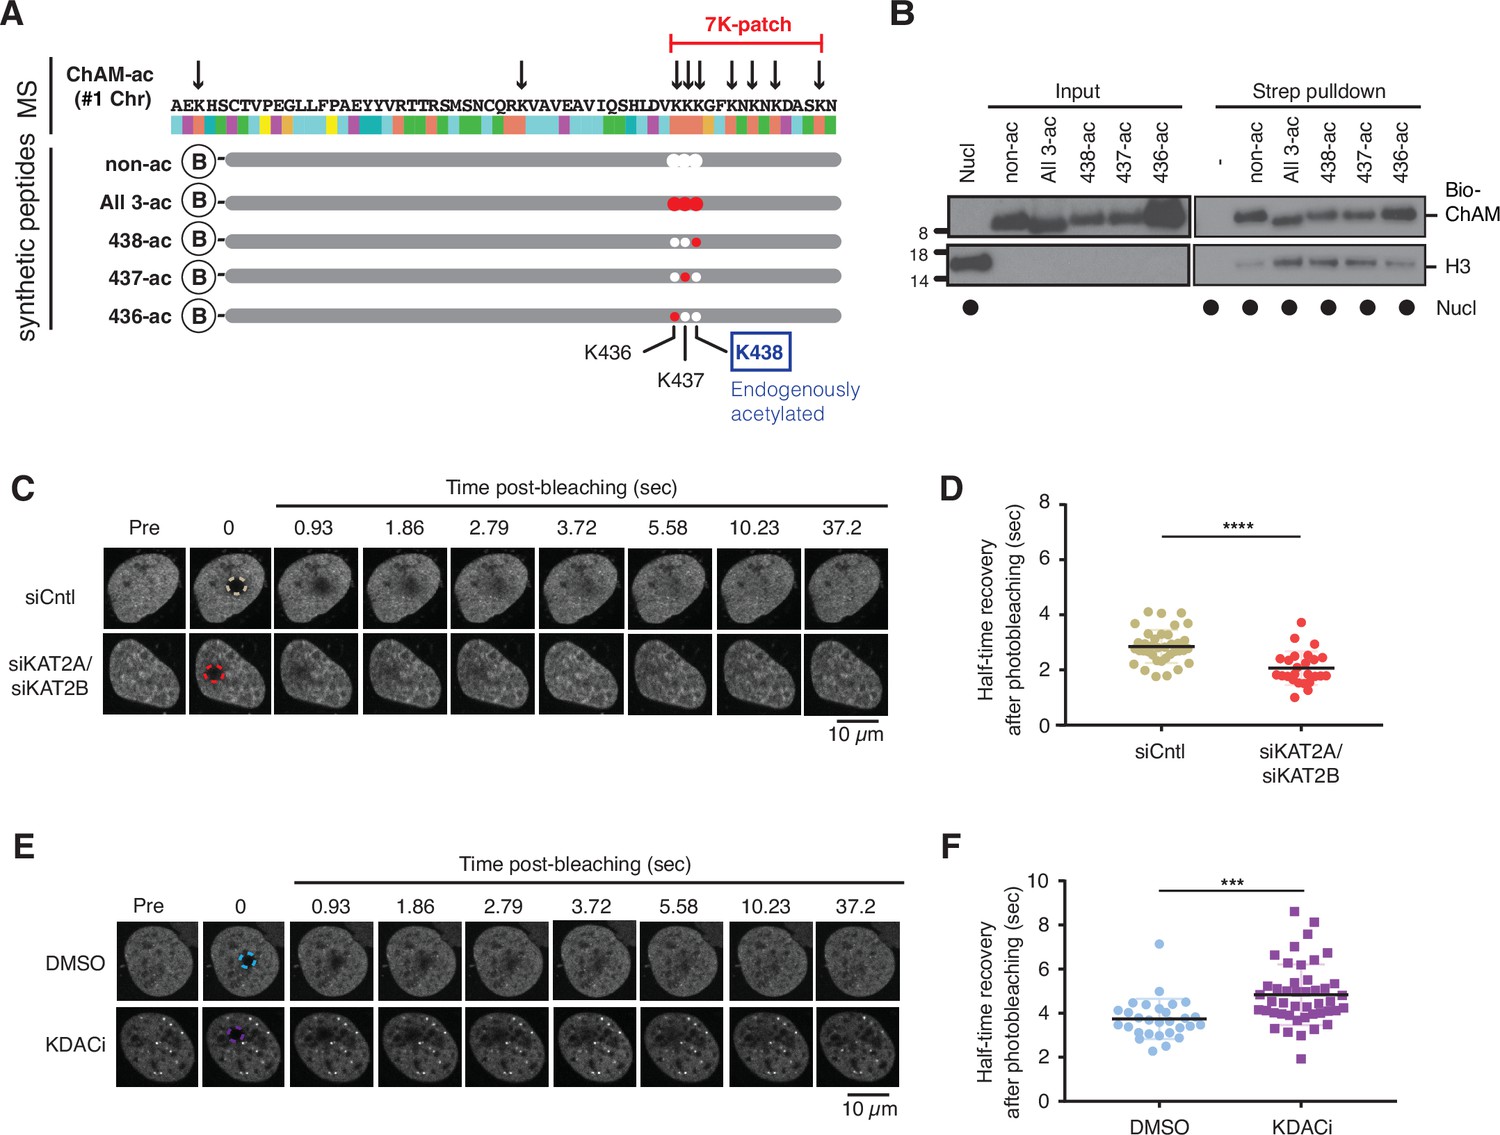
Acetylation within the 7K-patch enhances ChAM nucleosome association.
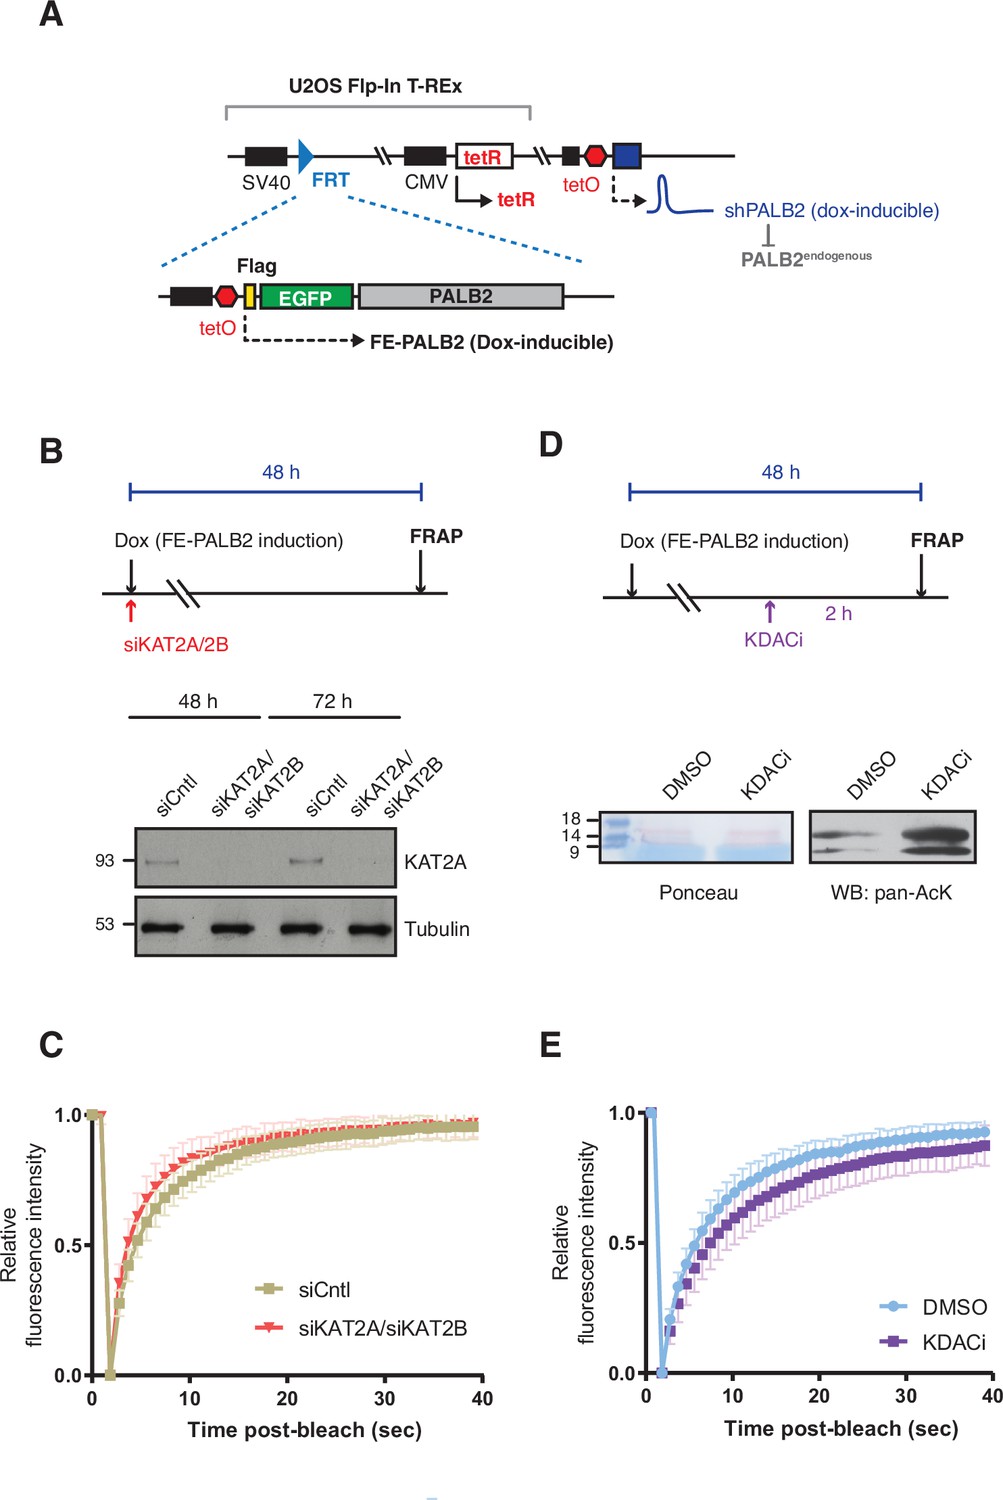
(A) In vivo acetylated lysine residues in chromatin-associated ChAM, detected by tandem MS analysis, are highlighted by arrows in the upper part (MS). Synthetic biotin-ChAM peptides non-acetylated (non-ac) or acetylated at single lysine residues 436 (436-ac), 437 (437-ac), and 438 (438-ac), or all three lysine residues (All 3-ac) are shown in the lower part. The position of the 7K-patch is highlighted in red. The position of the K438 residue, the endogenous target of KAT2A/2B within the ChAM (shown in Figure 1A), is highlighted in a box. (B) In vitro nucleosome binding assays for the synthetic biotin-ChAM peptides. After incubation with purified HeLa polynucleosomes in the presence of 5 µg salmon sperm DNA, biotin-ChAM peptides were pulled-down using streptavidin beads (Strep pulldown), and associated nucleosomes were detected by anti-histone H3 western blot. (C-D) FRAP assay of FE-PALB2 expressed in U2OS-shPALB2 cells, treated either with siRNA targeting KAT2A and KAT2B (siKAT2A/siKAT2B) or with negative control siRNA (siCntl). Representative images of live cells before bleaching (pre-bleaching) and during a 37.5 s recovery period (post-bleaching) are shown in (C), where dashed circles indicate bleached areas. FRAP data are quantified and plotted in (D). Dots represent values of half-recovery time (t1/2) for individual cells and bars mean values ± SD (siCntl, n=59; siKAT2A/2B, n=51). Statistical analyses were performed using GraphPad Prism 7.02 and p-values are for the unpaired Student’s t-test (*** p<0.0006). (E-F) As in C-D, except cells were treated with a cocktail of lysine deacetylase inhibitors (KDACi, 5 mM sodium butyrate, 5 µM trichostatin A, and 5 mM nicotinamide) or DMSO as a control. Representative images of live cells before bleaching (pre-bleaching) and during a 37.5 s recovery period (post-bleaching) are shown in (E), where dashed circles indicate bleached areas. FRAP data are quantified and plotted in (F). Dots represent values of half-recovery time (t1/2) for individual cells and bars mean values ± SD (DMSO, n=61; KDAC, n=94). Statistical analyses were performed using GraphPad Prism 7.02 and p-values are for the unpaired Student’s t-test (**** p<0.0001). Representative real-time cell images are shown in Figure 3—video 1 (siCntl), Figure 3—video 1 (siKAT2A/siKAT2B), Figure 3—video 1 (DMSO) and Figure 3—video 4 (KDACi).
-
Figure 3—source data 1
Original images for Figure 3B.
- https://cdn.elifesciences.org/articles/57736/elife-57736-fig3-data1-v2.pdf
-
Figure 3—source data 2
- https://cdn.elifesciences.org/articles/57736/elife-57736-fig3-data2-v2.xlsx
Figure 3—figure supplement 1
PALB2 mobility increases upon deacetylation.
(A) Depiction of cell lines used for FRAP assays of full-length PALB2. U2OS Flp-In T-REx, harbouring an inducible shRNA targeting the 3’-UTR of endogenous PALB2 (U2OS-shPALB2) was used as the parental cell line. FE-PALB2 under the tetO promoter, integrated at a defined FRT site, was induced by doxycycline exposure. (B) Diagram of experimental procedure, assessing the impact of KAT2A/2B using FRAP against FE-PALB2. KAT2A protein levels were measured by western blot analysis of U2OS-shPALB2 FE-PALB2 cells treated with siRNA targeting KAT2A and KAT2B (siKAT2A/siKAT2B) or scramble small interfering RNA (siCntl) (negative control) for 48 or 72 hr. Tubulin was used as a loading control. (C) Time plots of normalised mean fluorescence intensity of FE-PALB2 within the bleached area relative to that of the whole-cell in siCntl- or siKAT2A/2B-treated cells; related to the FRAP analysis shown in Figure 3C and D. Data represent mean values ± SD (siCntl, n=59; siKAT2A/2B, n=51). (D) Diagram of experimental procedure, assessing the impact of KDAC inhibition using FRAP against FE-PALB2. Levels of pan-acetylated histones in U2OS-shPALB2 FE-PALB2 cells treated with DMSO or deacetylases inhibitors (KDACi) are shown. Ponceau S staining of proteins after transfer onto nitrocellulose membrane was used as a loading control. (E) Time plots of normalised mean fluorescence intensity of FE-PALB2 within the bleached area relative to that of the whole-cell in DMSO- or KDACi-treated cells; related to FRAP analysis shown in Figure 3E and F. Data represent mean values ± SD (DMSO, n=61; KDAC, n=94).
-
Figure 3—figure supplement 1—source data 1
Original images for Figure 3—figure supplement 1B (left) and Figure 3—figure supplement 1D (right).
- https://cdn.elifesciences.org/articles/57736/elife-57736-fig3-figsupp1-data1-v2.pdf
-
Figure 3—figure supplement 1—source data 2
Numerical data for Figure 3—figure supplement 1C and E.
- https://cdn.elifesciences.org/articles/57736/elife-57736-fig3-figsupp1-data2-v2.xlsx
Figure 3—video 1
Representative FRAP image of FE-PALB2 expressed in U2OS cells treated with control siRNA (siCntl), related to Figure 3C and D.
Figure 3—video 2
Representative FRAP image of FE-PALB2 expressed in U2OS cell treated with siRNA targeting KAT2A and KAT2B (siKAT2A/siKAT2B), related to Figure 3C and D.
Figure 3—video 3
Representative FRAP image of FE-PALB2 expressed in U2OS cell treated with DMSO, related to Figure 3E and F.
Figure 3—video 4
Representative FRAP image of FE-PALB2 expressed in U2OS cell treated with a cocktail of lysine deacetylase inhibitors (KDACi), related to Figure 3E and F.
Figure 4 with 3 supplements
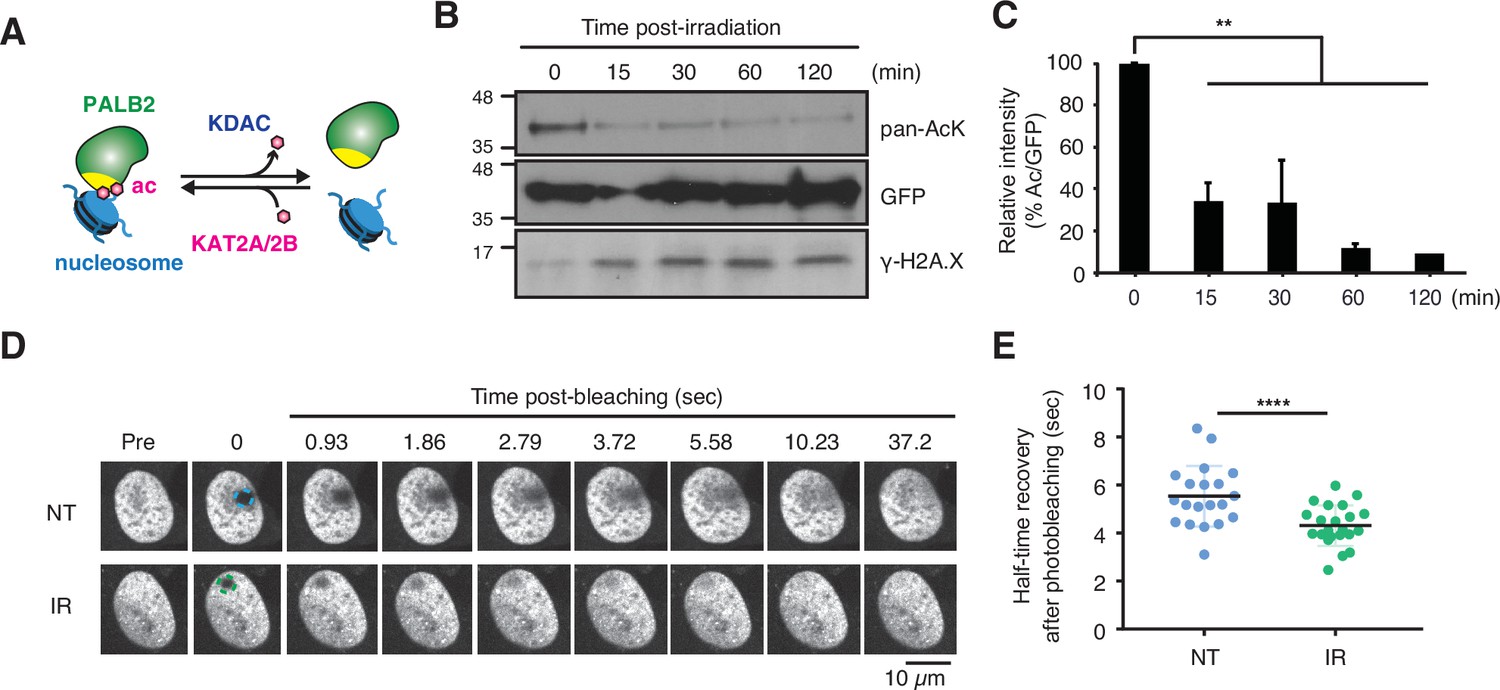
DNA damage triggers ChAM deacetylation and PALB2 mobilization.
(A) Depiction of PALB2 acetylation and nucleosome binding, controlled by KAT2A/2B and KDACs. (B) HEK293T cells transiently expressing GFP-ChAM were treated with 4 Gy IR, and affinity-purified GFP-ChAM acetylation was assessed using anti-acetyl-lysine (pan-AcK) western blot. γ-H2A.X signal in whole cell lysate was detected to monitor DNA damage. (C) Histogram showing the relative level of ChAM acetylation following irradiation. The levels of acetylated and total GFP-ChAM were quantified by ImageJ, and the ratio of acetyl/total GFP-ChAM was normalised against that of the pre-irradiation sample (time 0). Error bars indicate SD from two independent experiments (n=2). Statistical analyses were performed using GraphPad Prism 9.4.1 and p-value is the unpaired one-way ANOVA (**p<0.01). (D-E) FRAP assay of FE-PALB2 expressed in U2OS-shPALB2 cells, either non-treated (NT) or treated with 4 Gy IR. Representative images of live cells before bleaching (pre-bleaching) and during a 37.5 s recovery period (post-bleaching) are shown in (D), where dashed circles indicate bleached areas. FRAP data are quantified and plotted in (E). Dots represent values of half-recovery time (t1/2) for individual cells and bars mean values ± SD (NT, n=20; IR, n=21). Statistical analyses were performed using GraphPad Prism 7.02 and p-values are for the unpaired Student’s t-test (**** p<0.0001). Representative real-time cell images are shown in Figure 4—video 1 (NT) and Figure 4—video 2 (IR).
-
Figure 4—source data 1
Original images for Figure 4B.
- https://cdn.elifesciences.org/articles/57736/elife-57736-fig4-data1-v2.pdf
-
Figure 4—source data 2
Numerical data for Figure 4C and E.
- https://cdn.elifesciences.org/articles/57736/elife-57736-fig4-data2-v2.xlsx
Figure 4—figure supplement 1
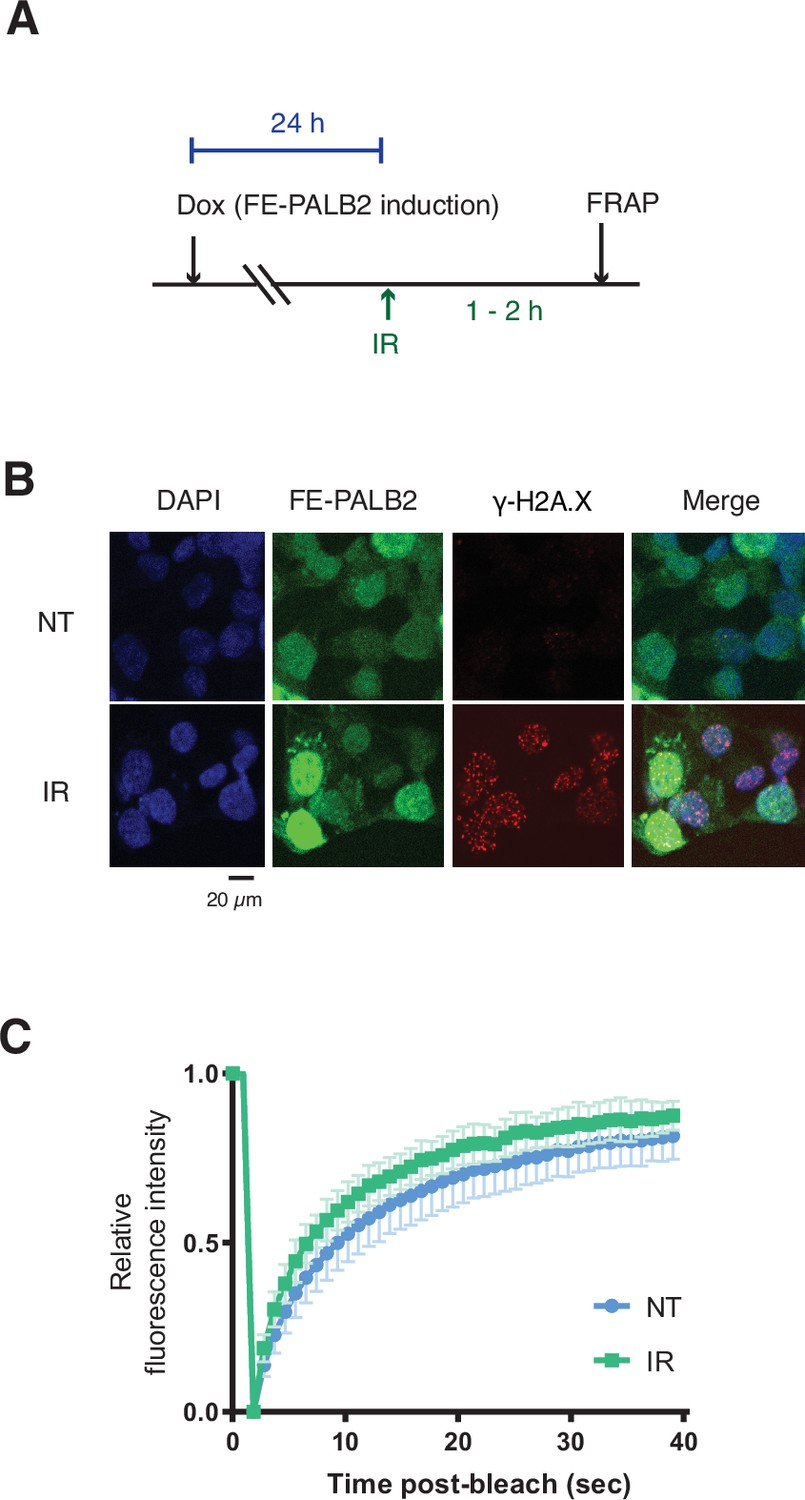
PALB2 mobility increases upon genotoxic stress.
(A) Diagrams of experimental procedures, assessing the impact of IR treatment on PALB2 mobility using FRAP against FE-PALB2. (B) γ-H2A.X levels in untreated or damaged cells (4 Gy IR) as assessed by anti-γ-H2A.X immunofluorescence staining. (C) Time plots of normalised mean fluorescence intensity of FE-PALB2 within the bleached area relative to that of the whole-cell in either undamaged or 4 Gy IR-treated cells; related to FRAP analysis shown in Figure 4D and E. Data represent mean values ± SD (NT, n=20; IR, n=21).
-
Figure 4—figure supplement 1—source data 1
Numerical data for Figure 4—figure supplement 1C.
- https://cdn.elifesciences.org/articles/57736/elife-57736-fig4-figsupp1-data1-v2.xlsx
Figure 4—video 1
Representative FRAP image of FE-PALB2 expressed in U2OS cell without treatment (NT), related to Figure 4D and E.
Figure 4—video 2
Representative FRAP image of FE-PALB2 expressed in U2OS cell following IR treatment, related to Figure 4D and E.
Figure 5 with 6 supplements
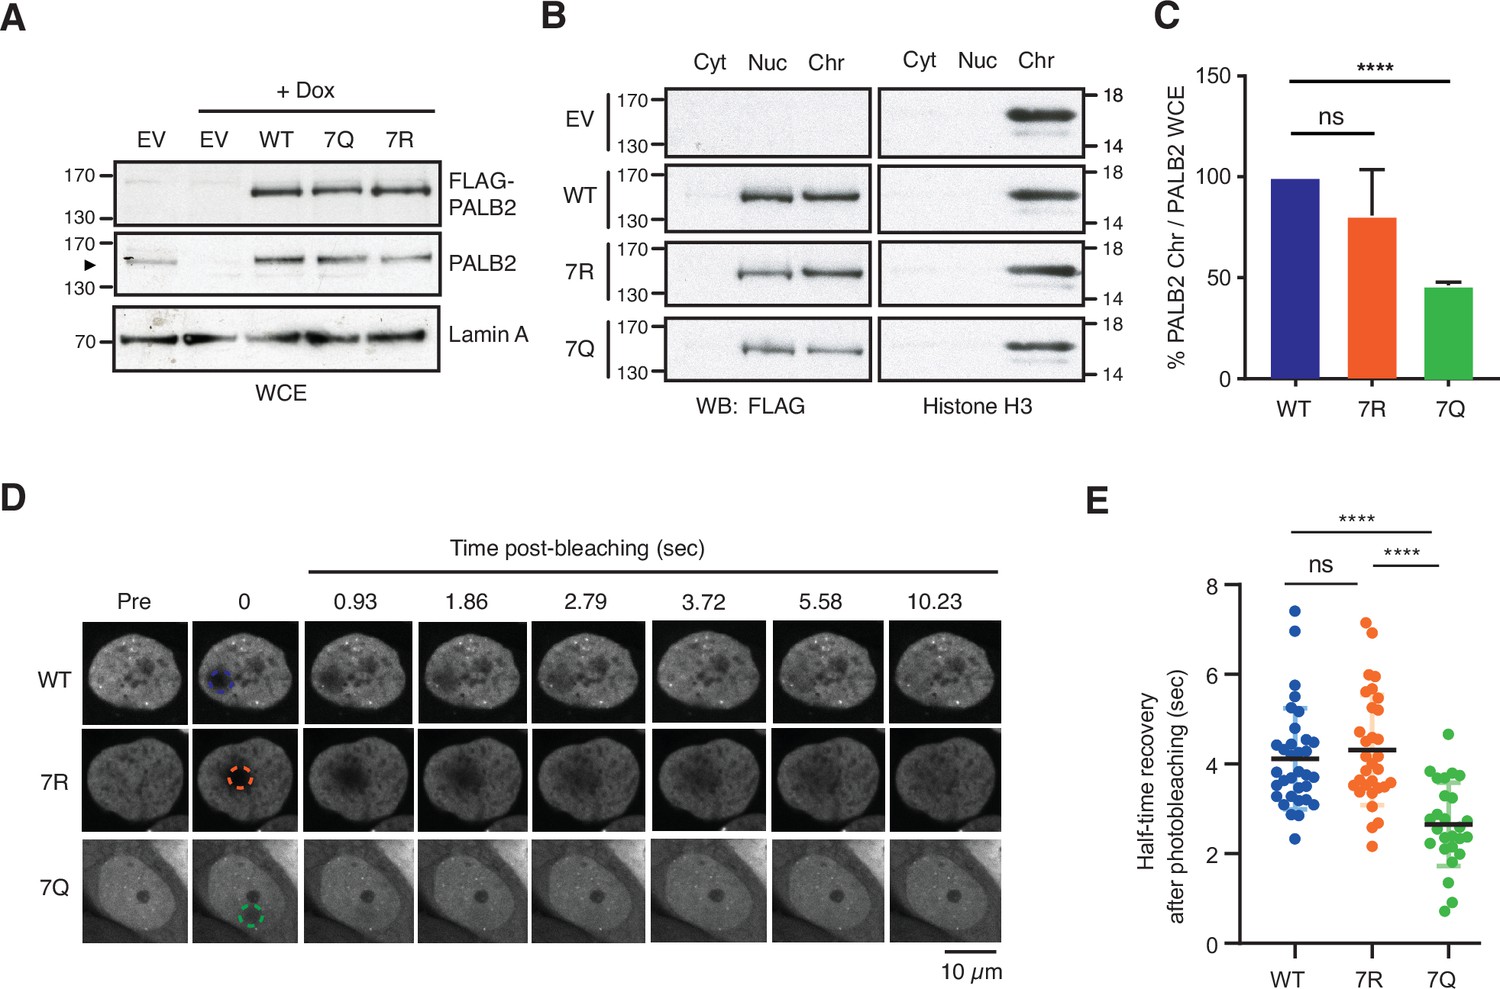
ChAM 7K-patch mediates PALB2 global chromatin association.
(A) Western blot analysis of U2OS-shPALB2 cells constitutively expressing FLAG (EV) or FLAG-PALB2 variants. Where indicated, cells were treated with 2 µg/mL doxycycline (+Dox) to deplete endogenous PALB2. Lamin A was used as a loading control. (B-C) Subcellular distribution of FLAG-PALB2 variants in cytoplasmic (Cyt), nuclear soluble (Nuc) and chromatin-enriched (Chr) fractions upon doxycycline-induced PALB2 depletion. Histone H3 was used as a control for cellular fractionation. Protein levels, detected by western blotting, were quantified using ImageJ. PALB2 levels in the chromatin fraction were normalised against PALB2 levels in whole-cell extracts shown in (A) and expressed as a percentage of the WT in (C). Data indicate mean values ± SD from three independent experiments (n=3). Statistical analyses were performed using GraphPad Prism 7.02, and p-values are from the unpaired Student’s t-test for pairwise comparisons (ns, not significant; **** p<0.0001). (D-E) FRAP analysis of FE-PALB2 WT, 7R and 7Q in U2OS-shPALB2 cells in which endogenous PALB2 was depleted via doxycycline exposure. Representative images before bleaching (pre-bleaching) and during the recovery period (post-bleaching) are shown in (D), where dashed circles indicate bleached areas. FRAP data are quantified and plotted in (E). Dots represent values of half-recovery time (t1/2) for individual cells and bars mean values ± SD (WT, n=33; 7R, n=31; 7Q, n=26). Statistical analyses were performed using GraphPad Prism 7.02 and p-values are from the unpaired Student’s t-test for pairwise comparisons (ns, not significant; **** p<0.0001). Representative real-time cell images are shown in Figure 5—video 1 (WT), Figure 5—video 2 (7R) and Figure 5—video 3 (7Q).
-
Figure 5—source data 1
Original images for Figure 5A.
- https://cdn.elifesciences.org/articles/57736/elife-57736-fig5-data1-v2.pdf
-
Figure 5—source data 2
Original images for Figure 5B.
- https://cdn.elifesciences.org/articles/57736/elife-57736-fig5-data2-v2.pdf
-
Figure 5—source data 3
Numerical data for Figure 5C and E.
- https://cdn.elifesciences.org/articles/57736/elife-57736-fig5-data3-v2.xlsx
Figure 5—figure supplement 1
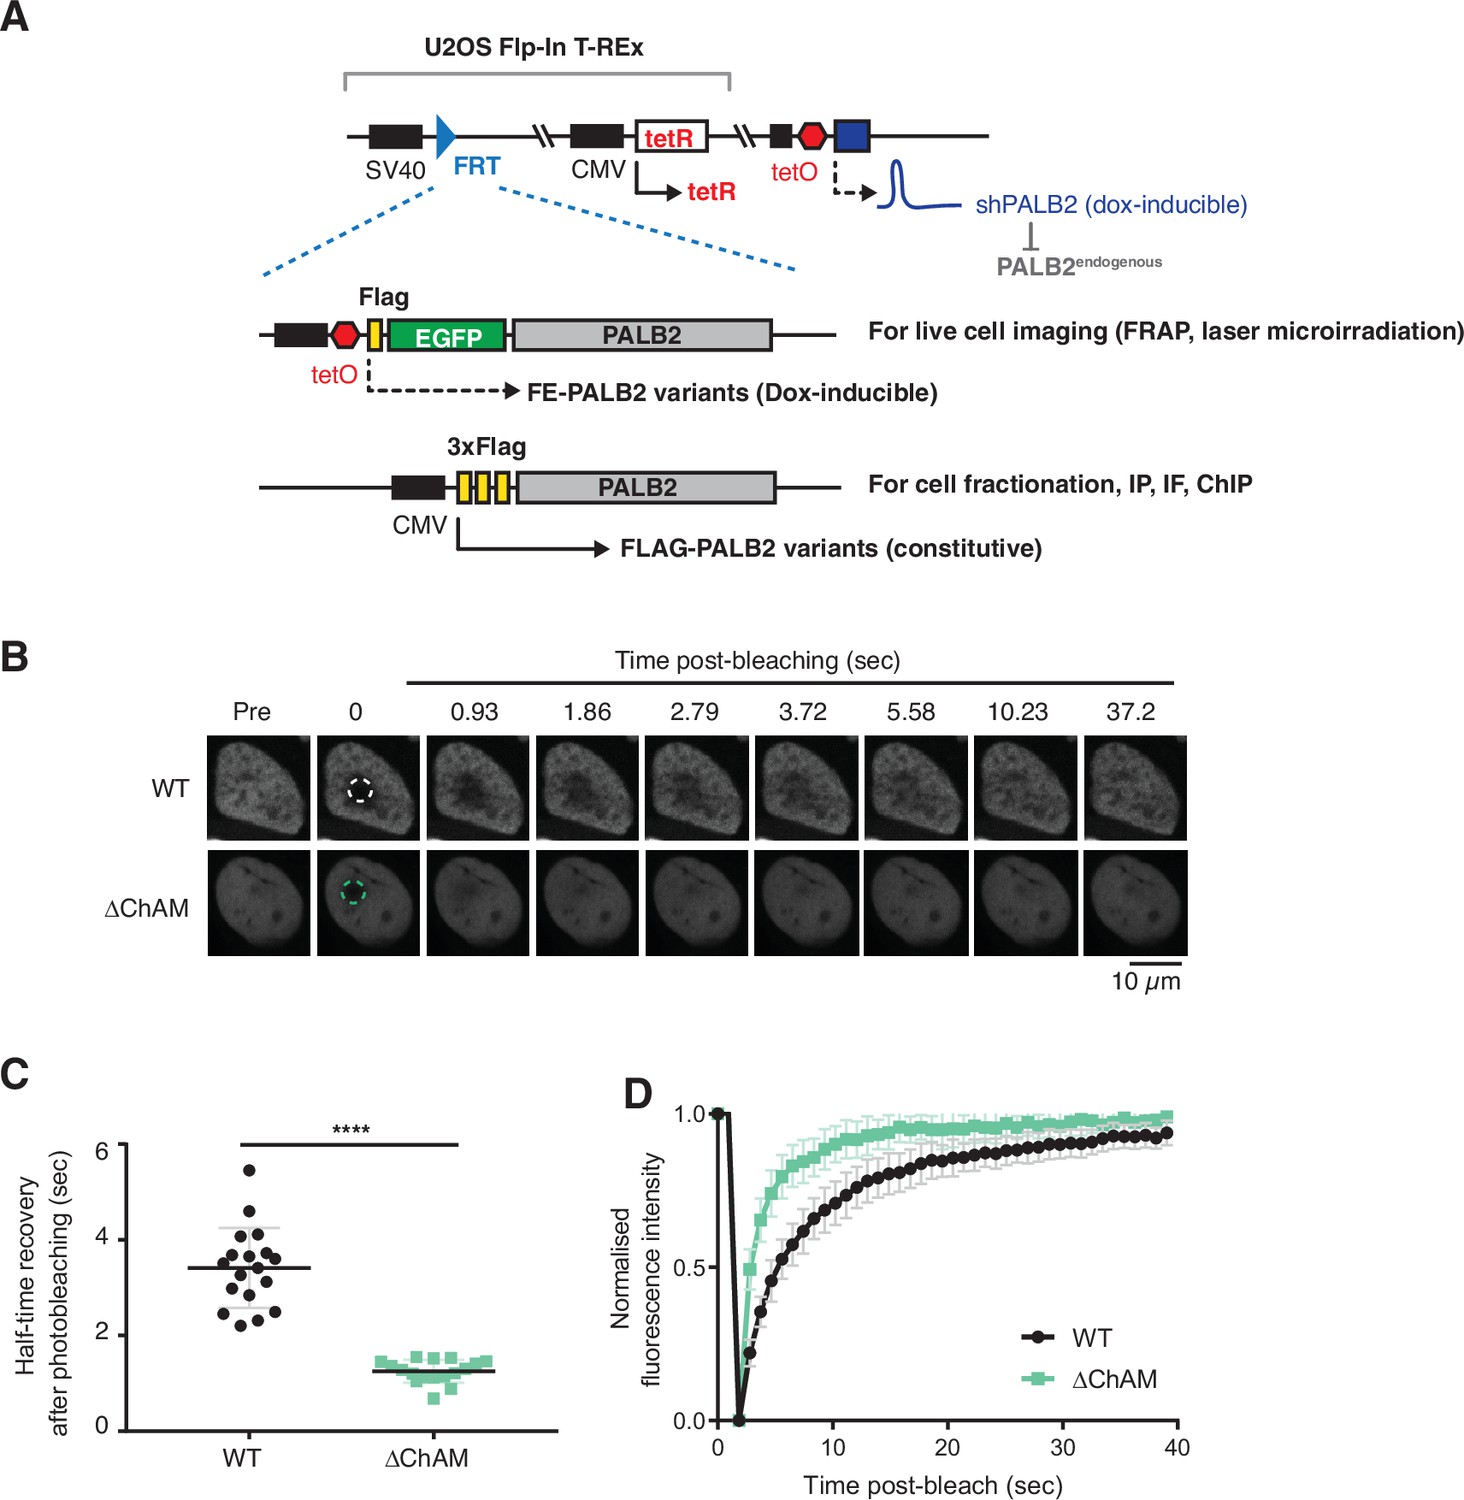
PALB2 ChAM limits its mobility.
(A) Depiction of the cell lines used in this study. The U2OS-shPALB2 cell line was used as the parental cell line. FE-PALB2 variants under the tetO promoter or FLAG-PALB2 variants under the CMV promoter were integrated at a defined FRT site. (B-D) FRAP analysis of FE-PALB2 wild-type (WT) or harbouring an internal deletion of the ChAM (ΔChAM) conditionally induced in U2OS-shPALB2. Images of FE-PALB2 in live cells before bleaching (pre-bleaching) and during the recovery time after bleaching are shown in (B). FRAP data are quantified and plotted in (C). Dots represent values of half-recovery time (t1/2) for individual cells and bars mean values ± SD (WT, n=18; ΔChAM, n=17). Statistical analyses were performed using GraphPad Prism 7.02 and p-values are for the unpaired Student’s t-test (**** p<0.0001). Time plots of normalised mean fluorescence intensity of FE-PALB2 WT or ΔChAM within the bleached area relative to that of the whole-cell are shown in (D). Data represent mean values of relative florescence intensity ± SD. Representative real-time cell images are shown in Figure 5—video 4 (WT) and Figure 5—video 5 (ΔChAM).
-
Figure 5—figure supplement 1—source data 1
Numerical data for Figure 5—figure supplement 1C.
- https://cdn.elifesciences.org/articles/57736/elife-57736-fig5-figsupp1-data1-v2.xlsx
Figure 5—video 1
Representative FRAP image of FE-PALB2 WT expressed in U2OS cell, related to Figure 5D and E.
Figure 5—video 2
Representative FRAP image of FE-PALB2 7R variant expressed in U2OS cell, related to Figure 5D and E.
Figure 5—video 3
Representative FRAP image of FE-PALB2 7Q variant expressed in U2OS cell, related to Figure 5D and E.
Figure 5—video 4
Representative FRAP image of FE-PALB2 WT expressed in U2OS cell, related to Figure 5—figure supplement 1B and C.
Figure 5—video 5
Representative FRAP image of FE-PALB2 with an internal deletion of the ChAM (ΔChAM) expressed in U2OS cell, related to Figure 5—figure supplement 1B and C.
Figure 6 with 1 supplement
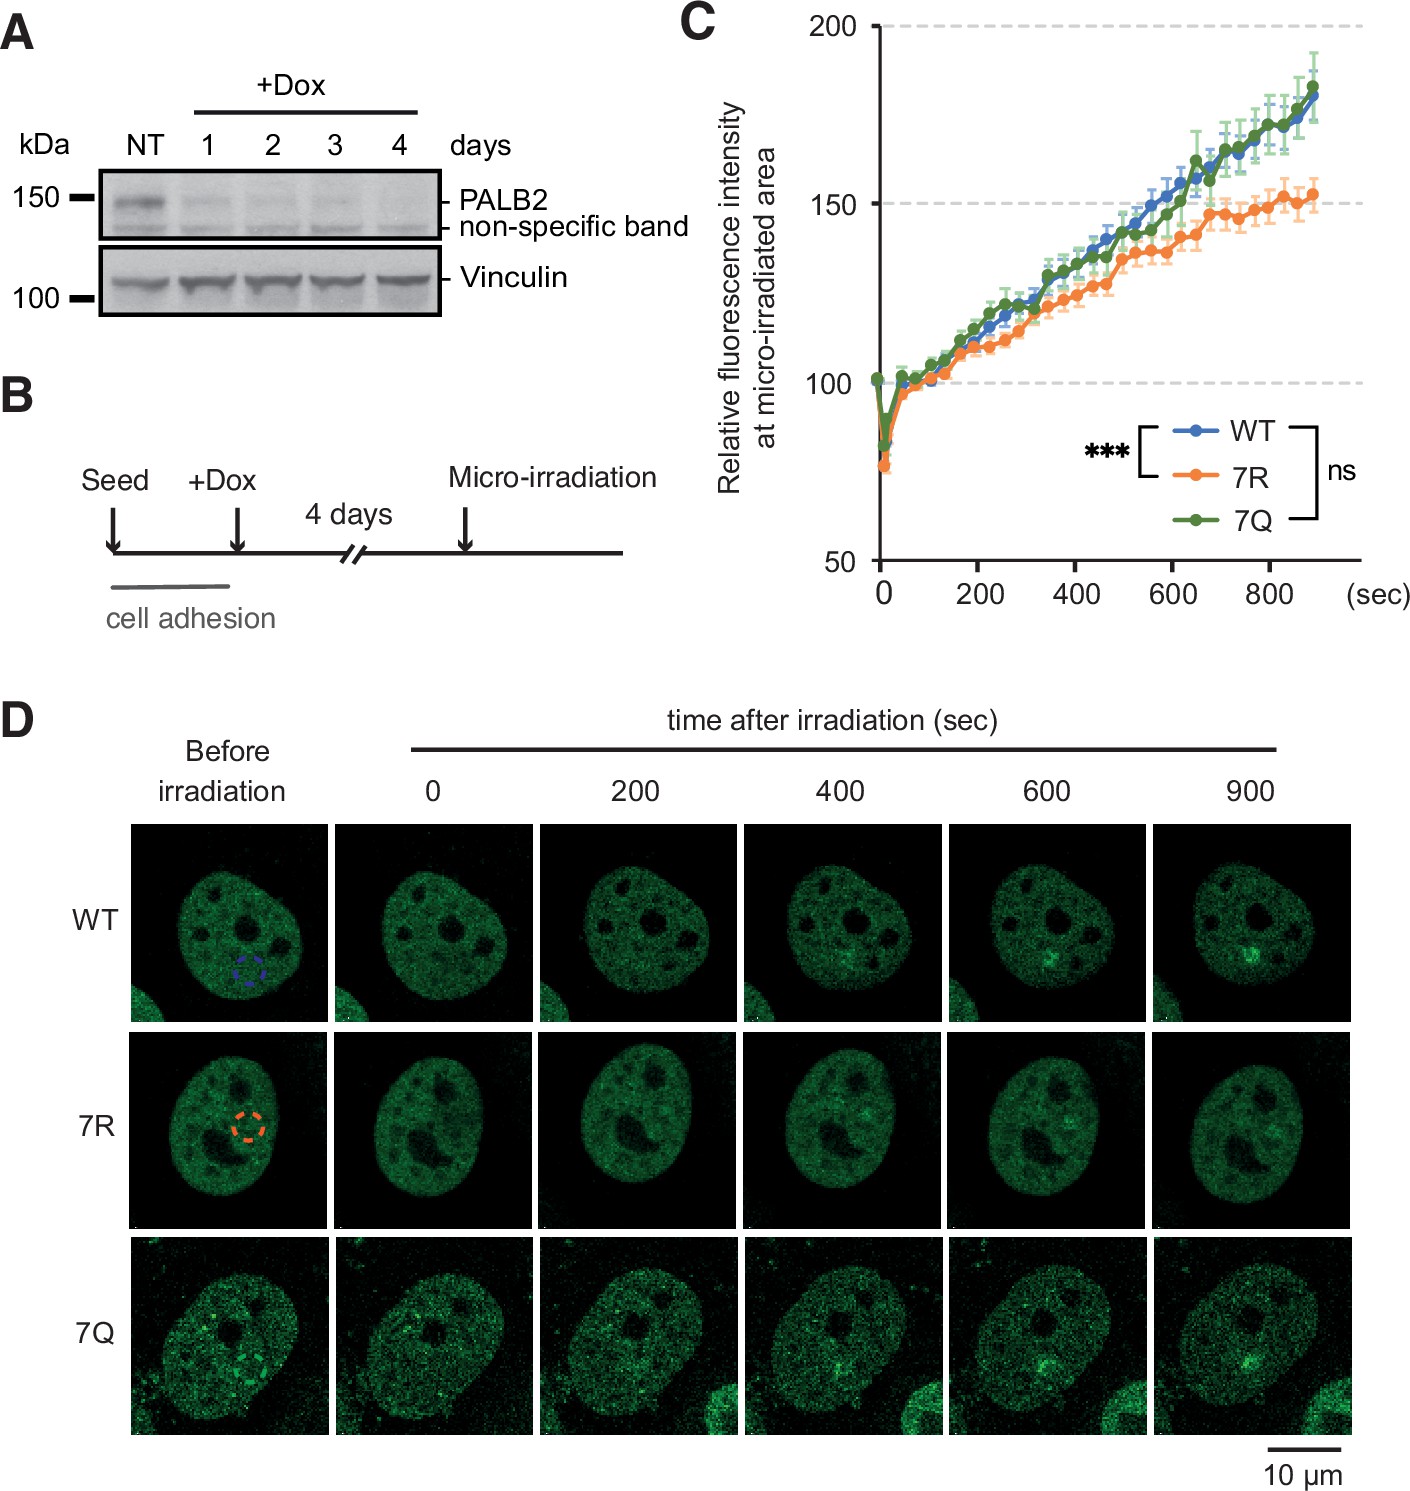
ChAM 7K-patch affect PALB2 localisation upon micro-irradiation.
(A) Depletion of endogenous PALB2 in the U2OS-shPALB2 cell line following the exposure to doxycycline over 4 days. Vinculin was used as a loading control. (B) Diagrams of experimental procedures, assessing the recruitment of PALB2 upon micro-irradiation following depletion of endogenous PALB2 with 4 days of doxycycline exposure. (C) Time plots of fluorescence intensity of FE-PALB2 at laser damage sites relative to an unirradiated area. Data represent the mean of relative fluorescence intensity ± SEM from four independent experiments (a total of at least n=100 cells per condition). Statistical analysis was done for the last time-point using GraphPad Prism 8 and p-values are for the Mann–Whitney test (ns, not significant; ***p<0.001). (D) Representative images of FE-PALB2 variants conditionally expressed in U2OS-shPALB2 cells upon micro-irradiation. Dashed circles indicate irradiated areas.
-
Figure 6—source data 1
Original images for Figure 6A.
- https://cdn.elifesciences.org/articles/57736/elife-57736-fig6-data1-v2.pdf
-
Figure 6—source data 2
Numerical data for Figure 6B.
- https://cdn.elifesciences.org/articles/57736/elife-57736-fig6-data2-v2.xlsx
Figure 6—figure supplement 1
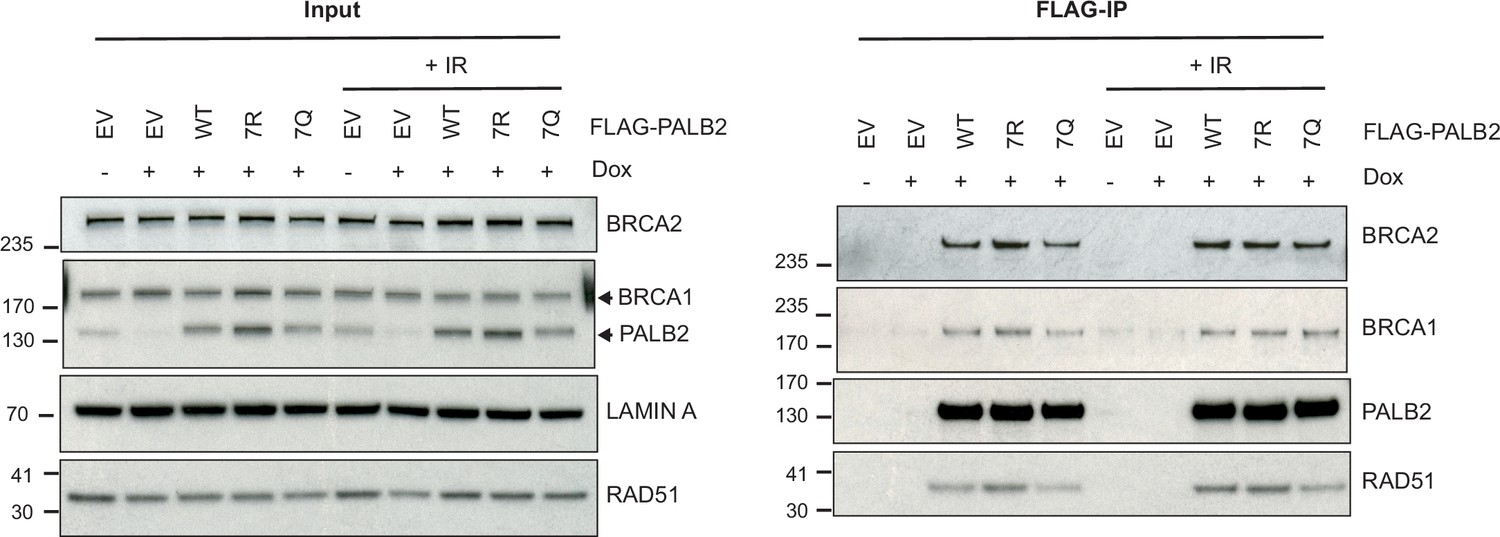
PALB2 7K-patch does not affect its interaction with canonical binding partners.
Immunoprecipitation (IP) analysis of U2OS-shPALB2 cells constitutively expressing FLAG (EV) or FLAG-PALB2 variants. Where indicated, cells were treated with 2 µg/mL doxycycline (+Dox) to deplete endogenous PALB2 and subsequently exposed to 4 Gy IR. Following 3 hr of recovery, cells were subjected to IP against FLAG. Associated proteins were detected by western blotting.
-
Figure 6—figure supplement 1—source data 1
Original images for Figure 6—figure supplement 1, FLAG-IP.
- https://cdn.elifesciences.org/articles/57736/elife-57736-fig6-figsupp1-data1-v2.pdf
-
Figure 6—figure supplement 1—source data 2
Original images for Figure 6—figure supplement 1, input.
- https://cdn.elifesciences.org/articles/57736/elife-57736-fig6-figsupp1-data2-v2.pdf
Figure 7
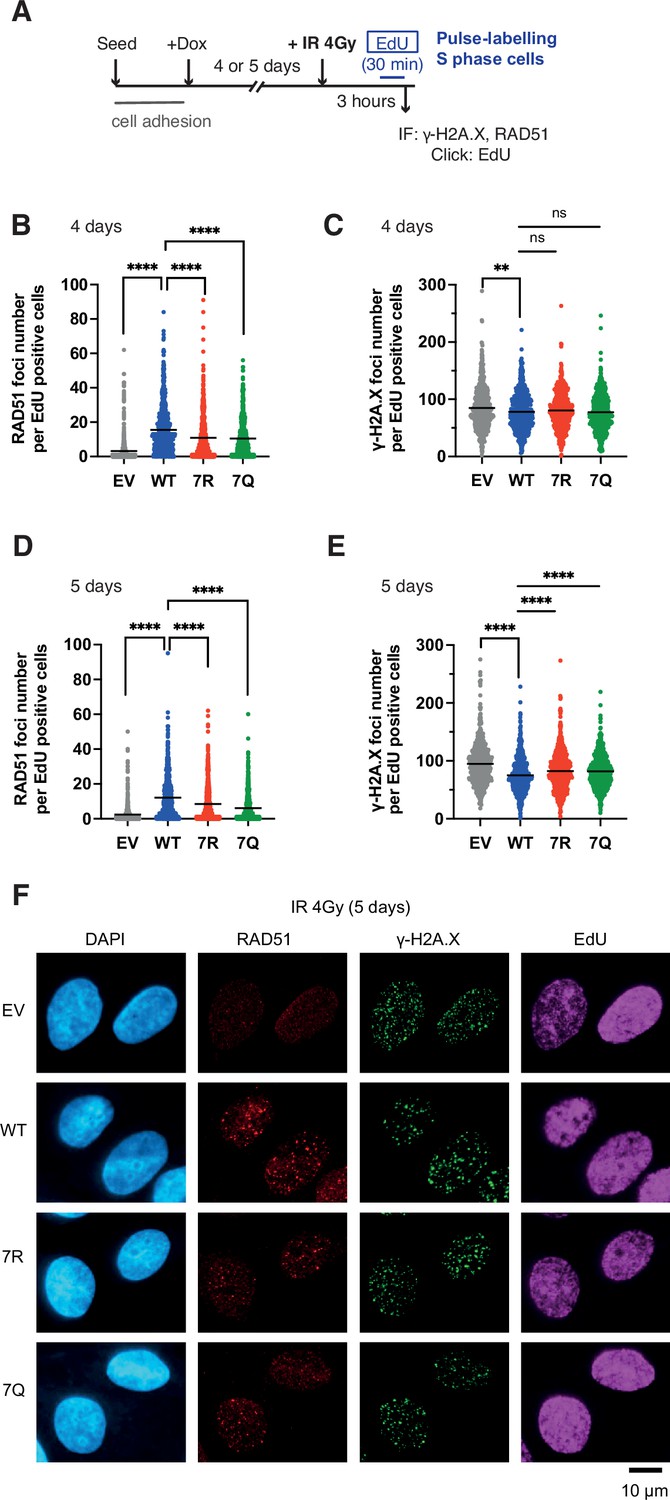
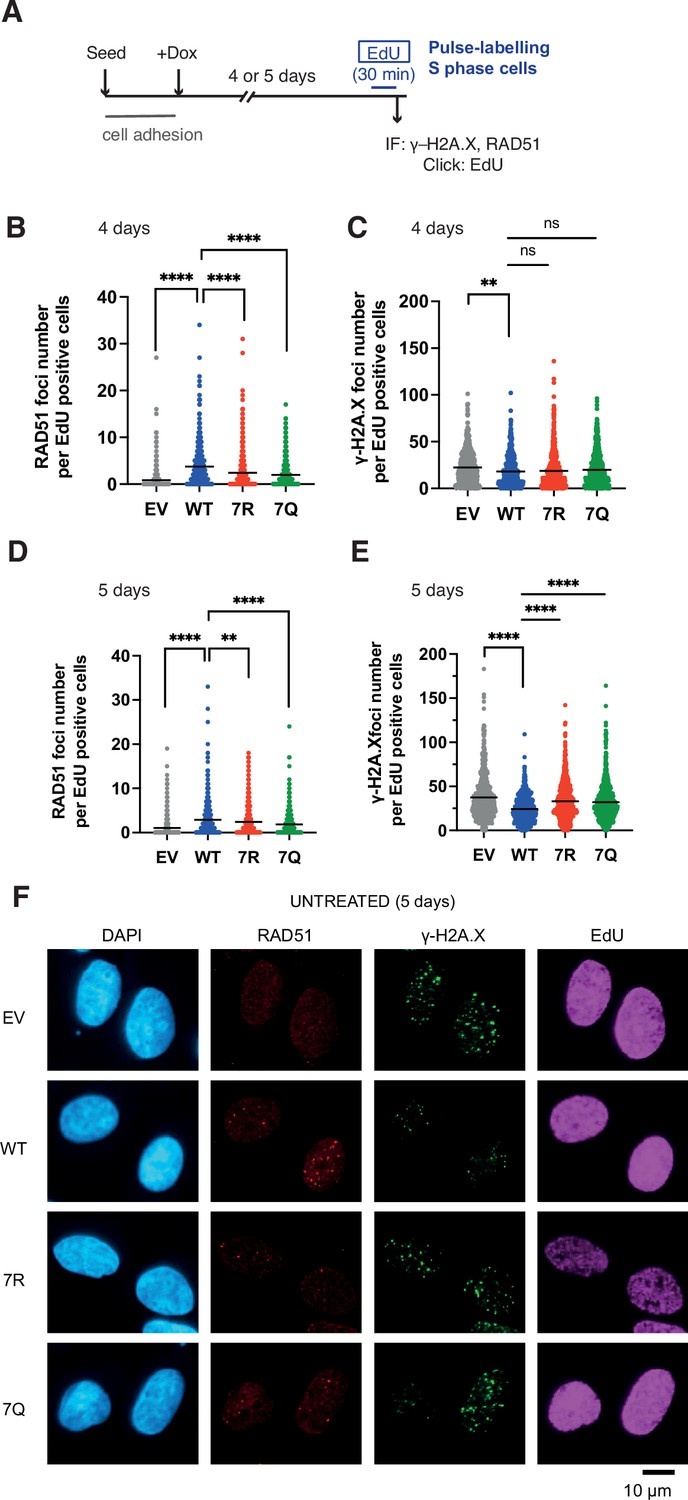
7K-patch-mediated PALB2 chromatin association affects IR-induced RAD51 foci formation.
(A) Diagrams of experimental procedures, assessing RAD51 in S phase cells, marked by EdU pulse labelling. (B-C) Quantification of the number of RAD51 foci (B) or γ-H2A.X foci (C) per cell, upon doxycycline exposure for 4 days and subsequently exposed to 4 Gy IR. Dots represent values for individual cells and bars mean values from three independent experiments (a total of n=600 cells per condition). Statistical analyses were performed using GraphPad Prism 8 and p-values are for the Mann–Whitney test (ns, not significant; **p<0.01; ****p<0.0001). (D-E) Quantification of the number of RAD51 foci (D) or γ-H2A.X foci (E) per cell, upon doxycycline exposure for 5 days. Dots represent values for individual cells and bars mean values from three independent experiments (a total of n=600 cells per condition). Statistical analyses were performed using GraphPad Prism 8 and p-values are for the Mann–Whitney test (****p<0.0001). (F) Representative images of RAD51 and γ-H2A.X foci in U2OS-shPALB2 cells stably expressing FLAG (EV) and FLAG-PALB2 variants, following doxycycline-induced endogenous PALB2 depletion for 5 days and subsequently exposed to 4 Gy IR. DAPI was used for nuclear staining.
-
Figure 7—source data 1
Numerical data for Figure 7C, D, E and F.
- https://cdn.elifesciences.org/articles/57736/elife-57736-fig7-data1-v2.xlsx
Figure 8
7K-patch-mediated PALB2 chromatin association affects spontaneous RAD51 foci formation in normally growing cells.
(A) Diagrams of experimental procedures, assessing RAD51 in S phase cells, marked by EdU pulse labelling. (B-C) Quantification of the number of RAD51 foci (B) or γ-H2A.X foci (C) per cell, upon doxycycline exposure for 4 days. Dots represent values for individual cells and bars mean values from three independent experiments (a total of n=600 cells per condition). Statistical analyses were performed using GraphPad Prism 8 and p-values are for the Mann–Whitney test (ns, not significant; **p<0.01; ****p<0.0001) (D-E) Quantification of the number of RAD51 foci (E) or γ-H2A.X foci (F) per cell, upon doxycycline exposure for 5 days. Dots represent values for individual cells and bars mean values from three independent experiments (a total of n=600 cells per condition). Statistical analyses were performed using GraphPad Prism 8 and p-values are for the Mann–Whitney test (****P<0.0001). (F) Representative images of RAD51 and γ-H2A.X foci in U2OS-shPALB2 cells stably expressing FLAG (EV) and FLAG-PALB2 variants, following doxycycline-induced endogenous PALB2 depletion for 5 days. DAPI was used for nuclear staining.
-
Figure 8—source data 1
Numerical data for Figure 8C, D, E and F.
- https://cdn.elifesciences.org/articles/57736/elife-57736-fig8-data1-v2.xlsx
Figure 9 with 1 supplement
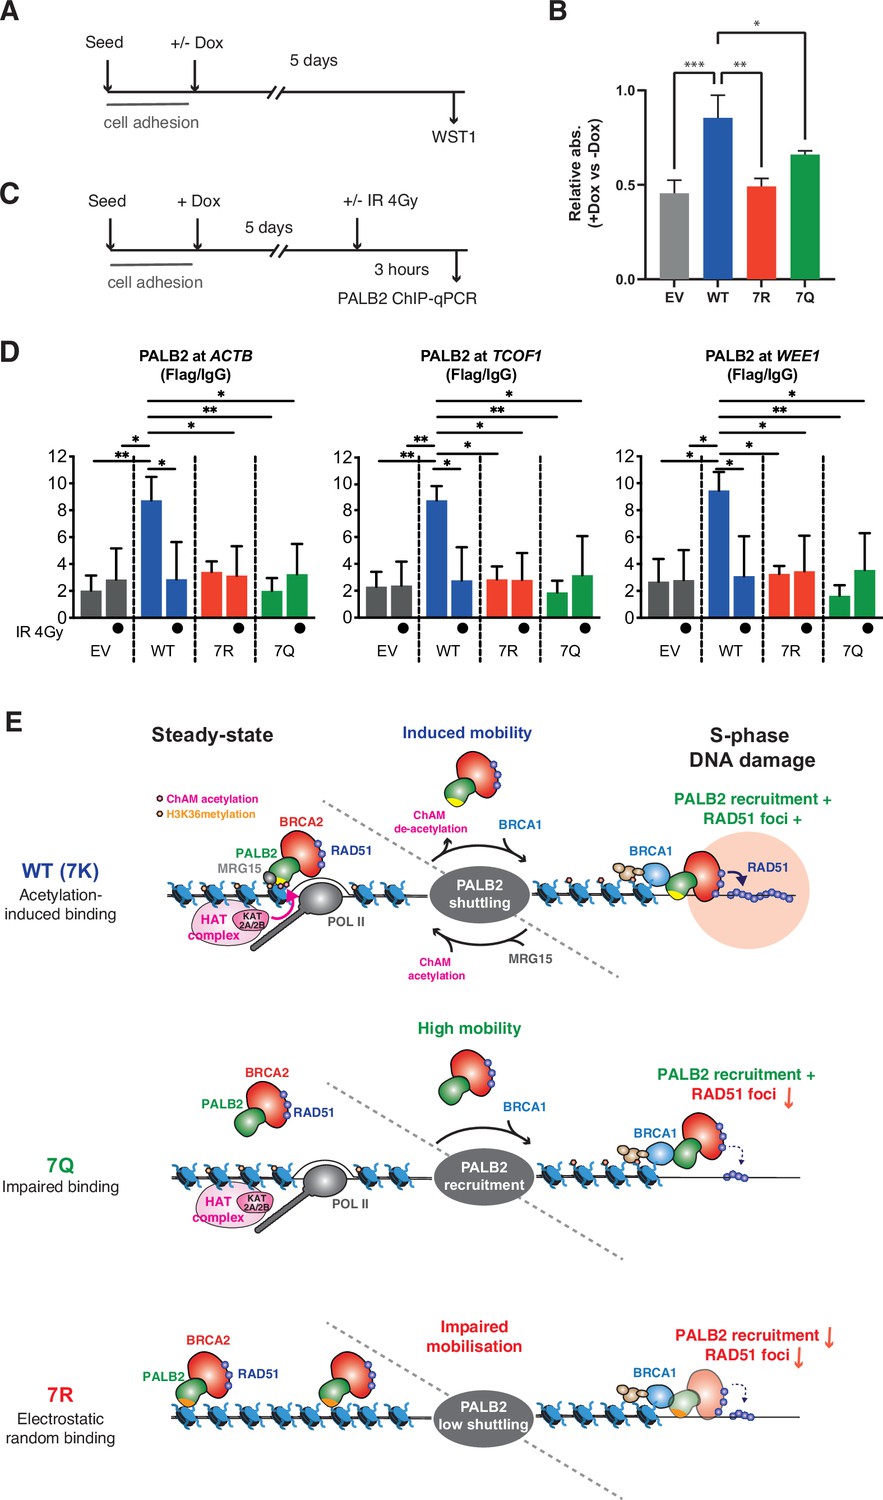
7K-patch is important for normal cell survival.
(A) Diagrams of experimental procedures, assessing survival of U2OS-shPALB2 stably expressing FLAG (EV) or FLAG-PALB2 variants upon doxycycline (Dox)-induced endogenous PALB2 depletion by WST-1 assay. (B) Cellular survival normalised against those without doxycycline exposure. Data represent mean values ± SD from three independent experiments (n=3). Statistical analyses were performed using GraphPad Prism 9 and p-values are the unpaired one-way ANOVA (*p<0.05; **p<0.01; ***p<0.001). (C) Diagrams of experimental procedures, assessing the FLAG-PALB2 fusion enrichment at previously reported PALB2-bound loci by ChIP-qPCR. (D) ChIP-qPCR analysis of FLAG-PALB2 WT, 7Q and 7R enrichment at known PALB2-bound loci (Bleuyard et al., 2017a), namely the coding regions of the ACTB, TCOF1, and WEE1 genes, in cells untreated or treated with 4 Gy IR. Data are expressed as fold enrichment over IgG and represent mean values ± SD from three independent experiments (n=3) with triplicate qPCR reactions. Statistical analyses were performed using GraphPad Prism 8 and p-values are from two-way ANOVA with Tukey’s multiple comparisons test (*p<0.05; **p<0.01). (E) Model for PALB2 acetylation function in the maintenance of genome stability. MRG15 and KAT2A/2B-mediated ChAM acetylation, which occurs locally at active genes, jointly promote PALB2 enrichment at undamaged transcriptionally active chromatin. DNA damage triggers ChAM deacetylation at these loci and temporarily releases PALB2 from chromatin. This allows PALB2 to interact with damage sensors, such as BRCA1, which in turn recruits the entire HR complex to sites of DNA damage. ChAM binding to naked DNA through the deacetylated 7K-patch may promote RAD51 loading and HR repair. The constitutively highly mobile PALB2 variant (7Q) is efficiently recruited to sites of DNA damage but, unlike WT PALB2, unable to promote efficient RAD51 foci formation. The randomly chromatin-bound and less capably mobilised PALB2 variant (7R) is inefficiently recruited to sites of DNA damage and hence fails to promote HR.
-
Figure 9—source data 1
Numerical data for Figure 9B.
- https://cdn.elifesciences.org/articles/57736/elife-57736-fig9-data1-v2.xlsx
-
Figure 9—source data 2
Numerical data for Figure 9D.
- https://cdn.elifesciences.org/articles/57736/elife-57736-fig9-data2-v2.xlsx
Figure 9—figure supplement 1
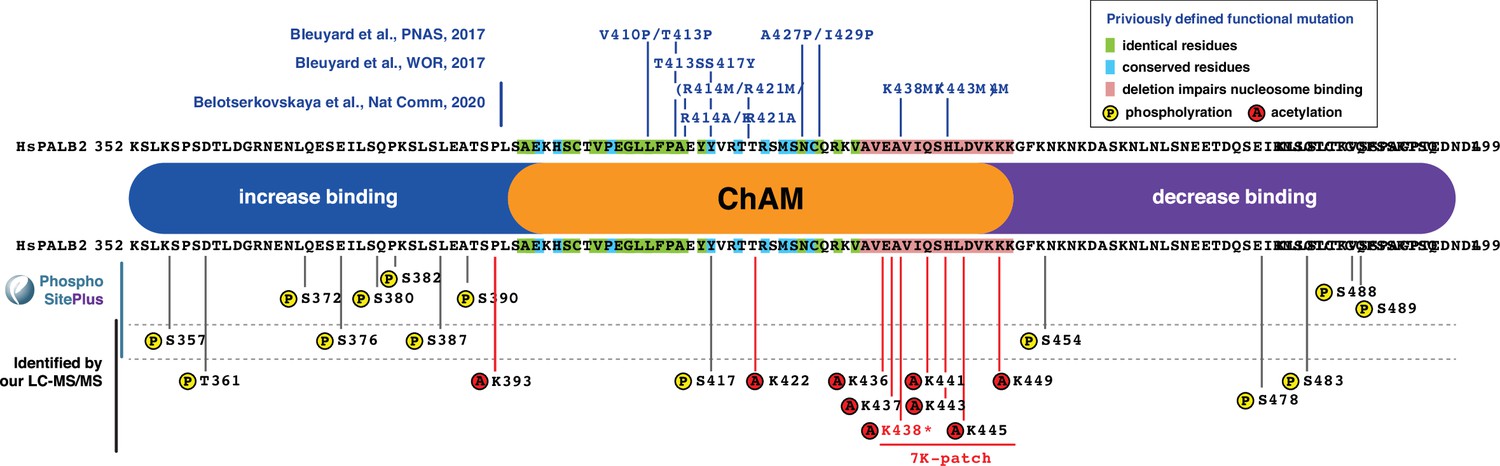
Summary of ChAM properties and post-translational modifications.
Residues targeted for phosphorylation and acetylation within ChAM and its vicinity are indicated below the depiction of the ChAM domain. Previously identified point mutations which impaired ChAM interaction with nucleosomes are shown above the depiction of the ChAM domain.
Author response image 1
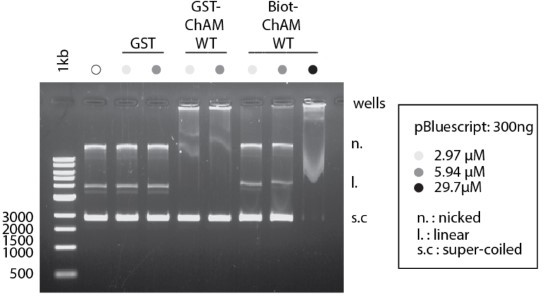
ChAM binding to DNA is dose Dependent.
Indicated concentration of recombinant GST-ChAM and synthetic ChAM were incubated with 300 ng of pBluescript, and DNA-binding was assessed by EMSA. Binding to DNA was not detectable with up to 300 nM ChAM in our previous study (Bleuyard et al., 2012, EMBO Rep).
Author response image 2
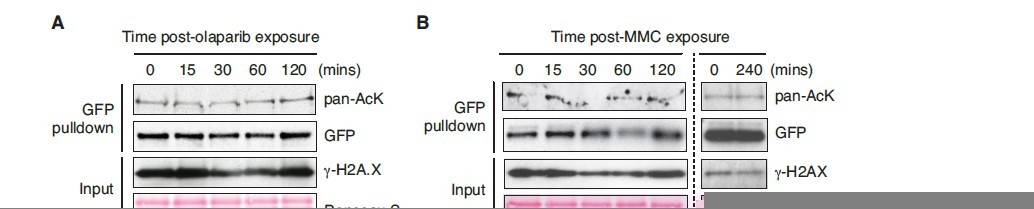
ChAM acetylation upon DNA damage treatment.
HEK293T cells transiently expressing GFP-tagged ChAM were treated with (A) 2.5μM olaparib and collected after 0, 15, 30, 60 or 120min of treatment and (B) 1mM mitomycin C (MMC) and collected after 0, 15, 30, 60, 120 or 240min of treatment. In both conditions, affinity-purified GFP-ChAM acetylation was assessed using anti-GFP and anti-acetyl-lysine (pan-AcK) antibodies. γ-H2AX signal in whole cell lysate (input) was detected to monitor DNA damage.
Tables
Table 1
List of oligonucleotides used in this study.
| Name | Sequence | No. |
|---|---|---|
| PALB2-F1_fo1 | 5’-atggatccatggacgagcctccc-3’ | 1 |
| PALB2-F1_re1 | 5’-atgcggccgcattagaacttgtgggcag-3’ | 2 |
| PALB2-F2_fo1 | 5’-atggatccgcacaaggcaaaaaaatg-3’ | 3 |
| PALB2-F2_re1 | 5’-atgcggccgctgtgatactgagaaaagac-3’ | 4 |
| PALB2-F3_fo1 | 5’-atggatccttatccttggatgatgatg-3’ | 5 |
| PALB2-F3_re1 | 5’-atgcggccgcagctttccaaagagaaac-3’ | 6 |
| PALB2-F4_fo1 | 5’-atggatcctgttccgtagatgtgag-3’ | 7 |
| PALB2-F4_re1 | 5’-atgcggccgcttatgaatagtggtatacaaat-3’ | 8 |
| PALB2_395_Fo | 5’- actggatcctcttgcacagtgcctg-3’ | 9 |
| PALB2_353_Fo | 5’- actggatccaaatctttaaaatctcccagtg-3’ | 10 |
| PALB2_450_Re | 5’- tatctcgagttaatttttacttgcatccttattttta-3’ | 11 |
| PALB2_433_Re | 5’- tatctcgagttacaaatgactctgaatgacagc-3’ | 12 |
| PALB2_499_Re | 5’- tatctcgagttacaagtcattatcttcagtggg-3’ | 13 |
| Patch 1-K-Rev | 5’-tcagagtcatttggatgtcaagaaaaaaggttt-3’ | 14 |
| Patch 2-WT-Fwd | 5’-aaaaataaaaataaggatgcaagtaaaaat-3 | 15 |
| Patch 1-R-Rev | 5’-tcagagtcatttggatgtcaggagaagagggttt-3’ | 16 |
| Patch 2-R-Fwd_FL | 5’-agaaatagaaatagggatgcaagtagaaatttaaacctttccaat-3’ | 17 |
| Patch 1-Q-Rev | 5’-tcagagtcatttggatgtccagcaacaaggttt-3’ | 18 |
| Patch 2-Q-Fwd_FL | 5’-caaaatcaaaatcaggatgcaagtcaaaatttaaacctttccaat-3’ | 19 |
| Patch 2-Q-Fwd_ChAM | 5’-caaaatcaaaatcaggatgcaagtcaaaattgagcggccgcact-3’ | 20 |
| Beta-Actin_in3-fo | 5’-taacactggctcgtgtgacaa-3’ | 21 |
| Beta-Actin_in3-re | 5’-aagtgcaaagaacacggctaa-3’ | 22 |
| Chr5_TCOF1_peak2_fo | 5’-ctacccgatccctcaggtca-3’ | 23 |
| Chr5_TCOF1_peak2_re | 5’-tcagggctctatgaggggac-3’ | 24 |
| Chr11_WEE1_mid_fo | 5’-ggccgaggcttgaggtatatt-3’ | 25 |
| Chr11_WEE1_mid_re | 5’-ataaccccaaagaacacaggtca-3’ | 26 |
Appendix 1—key resources table
| Reagent type (species) or resource | Designation | Source or reference | Identifiers | Additional information |
|---|---|---|---|---|
| Strain, strain background (Escherichia coli) | ArticExpress (DE3) | Agilent Technologies | ||
| Cell line (Homo-sapiens) | HEK293T | ATCC | ||
| Cell line (Homo-sapiens) | U2OS Flp-In T-REx | Prof. Daniel Durocher (Lunenfeld-Tanenbaum Research Institute) | ||
| Cell line (Homo-sapiens) | U2OS Flp-In T-REx FE-PALB2-WT | This study | U2OS Flp-In T-REx harbouring inducible Flag-EGFP-PALB2 WT | |
| Cell line (Homo-sapiens) | U2OS Flp-In T-REx FE-PALB2-ΔChAM | This study | U2OS Flp-In T-REx harbouring inducible Flag-EGFP-PALB2 ΔChAM | |
| Cell line (Homo-sapiens) | U2OS Flp-In T-REx P2shRNA | Bleuyard et al., 2017b | U2OS Flp-In T-REx harbouring inducible shRNA targeting endogenous PALB2 | |
| Cell line (Homo-sapiens) | U2OS Flp-In T-REx P2shRNA-EV | Bleuyard et al., 2017b | U2OS Flp-In T-REx P2shRNA cells, complemented with empty vector (EV) | |
| Cell line (Homo-sapiens) | U2OS Flp-In T-REx P2shRNA-FLAG-PALB2 | Bleuyard et al., 2017b | U2OS Flp-In T-REx P2shRNA cells, complemented with 3xFLAG-PALB2 | |
| Cell line (Homo-sapiens) | U2OS Flp-In T-REx P2shRNA-FLAG-PALB2 7Q | This paper | U2OS Flp-In T-REx P2shRNA cells, complemented with 3xFLAG-PALB2-7Q | |
| Cell line (Homo-sapiens) | U2OS Flp-In T-REx P2shRNA-FLAG-PALB2-7R | This paper | U2OS Flp-In T-REx P2shRNA cells, complemented with 3xFLAG-PALB2-7R | |
| Cell line (Homo-sapiens) | U2OS Flp-In T-REx P2shRNA- FE-PALB2-WT | This paper | U2OS Flp-In T-REx P2shRNA cells complemented with inducible Flag-EGFP-PALB2 WT | |
| Cell line (Homo-sapiens) | U2OS Flp-In T-REx P2shRNA- FE-PALB2-7Q | This paper | U2OS Flp-In T-REx P2shRNA cells complemented with inducible Flag-EGFP-PALB2-7Q | |
| Cell line (Homo-sapiens) | U2OS Flp-In T-REx P2shRNA- FE-PALB2-7R | This paper | U2OS Flp-In T-REx P2shRNA cells complemented with inducible Flag-EGFP-PALB2-7R | |
| Antibody | anti-FLAG (Mouse monoclonal) | Sigma | Cat# F1804 | WB (1:1000) ChIP (10 μg per sample) |
| Antibody | Control IgG (Mouse monoclonal) | Jackson Immunoresearch | 015-000-003 | WB (1:1000) ChIP (10 μg per sample) |
| Antibody | anti-pan-acetyl-lysine (Rabbit polyclonal) | Cell signalling Technology | Cat# 9441 S | WB (1:1000) |
| Antibody | anti-PALB2 (Rabbit polyclonal) | Bethyl | Cat# A301-246A | WB (1:500) |
| Antibody | anti-PALB2 (Rabbit polyclonal) | Rodrigue et al., 2019 | WB (1:5000) | |
| Antibody | anti-BRCA2 (Mouse monoclonal) | Millipore | Cat# OP95 | WB (1:1000) |
| Antibody | anti-RAD51 (Rabbit polyclonal) | Yata et al., 2014 | 7946 | WB (1:5000) |
| Antibody | anti-RAD51 (Rabbit polyclonal) | BioAcademia | 70–001 | IF (1/1000) |
| Antibody | anti-lamin A (Rabbit polyclonal) | Sigma | L1293 | WB (1:2000) |
| Antibody | anti-vinculin (Rabbit polyclonal) | Sigma | V9131 | WB (1:200000) |
| Antibody | anti-gamma H2AX (Mouse monoclonal) | Millipore | 05–636 | WB (1:1000) IF (1:2000) |
| Antibody | anti-MRG15 (Rabbit polyclonal) | Cell signalling Technology | Cat# D2Y4 | WB (1:1000) |
| Antibody | anti-BRCA1 (Mouse monoclonal) | Sigma | Cat# OP107 | WB (1:1000) |
| Antibody | anti-GST (Mouse monoclonal) | Santa Cruz Biotechnology | Cat# sc-138 | WB (1:1000) |
| Antibody | anti-biotin coupled with horseradish peroxidase (HRP) (Mouse monoclonal) | Sigma | Cat# A0185 | WB (1:1000) |
| Antibody | anti-KAT2A/GCN5 (Mouse monoclonal) | Cell signalling Technology | Cat# 3305 | WB (1:1000) |
| Antibody | anti-alpha-tubulin (Mouse monoclonal) | Cell signalling Technology | Cat# 3873 | WB (1:2000) |
| Antibody | Secondary antibody coupled with horseradish peroxidase (HRP) / Goat anti-mouse (Goat polyclonal) | Dako | Cat# P0447 | WB (1:1000) |
| Antibody | Secondary antibody coupled with horseradish peroxidase (HRP) / Goat anti-rabbit (Goat polyclonal) | Dako | Cat# P0448 | WB (1:1000) |
| Antibody | Secondary antibody coupled with horseradish peroxidase (HRP) / Goat anti-mouse (Goat polyclonal) | Jackson ImmunoResearch | 515-035-062 | WB (1: 20000) |
| Antibody | Secondary antibody coupled with horseradish peroxidase (HRP) / Goat anti-rabbit (Goat polyclonal) | Jackson ImmunoResearch | 111-035-144 | WB (1: 20000) |
| Antibody | Secondary antibody coupled with Alexa Fluor/ Goat anti-mouse (Goat polyclonal) | invitrogen | A-11001 | IF (1/1000) |
| Antibody | Secondary antibody coupled with Alexa Fluor/ Goat anti-mouse (Goat polyclonal) | invitrogen | A-11017 | IF (1/400) |
| Antibody | Secondary antibody coupled with Alexa Fluor/ Goat anti-rabbit (Goat polyclonal) | invitrogen | A-11011 | IF (1/1000) |
| Chemical compound, drug | sodium butyrate (NaB) | Sigma | 303410 | |
| Chemical compound, drug | Trichostatin (TSA) | Sigma | T8552 | |
| Chemical compound, drug | WST-1 reagent | Merck Life Sciences Uk Limited | 5015944001 | |
| Sequence-based reagent | siRNA: nontargeting control | Dharmacon | D001810-10-05 | 50 pmole |
| Sequence-based reagent | siRNA: targeting KAT2A | Dharmacon | L-009722-02-0005 | 50 pmole |
| sequence-based reagent | siRNA: targeting KAT2B | Dharmacon | L-005055-00-0005 | 50 pmole |
| Recombinant DNA reagent | pcDNA5/FRT-GW/N3×FLAG | Bleuyard et al., 2017b | ||
| Recombinant DNA reagent | pENTR3C | Invitrogen | ||
| Recombinant DNA reagent | pcDNA-DEST53 | Invitrogen | ||
| Recombinant DNA reagent | pCMV-SPORT6-PALB2 | Source BioSciences | IMAGE clone 6045564 | |
| Recombinant DNA reagent | pGEX-6P-1 | GE Healthcare | GST expression in bacteria cells | |
| Recombinant DNA reagent | pGEX-6P-1_PALB2 | This paper | GST-PALB2 full length expression in bacteria cells | |
| Recombinant DNA reagent | pGEX-6P-1_PALB2_Fr1 | This paper | GST-PALB2 fragment 1 (1-320) expression in bacteria cells | |
| Recombinant DNA reagent | pGEX-6P-1_PALB2_Fr2 | This paper | GST-PALB2 fragment 2 (295-610) expression in bacteria cells | |
| Recombinant DNA reagent | pGEX-6P-1_PALB2_Fr3 | This paper | GST-PALB2 fragment 3 (580-900) expression in bacteria cells | |
| Recombinant DNA reagent | pGEX-6P-1_PALB2_Fr4 | This paper | GST-PALB2 fragment 4 (867–1186) expression in bacteria cells | |
| Recombinant DNA reagent | pOG44 | Invitrogen | ||
| Recombinant DNA reagent | pENTR3C-ChAM #1 | This paper | ChAM #1 (395-450) in the gateway entry vector | |
| Recombinant DNA reagent | pENTR3C- ChAM #2 | This paper | ChAM #2 (395-433) in the gateway entry vector | |
| Recombinant DNA reagent | pENTR3C- ChAM #3 | This paper | ChAM #3 (353-433) in the gateway entry vector | |
| Recombinant DNA reagent | pENTR3C- ChAM #4 | This paper | ChAM #4 (353-450) in the gateway entry vector | |
| Recombinant DNA reagent | pENTR3C- ChAM #5 | This paper | ChAM #5 (353-499) in the gateway entry vector | |
| Recombinant DNA reagent | pENTR3C-PALB2 | Bleuyard et al., 2017b | Full length PALB2 in the gateway entry vector | |
| Recombinant DNA reagent | pENTR3C-PALB2-7Q | This paper | Full length PALB2-7Q in the gateway entry vector | |
| Recombinant DNA reagent | pENTR3C-PALB2-7R | This paper | Full length PALB2-7R in the gateway entry vector | |
| Recombinant DNA reagent | pcDNA-DEST53- ChAM #1 | This paper | GFP-ChAM #1 (395-450) expression in mammalian cells | |
| Recombinant DNA reagent | pcDNA-DEST53- ChAM #2 | This paper | GFP-ChAM #2 (395-433) expression in mammalian cells | |
| Recombinant DNA reagent | pcDNA-DEST53- ChAM #3 | This paper | GFP-ChAM #3 (353-433) expression in mammalian cells | |
| Recombinant DNA reagent | pcDNA-DEST53- ChAM #4 | This paper | GFP-ChAM #4 (353-450) expression in mammalian cells | |
| Recombinant DNA reagent | pcDNA-DEST53- ChAM #5 | This paper | GFP-ChAM #5 (353-499) expression in mammalian cells | |
| Recombinant DNA reagent | pGEX4T3 | GE Healthcare | GST expression in bacteria cells | |
| Recombinant DNA reagent | pGEX4T3-ChAM | Bleuyard et al., 2012 | GST-ChAM WT expression in bacteria cells | |
| Recombinant DNA reagent | pGEX4T3-ChAM-3Q4K | This paper | GST-ChAM-3Q4K expression in bacteria cells | |
| Recombinant DNA reagent | pGEX4T3-ChAM-3K4Q | This paper | GST-ChAM-3K4Q expression in bacteria cells | |
| Recombinant DNA reagent | pGEX4T3-ChAM-7Q | This paper | GST-ChAM-7Q expression in bacteria cells | |
| Recombinant DNA reagent | pGEX4T3-ChAM-3R4K | This paper | GST-ChAM-3R4K expression in bacteria cells | |
| Recombinant DNA reagent | pcDNA5/FRT-GW/N3×FLAG-PALB2 | Bleuyard et al., 2017b | Constitutive 3xFlag- PALB2 expression in mammalian cells | |
| Recombinant DNA reagent | pcDNA5/FRT-GW/N3×FLAG-PALB2-7Q | This study | Constitutive 3xFlag- PALB2 7Q expression in mammalian cells | |
| Recombinant DNA reagent | pcDNA5/FRT-GW/N3×FLAG-PALB2-7R | This study | Constitutive 3xFlag- PALB2 7R expression in mammalian cells | |
| Recombinant DNA reagent | pcDNA5/FRT/TO/FE-PALB2 | Bleuyard et al., 2012 | Inducible Flag-EGFP-PALB2 fusion expression in mammalian cells | |
| Recombinant DNA reagent | pcDNA5/FRT/TO/FE-PALB2 7Q | This paper | Inducible Flag-EGFP-PALB2 7Q expression in mammalian cells | |
| Recombinant DNA reagent | pcDNA5/FRT/TO/FE-PALB2 7R | This paper | Inducible Flag-EGFP-PALB2 7R expression in mammalian cells | |
| Recombinant DNA reagent | pcDNA5/FRT/TO/FE-PALB2_ΔChAM | Bleuyard et al., 2012 | Inducible Flag-EGFP-PALB2 ΔChAM expression in mammalian cells | |
| Sequence-based reagent | PALB2-F1_fo1 | This paper | PCR primers | 5’-atggatccatggacgagcctccc-3’ |
| Sequence-based reagent | PALB2-F1_re1 | This paper | PCR primers | 5’-atgcggccgcattagaacttgtgggcag-3’ |
| Sequence-based reagent | PALB2-F2_fo1 | This paper | PCR primers | 5’-atggatccgcacaaggcaaaaaaatg-3’ |
| Sequence-based reagent | PALB2-F2_re1 | This paper | PCR primers | 5’-atgcggccgctgtgatactgagaaaagac-3’ |
| Sequence-based reagent | PALB2-F3_fo1 | This paper | PCR primers | 5’-atggatccttatccttggatgatgatg-3’ |
| Sequence-based reagent | PALB2-F3_re1 | This paper | PCR primers | 5’-atgcggccgcagctttccaaagagaaac-3’ |
| Sequence-based reagent | PALB2-F4_fo1 | This paper | PCR primers | 5’-atggatcctgttccgtagatgtgag-3’ |
| Sequence-based reagent | PALB2-F4_re1 | This paper | PCR primers | 5’-atgcggccgcttatgaatagtggtatacaaat-3’ |
| Sequence-based reagent | PALB2_395_Fo | This paper | PCR primers | 5’- actggatcctcttgcacagtgcctg-3’ |
| Sequence-based reagent | PALB2_353_Fo | This paper | PCR primers | 5’- actggatccaaatctttaaaatctcccagtg-3’ |
| Sequence-based reagent | PALB2_450_Re | This paper | PCR primers | 5’- tatctcgagttaatttttacttgcatccttattttta-3’ |
| Sequence-based reagent | PALB2_433_Re | This paper | PCR primers | 5’- tatctcgagttacaaatgactctgaatgacagc-3’ |
| Sequence-based reagent | PALB2_499_Re | This paper | PCR primers | 5’- tatctcgagttacaagtcattatcttcagtggg-3’ |
| Sequence-based reagent | Patch 1-K-Rev | This paper | PCR primers | 5’-tcagagtcatttggatgtcaagaaaaaaggttt-3’ |
| Sequence-based reagent | Patch 2-WT-Fwd | This paper | PCR primers | 5’-aaaaataaaaataaggatgcaagtaaaaat-3’ |
| Sequence-based reagent | Patch 1-R-Rev | This paper | PCR primers | 5’-tcagagtcatttggatgtcaggagaagagggttt-3’ |
| Sequence-based reagent | Patch 2-R-Fwd_FL | This paper | PCR primers | 5’-agaaatagaaatagggatgcaagtagaaatttaaacctttccaat-3’ |
| Sequence-based reagent | Patch 1-Q-Rev | This paper | PCR primers | 5’-tcagagtcatttggatgtccagcaacaaggttt-3’ |
| Sequence-based reagent | Patch 2-Q-Fwd_FL | This paper | PCR primers | 5’-caaaatcaaaatcaggatgcaagtcaaaatttaaacctttccaat-3’ |
| Sequence-based reagent | Patch 2-Q-Fwd_ChAM | This paper | PCR primers | 5’-caaaatcaaaatcaggatgcaagtcaaaattgagcggccgcact-3’ |
| Sequence-based reagent | Beta-Actin_in3-fo | This paper | PCR primers | 5’-taacactggctcgtgtgacaa-3’ |
| Sequence-based reagent | Beta-Actin_in3-re | This paper | PCR primers | 5’-aagtgcaaagaacacggctaa-3’ |
| Sequence-based reagent | Chr5_TCOF1_peak2_fo | This paper | PCR primers | 5’-ctacccgatccctcaggtca-3’ |
| Sequence-based reagent | Chr5_TCOF1_peak2_re | This paper | PCR primers | 5’-tcagggctctatgaggggac-3’ |
| Sequence-based reagent | Chr11_WEE1_mid_fo | This paper | PCR primers | 5’-ggccgaggcttgaggtatatt-3’ |
| Sequence-based reagent | Chr11_WEE1_mid_re | This paper | PCR primers | 5’-ataaccccaaagaacacaggtca-3’ |
| Peptide, recombinant protein | ChAM-WT | This paper | Francis Crick Institute Peptide Chemistry Technology Platform | AEKHSCTVPEGLLFPAEYYVRTTRSMSNCQRKVAVEAVIQSHLDVKKKGFKNKNKDASKN |
| Peptide, recombinant protein | ChAM-K436(Ac)-K437(Ac)-K438(Ac) | This paper | Francis Crick Institute Peptide Chemistry Technology Platform | AEKHSCTVPEGLLFPAEYYVRTTRSMSNCQRKVAVEAVIQSHLDVK(Ac)K(Ac)K(Ac)GFKNKNKDASKN |
| Peptide, recombinant protein | ChAM-K436(Ac) | This paper | Francis Crick Institute Peptide Chemistry Technology Platform | AEKHSCTVPEGLLFPAEYYVRTTRSMSNCQRKVAVEAVIQSHLDVK(Ac)KKGFKNKNKDASKN |
| Peptide, recombinant protein | ChAM-K437(Ac) | This paper | Francis Crick Institute Peptide Chemistry Technology Platform | AEKHSCTVPEGLLFPAEYYVRTTRSMSNCQRKVAVEAVIQSHLDVKK(Ac)KGFKNKNKDASKN |
| Peptide, recombinant protein | ChAM-K438(Ac) | This paper | Francis Crick Institute Peptide Chemistry Technology Platform | AEKHSCTVPEGLLFPAEYYVRTTRSMSNCQRKVAVEAVIQSHLDVKKK(Ac)GFKNKNKDASKN |
| Software, algorithm | Image J | https://imagej.nih.gov/ij/ | Schneider et al., 2012 | |
| Software, algorithm | Proteome Discoverer v1.4 | ThermoFischer Scientific | ||
| Software, algorithm | FlowJo software V10 | FlowJo | ||
| Commercial assay, kit | SensiFAST SYBR No-Rox kit | Bioline | BIO-98005 |
Additional files
Download links
A two-part list of links to download the article, or parts of the article, in various formats.
Downloads (link to download the article as PDF)
Open citations (links to open the citations from this article in various online reference manager services)
Cite this article (links to download the citations from this article in formats compatible with various reference manager tools)
KAT2-mediated acetylation switches the mode of PALB2 chromatin association to safeguard genome integrity
eLife 11:e57736.
https://doi.org/10.7554/eLife.57736


