The nucleosome DNA entry-exit site is important for transcription termination and prevention of pervasive transcription
- Department of Biological Sciences, University of Pittsburgh, United States
Figures
Figure 1
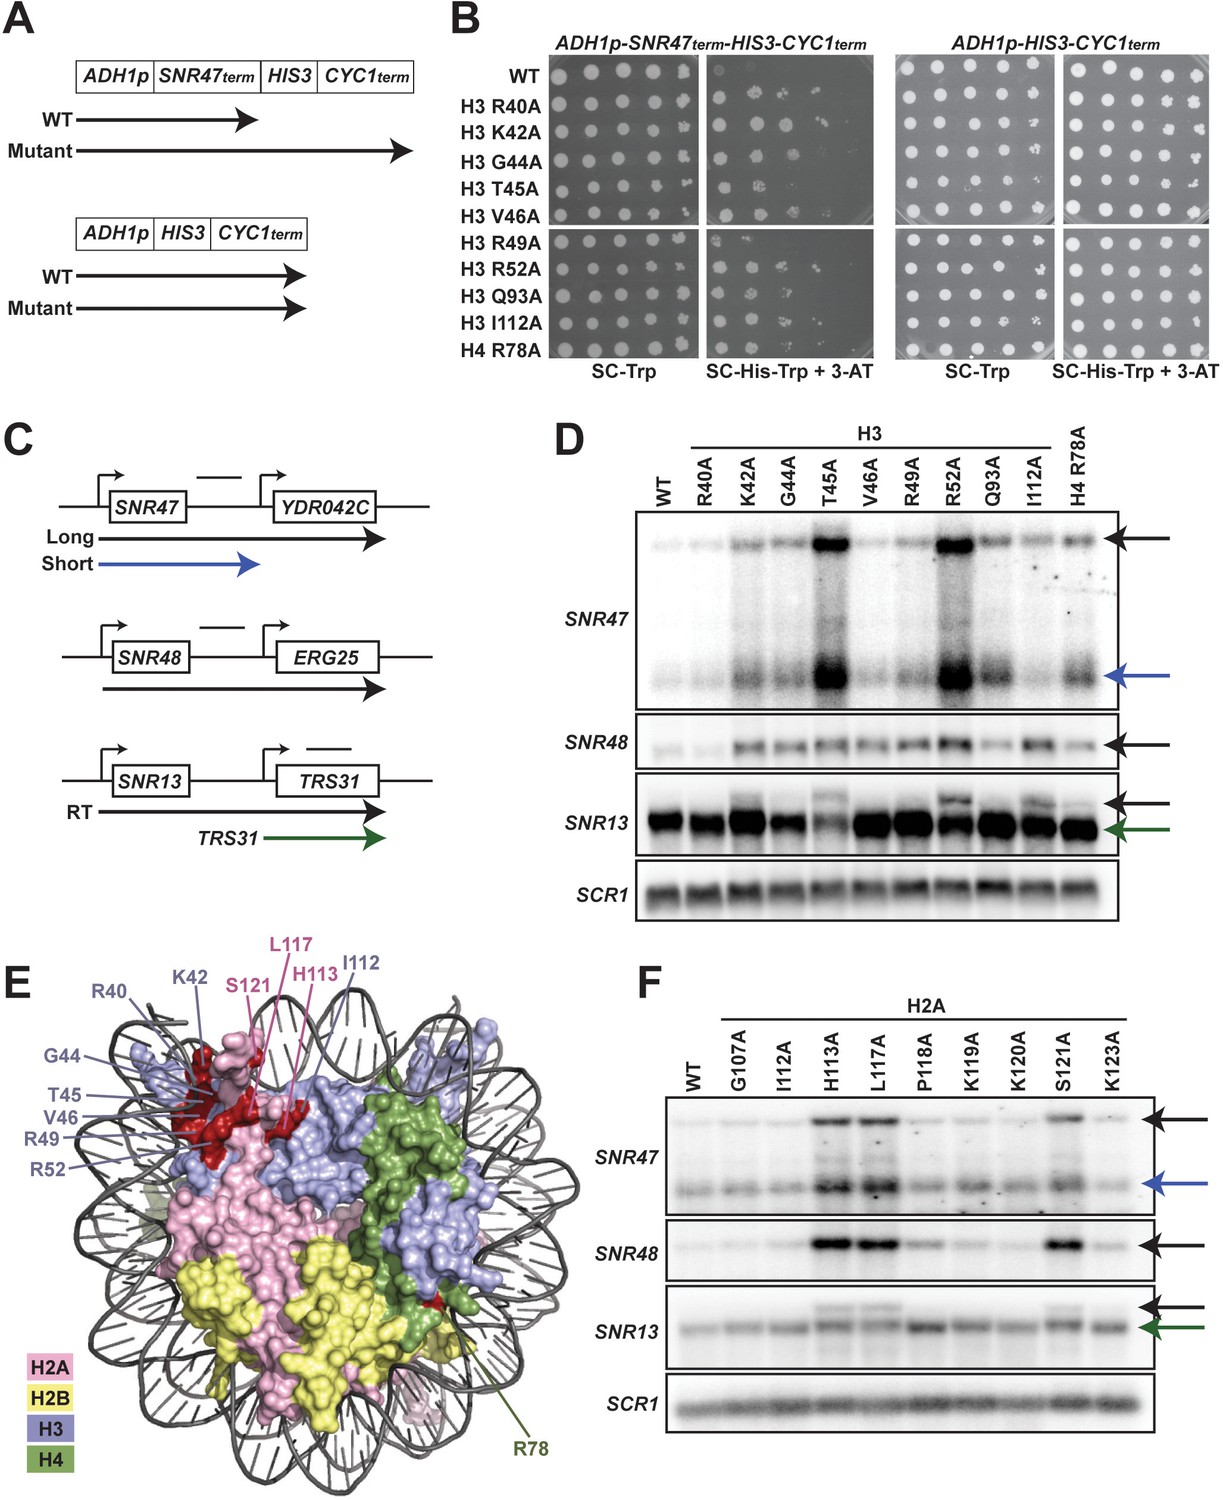
Histone residues in the DNA entry-exit site of the nucleosome are important for transcription termination.
(A) Yeast strains contain either an SNR47 transcription termination reporter (top, KY3220) or a control transcription cassette lacking the SNR47 terminator (bottom, KY3219) integrated at the LEU2 locus. Black arrows denote the transcripts produced from each reporter in wild type (WT) and termination mutant backgrounds. (B) Yeast dilution assays to monitor growth of strains expressing the indicated H3 and H4 derivatives as the only source of H3 or H4. Library plasmids (TRP1-marked, CEN/ARS) (Nakanishi et al., 2008) expressing the histone gene mutations were introduced by plasmid shuffling into strains expressing the SNR47 termination reporter (KY3220; left) or the reporter control (KY3219; right). For each strain, a 10-fold dilution series (starting at 1 × 10⁸ cells/mL) was plated to SC-Trp as a growth control and to SC-His-Trp + 0.5 mM 3-aminotriazole (3-AT), a competitive inhibitor of the HIS3 gene product, to identify mutants expressing the HIS3 gene. Plates were incubated at 30°C for 5 days. (C) Diagrams of three snoRNA loci analyzed for termination readthrough by northern analysis. The black bar over each locus denotes the probe position. The intergenic SNR47 probe detects two read-through transcripts, as indicated by the long black and short blue arrows. The intergenic SNR48 probe detects a single readthrough transcript. For SNR13, the probe overlaps the downstream gene, TRS31, and detects a readthrough transcript of SNR13 (black), as well as the full-length TRS31 transcript (green). (D, F) Northern blot analysis to assess transcription readthrough of SNR genes in (D) H3 and H4 mutants (plasmids shuffled into KY812) and (F) H2A mutants (plasmids shuffled into KY943). Arrows correspond to those shown in the locus diagrams in panel C. SCR1 serves as the loading control. The northern blots are representative of three independent experiments. (E) X-ray crystal structure of the nucleosome denoting histone residues (highlighted in red) identified in the termination reporter screen and through northern analysis. Due to its buried location, H3 Q93 is not marked. H2A, H2B, H3, and H4 are colored in pink, yellow, lilac, and green, respectively. Structure from PDB ID 1ID3 (Luger et al., 1997).
Figure 2 with 2 supplements
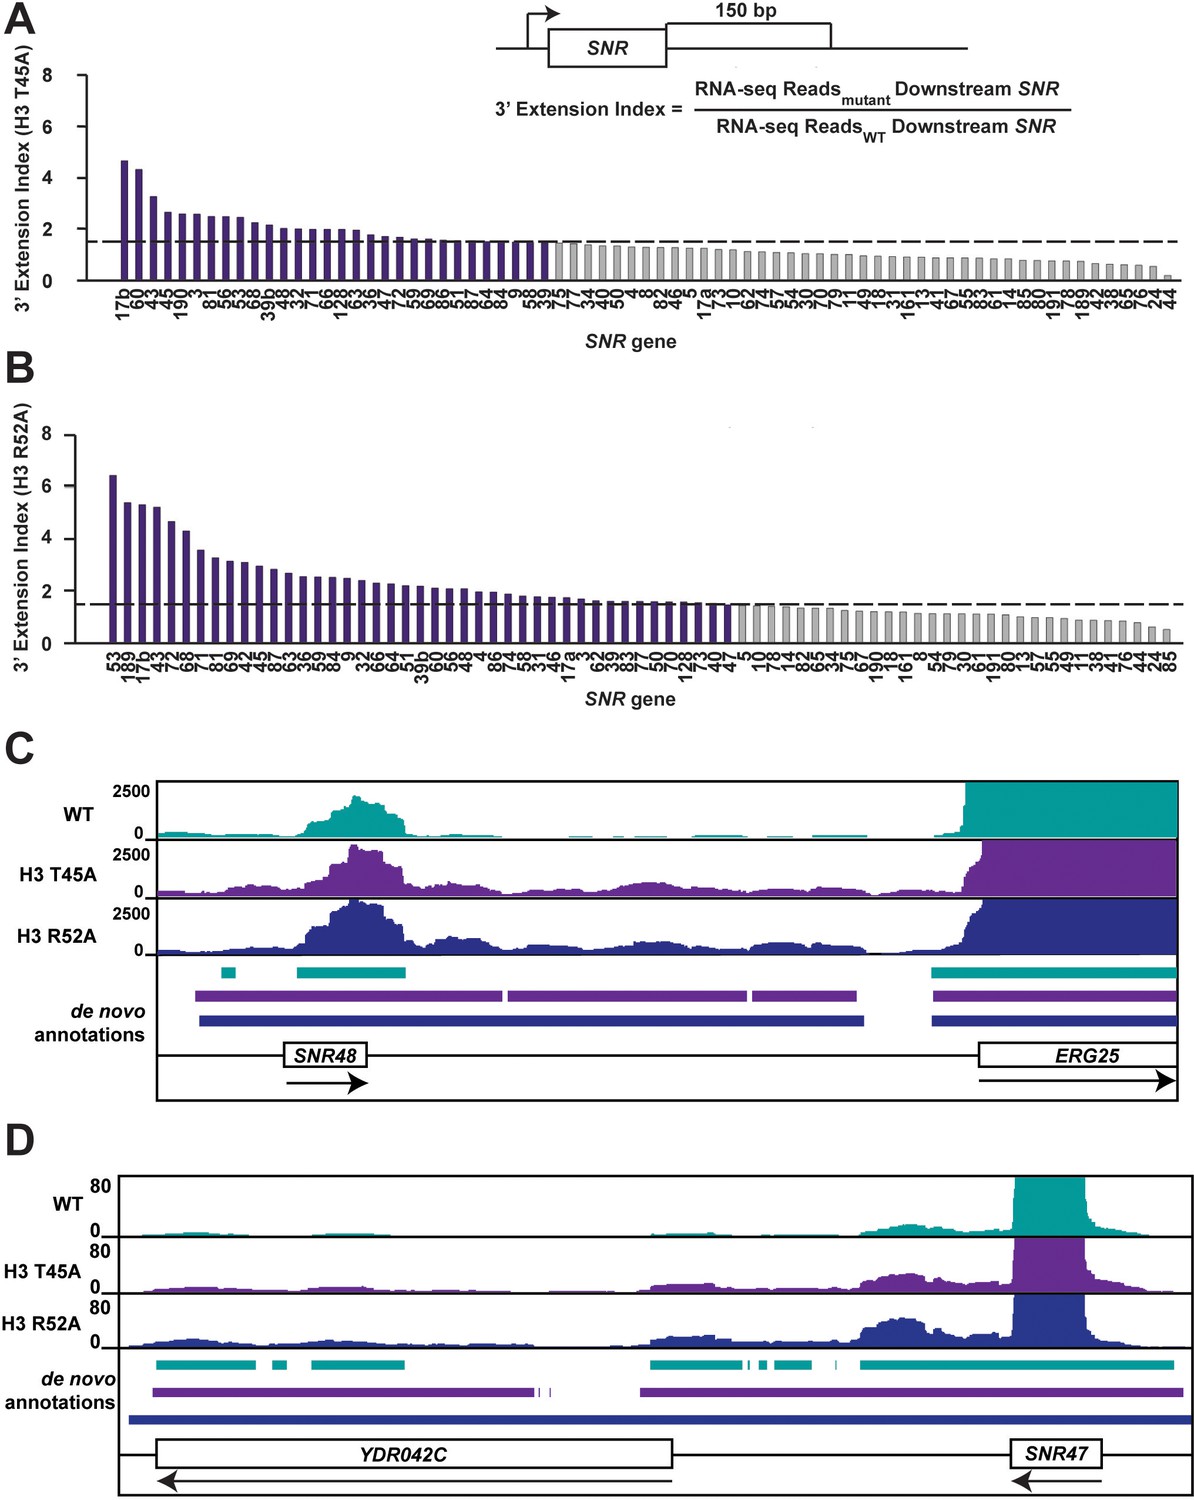
Mutations that alter the nucleosome DNA entry-exit site cause widespread 3’ extension of snoRNAs.
(A, B) 3’ extension index in (A) the H3 T45A mutant and (B) the H3 R52A mutant. The ratio (mutant/WT) of spike-in normalized RNA-seq read counts between mutant and wild-type strains produced by plasmid shuffling of strain KY812 was determined in a window 150 bp downstream of each annotated snoRNA 3’ end. Ratios equal to or greater than 1.5 (dotted line) are highlighted in purple. (C, D) Browser tracks visualized in IGV (Thorvaldsdóttir et al., 2013) showing de novo transcript annotations across (C) the SNR48 locus and (D) the SNR47 locus. The browser tracks represent spike-in normalized RNA-seq reads in a wild-type strain and the H3 T45A and H3 R52A mutants. Lines of matching color beneath correspond to the de novo transcript annotations for each dataset. Arrows below gene names indicate directionality of transcription.
-
Figure 2—source data 1
SNR gene 3' extension index RNA-seq data.
- https://cdn.elifesciences.org/articles/57757/elife-57757-fig2-data1-v1.xlsx
Figure 2—figure supplement 1
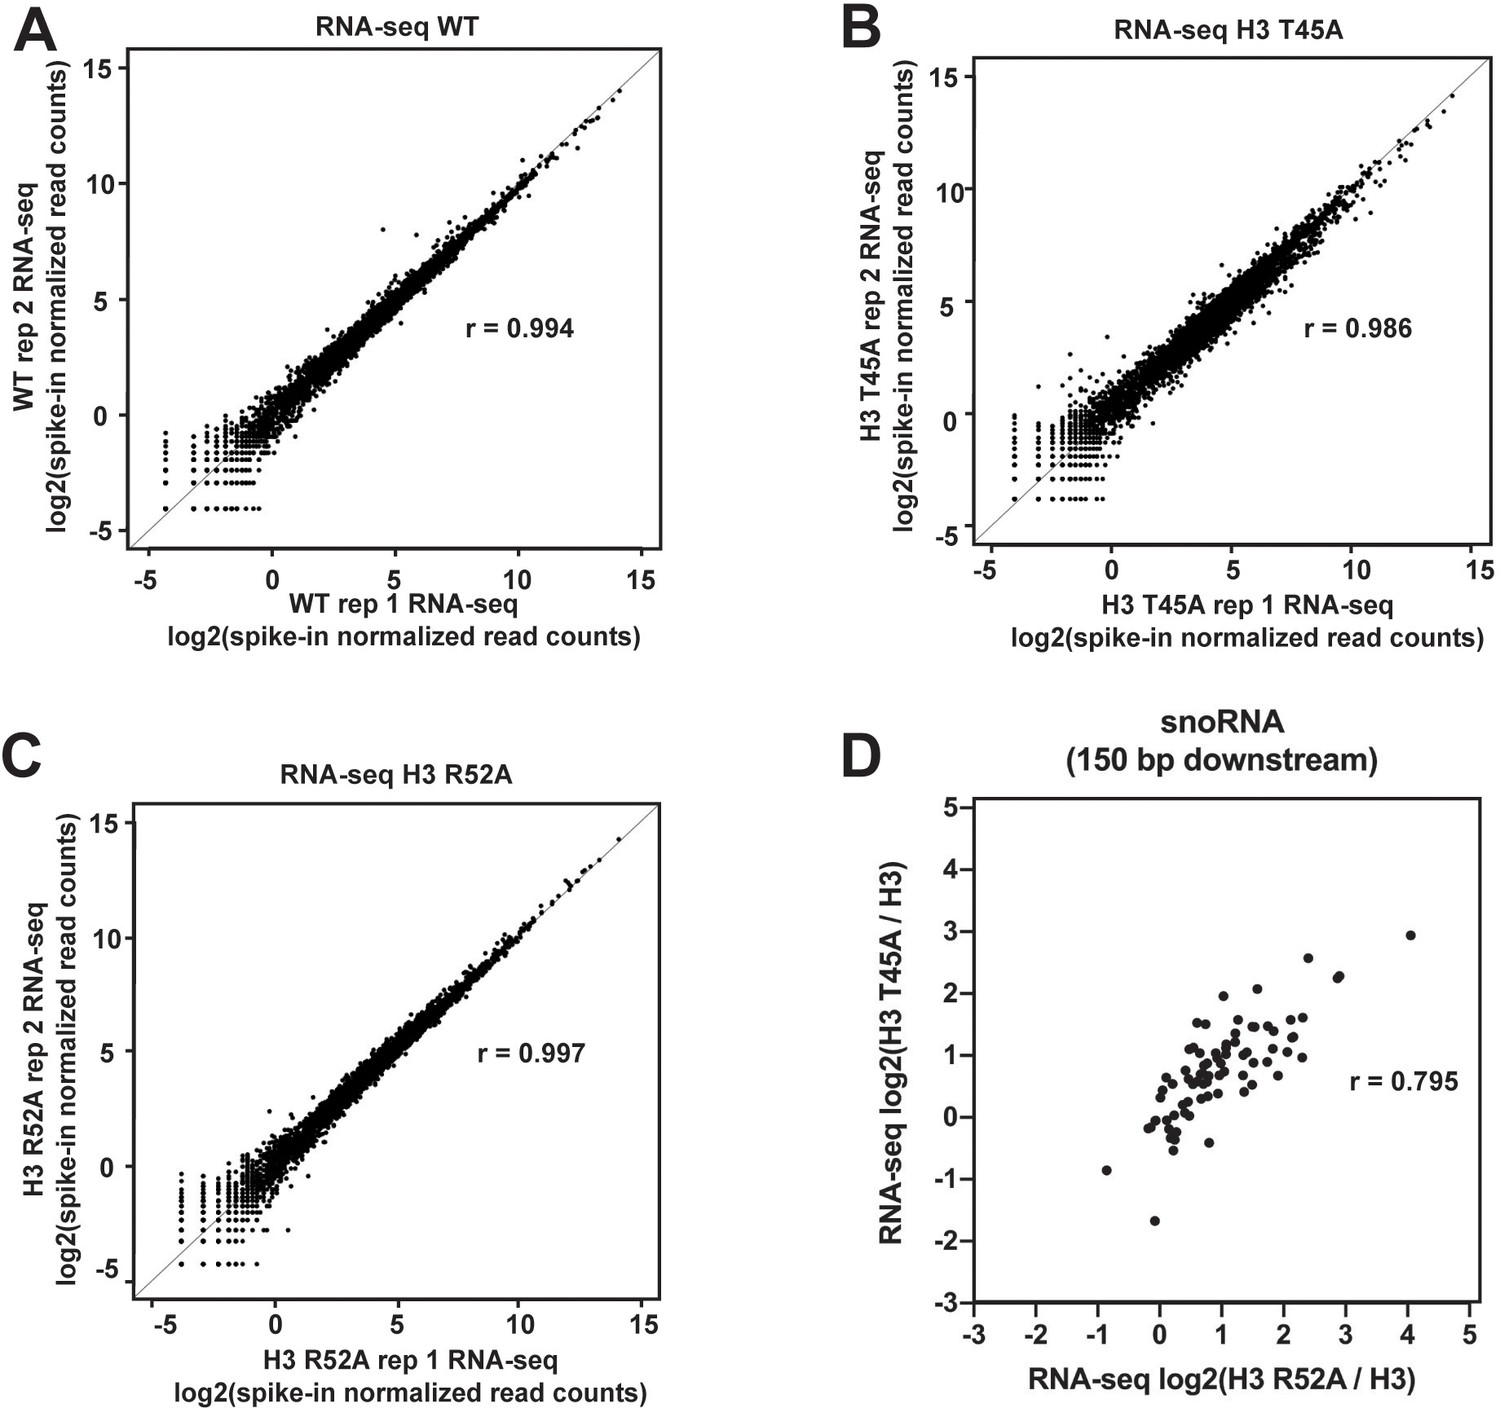
Agreement between biological replicates of RNA-seq datasets.
(A–C) Biplots showing agreement between biological replicates of RNA-seq data for (A) WT, (B) the H3 T45A mutant, and (C) the H3 R52A mutant. Log2-transformed, spike-in normalized RNA-seq read counts were calculated for protein-coding genes and plotted for each mutant and WT. For each pair of biological replicates Pearsons correlation (r) is indicated. (D) Scatter plot of log2(H3 T45A/H3) versus log2(H3 R52A/H3) of strand-specific, spike-in normalized read counts 150 bp downstream of the snoRNA genes.
Figure 2—figure supplement 2
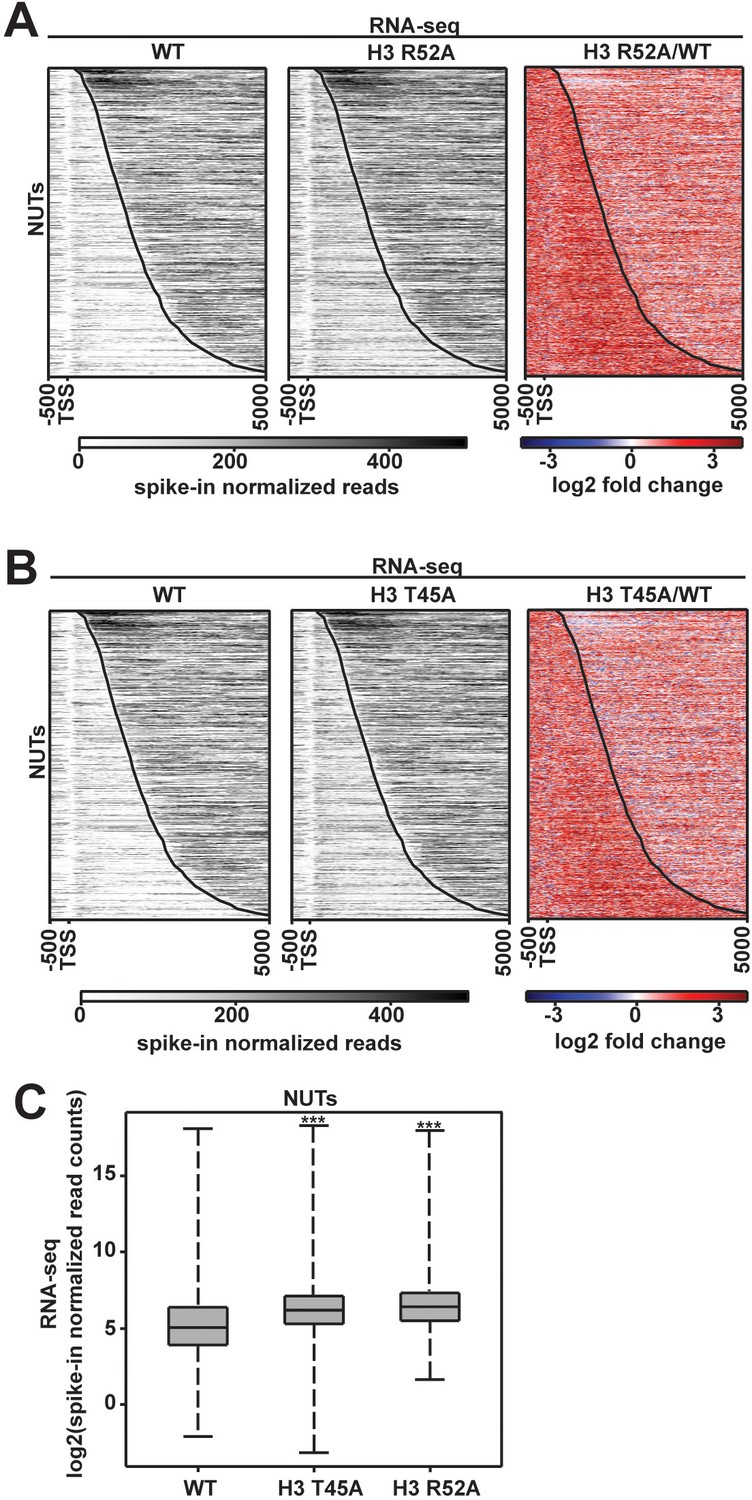
Levels of the Nrd1-unterminated transcripts (NUTs) change in DNA entry-exit site mutants.
(A, B) RNA-seq analysis of annotated NUTs (Schulz et al., 2013) in WT, H3 R52A and H3 T45A strains. Gray scale profiles show spike-in normalized data. Tri-color heatmaps show log2-fold change between mutant and the wild type. All heatmaps, made in deepTools2 (Ramírez et al., 2014; Ramírez et al., 2016), show the region from −500 bp to +5000 bp relative to the annotated TSS of the NUTs. The curved black line indicates the TES. (C) Box and whisker plots graphing spike-in normalized read counts for RNA-seq data over NUT annotations. Boxplots were generated using deepTools2 (Ramírez et al., 2014; Ramírez et al., 2016) and R Studio (RStudio Team, 2016) and show the full range of data in the sample indicated (whisker length). Statistical significance was assigned using the Wilcoxon ranked sums test (***p<0.001).
Figure 3 with 2 supplements

Transcriptional changes at protein-coding genes in DNA entry-exit site mutants.
(A) Heatmaps sorted by gene length and showing spike-in normalized RNA-seq and 4tU-seq read counts (gray scale) and log2-fold change between the H3 R52A or H3 T45A mutant and WT at protein-coding genes. Data are for 6205 protein-coding genes for which positions of +1 nucleosomes, mapped by chemical cleavage (Brogaard et al., 2012), and cleavage and polyadenylation sites (CPS) (Ozsolak et al., 2010) were available. For each gene, 500 bp upstream of the +1 nucleosome to 500 bp downstream of the CPS was plotted in the heatmap. The curved black dotted line marks the position of the CPS. (B) Metagene analysis comparing spike-in normalized read counts in WT and mutant strains over a region from −100 bp to +500 bp from the CPS. Heatmaps and metaplots were generated with deepTools2 (Ramírez et al., 2014; Ramírez et al., 2016).
Figure 3—figure supplement 1
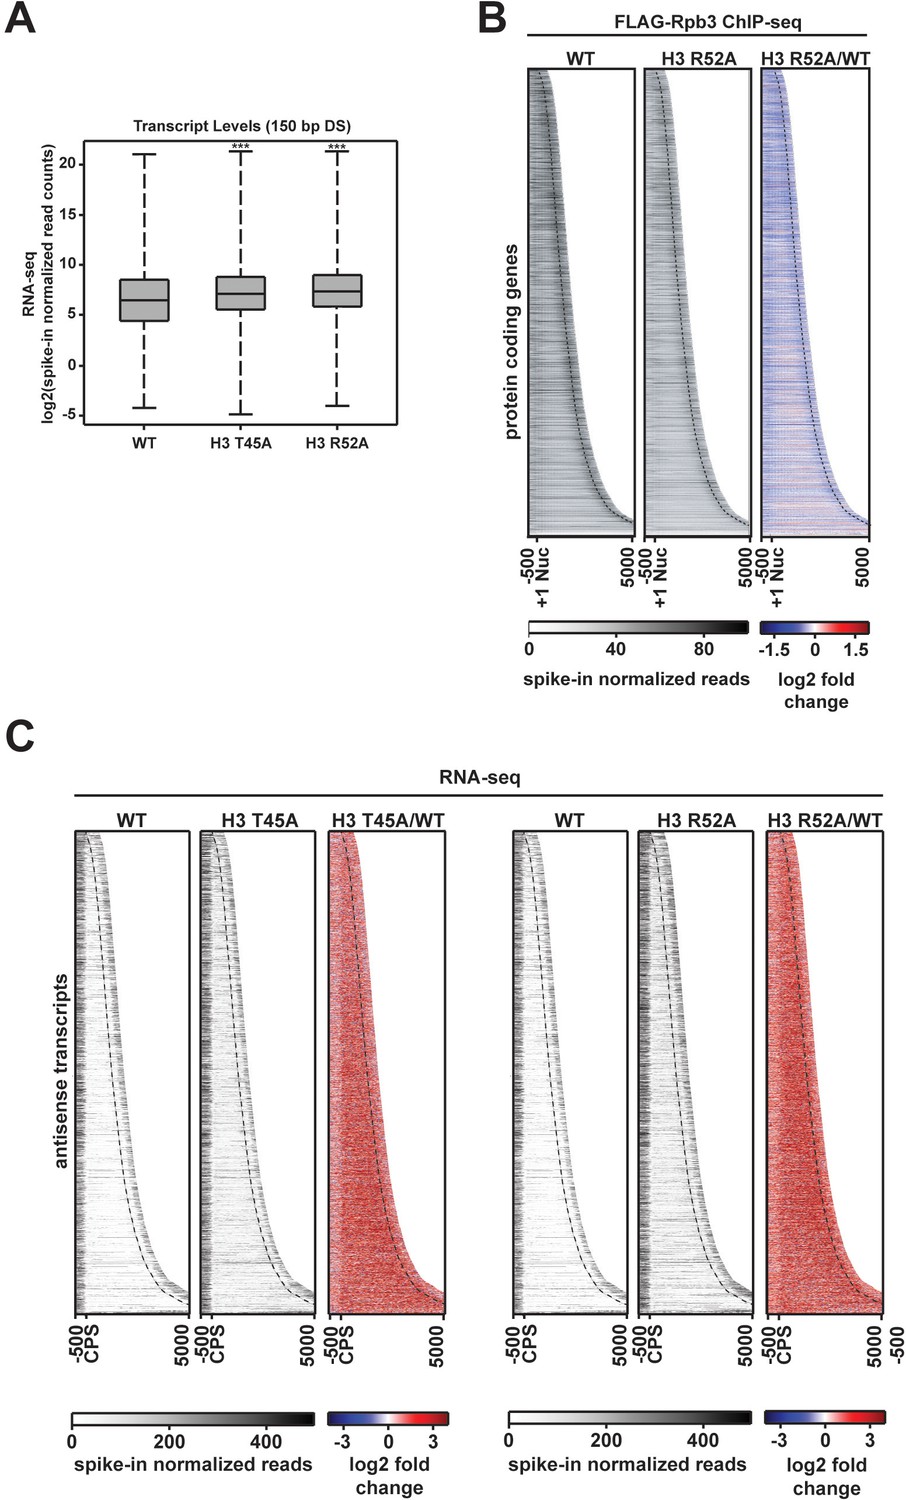
Pol II occupancy and antisense transcript levels at protein-coding genes are altered in DNA entry-exit site mutants.
(A) Box plots comparing log2-transformed spike-in normalized RNA-seq read counts in a window 150 bp downstream of the CPS. Box and whisker plots were generated in R Studio (RStudio Team, 2016) and p-values were calculated using the Wilcoxon-Ranked sum test (***p<0.001). (B) Heatmaps sorted by gene length and showing spike-in normalized FLAG-Rpb3 ChIP-seq read counts (gray scale) and log2-fold change between the H3 R52A mutant and WT at 6205 protein-coding genes. Heatmaps plot the region 500 bp upstream of the +1 nucleosome to 500 bp downstream of the CPS (dotted line) and are sorted by gene length. (C) Expression of regions antisense to the 6205 protein-coding genes shown in Figure 3A in the H3 T45A and H3 R52A mutants compared to WT. Antisense heatmaps are the reverse of the sense heatmaps plotting (from left to right on the x-axis) the region from 500 bp upstream of the CPS to 500 bp downstream of the +1 nucleosome (dotted line) on the non-coding strand. All heatmaps and metagene plots were generated with deepTools2 (Ramírez et al., 2014; Ramírez et al., 2016) using 25 bp bins.
Figure 3—figure supplement 2
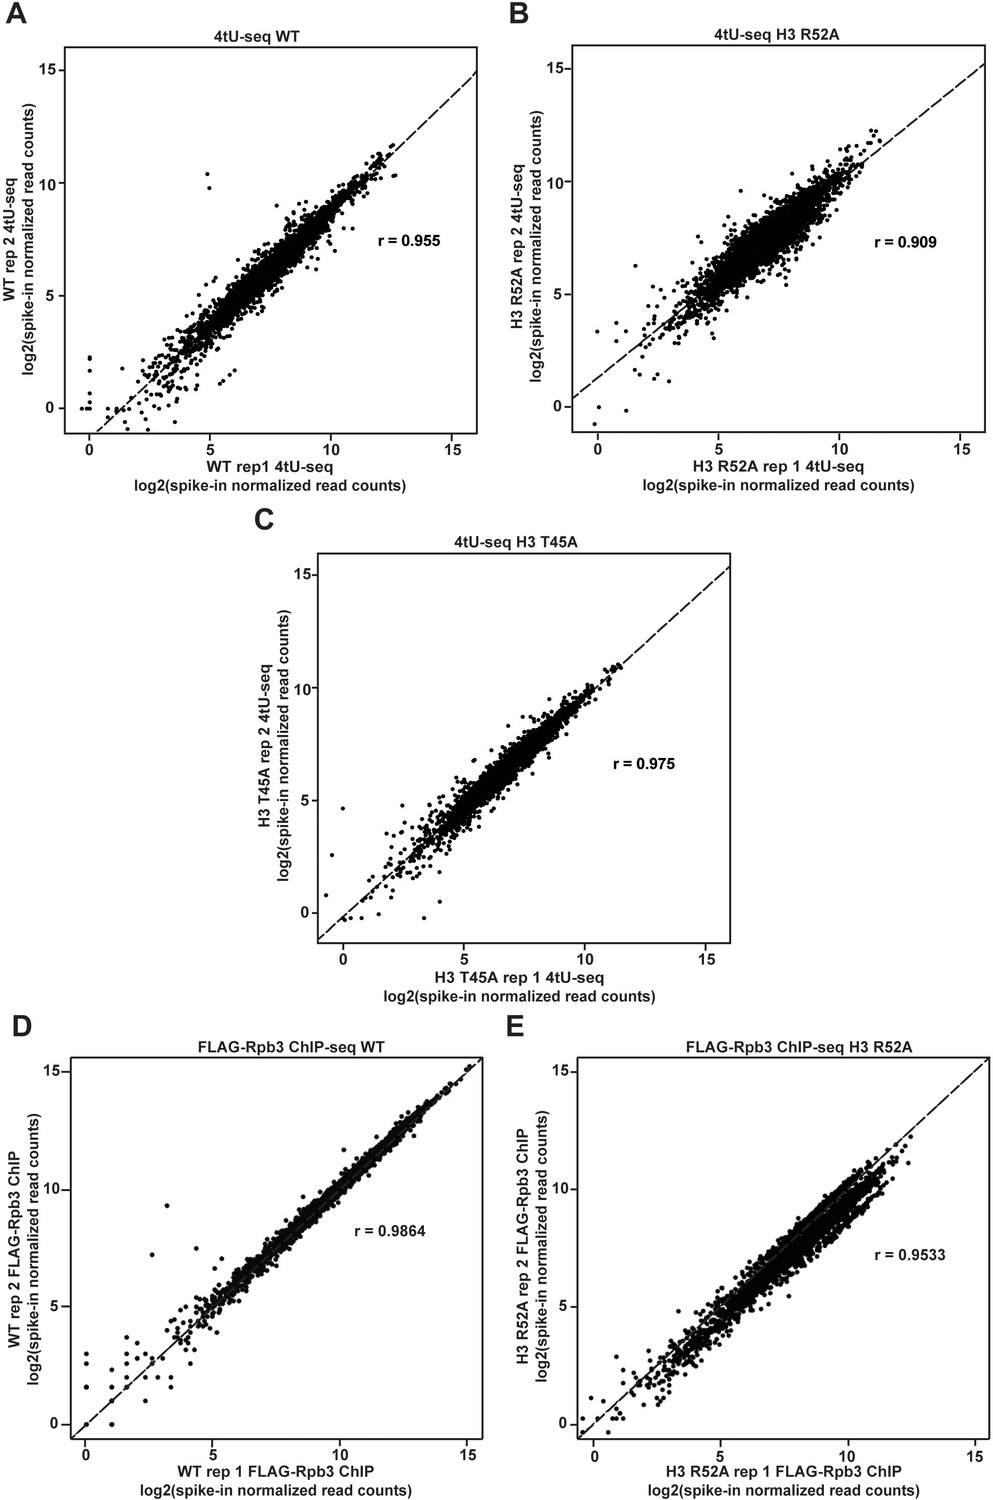
Agreement between biological replicates of 4tU-seq and FLAG-Rpb3 ChIP-seq datasets.
(A–C) Biplots showing agreement between biological replicates of 4tU-seq results in the indicated strains. (D–E) Biplots showing agreement between biological replicates of FLAG-Rpb3 ChIP-seq results in the indicated strains. Log2-transformed, spike-in normalized 4tU-seq or FLAG-Rpb3 ChIP-seq read counts were calculated for protein-coding genes and plotted for mutant and WT strains. For each pair of biological replicates Pearsons correlation (r) is indicated.
Figure 4 with 2 supplements
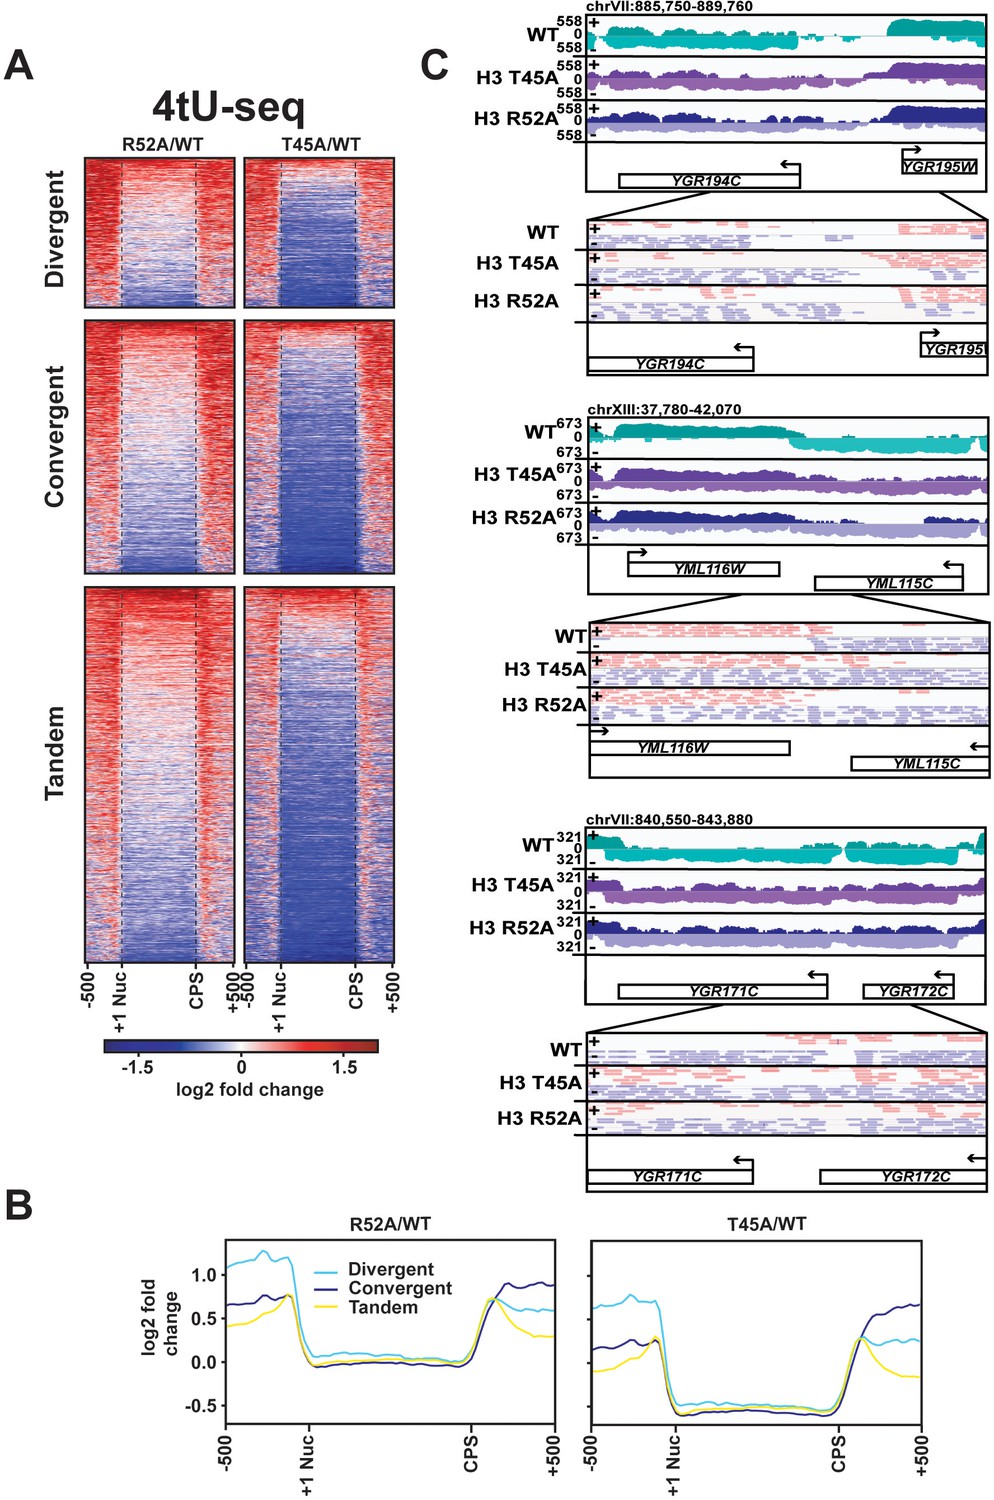
DNA entry-exit site mutants display aberrant transcription 5’ and 3’ to protein-coding genes.
(A) Heatmaps showing log2-fold change in spike-in normalized 4tU-seq read counts in H3 R52A or H3 T45A mutants relative to WT at divergent, convergent, and tandem genes. Heatmap rows represent 1186 divergent, 1981 convergent, and 2976 tandem protein-coding genes showing 500 bp upstream of the +1 nucleosome (Brogaard et al., 2012) and 500 bp downstream of the CPS (Ozsolak et al., 2010). (B) Metagene plots show averaged intensity over regions displayed in the difference heatmaps shown in panel A. (C) Browser tracks visualized in IGV (Thorvaldsdóttir et al., 2013) depicting aberrant transcription 5’ and 3’ to divergent (top), convergent (middle), and tandem (bottom) gene pairs in the indicated strains. Data represent log-scaled, spike-in normalized 4tU-seq read density over the plus (+) and minus (-) strands. Regions were chosen to be void of neighboring ncRNA loci. IGV-visualized BAM-file snapshots depict presence or absence of strand-specific read-pairs between genes. Arrows above gene names indicate directionality of transcription. All heatmaps and metagene plots were generated using deepTools2 (Ramírez et al., 2014; Ramírez et al., 2016) using 25 bp bins.
Figure 4—figure supplement 1
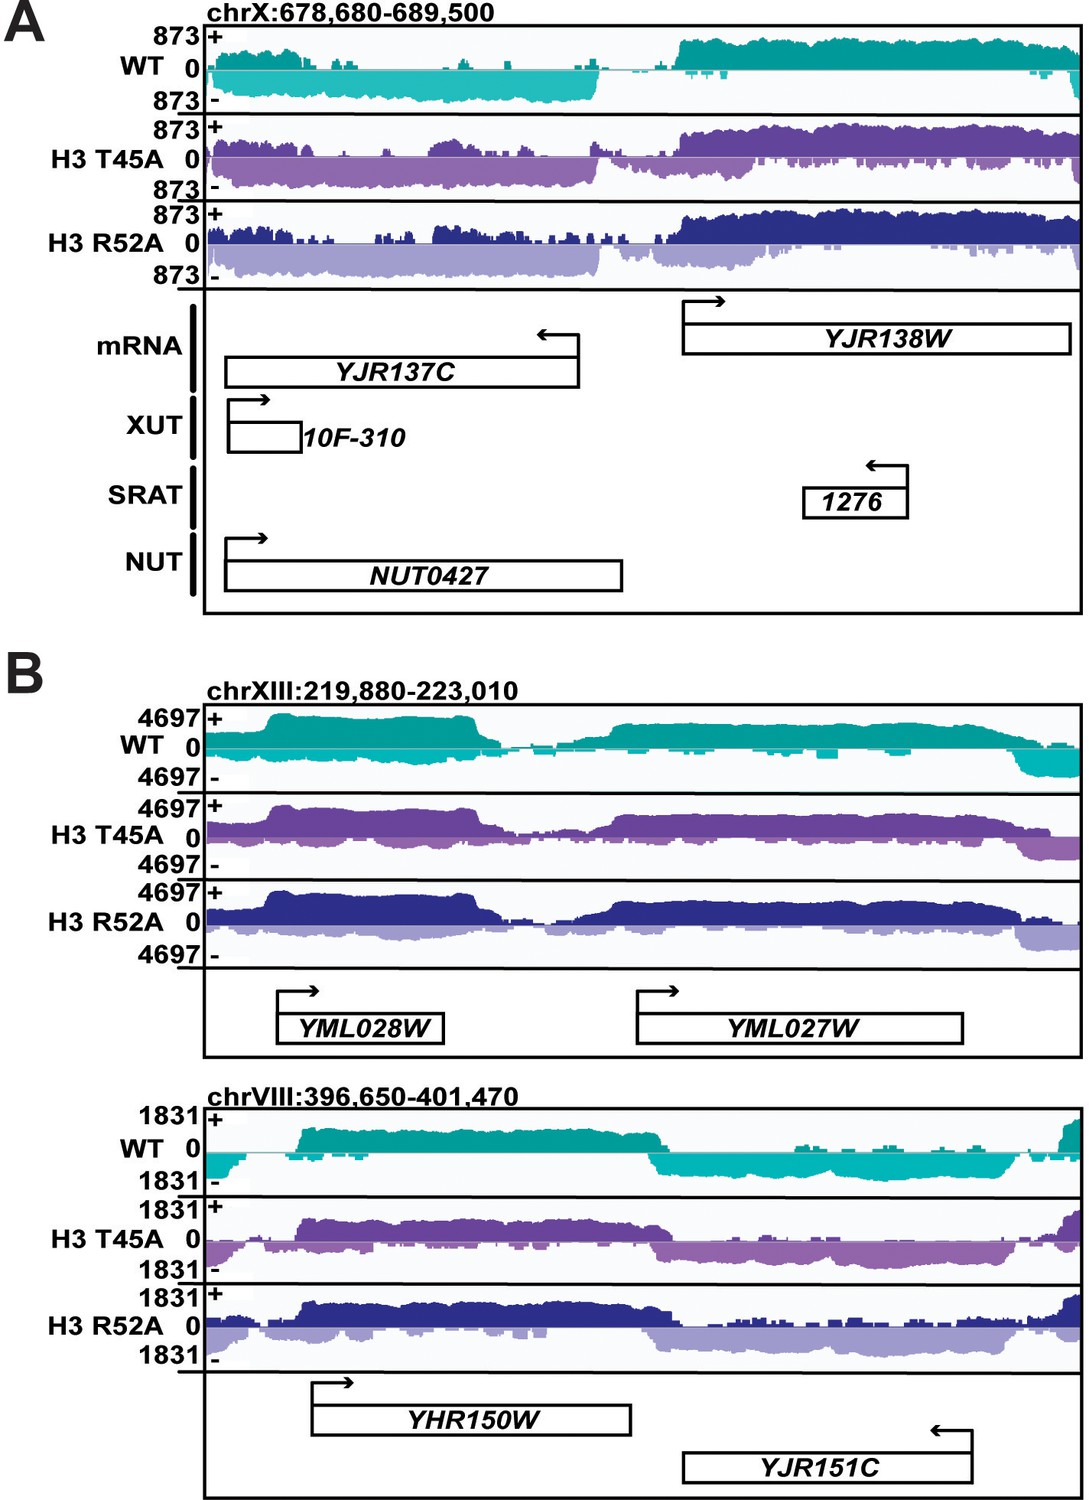
Some genes in DNA entry-exit site mutants show little to no change in 5’ and 3’ expression.
(A, B) Browser tracks of 4tU-seq read density in WT, H3 T45A, and H3 R52A mutant cells visualized in IGV (Thorvaldsdóttir et al., 2013). Data displayed are spike-in normalized read density over the plus (+) and minus (-) strand. All annotated ncRNA within the browser track are displayed. Arrows above gene names indicate directionality of transcription. (A) Tracks depict aberrant transcription on the minus strand 5’ to the YJR137C locus which is sense with respect to YJR137C, but terminating prior to the TSS. This read density appears to originate as an antisense cryptic transcript from the gene body of YJR138W. These data suggest that some increases in 5’ read density seen in Figure 4 can be attributed to short, cryptic, antisense transcripts. (B) Tracks depict YML028W/YML027W and YHR150C/YHR151W gene pairs with little change in 5’ or 3’ reads, exemplifying that extensions in 5’ and 3’ reads in H3 T45A, and H3 R52A mutants occur at many genes but are not universal.
Figure 4—figure supplement 2
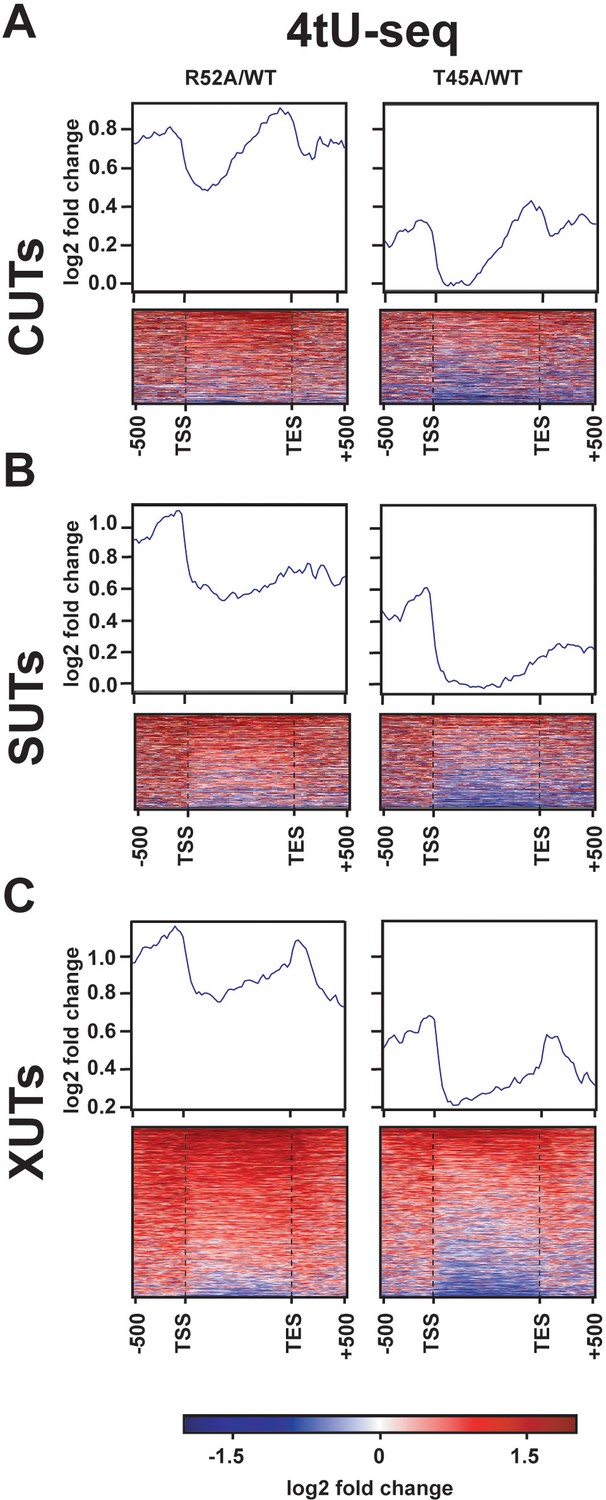
Transcriptional changes at ncRNA loci in DNA entry-exit site mutants.
(A–C) Heatmaps showing log2-fold change in spike-in normalized 4tU-seq read counts between H3 R52A or H3 T45A mutant and WT loci. Heatmap rows represent (A) 924 CUT (Xu et al., 2009), (B) 846 SUT (Xu et al., 2009), and (C) 1657 XUT (van Dijk et al., 2011) ncRNA loci with an additional 500 bp upstream of their annotated transcription start site (Brogaard et al., 2012) and 500 bp downstream of the transcription end site (Ozsolak et al., 2010). Rows are group-sorted by decreasing mean intensity in mutant strains. Metagene plots show averaged intensity over regions displayed in the associated heatmaps. All heatmaps and metagene plots were generated using deepTools2 (Ramírez et al., 2014; Ramírez et al., 2016) using 25 bp bins.
Figure 5 with 2 supplements
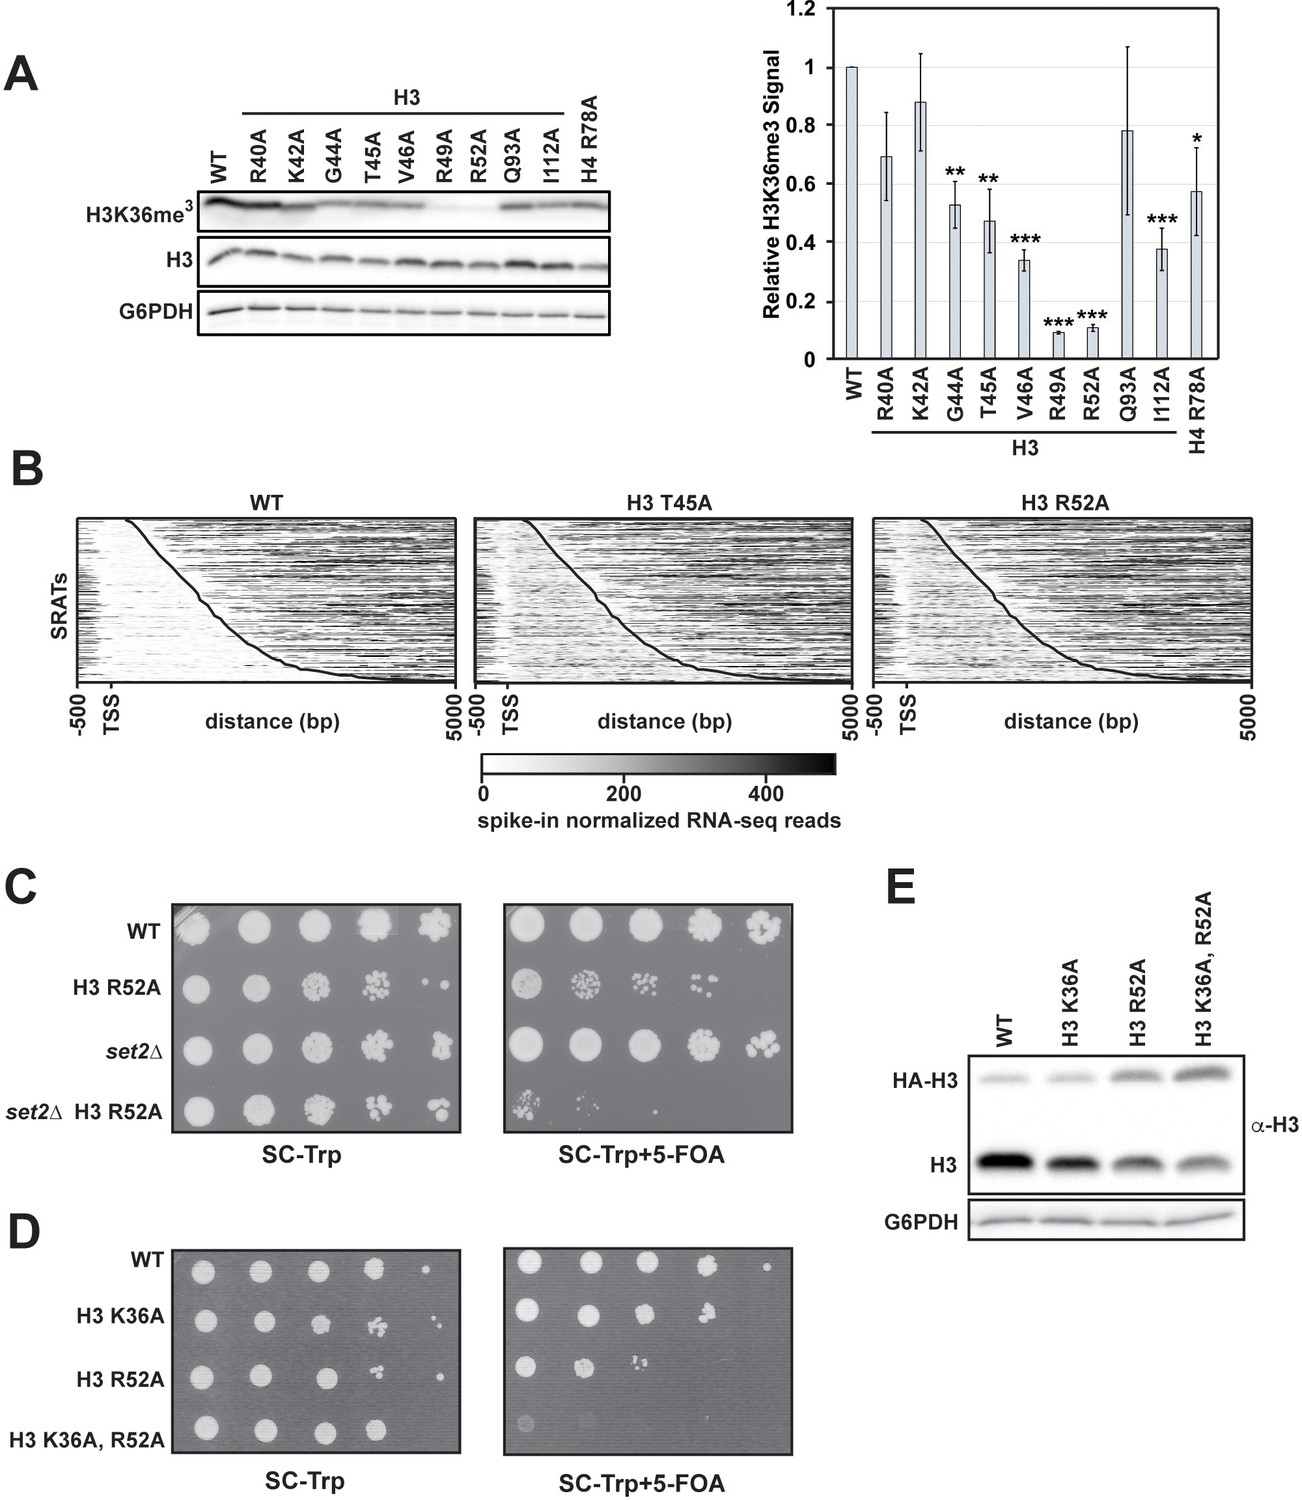
H3 K36me3 and the DNA entry-exit site function through genetically distinct pathways.
(A) Left: western blot analysis of H3 K36me3 levels in H3 and H4 mutant strains. Library plasmids were transformed into KY812 for plasmid shuffling. Extract from a set2∆ strain was used to confirm specificity of the H3 K36me3 antibody. Right: Quantification of H3 K36me3 signal after normalizing to total H3 signal. Error bars represent SEM of three biological replicates. Asterisks represent *p<0.05, **p<0.01, and ***p<0.001 by a Student’s t-test. (B) Heatmaps of spike-in normalized RNA-seq data plotted for regions from −500 bp to +5000 bp relative to the annotated transcription start site (TSS) of Set2-regulated antisense transcripts (SRATS) (Venkatesh et al., 2016) in WT and H3 T45A and R52A mutants. Heatmap data are sorted by length of the SRAT annotation and the curved black line marks the annotated TES. (C) Plasmid shuffle assay assessing growth of the H3 R52A mutant containing or lacking the SET2 gene. Cells (10-fold dilution series starting at 1 × 10⁸ cells/mL) were plated to SC-Trp with and without 5-FOA for selection against the URA3-marked wild-type H3 plasmid in KY812 (wild-type) and KY3575 (set2∆). (D) Plasmid shuffle assay to monitor growth of yeast strains expressing the indicated H3 derivatives as the only source of H3. Yeast strain KY812 was transformed with TRP1-marked CEN/ARS plasmids expressing the indicated H3 derivatives. Counter selection for the wild-type H3 plasmid was carried out as in C. (E) Representative western blot of three biological replicates confirming expression of the plasmid-borne histone mutants analyzed in panel D over integrated HA-tagged, wild-type H3 expressed from the HHT1 locus (strain KY3511). G6PDH serves as a loading control.
-
Figure 5—source data 1
H3 K36me3 western blot data.
- https://cdn.elifesciences.org/articles/57757/elife-57757-fig5-data1-v1.xlsx
Figure 5—figure supplement 1
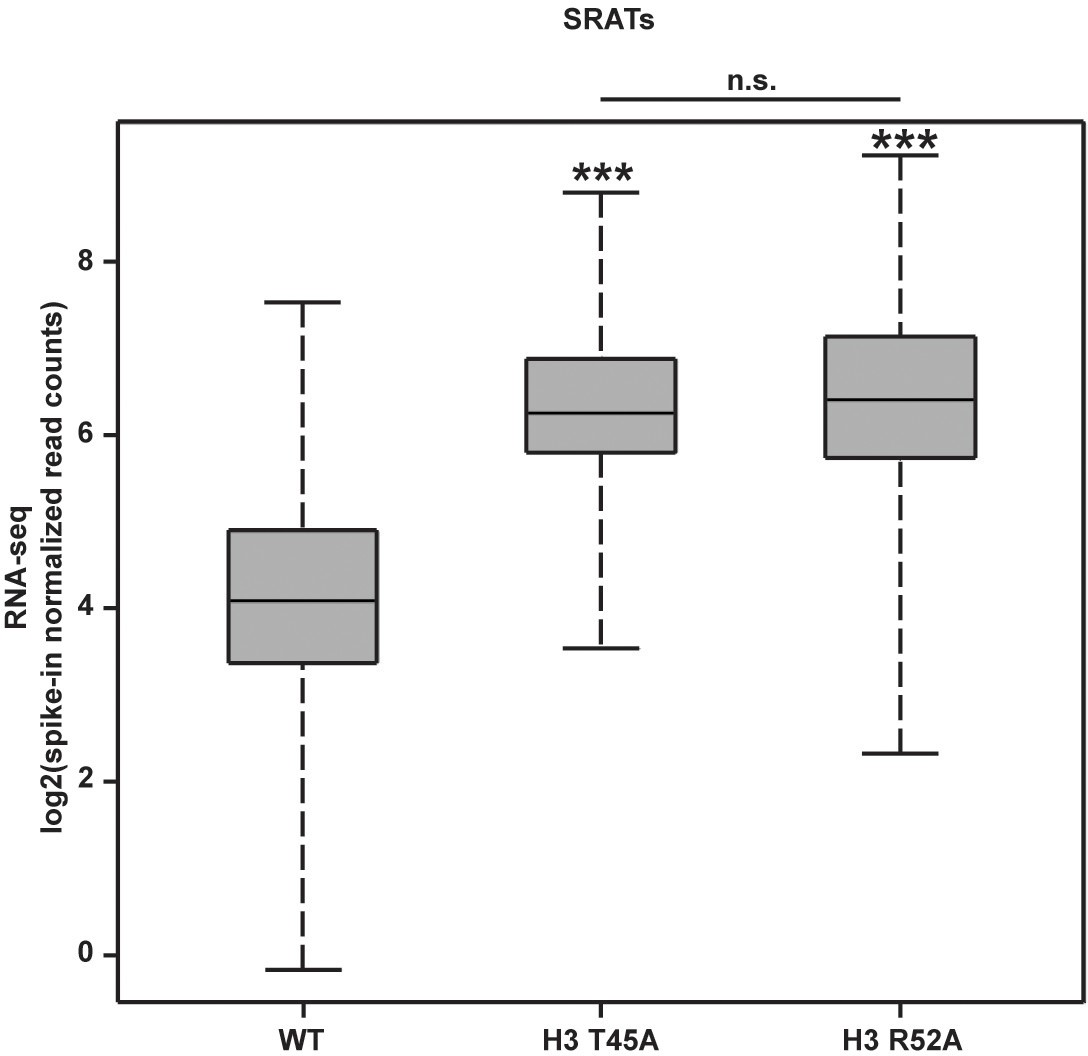
SRAT expression is significantly increased in DNA entry-exit site mutants compared to wild-type.
Box and whisker plots showing log2-transformed spike-in normalized read counts for SRATs (Venkatesh et al., 2016) expressed in strains constructed by plasmid shuffling of WT, H3 T45A or H3 R52A plasmids (TRP1-marked, CEN/ARS) into KY812. Count matrices were generated in deepTools2 (Ramírez et al., 2014; Ramírez et al., 2016) and plots were generated in R (RStudio Team, 2016). p-Values were calculated using the Wilcoxon’s ranked sums test (***p<0.001).
Figure 5—figure supplement 2
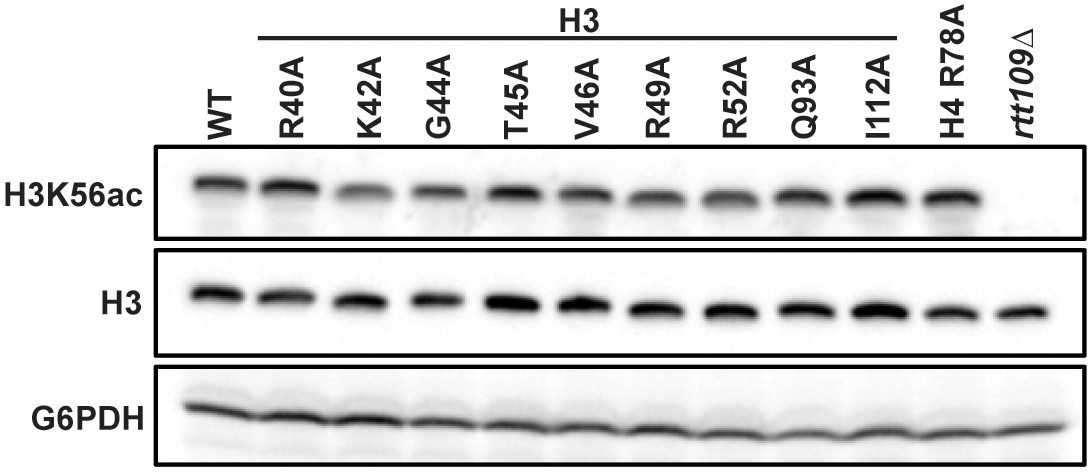
Mutations to the DNA entry-exit site do not affect global levels of H3 K56ac.
Western blot analysis of H3 K56ac, total H3, and G6PDH levels in indicated mutants. Strains were constructed by plasmid shuffling of the histone mutant plasmids (TRP1-marked, CEN/ARS) into strain KY812. H3 and G6PDH serve as loading controls. An rtt109∆ strain (KY1437) was used as a positive control. A representative blot of three biological replicates is shown.
Figure 6 with 2 supplements
Mutation of the DNA entry-exit site alters nucleosomes genome-wide.
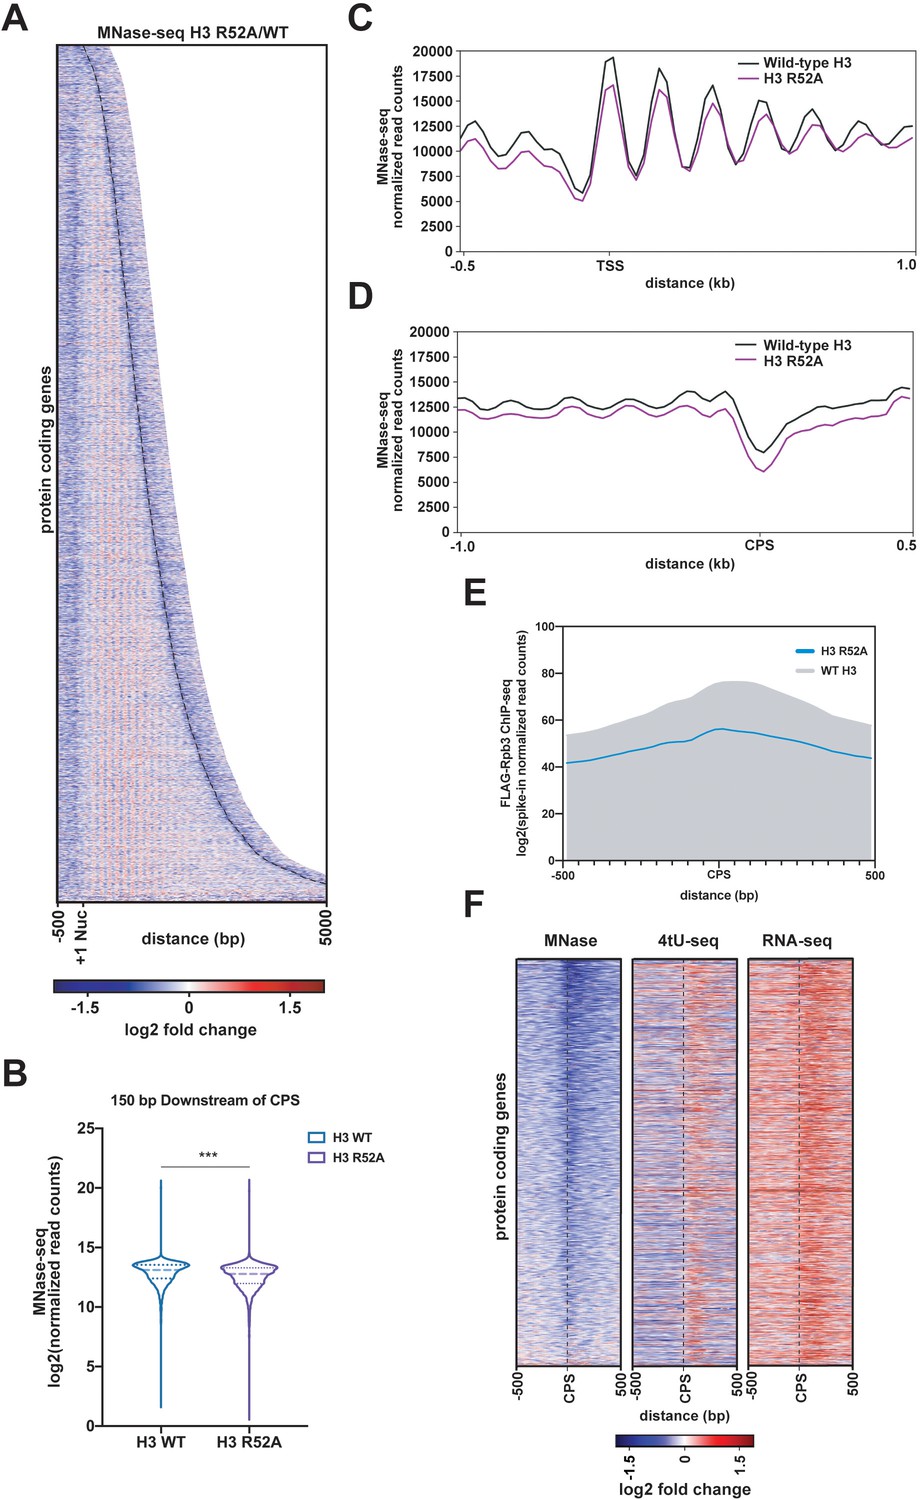
(A) Heatmap of the log2-fold change of MNase-seq read counts (spike-in normalized as described in Materials and methods) of the H3 R52A mutant relative to WT. Rows represent 6205 protein-coding genes (as in Figure 3) sorted by length and showing 500 bp upstream of the +1 nucleosome (Brogaard et al., 2012) and 500 bp downstream of the CPS (curved black dotted line; Ozsolak et al., 2010). (B) Violin plot of log2-transformed normalized read counts from MNase-seq data in the region 150 bp downstream of the CPS. The difference between WT and the H3 R52A mutant is statistically significant (p<0.0001) as determined by a Wilcoxon rank-sum test. (C) Metagene plots showing normalized MNase-seq read counts for WT (black) and the H3 R52A mutant (purple) in a region from −500 bp to +1000 bp relative to the +1 nucleosome. (D) MNase-seq metagene plots as in C, but plotted from −1000 bp to +500 bp from the CPS. (E) Metagene plots showing spike-in normalized FLAG-Rpb3 ChIP-seq read counts for wild-type (gray) and the H3 R52A mutant (blue) in a region from −500 bp to +500 bp relative to the CPS (Ozsolak et al., 2010). All heatmaps and metagene plots were generated using deepTools2 (Ramírez et al., 2014; Ramírez et al., 2016) using 25 bp bins and 6205 protein-coding genes. All MNase-seq data were produced using a 2.5 U MNase digestion. (F) Heatmaps of MNase-seq, RNA-seq and 4tU-seq data sorted (lowest to highest log2 fold change value based on the MNase-seq data) by mean row value in the MNase-seq data and centered on the CPS and extending up- and downstream by 500 bp. Rows in panel F represent 2879 protein-coding genes present on chrIV, chrVII, chrXII, chrXIV and chrXV (no evidence of aneuploidy in any genomic\transcriptomic dataset for the H3 R52A mutant).
Figure 6—figure supplement 1
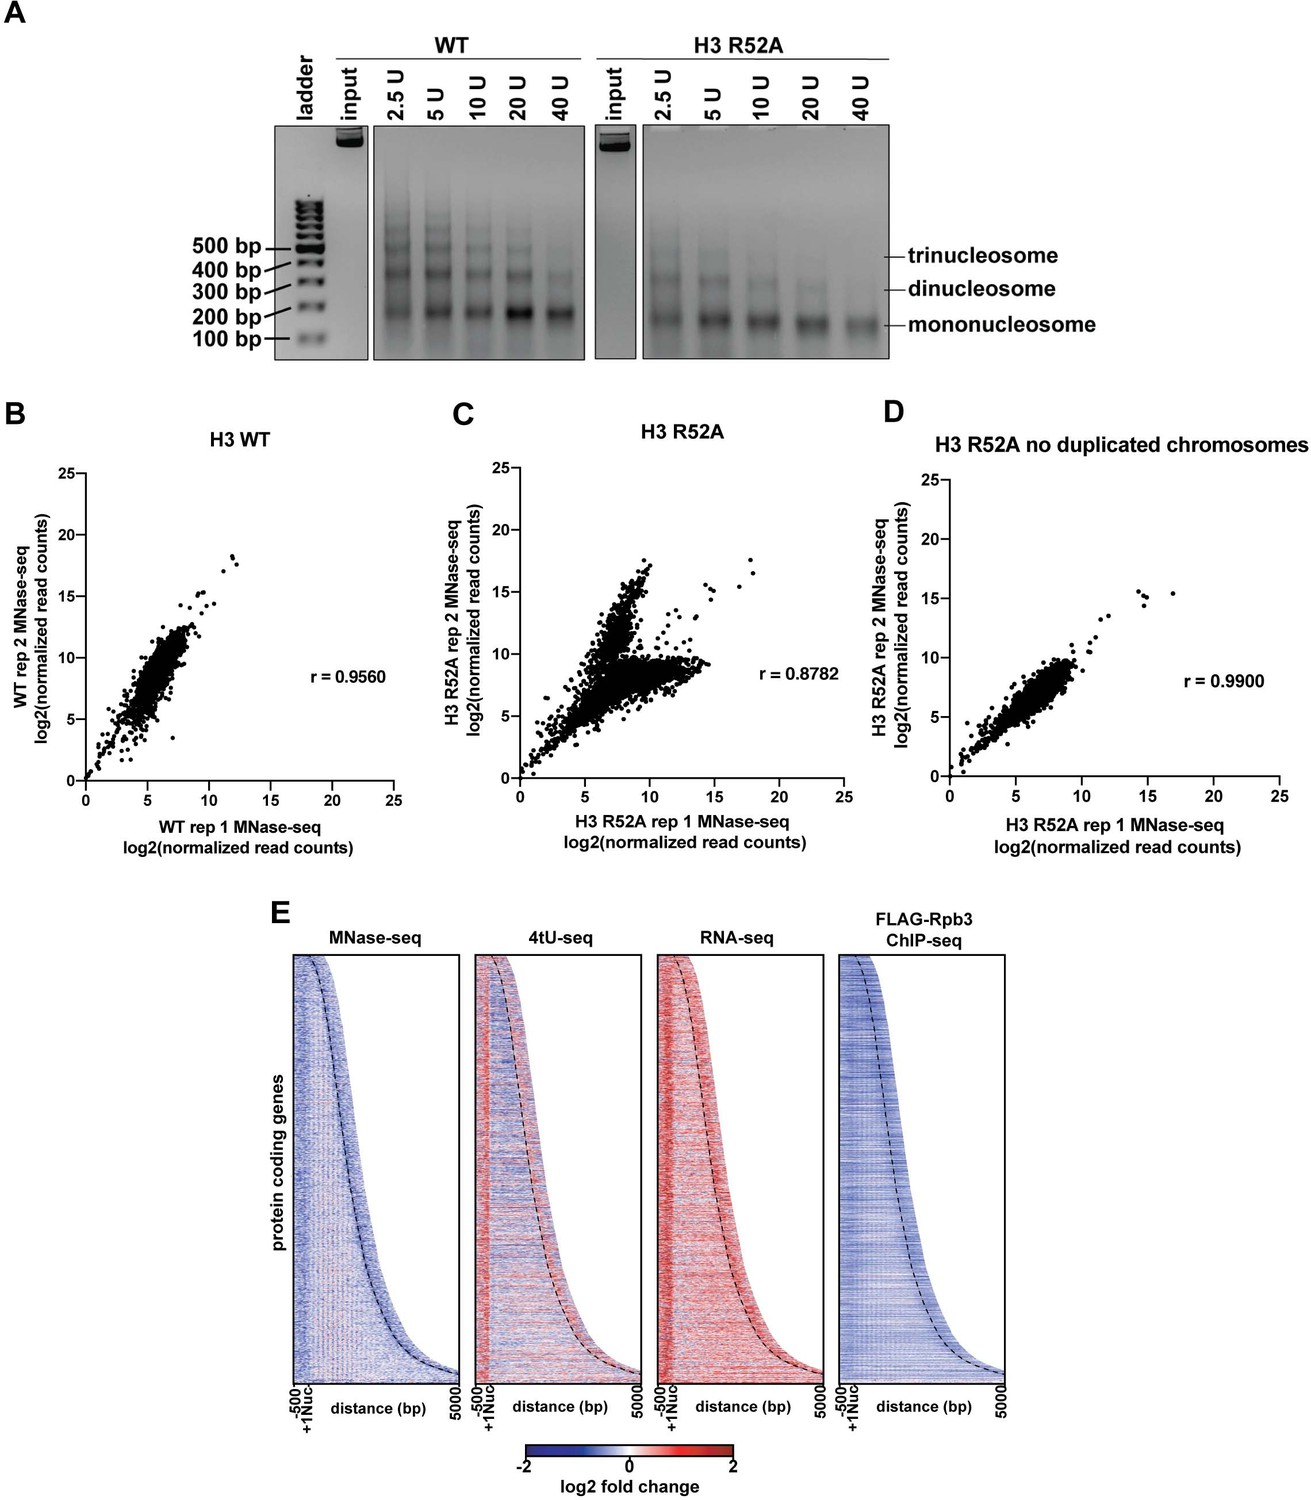
Analysis of MNase digestion and MNase-seq data for the the H3 R52A mutant.
(A) Ethidium bromide stained agarose gel of MNase-treated chromatin with the indicated amounts of MNase. Input indicates untreated chromatin. Mono- and poly-nucleosome species are indicated. (B, C) Biplots showing agreement between biological replicates. Log2-transformed, spike-in normalized MNase-seq read counts (see Materials and methods) were calculated for protein-coding genes and plotted with Prism 8. Pearson’s correlation coefficients were calculated for each pair of biological replicates. (D) Biplot as in C but showing MNase-seq read counts over regions encoding mRNAs (4448 genes) on chromosomes with no evidence of aneuploidy in either replicate of the MNase-seq data for the H3 R52A strain (chrII, chrIV, chrIX, chrV, chrVI, chrVII, chrXII, chrXIII, chrXIV and chrXV). (E) Heatmaps of the log2-fold ratio of normalized MNase-seq, 4tU-seq, RNA-seq, and FLAG-Rpb3 ChIP seq read counts of the H3 R52A mutant relative to WT. Rows represent 2879 protein-coding genes present on chrIV, chrVII, chrXII, chrXIV and chrXV (no evidence of aneuploidy in any genomic/transcriptomic dataset) sorted by length and showing 500 bp upstream of the +1 nucleosome (Brogaard et al., 2012) and 500 bp downstream of the CPS (curved black dotted line) (Ozsolak et al., 2010).
Figure 6—figure supplement 2
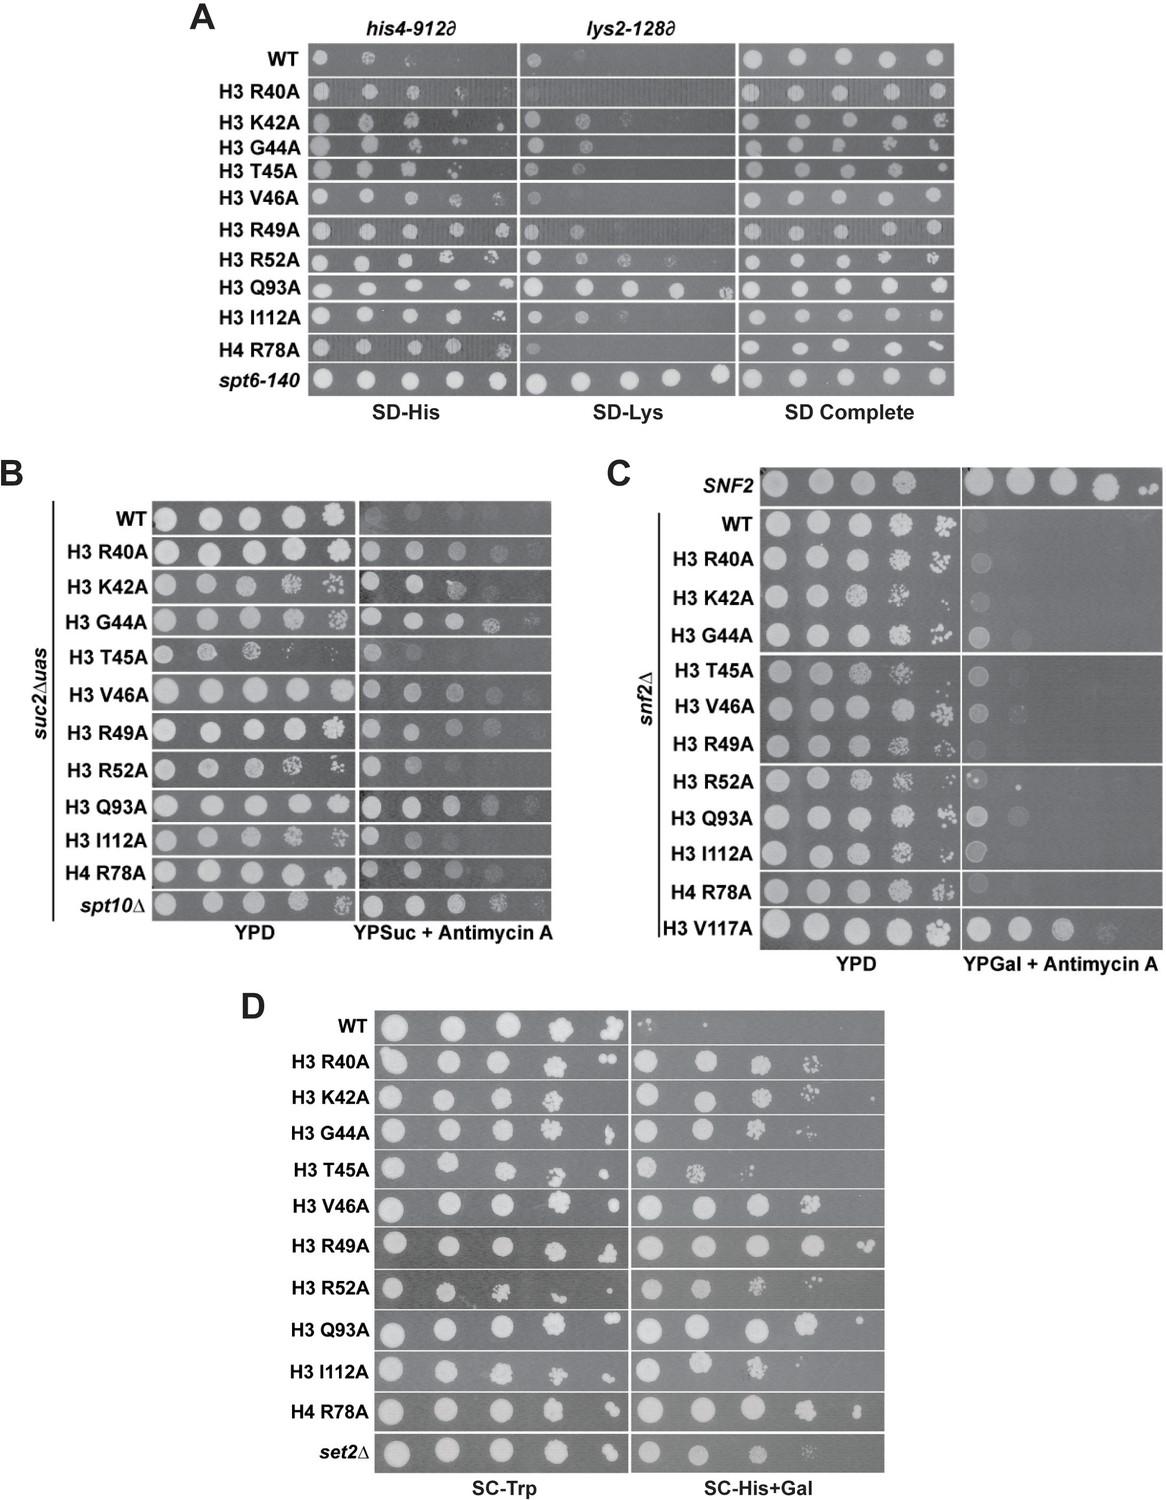
DNA entry-exit site mutants exhibit chromatin- and transcription-related phenotypes.
(A) The Spt- phenotype was assessed at two Ty ∂ element insertion mutations, his4-912∂ and lys2-18∂, using a five-fold serial dilution series of a yeast culture starting at OD600 = 0.8. Histone mutant plasmids (TRP1-marked, CEN/ARS) were transformed into KY3502 for plasmid shuffling. The positive control was spt6-140 (KY319). SD complete was used as a growth control and SD-His and SD-Lys were used to assess the Spt- phenotype. Plates were incubated at 30°C for 5 days. (B) The Bur- phenotype was assessed in a suc2∆uas(−1900 /- 390) strain (KY3503) by five-fold serial dilution of a culture starting at OD600 = 0.8. Histone mutant plasmids (TRP1-marked, CEN/ARS) were transformed into KY3503 for plasmid shuffling. The positive control was spt10∆ (KY325). Cells were grown on YPD as a growth control and on YPSucrose + 1 µg/mL antimycin A to score the Bur- phenotype. Plates were incubated at 30°C for 4 days. (C) The Sin- phenotype was assessed in a snf2∆ strain (KY3354) by ten-fold serial dilution of a culture starting at 1 × 10⁸ cells/mL. Histone mutant plasmids (TRP1-marked, CEN/ARS) were transformed into KY3354 for plasmid shuffling. The positive control was the H3 V117A mutant (Hainer and Martens, 2011). Cells were grown on YPD as a growth control and on YPGalactose + 1 µg/mL antimycin A to score the Sin- phenotype. Plates were incubated at 30°C for 3 days. (D) The cryptic initiation phenotype was assessed in a GAL1pr:FLO8::HIS3 reporter strain (KY3506) by ten-fold serial dilution of a culture starting at OD600 = 0.8 and plating on selective media. Histone mutant plasmids (TRP1-marked, CEN/ARS) were transformed into KY3506 for plasmid shuffling. The positive control was a set2∆ strain. Cells were grown on SC-Trp as a growth control and on SC-His+Gal to score cryptic initiation. Plates were incubated at 30°C for 4 days.
Figure 7 with 1 supplement
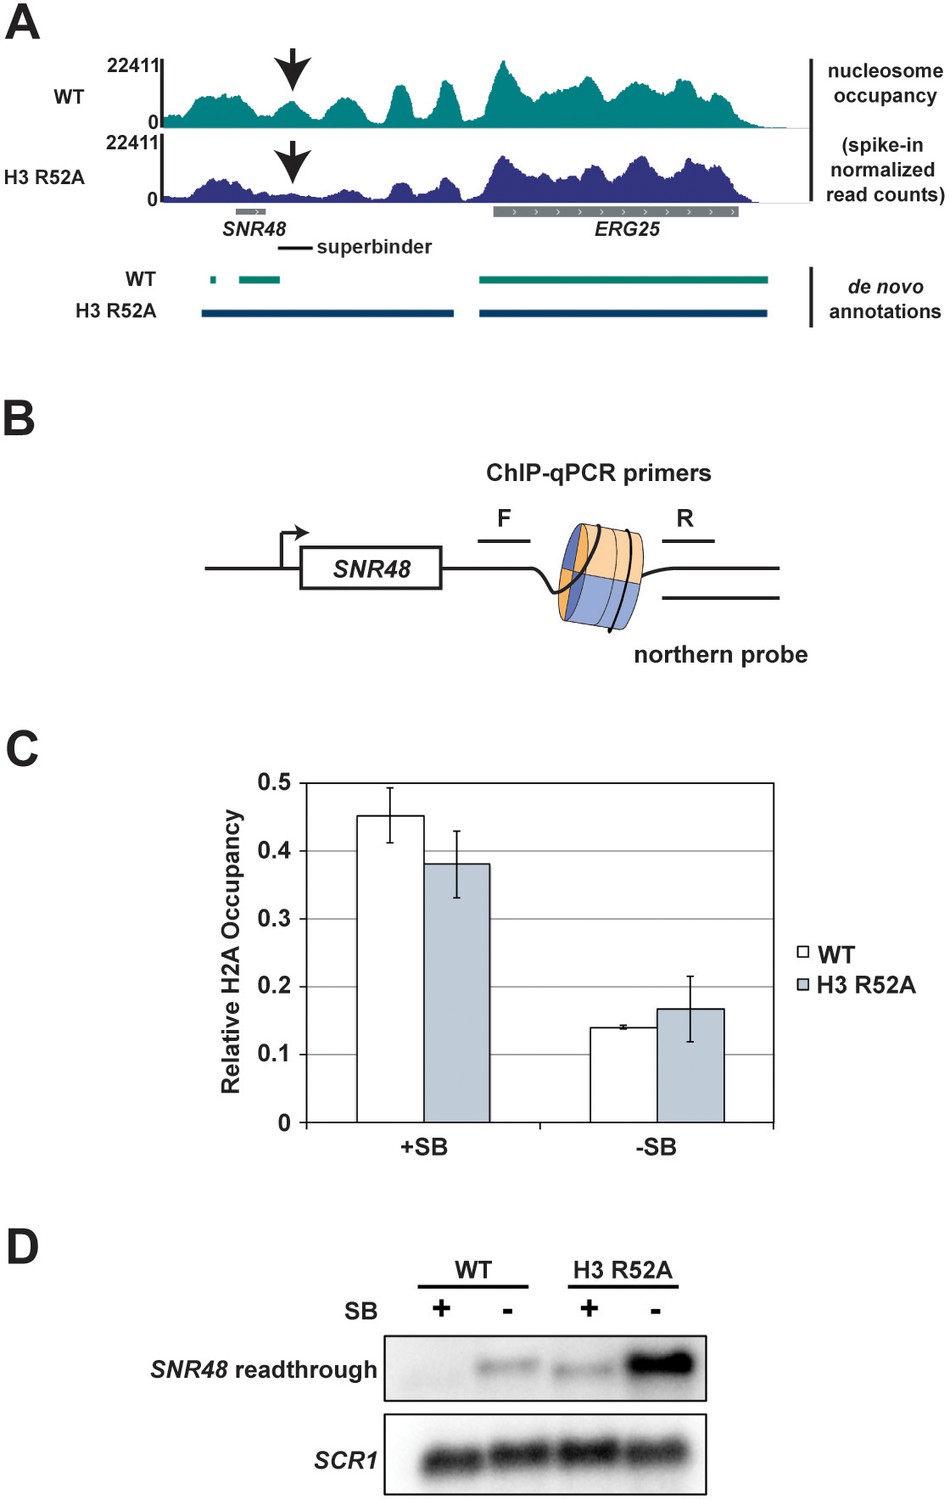
Integration of a superbinder DNA sequence downstream of SNR48 suppresses the termination defect of the H3 R52A mutant.
(A) MNase-seq data from a 2.5 U digestion visualized in IGV (Thorvaldsdóttir et al., 2013) (top) compared to de novo transcript annotations generated from RNA-seq data from the same strains (bottom). Arrows indicate reduced nucleosome occupancy in the H3 R52A strain compared to the wild-type, which is coincident with the 3’ end of the transcript in the wild-type strain. For scale, SNR48 is 113 bp. The site of integration of the superbinder sequence is indicated by a black bar. (B) Diagram of superbinder nucleosome with locations of the PCR primers for ChIP and the probe used in northern blot analysis to detect SNR48 readthrough transcription. (C) ChIP-qPCR using an antibody against H2A in KY3221 transformed with either wild-type or mutant histone plasmids. Error bars represent the SEM of three independent biological replicates. (D) Representative northern blot detecting the SNR48 readthrough transcript in wild-type and H3 R52A strains with or without the superbinder sequence. Northern blot analysis was performed on three independent biological replicates.
-
Figure 7—source data 1
H2A ChIP data.
- https://cdn.elifesciences.org/articles/57757/elife-57757-fig7-data1-v1.xlsx
Figure 7—figure supplement 1
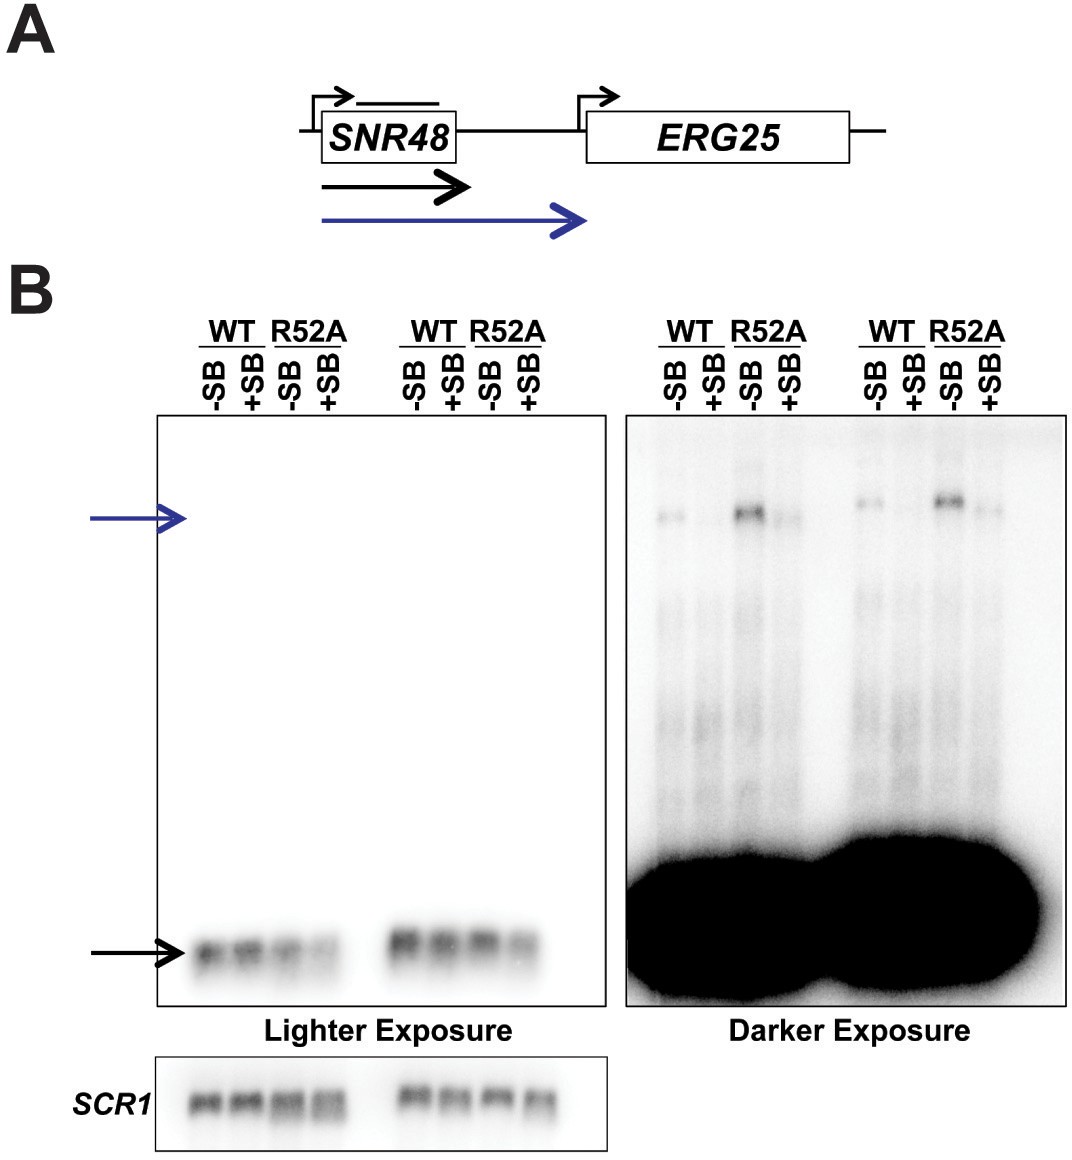
Detection of readthrough transcription of SNR48 by northern analysis in strains with and without the superbinder (SB) sequence.
(A) Location of the northern blot probe over the SNR48 locus (black line above SNR48) and the observed transcript types. (B) Northern blot analysis of transcripts associated with the SNR48 gene. A short exposure (left) reveals only the highly expressed, mature SNR48 transcript (black arrow), while the long exposure (right) reveals the read-through transcripts (blue arrow). As in Figure 6D, suppression of transcription read-through by the SB sequence is observed.
Tables
Appendix 1—key resources table
| Reagent type (species) or resource | Designation | Source or reference | Identifiers | Additional information |
|---|---|---|---|---|
| Strain, strain background (Saccharomyces cerevisiae) | S288C derivatives | This paper; Fred Winston (Harvard Medical School) Winston et al., 1995 | See Supplementary file 2. Yeast strains | |
| Strain, strain background (Saccharomyces cerevisiae) | 972 h- | Fred Winston (Harvard Medical School) | FWP10 | spike-in control |
| Strain, strain background (Saccharomyces cerevisiae) | NRRL Y-1140 | Nathan Clark (University of Utah) | spike-in control | |
| Genetic reagent, (Kluyveromyces lactis) | KLLA0D16170 g-3XFLAG:: NAT | Jin et al., 2017 | YSC193 | spike-in control |
| Recombinant DNA reagent | SHIMA plasmid library | Nakanishi et al., 2008 | recombinant histone mutant library | |
| Sequence-based reagent | PCR primers | This paper | See Supplementary file 1. Oligonucleo-tides | |
| Sequence-based reagent | histone superbinder (SB) sequence | Wang et al., 2011 | ||
| Recombinant DNA reagent | pMPY-3xHA plasmid | Schneider et al., 1995 | Plasmid vector used for SB-URA3-SB construct | |
| Recombinant DNA reagent | TOPO TA plasmid containing SB sequence | Hainer et al., 2015 | Source of SB DNA for construction of SB-URA3-SB construct | |
| Recombinant DNA reagent | SB-URA3-SB plasmid | This study | KB1479 | Used to generate yeast strains with integrated SB |
| Gene (Saccharomyces cerevisiae) | hht2-HHF2 or HHT2-hhf2 | Nakanishi et al., 2008 | ||
| Antibody | α-H3 (rabbit polyclonal) | Tomson et al., 2011 | western analysis (1:15,000) | |
| Antibody | α-H3 K36me3(rabbit polyclonal) | Abcam | ab9050 | western analysis (1:1000) |
| Antibody | α-HA (mouse monoclonal) | Roche | 12CA5 | western analysis (1:3000) |
| Antibody | α-G6PDH (rabbit) | Sigma-Aldrich | A9521 | western analysis (1:20,000) |
| Antibody | α-H3 K56ac (rabbit) | Paul Kaufman (UMass Medical School) | western analysis (1:5000) | |
| Antibody | α-rabbit IgG-HRP | GE Healthcare | NA934 | western analysis (1:5000) |
| Antibody | α-mouse IgG-HRP | GE Healthcare | NA931 | western analysis (1:5000) |
| Commercial assay or kit | Pico Plus chemilumine-scence substrate | Thermo Fisher | #34580 | |
| Antibody | α-FLAG M2 affinity gel (mouse monoclonal) | Sigma-Aldrich | A2220 | 30 µL α-FLAG beads per 700 µL chromatin (ChIP) |
| Antibody | α-H2A (rabbit polyclonal) | ActiveMotif | #39235 | 1 µL α-H2A per 700 µL chromatin (ChIP) |
| Ather | Protein A conjugated to sepharose beads | GE Healthcare | GE17-5280-01 | 30 µL per chromatin IP |
| Commercial assay or kit | QIAquick PCR purification kit | Qiagen | #28106 | |
| Commercial assay or kit | NEBNext Ultra II library kit for Illumina | New England Biolabs | E7645 | |
| Commercial assay or kit | NEBNext Ultra II sequencing indexes | New England Biolabs | E7335, E7500, E7710 | |
| Commercial assay or kit | SoLo RNA-seq library preparation kit | TECAN | 0516–32 | |
| Commercial assay or kit | Maxima 2X SYBR Master Mix | Thermo Fisher | K0221 | |
| Commercial assay or kit | TURBO DNA-free kit | Invitrogen | AM1907 | |
| Commercial assay or kit | RiboPure Yeast RNA extraction kit | Ambion | AM1926 | |
| Commercial assay or kit | MTSEA Biotin-XX | Biotium | #90066 | |
| Commercial assay or kit | Streptavidin beads | Invitrogen | #65001 | |
| Commercial assay or kit | MinElute columns | Qiagen | #74204 | |
| Commercial assay or kit | QuikChange II kit | Agilent | #200523 | |
| Peptide, recombinant protein | Micrococcal nuclease | Thermo Fisher | #88216 | |
| Sequence-based reagent | [α-32P]dATP and [α-32P]dTTP | PerkinElmer | used to generate Northern probes | |
| Other | S. cerevisiae reference genome | Ensembl | R64-1-1 | |
| Other | S. pombe reference genome | Ensembl | EF2 | |
| Other | K. lactis reference genome | Ensembl | ASM251v1 | |
| Software, algorithm | HISAT2 | Kim et al., 2015 | ||
| Software, algorithm | SAMtools | Li et al., 2009 | ||
| Software, algorithm | RSubread featureCounts | Liao et al., 2014 | ||
| Software, algorithm | deepTools2 | Ramírez et al., 2014; Ramírez et al., 2016 | ||
| Software, algorithm | R Studio | RStudio Team, 2016 | ||
| Software, algorithm | DANPOS2 | Chen et al., 2013 | ||
| Software, algorithm | wigToBigWig UCSC utility | Kent et al., 2010 | ||
| Software, algorithm | BEDtools | Quinlan, 2014; Quinlan and Hall, 2010 |
Additional files
-
Supplementary file 1
Oligonucleotides.
- https://cdn.elifesciences.org/articles/57757/elife-57757-supp1-v1.docx
-
Supplementary file 2
Yeast strains.
- https://cdn.elifesciences.org/articles/57757/elife-57757-supp2-v1.docx
-
Transparent reporting form
- https://cdn.elifesciences.org/articles/57757/elife-57757-transrepform-v1.docx
Download links
A two-part list of links to download the article, or parts of the article, in various formats.
Downloads (link to download the article as PDF)
Open citations (links to open the citations from this article in various online reference manager services)
Cite this article (links to download the citations from this article in formats compatible with various reference manager tools)
The nucleosome DNA entry-exit site is important for transcription termination and prevention of pervasive transcription
eLife 9:e57757.
https://doi.org/10.7554/eLife.57757


