Whole-genome sequencing analysis of semi-supercentenarians
- Department of Experimental, Diagnostic, and Specialty Medicine (DIMES), University of Bologna, Italy
- Clinical Chemistry, Department of Laboratory Medicine, Karolinska Institutet at Huddinge University Hospital, Sweden
- Alma Mater Research Institute on Global Challenges and Climate Change (Alma Climate), University of Bologna, Italy
- Nestlé Research, Société des Produits Nestlé SA, Switzerland
- Functional Genomics Laboratory, Department of Biotechnology, University of Verona, Italy
- IRCCS Istituto delle Scienze Neurologiche di Bologna, Italy
- Applied Biomedical Research Center (CRBA), S. Orsola-Malpighi Polyclinic, Italy
- Fondazione Ca' Granda, IRCCS Ospedale Maggiore Policlinico, Italy
- Geriatric Unit, Department of Clinical Sciences and Community Health, University of Milan, Italy
- Department of Experimental and Clinical Biomedical Sciences "Mario Serio", University of Florence, Italy
- Department of Neuroscience, Psychology, Drug Research and Child Health, University of Florence, Italy
- IRCCS Fondazione Don Carlo Gnocchi, Italy
- Department for the Cultural Heritage (DBC), University of Bologna, Italy
- Department of Biological, Geological, and Environmental Sciences (BiGeA), Laboratory of Molecular Anthropology and Centre for Genome Biology, University of Bologna, Italy
- Department of Physics and Astronomy, University of Bologna, Italy
- Department of Biology, Ecology and Earth Sciences, University of Calabria, Italy
- Department of Medicine, Unit of Internal Medicine, University of Verona, Italy
- School of Anthropology and Museum Ethnography, University of Oxford, United Kingdom
- Department of Applied Mathematics and Laboratory of Systems Biology of Aging, Lobachevsky University, Russian Federation
Figures
Figure 1
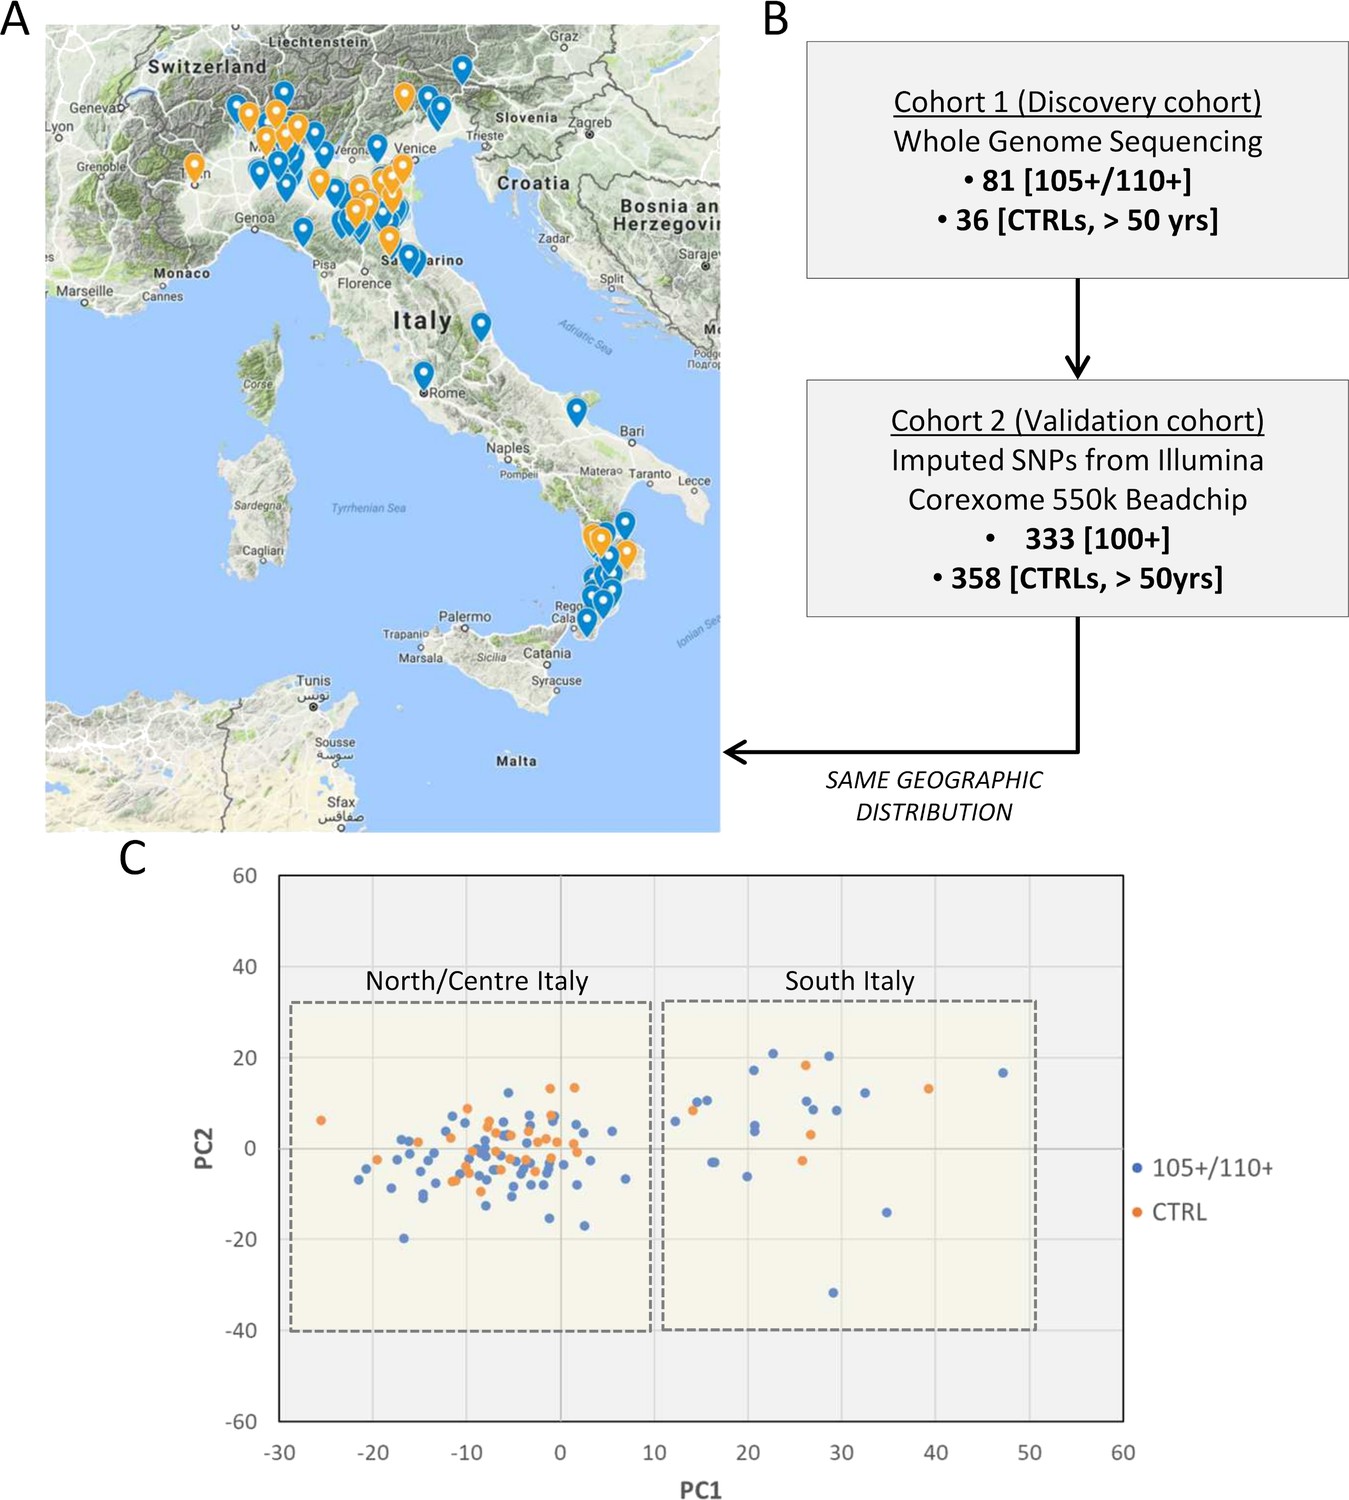
Study design.
(A) 105+/110+ (in blue) and controls (in orange) recruited in the Italian peninsula and analyzed by whole genome sequencing (discovery cohort). (B) The study design applied in the present study. (C) PCA plot for the discovery cohort (Cohort 1), in red are indicated 105+/110+ and in black the group of controls (CTRL).
Figure 2 with 1 supplement
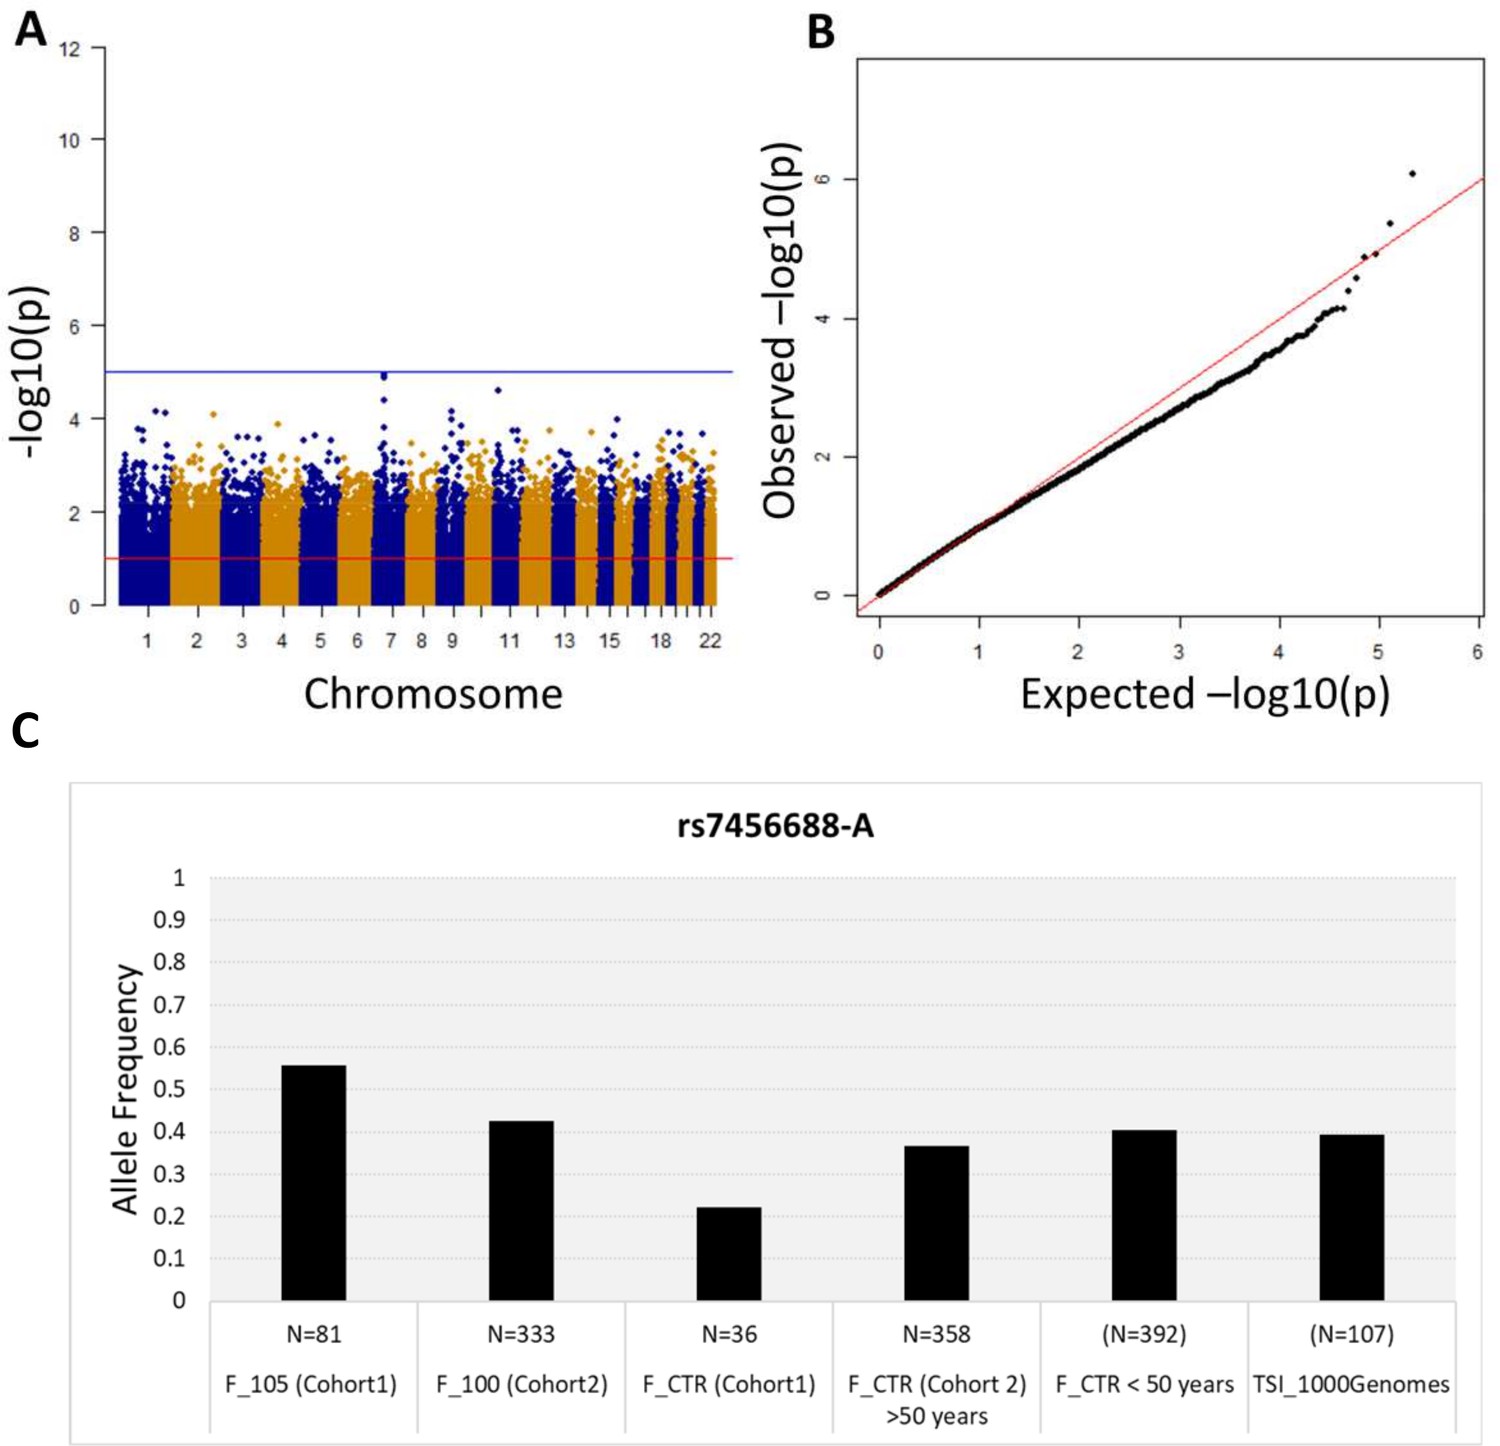
Association analysis results considering common variants (MAF >5%).
(A) Manhattan plot for all the SNPs tested for the association analysis by considering semi-supercentenarians and controls. The x-axis shows SNPs according to their chromosomal positions and y-axis shows the p-values, expressed as –log10(p-value). (B) QQ plot of expected –log10(p-values) (x axis) versus observed –log10(p-values) (y axis) (one black point per variant). The genomic inflation factor was estimated to 1.02. (C) Allele frequency of rs7456688-A in all the cohorts analyzed.
Figure 2—figure supplement 1
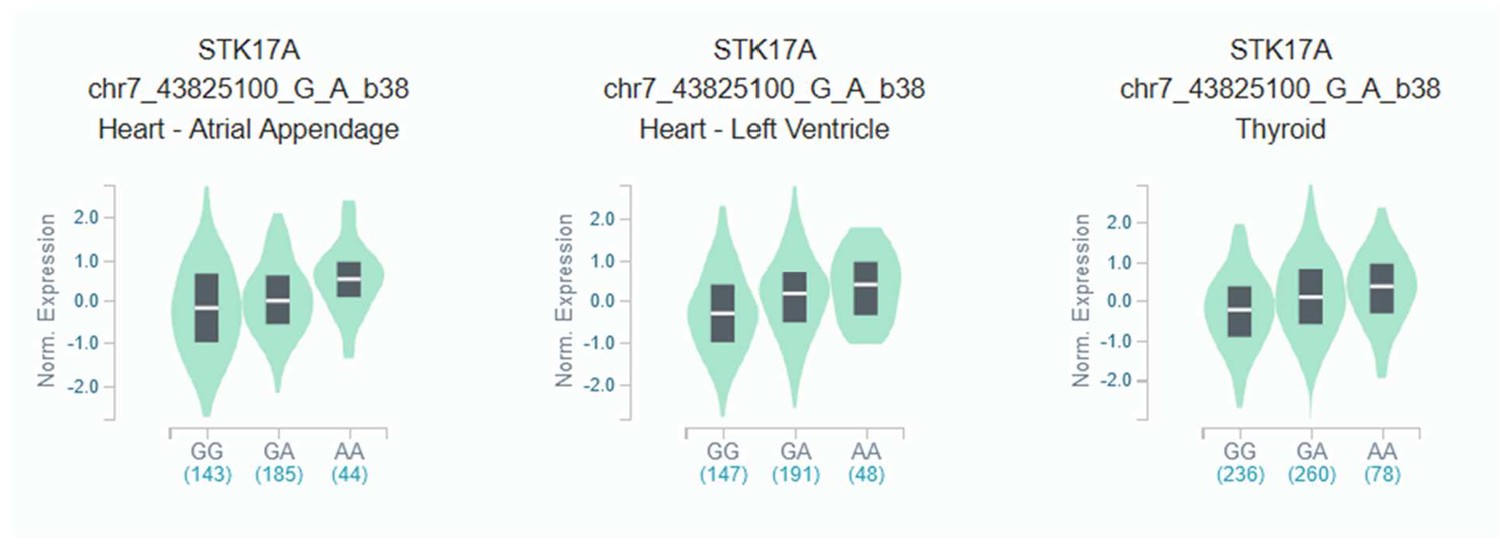
eQTL violin plot for rs623108 (chr7: 43864699) identified in a previous longevity study of the Italian population Giuliani et al., 2018b and replicated in the present study.
The rs623108-A allele correlates with rs7456688-A (moderate LD r2 = 0.58 in European populations of 1000Genomes). Data Source: GTEx Analysis Release V8.
Figure 3
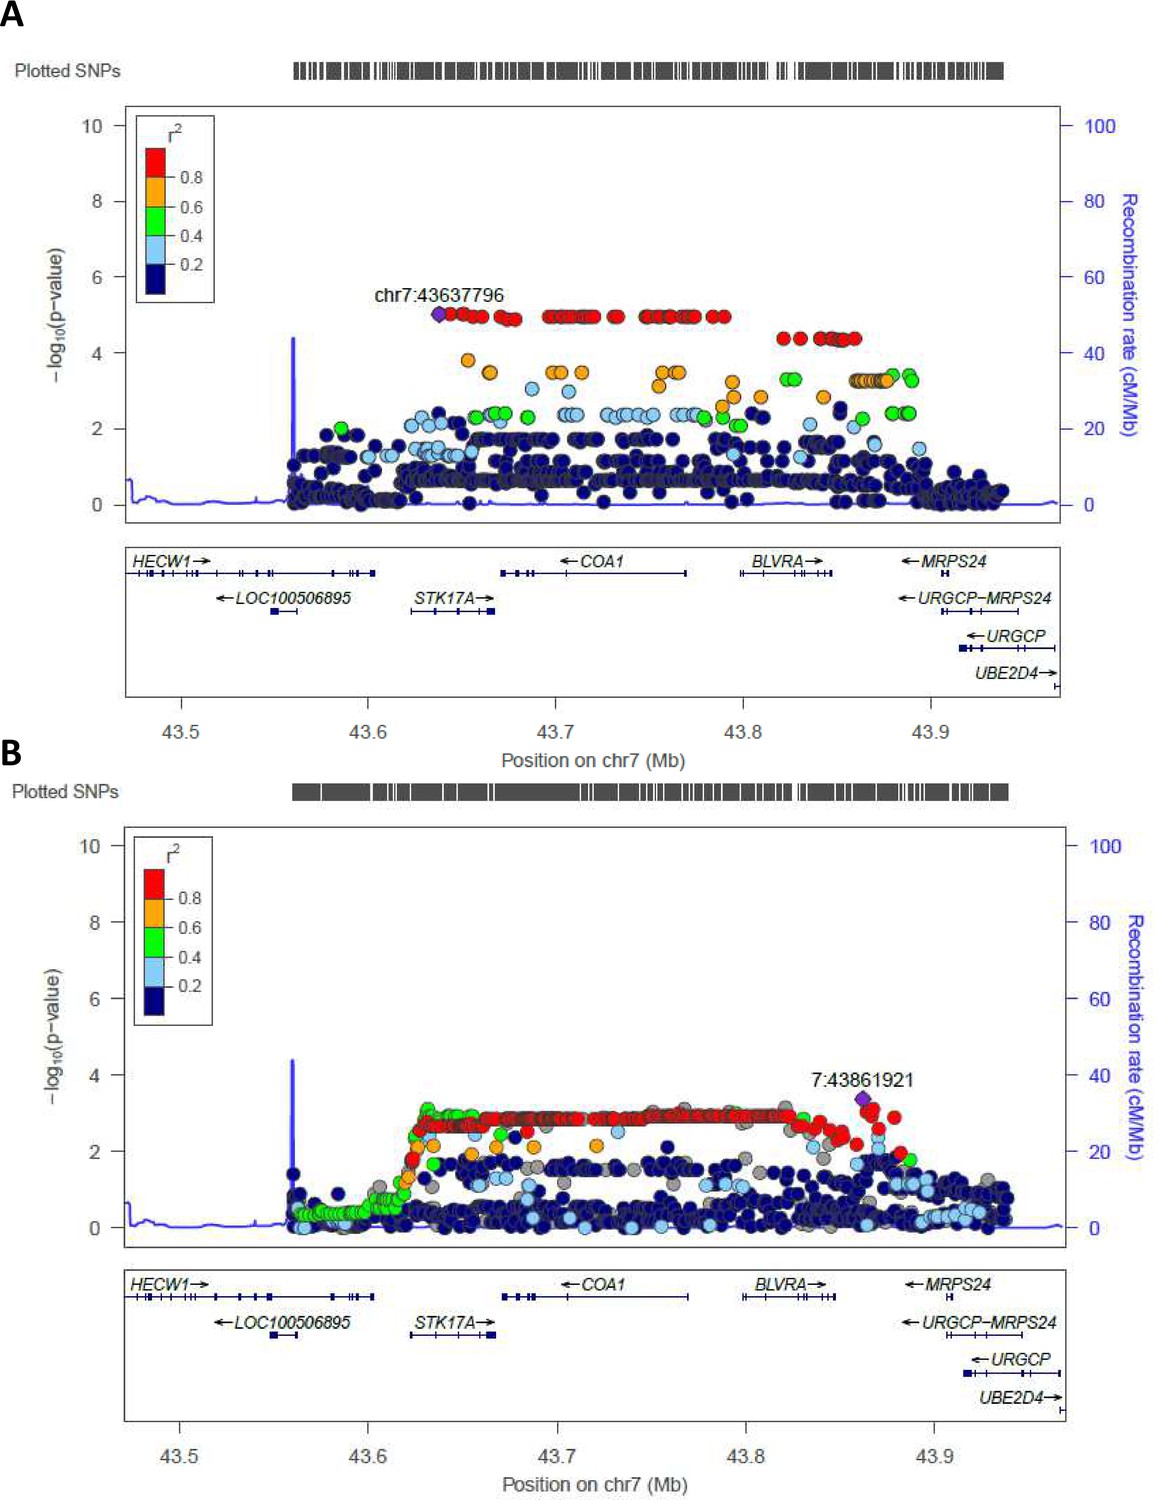
Regional association plot made by LocusZoom.
Regional plots for the most significant region comparing semi-supercentenarians and controls for the Cohort 1, that is discovery cohort (A) and for the validation cohort (B). Each point indicates the p-value for one SNP, the x-axis indicates the genomic localization of the variant and the y-axis indicates the -log10(p-value) from the association analysis. The recombination rate is plotted and indicated in the y-axis. Both plots show the same genomic positions, from chr7:43560257 to chr7:43938230 (GRCH37/hg19).
Figure 4 with 1 supplement
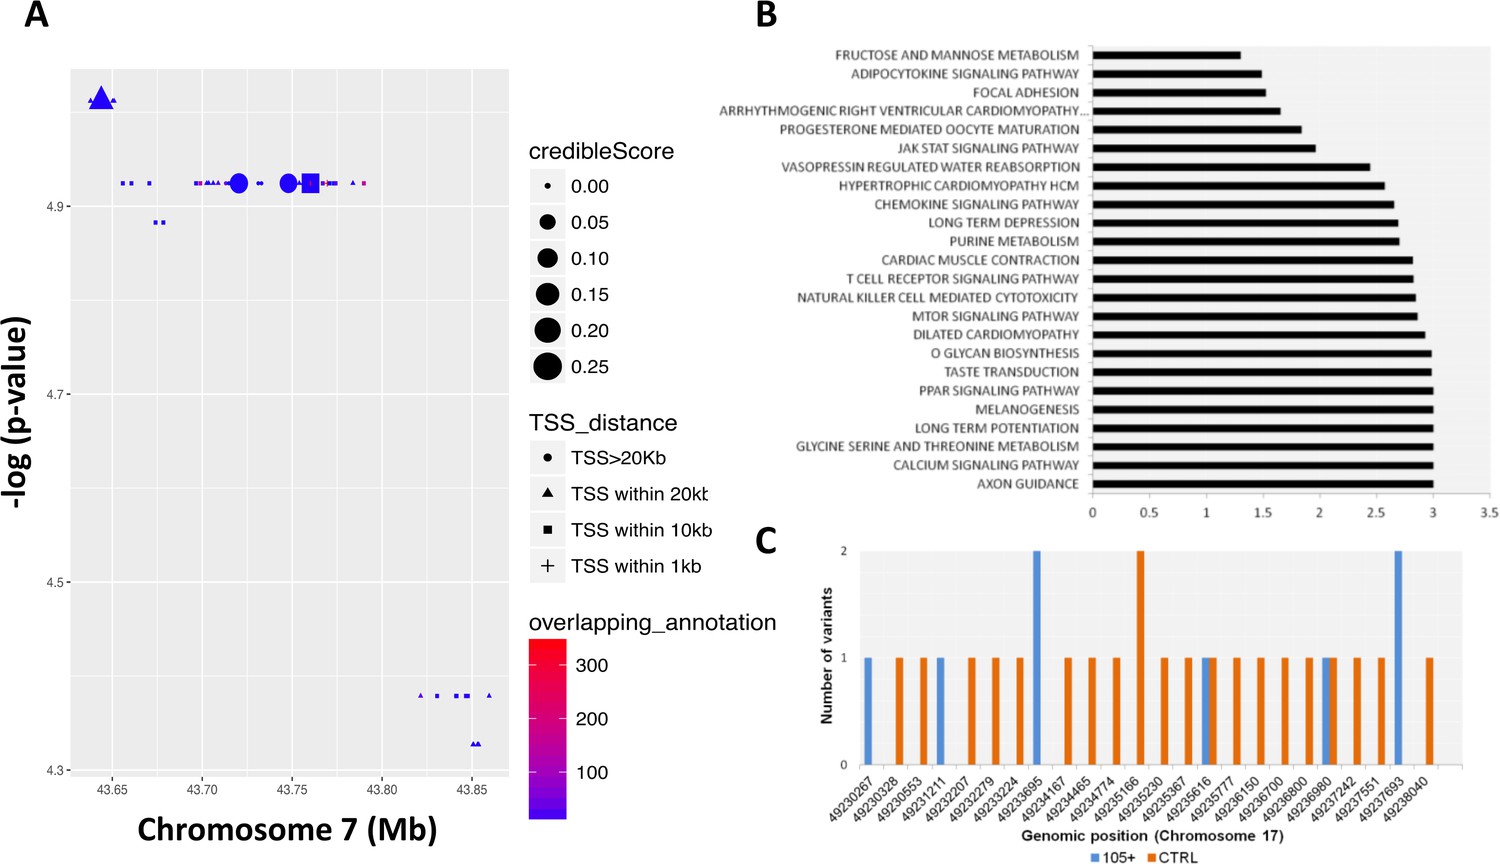
Common and rare variants analysis.
(A) Common variants in COA1 gene and output of the Bayesian model RiVIERA (Risk Variant Inference using Epigenomic Reference Annotations). The SNPs are shown as a function of their position on chromosome 7. The symbol (dot, rectangle, triangle) indicates the distance to the transcription start site (TSS). The size of the symbol reflects the credible score which exhibit an higher probability of regulatory properties. The colour (indicated as ‘overlapping_annotation’) indicates the total number of epigenomic marks that co-localize with the SNP. (B) KEGG Pathways analysis was performed using i-GSEA4GWAS. -log(FDR value) were indicating for each significant pathways (<0.01). (C) Number of rare variants in the NME1, NME1-NME2 region. Genomic positions were reported in x-axis while the number of variants for each position is reported in y-axis. The number of rare variants in 105+/110+ is reported in blue and in CTRL in orange.
Figure 4—figure supplement 1

Number of private mutations for each 105+/110+.
Y-axes reported the prevalence and x-axes the number of mutations.
Figure 5 with 2 supplements
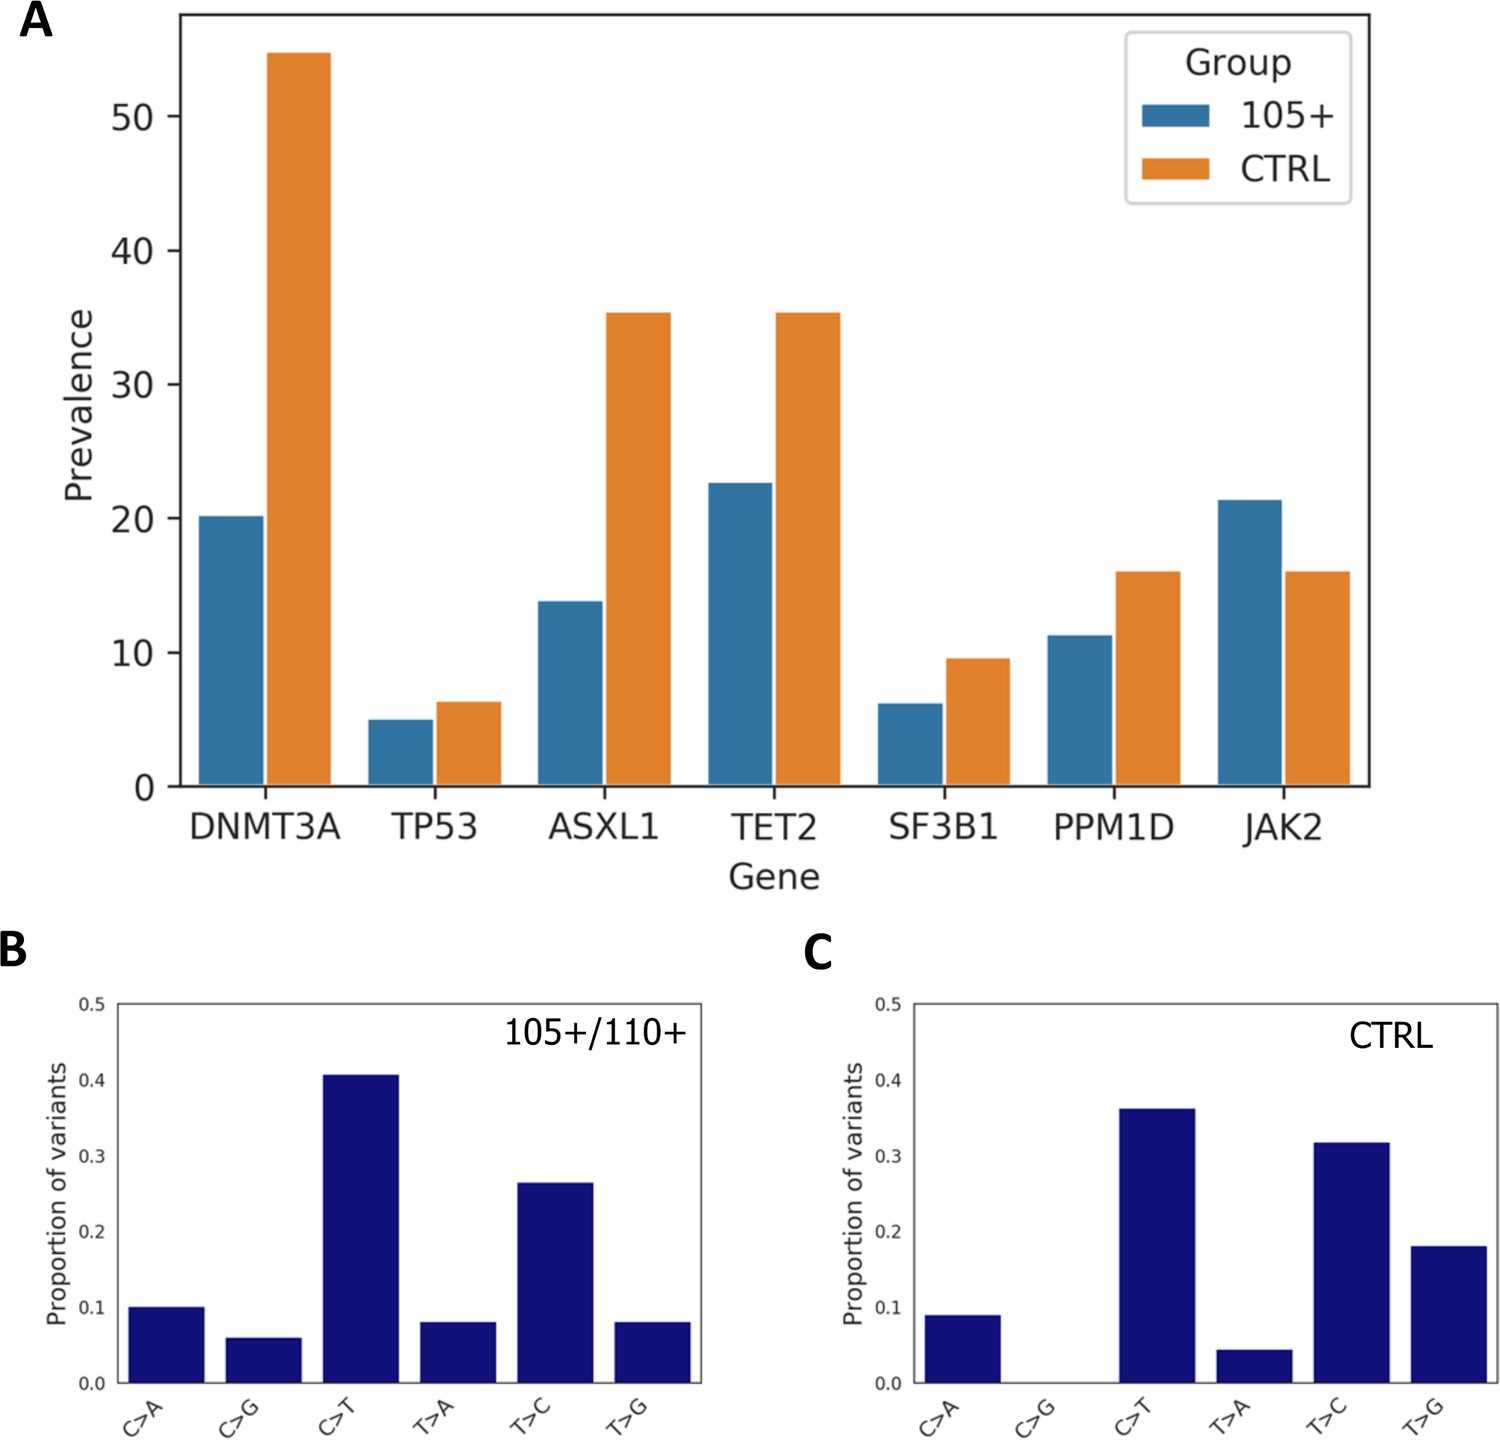
Prevalence of somatic mutations.
(A) Prevalence of somatic mutations in 105+/110+ and controls considering the seven genes analysed. (B,C) the distribution of single-nucleotide substitutions types observed in 105+/110+ and CTRL.
Figure 5—figure supplement 1

Allelic fraction distribution of the somatic mutations observed.
Figure 5—figure supplement 2
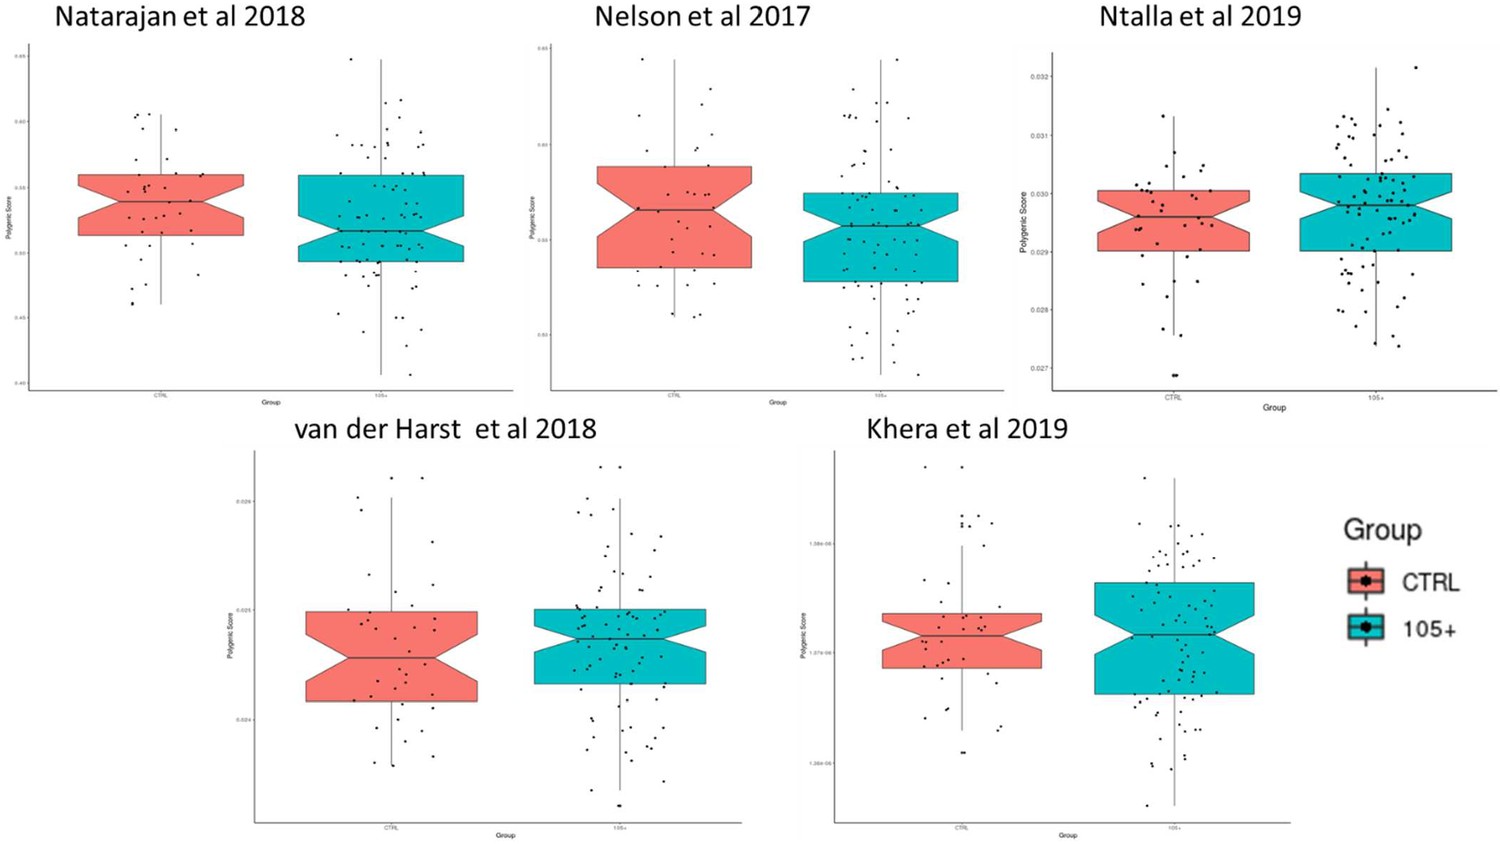
Boxplot with Polygenic risk scores (PRS) calculated according to different SNPs list identified from previous publication and applied to 105+/110+ and CTRL.
The y-axes reported the value of the score calculated in 105+/110+ (in blue) and in CTRL (in red).
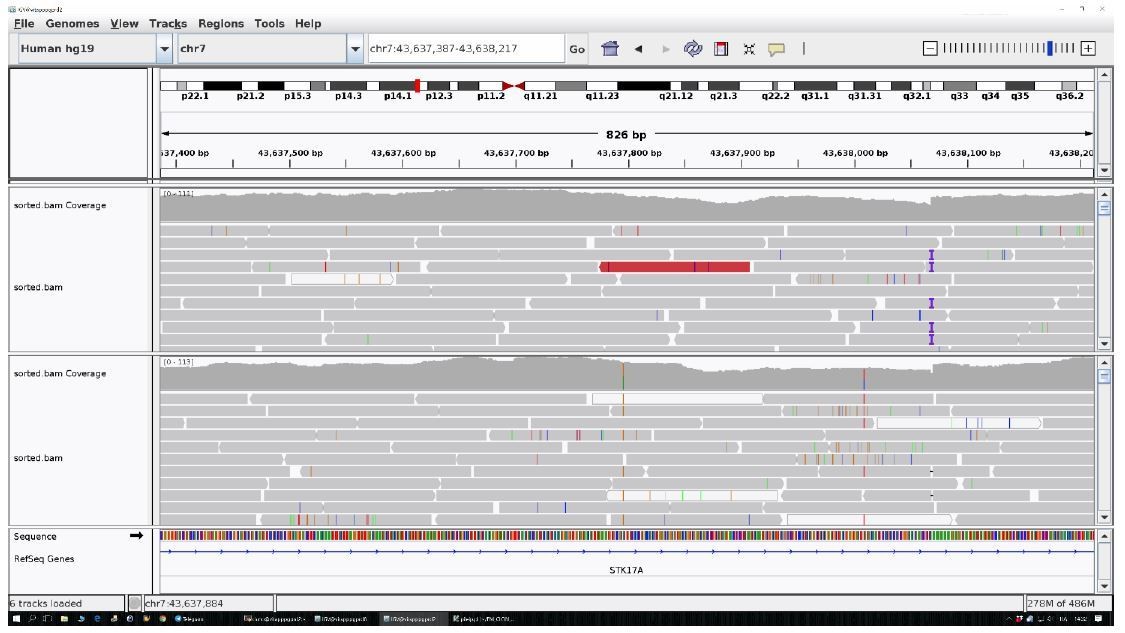
Author response image 1
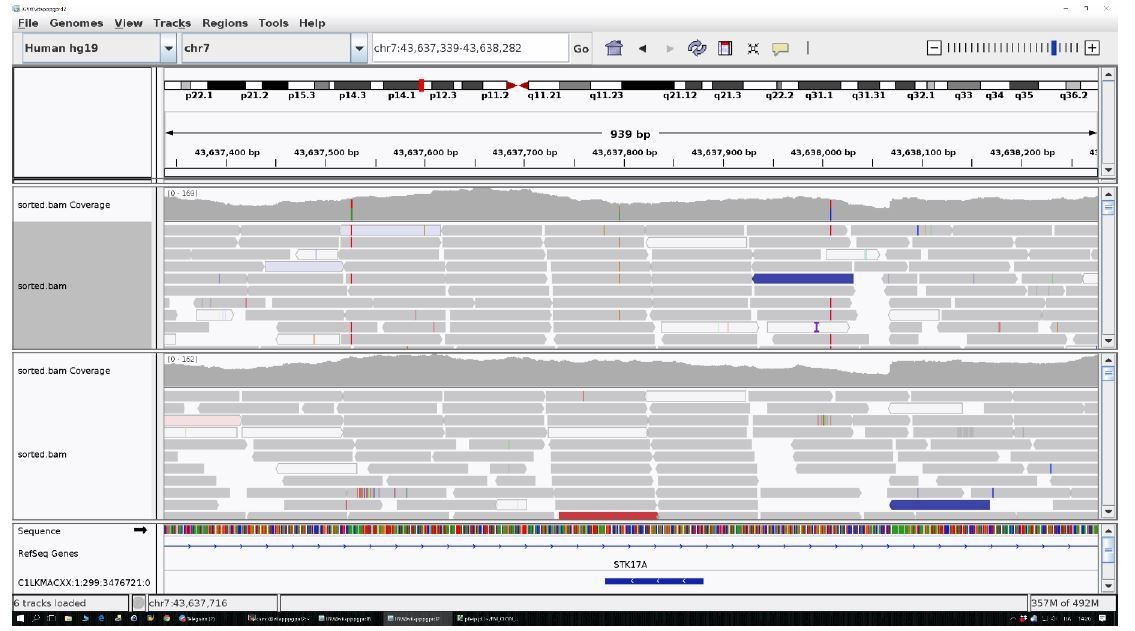
The identified area (STK17A) was reported for two centenarians as an example.
All the other data are uniform and comparable to this picture.
Author response image 2
The identified area (STK17A) was reported for two controls as an example.
All the other data are uniform and comparable to this picture.
Tables
Table 1
Common variants identified in the comparison between 105+/110+ and controls with significance at adjusted p-value 10%.
Gene name, chromosome, position (GrCH 37/hg19), rs ID, minor allele (based on whole sample), estimated odds ratio for Cohort 1, lower/upper bound of 95% confidence interval for odds ratio, nominal p-values, adjusted p-values using SLIDE method (window of 100 SNPs an 10,000 permutations) frequency in 105+/110+ s and controls and p-values in Cohort 2 were reported.
| GENE NAME | CHR | BP | dbSNP | A1 | OR | L95 | U95 | P_unadj (Cohort1) | P_adjusted SLIDE (Cohort1) | F_105 (Cohort1) | F_CTRL (Cohort1) | P_unadj (Cohort2) |
|---|---|---|---|---|---|---|---|---|---|---|---|---|
| STK17A | 7 | 43637796 | rs7456688 | A | 5.906 | 2.688 | 12.97 | 9.73*10−6 | 7.00*10−2 | 0.556 | 0.222 | 0.021 |
| STK17A | 7 | 43638009 | rs10257700 | C | 5.906 | 2.688 | 12.97 | 9.73*10−6 | 7.00*10−2 | 0.556 | 0.222 | 0.029 |
| STK17A | 7 | 43643835 | rs10279856 | G | 5.906 | 2.688 | 12.97 | 9.73*10−6 | 7.00*10−2 | 0.556 | 0.222 | 0.021 |
| STK17A,COA1 | 7 | 43650221 | rs69685881 | A | 5.906 | 2.688 | 12.97 | 9.73*10−6 | 7.00*10−2 | 0.556 | 0.222 | 0.025 |
| STK17A,COA1 | 7 | 43651047 | rs7805969 | A | 5.906 | 2.688 | 12.97 | 9.73*10−6 | 7.00*10−2 | 0.556 | 0.222 | 0.016 |
Table 2
Most significant haplotypes from each significant suggestive area emerged from the single-SNP analysis.
| Chr | Region | Haplotype | Gene | Allelic test OR | Allelic test p-value | F_105 | F_CTRL |
|---|---|---|---|---|---|---|---|
| 2 | 196515104–196992016 | GGAGCA | DNAH7 | 11.54 (3.02–65.45) | 2.34*10–05 | 0.98 | 0.82 |
| 7 | 43637796–43643835 | GTA | COA1 | 0.19 (0.1–0.36) | 4.00*10–08 | 0.35 | 0.74 |
| 7 | 43655836–43714795 | CATGATTAGTACG | COA1 | 0.18 (0.09–0.35) | 1.84*10–08 | 0.35 | 0.75 |
| 7 | 43720429–43756081 | GATGACTT | COA1 | 0.19 (0.09–0.36) | 4.05*10–08 | 0.36 | 0.75 |
| 7 | 151364264–151376555 | ACCAT | PRKAG2 | 0.13 (0.05–0.37) | 8.31*10–06 | 0.04 | 0.25 |
| 9 | 114679493–114691177 | TTATGC | UGCG | 3.23 (1.66–6.57) | 1.69*10–04 | 0.48 | 0.22 |
| 9 | 103874937–103955668 | TAA | LPPR1 | 0.13 (0.05–0.32) | 9.16*10–07 | 0.05 | 0.29 |
| 11 | 18852217–18873142 | CCTGT | . | 3.23 (1.66–6.57) | 1.69*10–04 | 0.48 | 0.22 |
| 13 | 49897577–49905581 | GCGATCG | CAB39L | 0.21 (0.09–0.44) | 1.07*10–05 | 0.10 | 0.35 |
Additional files
-
Supplementary file 1
Position identified in the comparison between 105+/110+ and CTRL with unadjusted p-values<10–4 (logistic regression adding sex as covariate).
In red are indicated the independent SNPs pruned for LD. In the last column, the p-values of the same analysis performed including PC1 and PC2 as covariates is reported.
- https://cdn.elifesciences.org/articles/57849/elife-57849-supp1-v1.pdf
-
Supplementary file 2
Gene based analysis for common variants using VEGAS (genes with a nominal pvalue <0.01 were reported).
Gene name and p-values were reported.
- https://cdn.elifesciences.org/articles/57849/elife-57849-supp2-v1.pdf
-
Supplementary file 3
GTEx analysis for the 4 SNPs rs10279856, rs3779059, rs849166, rs849175 with credible score >0 in the Riviera analysis.
- https://cdn.elifesciences.org/articles/57849/elife-57849-supp3-v1.pdf
-
Supplementary file 4
Significant (FDR < 0.05) KEGG pathways involved in longevity identified by iGSEA4GWAS software.
The analysis has been performed considering all the annotated common variants in Cohort 1.
- https://cdn.elifesciences.org/articles/57849/elife-57849-supp4-v1.pdf
-
Supplementary file 5
Significant (FDR < 0.05) GO pathways involved in longevity identified by iGSEA4GWAS software.
The analysis has been performed considering all the annotated common variants.
- https://cdn.elifesciences.org/articles/57849/elife-57849-supp5-v1.pdf
-
Supplementary file 6
Significant (FDR < 0.05) BioCarta pathways involved in longevity identified by iGSEA4GWAS software.
The analysis has been performed considering all the annotated common variants.
- https://cdn.elifesciences.org/articles/57849/elife-57849-supp6-v1.pdf
-
Supplementary file 7
Comparison of allele frequency for a subset of known longevity variants.
The allele associated with a longer lifespan is reported as ‘Protective allele’. Chromosome, position (GRCH 37/hg19), rs ID, gene name, protective allele, frequency in semi-supercentenarians, frequency in controls and nominal p-values were reported.
- https://cdn.elifesciences.org/articles/57849/elife-57849-supp7-v1.pdf
-
Supplementary file 8
Comparison between the SNPs described in Giuliani et al., 2018b to the present study.
The table reported six columns with the description of the SNP, chromosome, position in hg19, minor allele, gene name and the trend of allele frequency in different age groups as described in Giuliani et al., 2018b (Class A, B, E, and F, see legend). From columns 7–10 allele frequencies in Cohort 2 is reported as published in Giuliani et al., 2018b. The p-value of the association test performed between 105+/110+ and CTRL (Cohort 1) is reported in the last column.
- https://cdn.elifesciences.org/articles/57849/elife-57849-supp8-v1.pdf
-
Supplementary file 9
List of 5055 105+/110+ private mutations predicted as damaging in more than 4 (out of 6) database (SIFT Pred, Polyphen2 HVAR Pred, MutationTaster Pred, MutationAssessor Pred, FATHMM Pred, FATHMM MKL Coding Pred).
- https://cdn.elifesciences.org/articles/57849/elife-57849-supp9-v1.pdf
-
Supplementary file 10
Genes identified using SKAT-O method in 105+/110+ and CTRL including all rare variants (genes with a nominal pvalue <0.01 were reported).
Gene name, pvalues and the number of variants is reported.
- https://cdn.elifesciences.org/articles/57849/elife-57849-supp10-v1.pdf
-
Supplementary file 11
Genes identified using SKAT-O method in 105+/110+ and CTRL including only rare damaging variants (genes with a nominal p-value<0.01 were reported).
Genes, p-value and the number of variants is reported.
- https://cdn.elifesciences.org/articles/57849/elife-57849-supp11-v1.pdf
-
Supplementary file 12
Disruptive mutations (moderate and high impact).
Genomic position (hg19), gene name, and group in which the mutation has been identified are reported.
- https://cdn.elifesciences.org/articles/57849/elife-57849-supp12-v1.pdf
-
Supplementary file 13
List of somatic mutations identified that are reported at least seven times in hematopoietic and lymphoid malignancies using the catalogue COSMIC.
- https://cdn.elifesciences.org/articles/57849/elife-57849-supp13-v1.pdf
-
Supplementary file 14
Logistic regression calculated considering genetic risk score for each individual for Alzheimer diseases, cancer (breast, colon, lung, pancreatic, prostate), coronary disease, stroke, and type two diabetes according to Erikson et al., 2016.
- https://cdn.elifesciences.org/articles/57849/elife-57849-supp14-v1.pdf
-
Supplementary file 15
CAD genetic risk scores analyzed in Cohort 1.
- https://cdn.elifesciences.org/articles/57849/elife-57849-supp15-v1.pdf
-
Supplementary file 16
SNPs used for PRS in UK Biobank CardioMetabolic Consortium CHD Working Group et al., 2019.
- https://cdn.elifesciences.org/articles/57849/elife-57849-supp16-v1.pdf
-
Supplementary file 17
SNPs used for PRS in Natarajan et al., 2017.
- https://cdn.elifesciences.org/articles/57849/elife-57849-supp17-v1.pdf
-
Supplementary file 18
SNPs used for PRS in van der Harst and Verweij, 2018.
- https://cdn.elifesciences.org/articles/57849/elife-57849-supp18-v1.pdf
-
Supplementary file 19
SNPs used for PRS in Nelson et al., 2017.
- https://cdn.elifesciences.org/articles/57849/elife-57849-supp19-v1.pdf
-
Transparent reporting form
- https://cdn.elifesciences.org/articles/57849/elife-57849-transrepform-v1.pdf
Download links
A two-part list of links to download the article, or parts of the article, in various formats.
Downloads (link to download the article as PDF)
Open citations (links to open the citations from this article in various online reference manager services)
Cite this article (links to download the citations from this article in formats compatible with various reference manager tools)
Whole-genome sequencing analysis of semi-supercentenarians
eLife 10:e57849.
https://doi.org/10.7554/eLife.57849


