Pupil diameter encodes the idiosyncratic, cognitive complexity of belief updating
- Departments of Neursocience, University of Pennsylvania, United States
- Departments of Psychology, University of Pennsylvania, United States
- Departments of Computational Neuroscience Initiative, University of Pennsylvania, United States
Figures
Figure 1
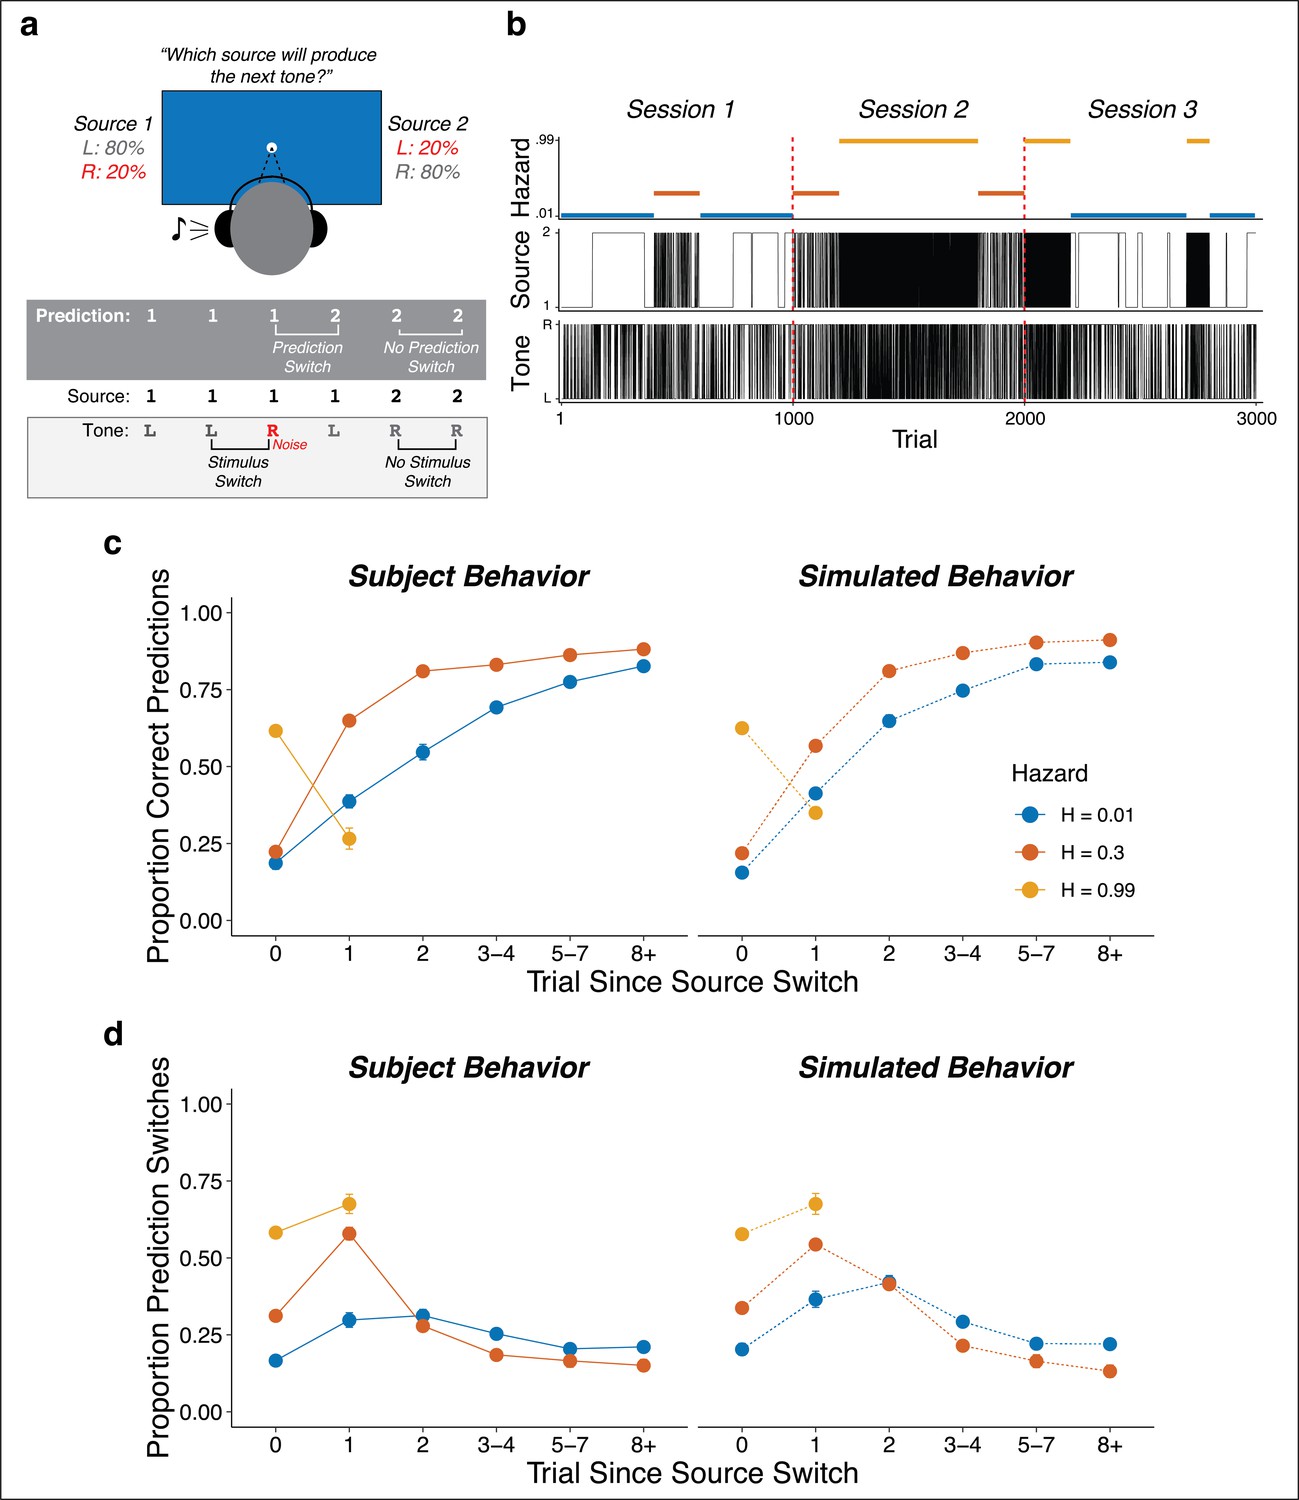
Auditory predictive-inference task and average performance.
(a) Subjects predicted which of two sources would generate a tone on the next trial. After making the prediction, a tone was played in either the left or right ear. (b) Subjects completed up to three sessions of 1000 trials each. In each session, subjects were exposed to two hazard rates that would change at unannounced points throughout the session. (c) Proportion of subject and simulation correct predictions as a function of trials after a source-location switch, separated by hazard rate. (d) Proportion of subject and simulation prediction switches (i.e., changing their prediction from the previous trial) for trials after a source switch, separated by hazard rate. Simulated behavior was generated from the Bayesian learning model fit to data from individual subjects and applied to the same sequences observed by each subject. Error bars in c, d are ± SEM across real or simulated subjects.
Figure 2 with 2 supplements

Pupil size encoded violations of expectations.
(a) Sequence of tone and prediction events. (b–d) Each panel shows two-tailed linear mixed-effects beta weights with binary regressors corresponding to whether or not subjects switched their prediction and whether or not the tone switched sides on that trial, for: (b) baseline pupil diameter from the current trial, before the subject heard the tone and made the next prediction; (c) baseline pupil diameter from the next trial, after the subject heard the tone and made a prediction; and (d) changes in pupil diameter from baseline in a 2 s period after tone onset. In a and b, the regressions accounted for the evoked pupil change from the previous trial; boxplots show median, IQR, IQR x 1.5, and outliers; **: p<0.01, ***: p<0.001 estimated from linear regressions. In c, the regressions accounted for baseline pupil on the current trial along with the evoked pupil and baseline from the previous trial; lines and shading correspond to mean ± SEM across subjects, and straight lines above (for positive betas) and below (for negative betas) beta values indicate significant timepoints (FWE corrected p<0.05).
Figure 2—figure supplement 1
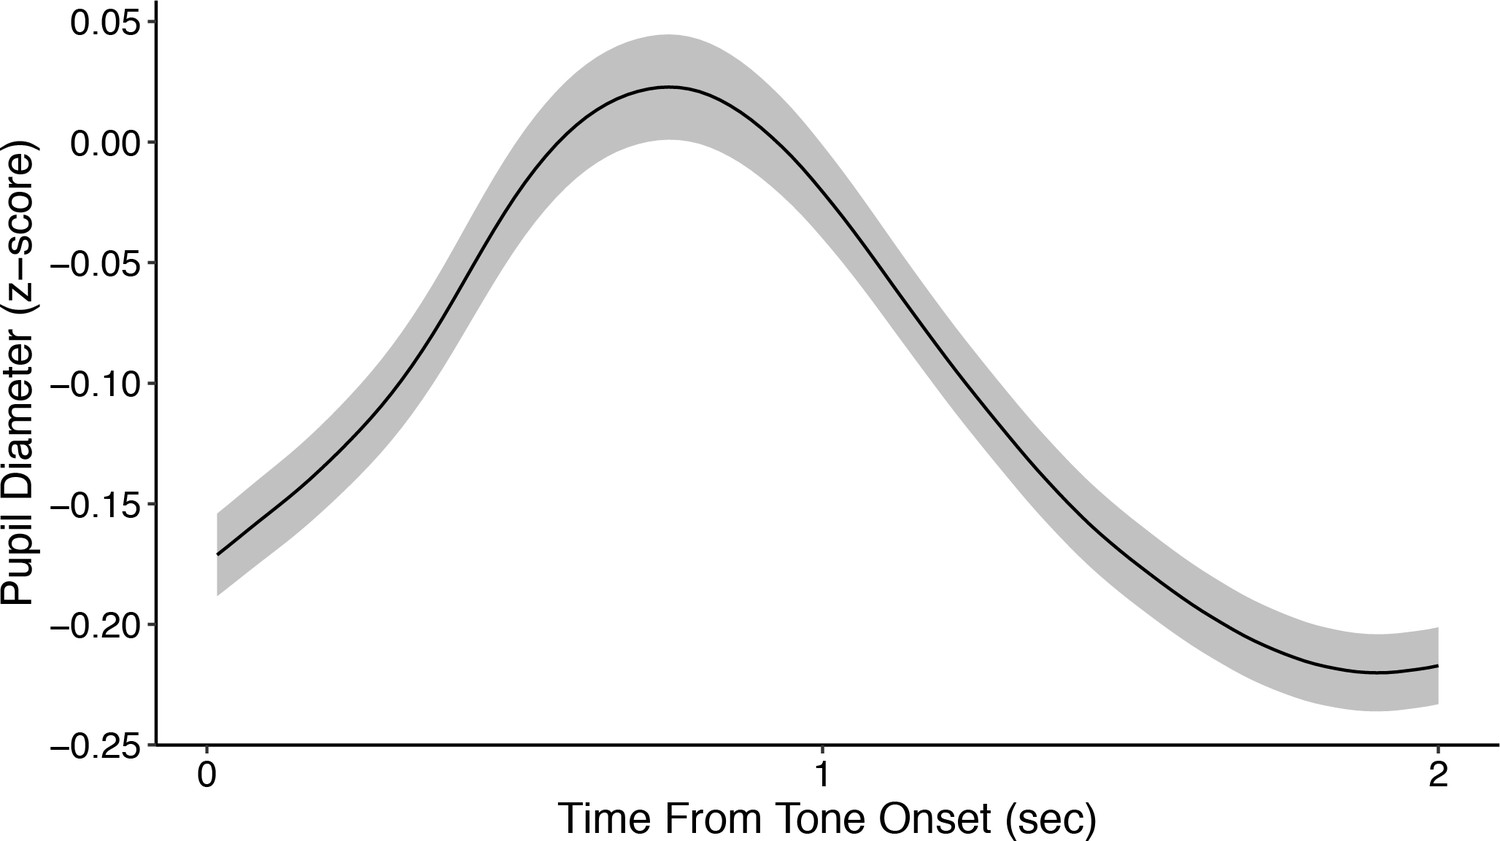
Average z-scored pupil diameter from tone onset across all subjects.
Shading corresponds to mean ± SEM of the per-subject average pupil diameter. Pupil diameter was z-scored per session using data from both before and after tone onset, which accounts for the largely negative values shown here.
Figure 2—figure supplement 2
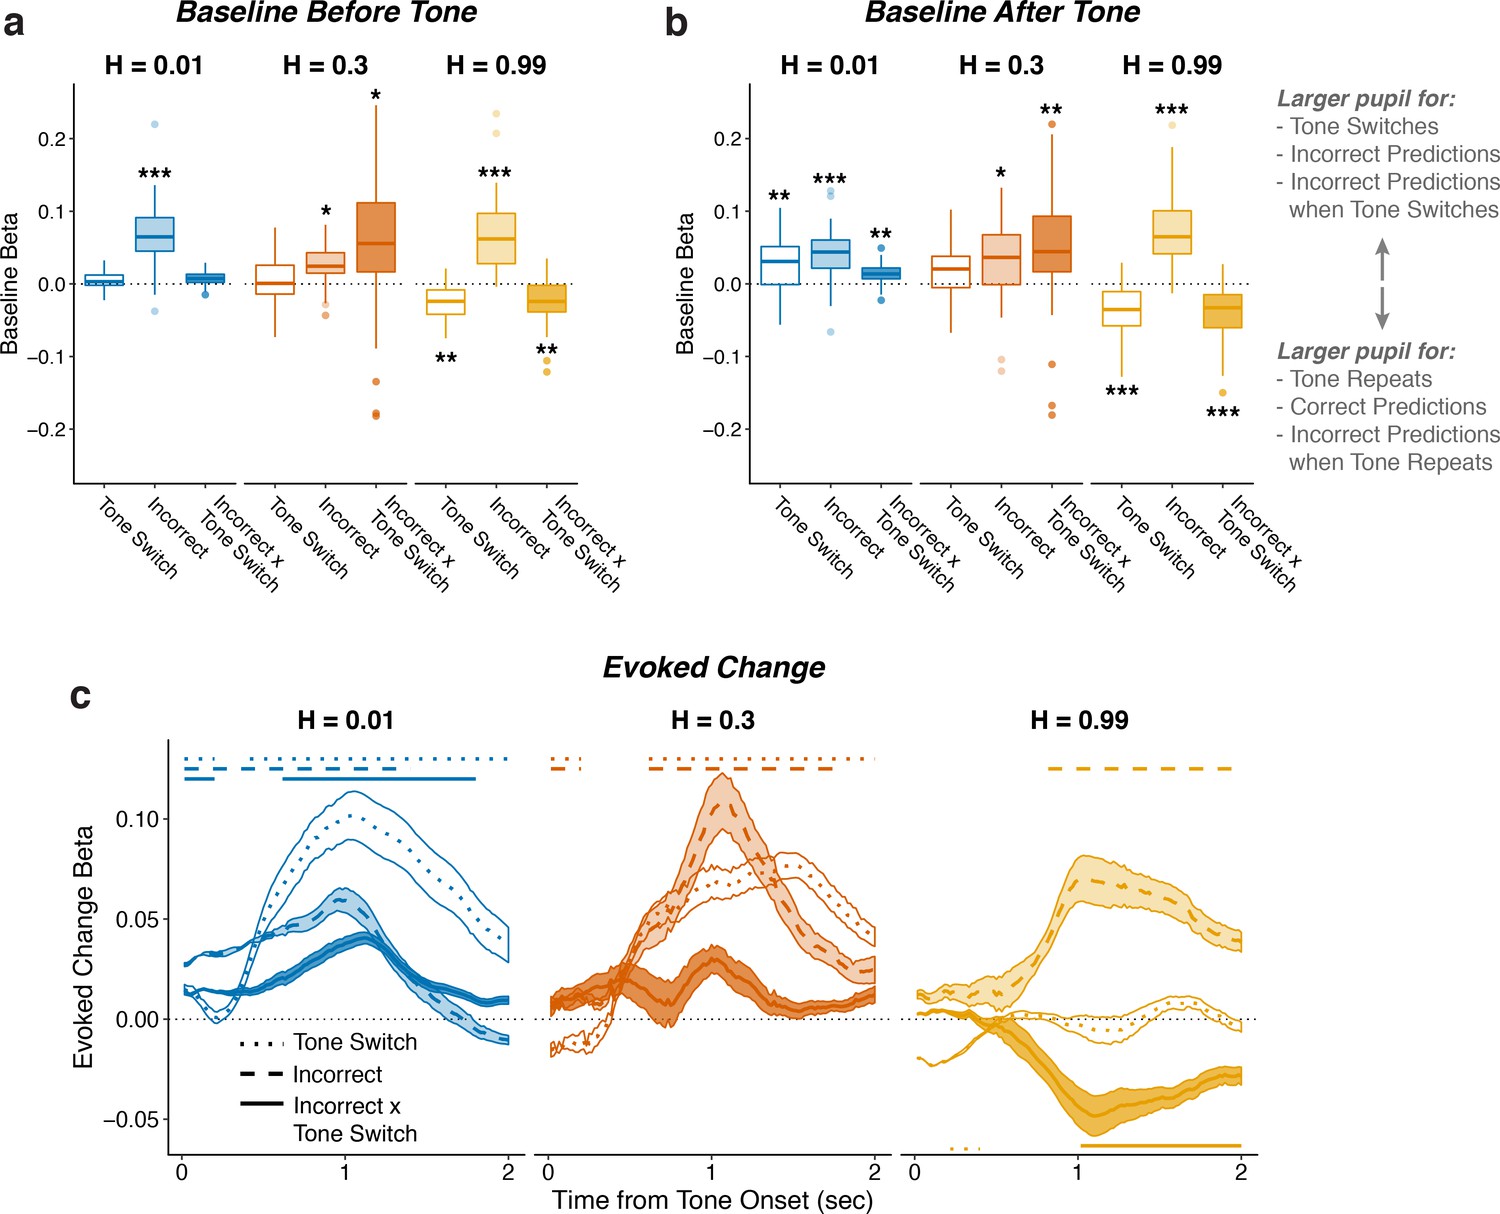
Pupil encodes information about tone switches and prediction errors.
Two-tailed linear mixed-effects beta weights relating whether tones would switch from the previous trial, whether participants made incorrect predictions, and the tone switch-by-incorrect interaction for each hazard rate, for a) baseline (100 ms prior to tone onset) pupil diameter from the current trial, (b) baseline pupil diameter from the next trial, and (c) evoked changes in pupil diameter in sliding windows 0–2 s after tone onset. In a and b, the regressions accounted for the evoked pupil change from the previous trial; boxplots show median, IQR, IQR x 1.5, and outliers; **: p<0.01, ***: p<0.001 estimated from linear regressions. In c, the regressions accounted for baseline pupil on the current trial along with the evoked pupil and baseline from the previous trial; lines and shading correspond to mean ± SEM across subjects, and straight lines above beta values indicate significant timepoints (FWE corrected p<0.05).
Figure 3 with 3 supplements
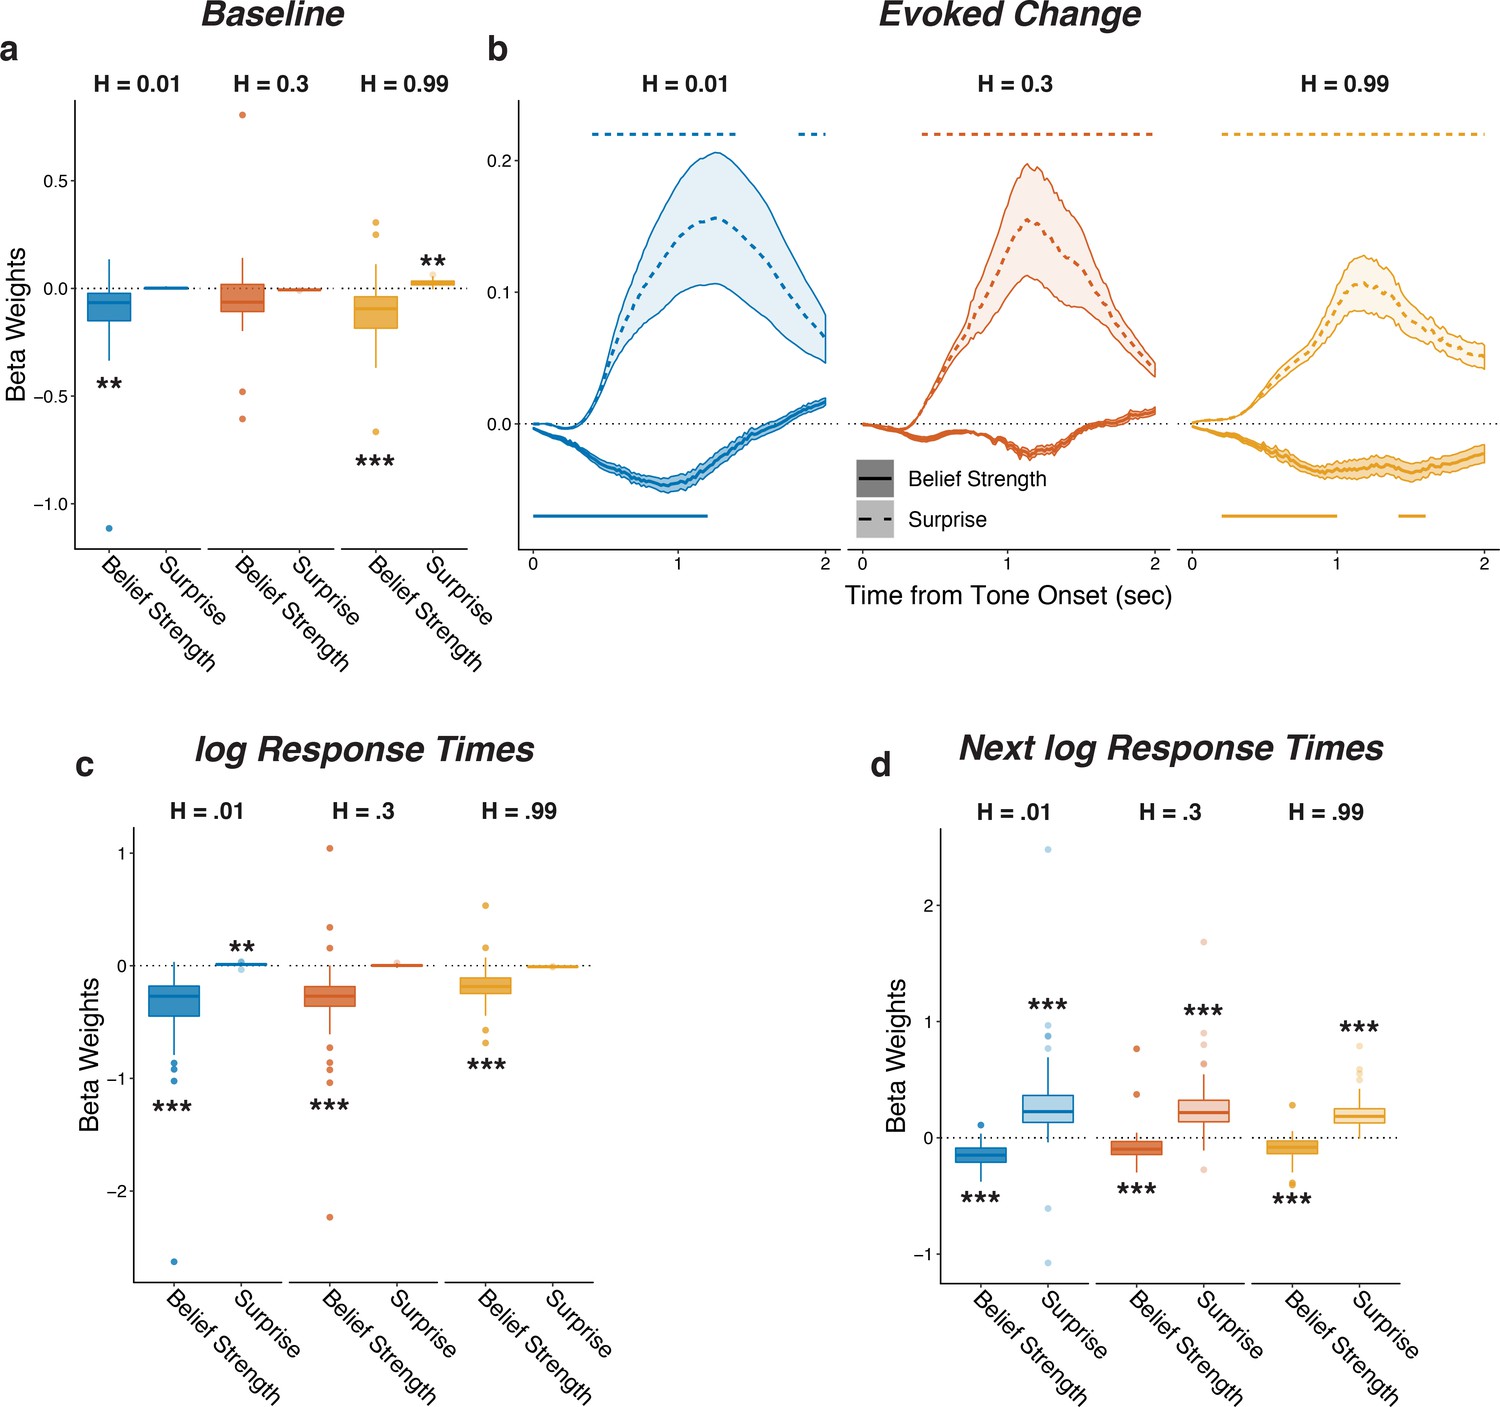
Pupil size encoded belief strength and surprise.
Each panel shows two-tailed linear mixed-effects beta weights estimating the influence of subject absolute belief strength and surprise on: (a) baseline pupil diameter, after accounting for the evoked pupil change from the previous trial; (b) evoked change in pupil diameter, after accounting for baseline pupil on the current trial along with the baseline pupil and the evoked pupil from the previous trial; (c) log RT (i.e., the time taken to make a prediction before hearing the tone); and (d) log RT on the next trial. Note that surprise depended on the current belief strength that was present before tone onset, which likely explains the small modulations by surprise in the high-hazard baseline pupil and low-hazard prediction RT. In a, c, and d, boxplots show median, IQR, IQR x 1.5, and outliers; **: p<0.01, ***: p<0.001. In b, lines and shading correspond to mean ± SEM across subjects, and straight lines above (for positive betas) and below (for negative betas) beta values indicate significant timepoints (FWE corrected p<0.05).
Figure 3—figure supplement 1
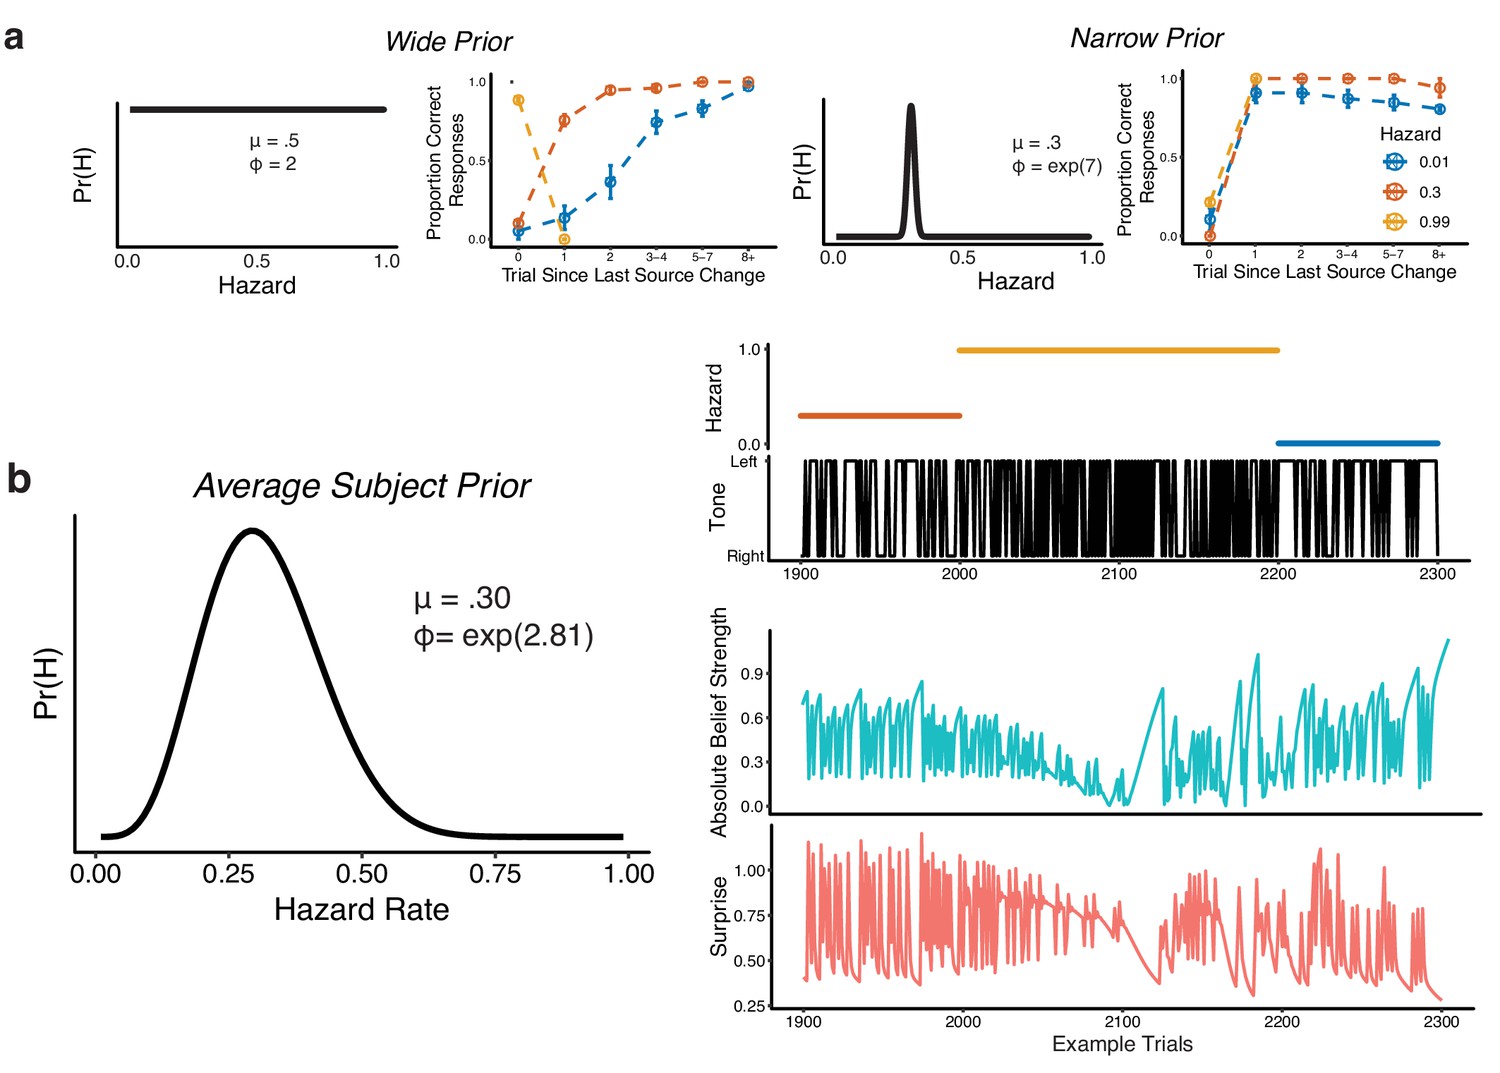
Bayesian model used to compute belief strength and surprise.
(a) Simulations from the Bayesian learning model with a wide prior (left panels) or a narrow prior (right panels) over hazard rate. For each pair of panels, the left panel shows the prior over hazard rate (governed by two parameters, as shown: mean μ and precision ϕ), and the right panel shows performance versus the number of trials since the previous change-point, separated by hazard rate (as in Figure 1c,d). Points and error bars correspond to mean ± SEM across simulated subjects. (b) Average subject prior computed from fits of the Bayesian learning model to subject-specific behavioral data and the corresponding absolute belief strength (teal) and surprise values (pink) for 400 example trials (the tone location and hazard rate are shown above).
Figure 3—figure supplement 2
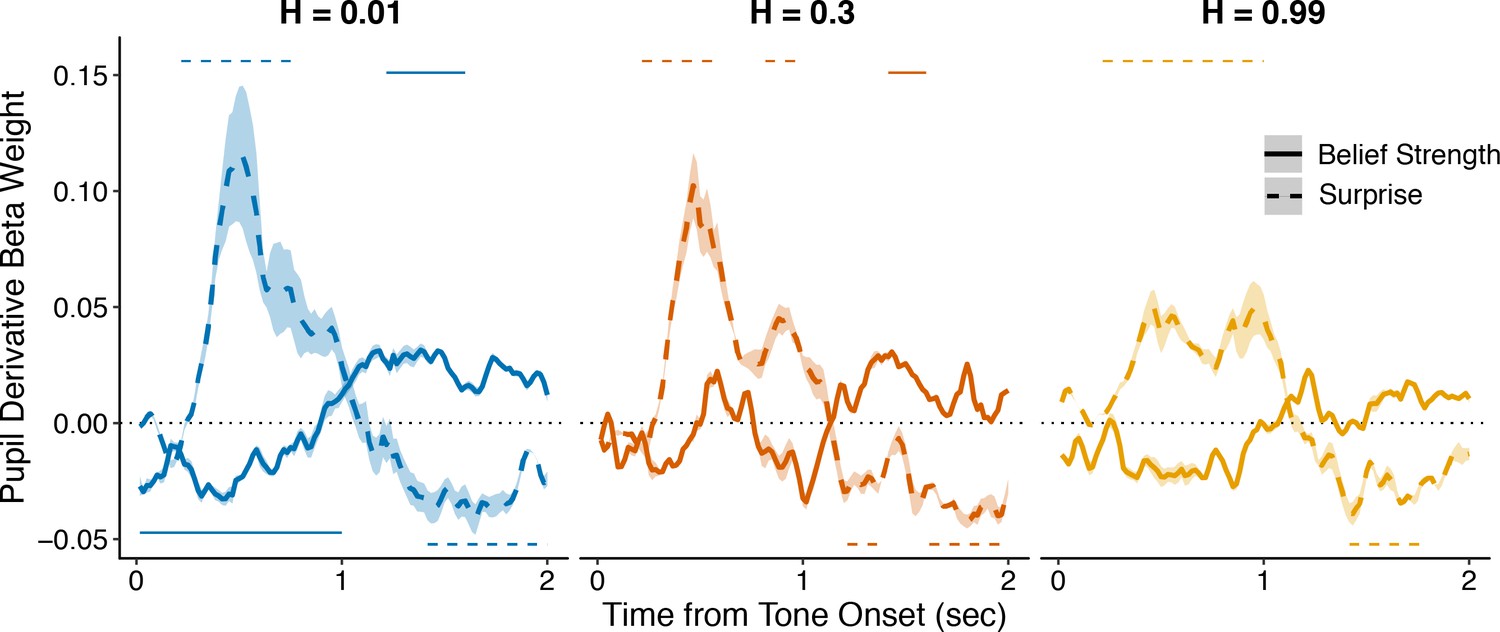
Complimentary analysis to Figure 3b measuring the influence of belief strength and surprise on the first temporal derivative of evoked changes in pupil diameter.
An approximation of the first temporal derivative was measured as the signed difference between each timepoint after tone onset and the previous timepoint. All regressions were performed with baseline pupil diameter from the current trial, and baseline and evoked changes in pupil diameter from the previous trial, as nuisance regressors. Lines and shading correspond to mean ± SEM across subjects, and straight lines above (for positive betas) and below (for negative betas) beta values indicate significant timepoints (FWE corrected p<0.05).
Figure 3—figure supplement 3
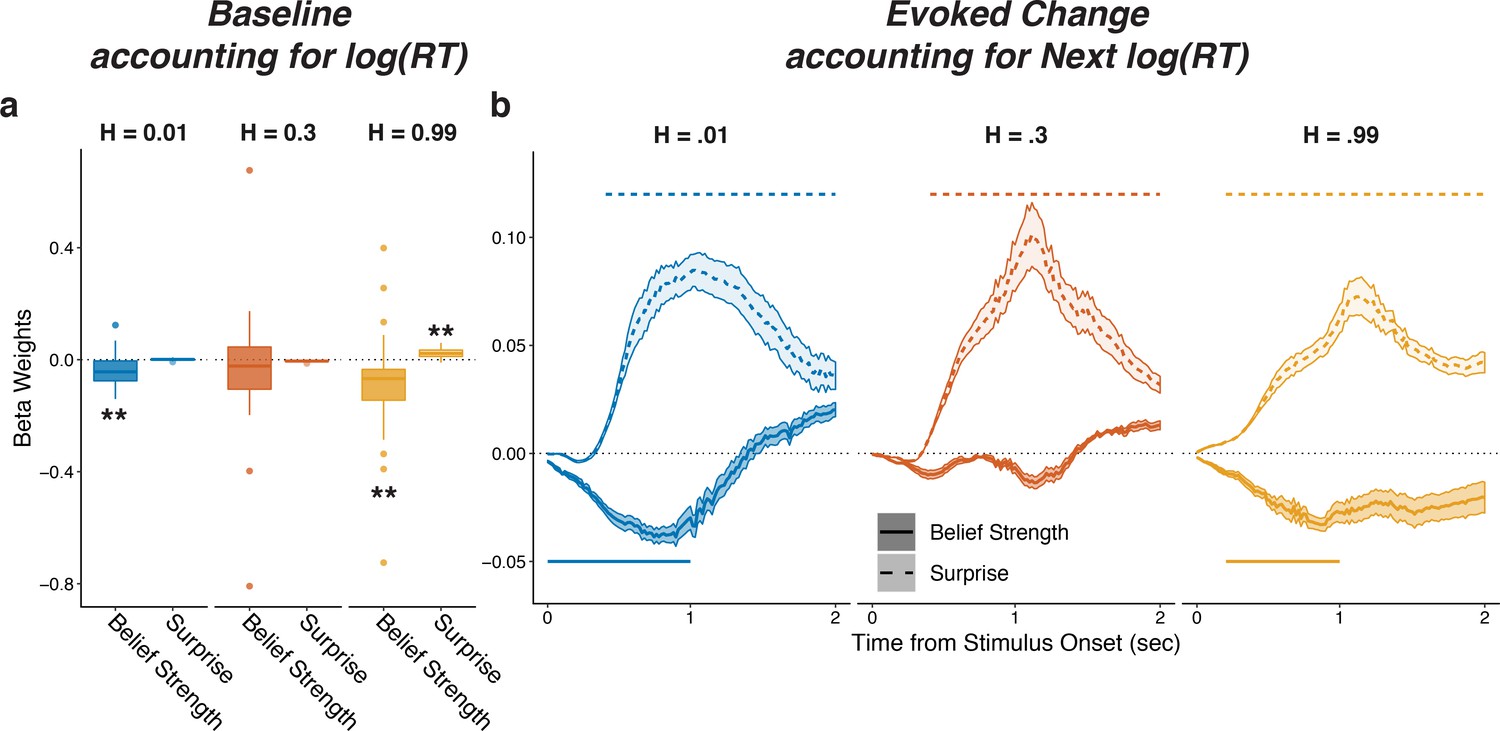
Pupils encode belief strength and surprise independently of RT.
Linear mixed-effects beta weights estimating the influence of subject absolute belief strength and surprise on: (a) baseline pupil diameter, after accounting for log RT on the current trial and the previous evoked pupil change; and (b) evoked change, after accounting for log RT on the next trial and baseline pupil on the current trial and baseline pupil and evoked from the previous trial. In a, solid horizontal lines, hinges, whiskers, and points correspond to median, interquartile range, interquartile x 1.5, and outliers, respectively; **: p<0.01, ***: p<0.001. In b, lines and shading correspond to mean ± SEM across subjects, and straight lines above (for positive betas) and below (for negative betas) beta values indicate significant timepoints (FWE corrected p<0.05).
Figure 4 with 2 supplements
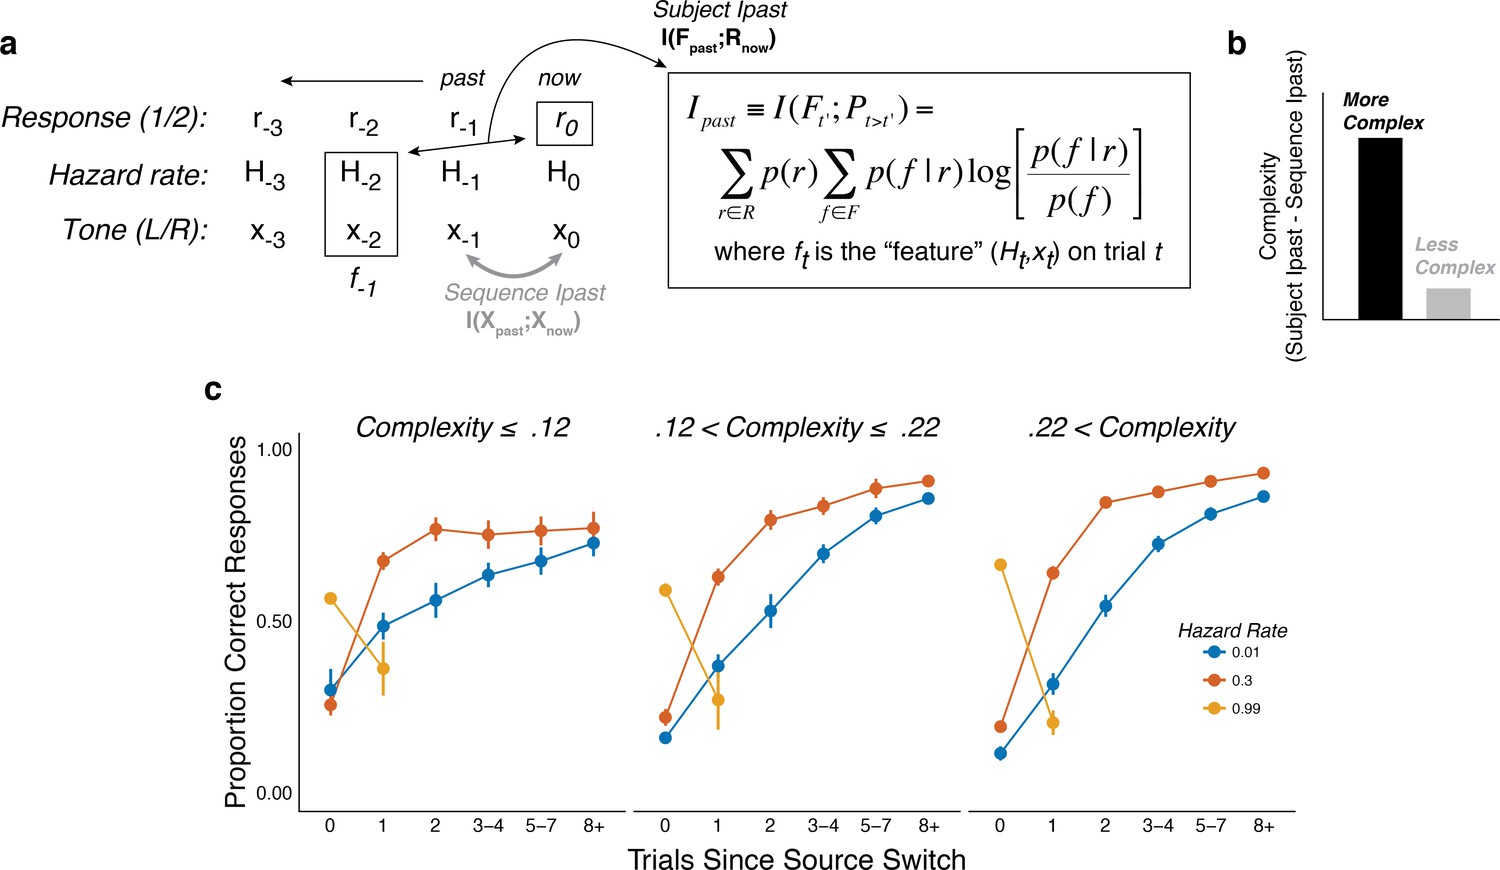
The subjects differed in belief-updating complexity.
(a) The information-bottleneck measure of complexity, computed as the mutual information between past task features (the combination of the binary tone location, x, and hazard rate, H, from previous trials) and the current binary prediction, r. (b) To account for idiosyncratic differences in the sequences of tones that each subject heard, the mutual information between adjacent tones in the actual sequence (‘Sequence Ipast’) was subtracted from their respective model complexity. The result corresponds to the degree to which subjects encoded hazard-related information in their predictions. (c) Average task performance plotted for groups of subjects split by complexity tercile (in bits). Subjects with more complex belief-updating strategies showed stronger hazard-modulated behavior.
Figure 4—figure supplement 1
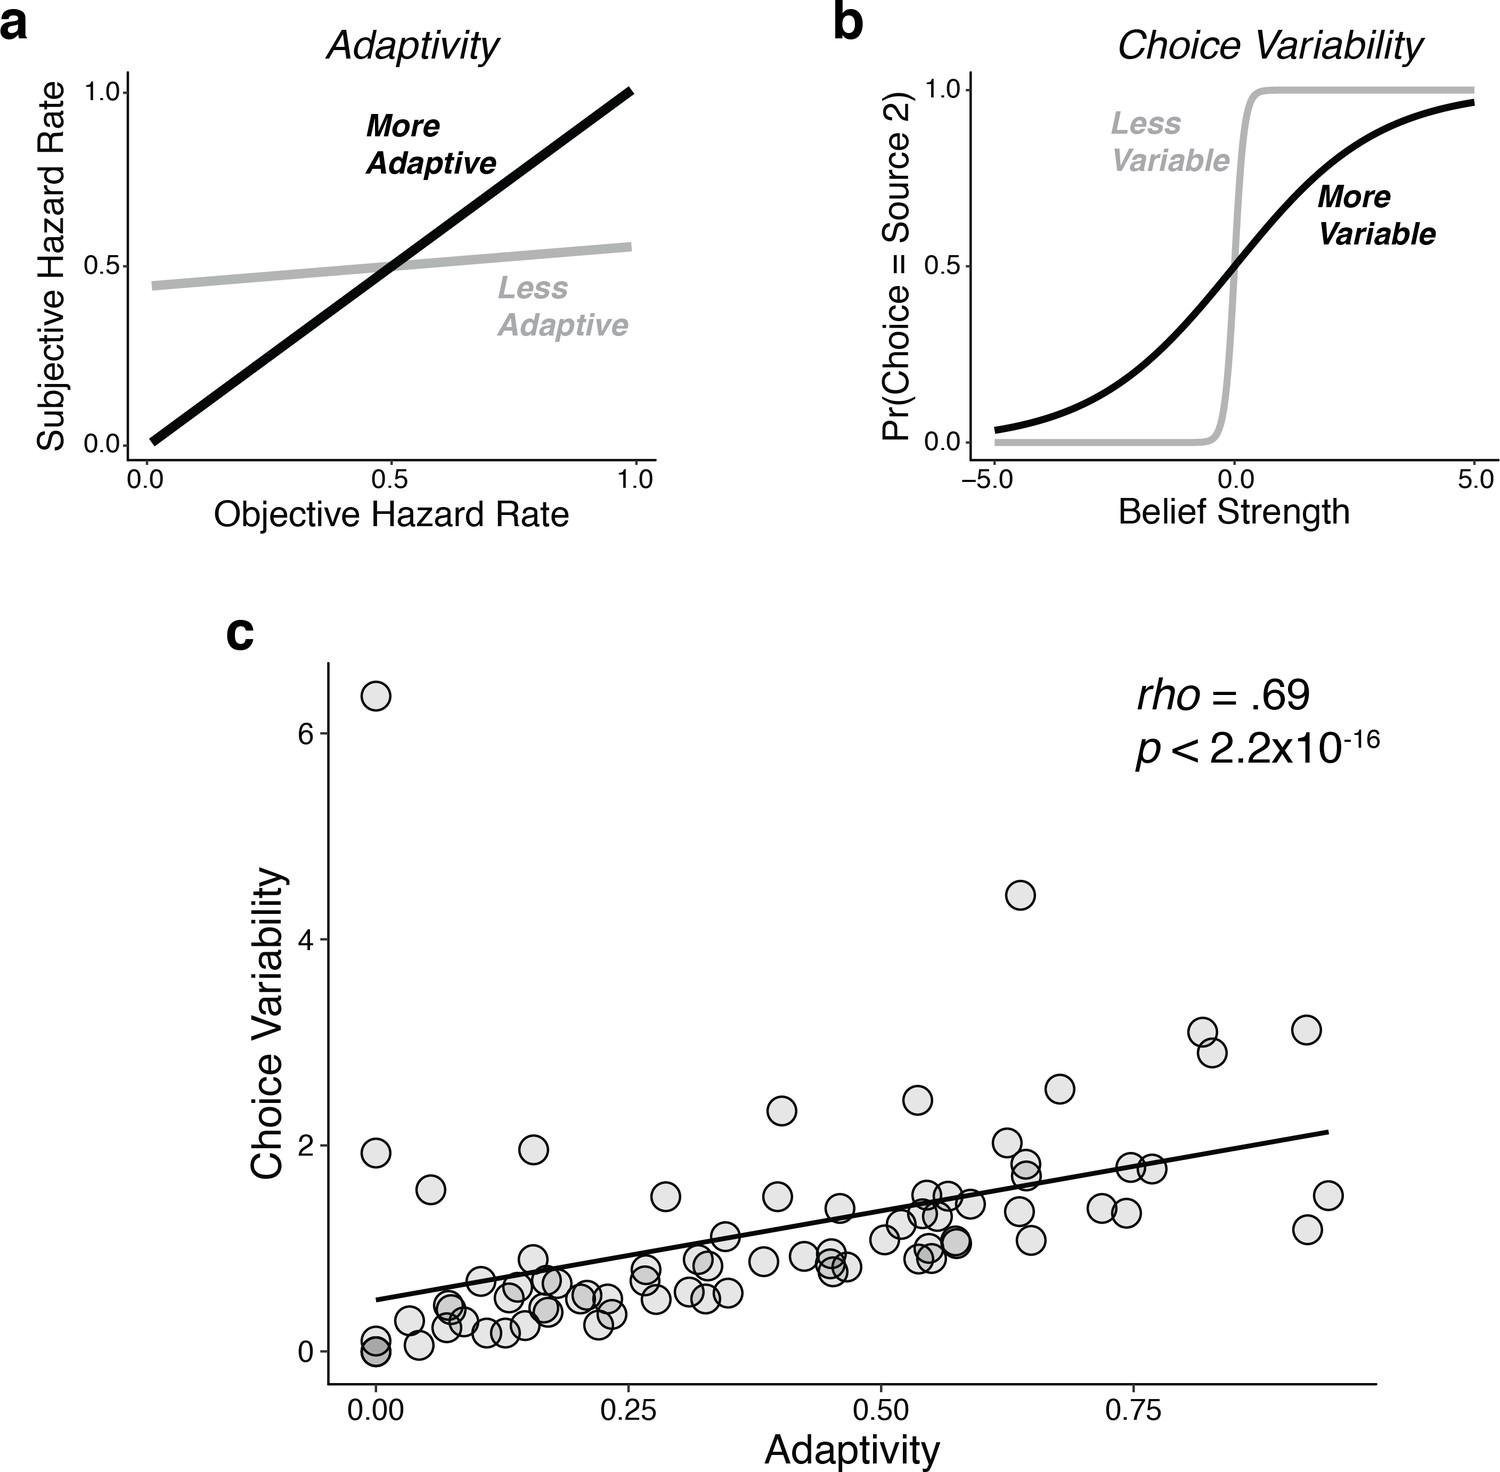
Individual differences in performance reflected a bias-variance trade-off, similar to what we reported previously (Glaze et al., 2018).
Using fits of the adaptivity model to each subject’s behavioral choices, we quantified: (a) adaptivity as the linear relationship between subjective (fit) and objective hazard rate, such that higher adaptivity implies lower ‘bias’ (i.e., an increased ability to adapt to real changes in the hazard-rate condition); and (b) choice variability as the slope of the psychometric function relating choices to belief strength, such that higher variability implies higher ‘variance’ (i.e., a propensity to over-adjust beliefs to different stimulus sequences, even when the hazard rate remained unchanged). (c) There was a strong, positive relationship between choice variability and adaptivity across subjects, such that subjects with higher adaptivity (lower bias) tended also to have higher choice variability (higher variance). The line is a linear fit.
Figure 4—figure supplement 2
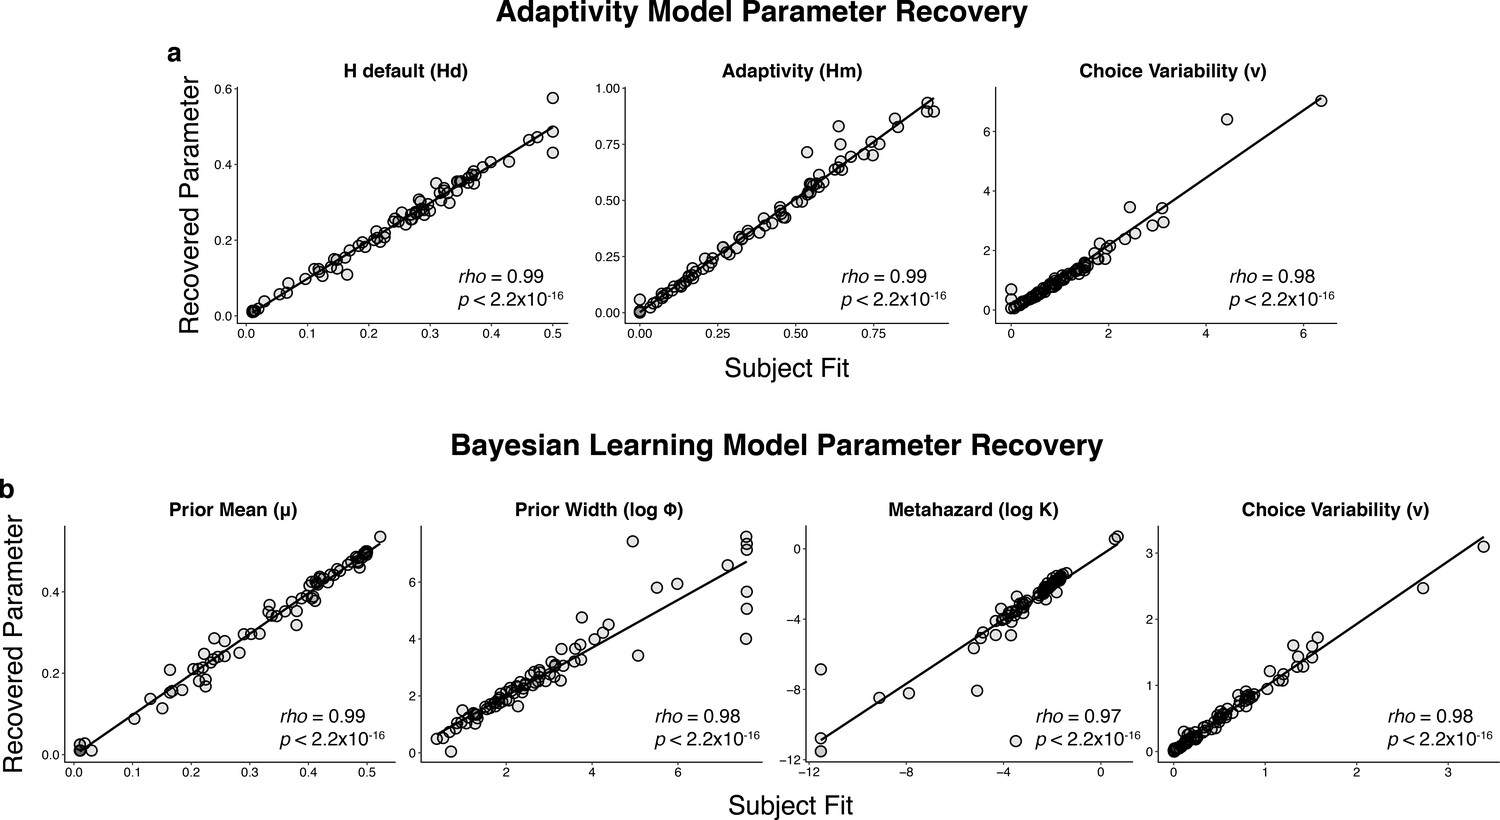
Parameter recovery for the: (a) adaptivity model and (b) Bayesian learning model.
Parameter recovery was performed by simulating responses using subject fits (abscissa) and examining the parameters recovered when fitting those simulated responses (ordinate).
Figure 5
Individual differences in belief-updating complexity were reflected in across-hazard modulations of baseline, but not evoked, pupil diameter.
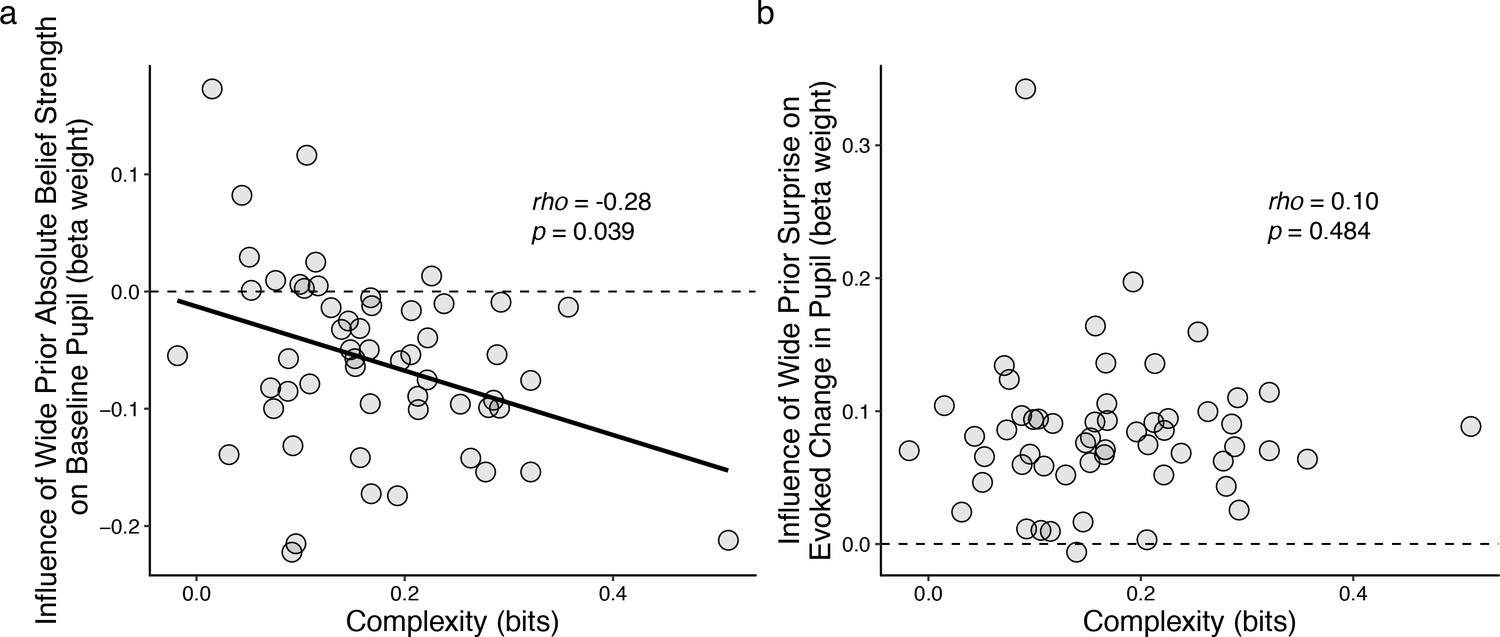
(a) Strength of modulation of baseline pupil diameter by absolute belief strength from the complex learning model plotted as a function of the subject’s belief-updating complexity. Subjects using simple strategies tended to have baseline pupil dynamics that were uncorrelated with the complex model’s belief-updating process, whereas subjects using complex strategies tended to have baseline pupil dynamics that were anti-correlated (i.e., pupils were less dilated when the model predicted higher belief certainty) with the complex model’s belief-updating process. The solid line is a linear fit. (b) Strength of modulation of peak evoked changes from baseline by surprise from the complex learning model plotted as a function of the subject’s belief-updating complexity. Evoked changes in pupil diameter tended to be modulated positively by surprise in the complex model, regardless of the subject’s belief-updating complexity. Points correspond to data from individual subjects. In both panels, the ordinates show the strength (computed via linear regression) of pupil modulations with respect to a particular, complex belief-updating strategy: the Bayesian model with a wide prior on hazard (Figure 3—figure supplement 1).
Figure 6
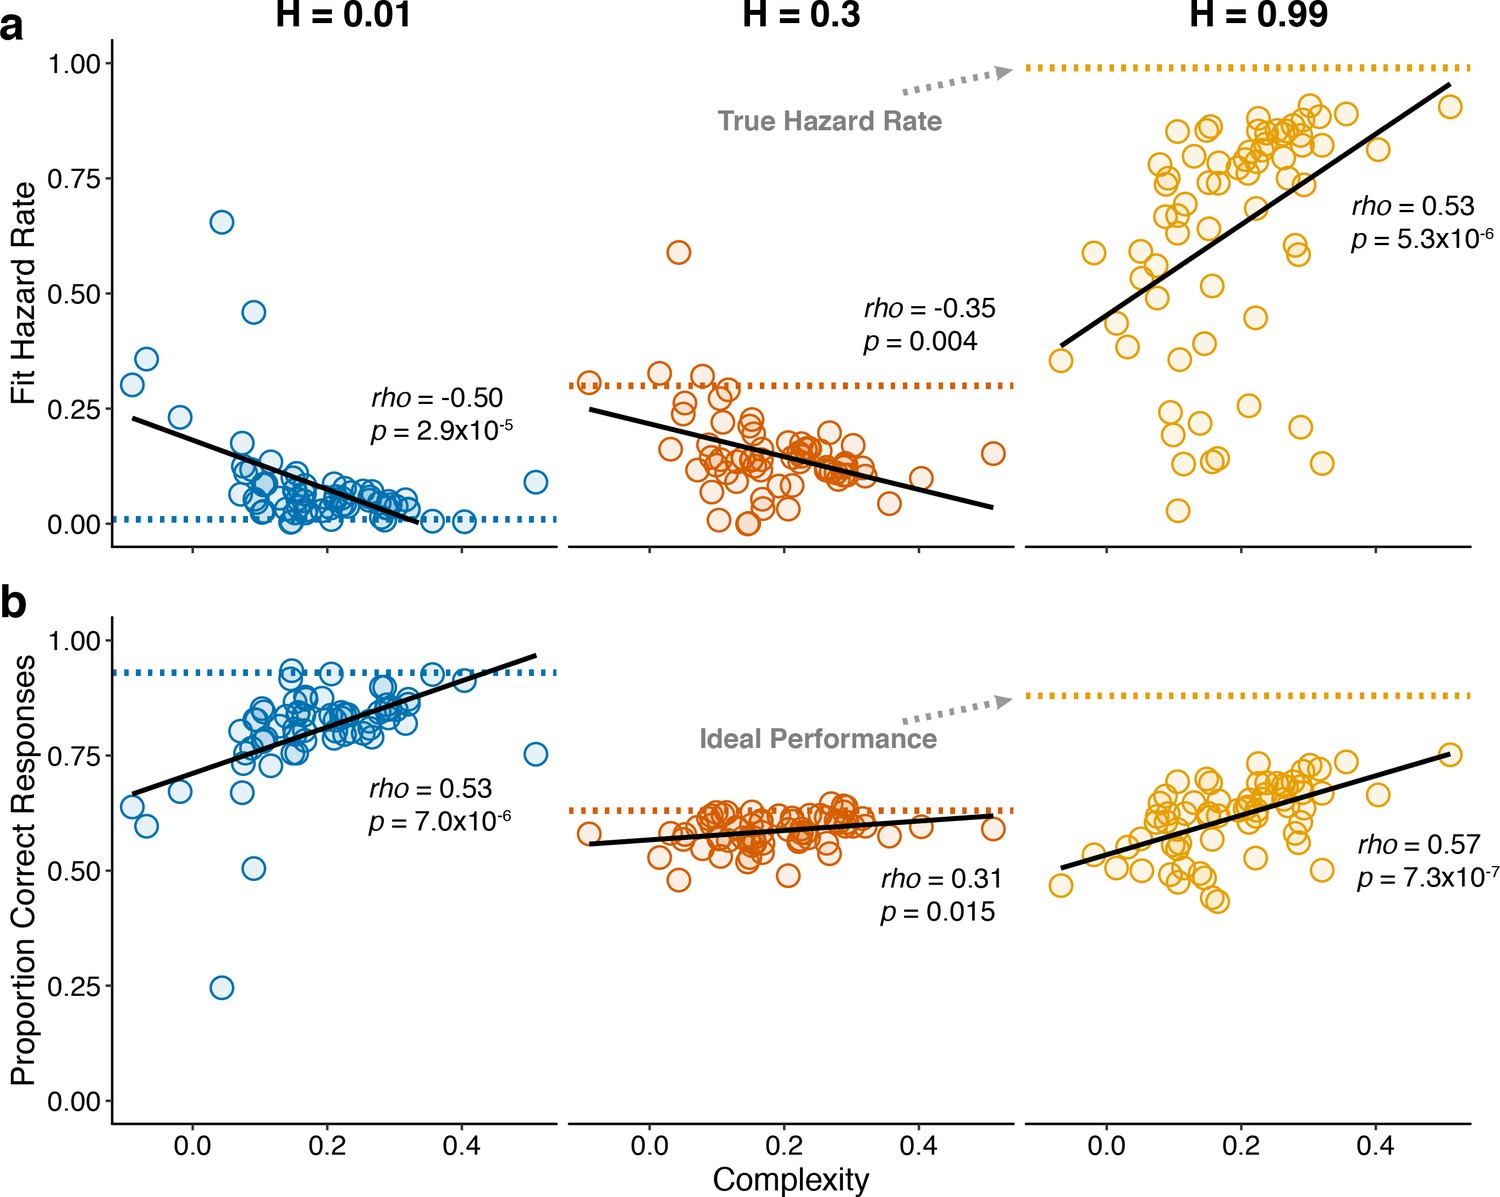
Individual differences in within-hazard performance reflected differences in belief-updating complexity.
The two panels show complexity (abscissa) compared to: (a) subjective hazard rate determined from fits of the normative choice model (colored dotted lines correspond to objective hazard-rate values), and (b) proportion correct responses (colored dotted lines correspond to mean proportion correct responses from the Bayesian learning model with a wide prior over hazard rate). Points are data from individual subjects. Lines are linear fits. Note that subjective hazard rates and overall performance were relatively more variable and further from normative values for the high versus low and intermediate hazard-rate conditions.
Figure 7
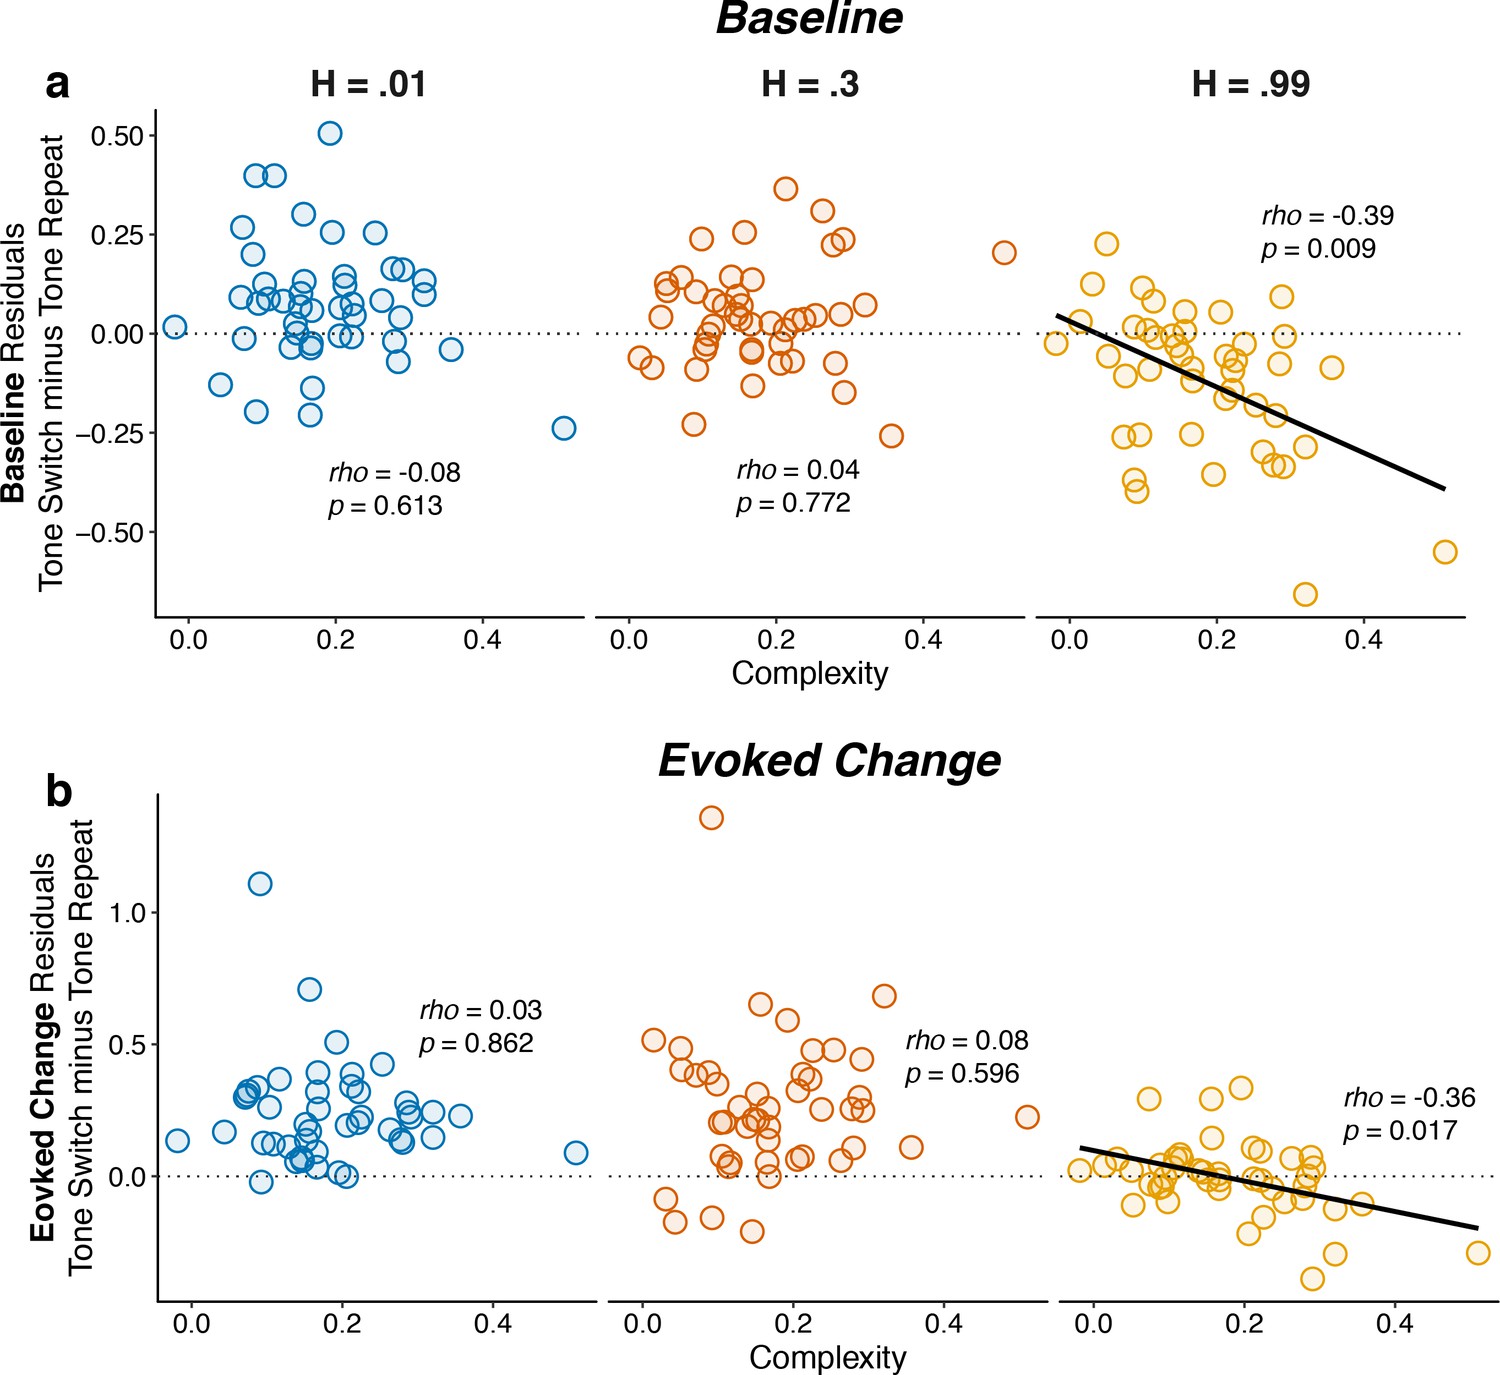
Individual differences in belief-updating complexity were reflected in within-hazard modulations of both baseline and evoked pupil diameter in the high hazard-rate condition that required a dissociation of top-down expectations from bottom-up stimulus changes.
The two panels show (a) baseline and (b) evoked changes in pupil responses on tone switch versus repeat trials as a function of belief-updating complexity. Pupil measurements were computed as residuals from a linear model that accounted for nuisance variables including the baseline pupil diameter (for evoked changes) and the evoked change in pupil diameter from the previous trial (Equation 14). Points indicate data from individual subjects. Lines are linear fits for cases for which H0: Spearman correlation coefficient (rho, indicated for each data set)=0, p<0.05.
Additional files
Download links
A two-part list of links to download the article, or parts of the article, in various formats.
Downloads (link to download the article as PDF)
Open citations (links to open the citations from this article in various online reference manager services)
Cite this article (links to download the citations from this article in formats compatible with various reference manager tools)
Pupil diameter encodes the idiosyncratic, cognitive complexity of belief updating
eLife 9:e57872.
https://doi.org/10.7554/eLife.57872


