PTEN and DNA-PK determine sensitivity and recovery in response to WEE1 inhibition in human breast cancer
- Department of Cell and Molecular Biology, Karolinska Institutet, Sweden
- Cancer Proteomics Mass Spectrometry, Science for Life Laboratory, Department of Oncology-Pathology, Karolinska Institutet, Sweden
- Department of Microbiology, Tumor and Cell biology, Karolinska Institutet, Sweden
- Tumor Initiation and Maintenance Program, NCI-Designated Cancer Center, Sanford Burnham Prebys Medical Discovery Institute, United States
- Department of Oncology and Metabolism, University of Sheffield, United Kingdom
Figures
Figure 1 with 2 supplements
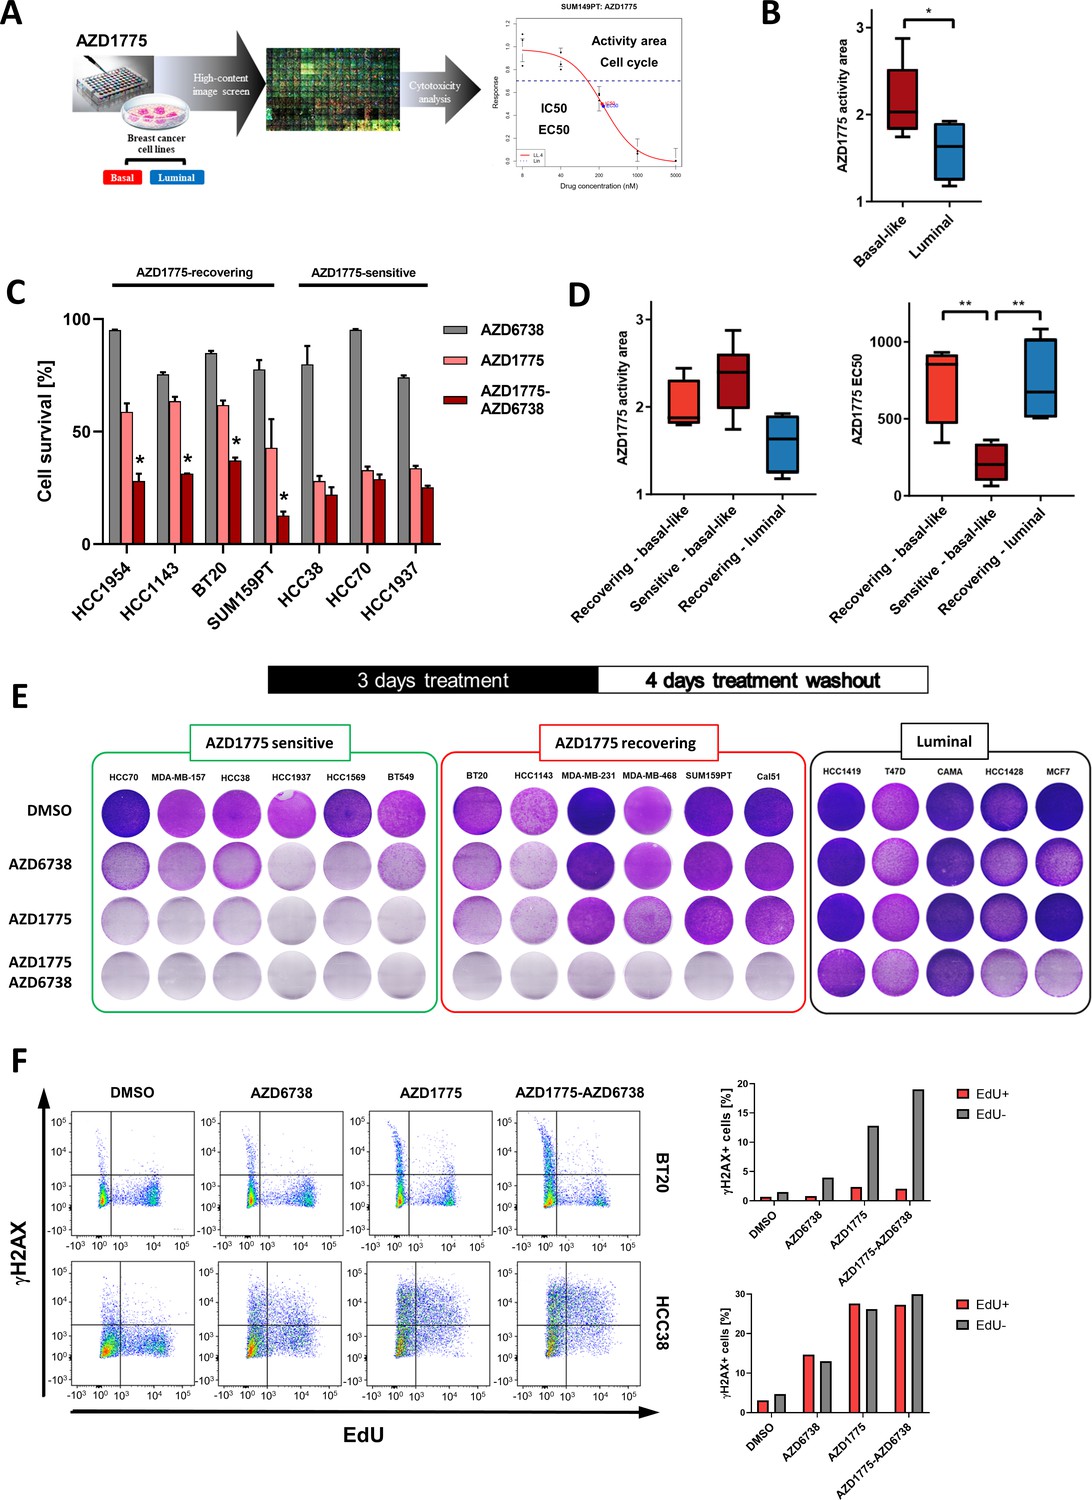
Differential response and recovery of basal-like breast cancer (BLBC) cell lines to AZD1775 monotherapy.
(A) Overview of the HCI AZD1775 screen in breast cancer cell lines and drug response characteristics. Activity Area - AA, EC50 - concentration of compound achieving 50% of the maximum effect, IC50 - concentration of compound achieving 50% reduction in cell number, and cell cycle profile. AZD1775 response profile of SUM149PT cells is shown (see also Figure 1—figure supplement 1A, Figure 6—figure supplement 1G and Supplementary file 1). (B) Comparison of acute AZD1775 sensitivity between basal-like and luminal breast cancer cell lines measured by HCI analysis. The AZD1775 response characteristics (activity area) depicted correspond to the area above the response curve. Boxes are coloured according to AZD1775 response in basal-like and luminal BC cell lines, respectively. * denotes p<0.05 as determined using Student’s t-test. Data are represented as mean ± SD. (C) Acute response to AZD1775, AZD6738 or the combination relative to DMSO-treated control in different BC cell lines. Cell numbers were analysed by crystal violet staining and quantified by colorimetry after 72 hr treatment. Data shown refer to a single concentration of AZD1775 (500 nM), AZD6738 (1 µM) or their combination (fixed ratio, 1:2). Error bars indicate standard deviation calculated from three independent experiments. Drug combination effects were calculated, based on the ratio and concentrations above, using the CImbinator online tool (Flobak et al., 2017). Both AZD1775-sensitive (CI >1.0) and AZD1775-recovering (CI <1.0) BC cell lines are depicted and drug synergy is marked *. The following CI values were calculated; HCC1954 = 0.31; HCC1143 = 0.18; BT20 = 0.45; SUM159PT = 0.34; HCC38 = 2.06; HCC70 = 1.09; HCC1937 = 1.57. (D) Comparison of acute AZD1775 response between recovering basal-like, sensitive basal-like and luminal breast cancer cell lines (recovering) measured by HCI analysis. The AZD1775 response characteristics were set to the area above the response curve (Activity area) left, and EC50, right. Boxes are coloured according to AZD1775 response of the different BC cell lines (recovering-basal, sensitive-basal and recovering-luminal). ** denotes p<0.01 as determined using Student’s t-test. (E) Recovery of proliferation following removal of AZD1775 (500 nM), AZD6738 (1 µM) or their combination was analysed by crystal violet staining and quantified by colorimetry. BC cell lines were treated for three days and allowed to recover for an additional four days without the drugs. Representative images of each cell line (from >three independent experiments) treated with indicated drugs and stained with crystal violet are shown. (F) Representative flow cytometry dot plots (left panels, two independent experiments) showing the distribution of EdU and γH2AX incorporation in recovering BT20, and sensitive HCC38 cells, following 24 hr treatment with AZD1775 (500 nM), AZD6738 (1 μM) or their combination as compared to DMSO control. Labelling of γH2AX-positive cells in the replicating fraction (EdU-positive - red) and γH2AX-positive cells in the non-replicating fraction (EdU-negative - gray) of each cell line is shown (right panels).
-
Figure 1—source data 1
Differential response and recovery of basal-like breast cancer (BLBC) cell lines to AZD1775 monotherapy.
(A) High content image-based drug screening of AZD1775 and AZD6738 in breast cancer cell lines. (C) Acute response to AZD1775, AZD6738 or the combination relative to DMSO-treated control in different BC cell lines. Cell numbers relative to DMSO as analysed by crystal violet staining and quantified by colorimetry after 72 hr treatment. (Figure supplement 1C) Viability matrix based on alamarBlue staining to assess synergy between AZD1775 and AZD6738 in MDA-MB-231 cells. (Figure supplement 1D) Quantification of recovery of proliferation following removal of AZD1775 in different BC cell lines. Cells were treated for three days and allowed to recover for an additional four days without the drugs. Regrowth was calculated by crystal violet stainings (Regrowth index; RI = OD after 4 days recovery minus OD after 3 days treatment, divided by OD 3 days treatment).
- https://cdn.elifesciences.org/articles/57894/elife-57894-fig1-data1-v1.xlsx
Figure 1—figure supplement 1
Differential response and recovery of basal-like breast cancer (BLBC) cell lines to AZD1775 monotherapy.
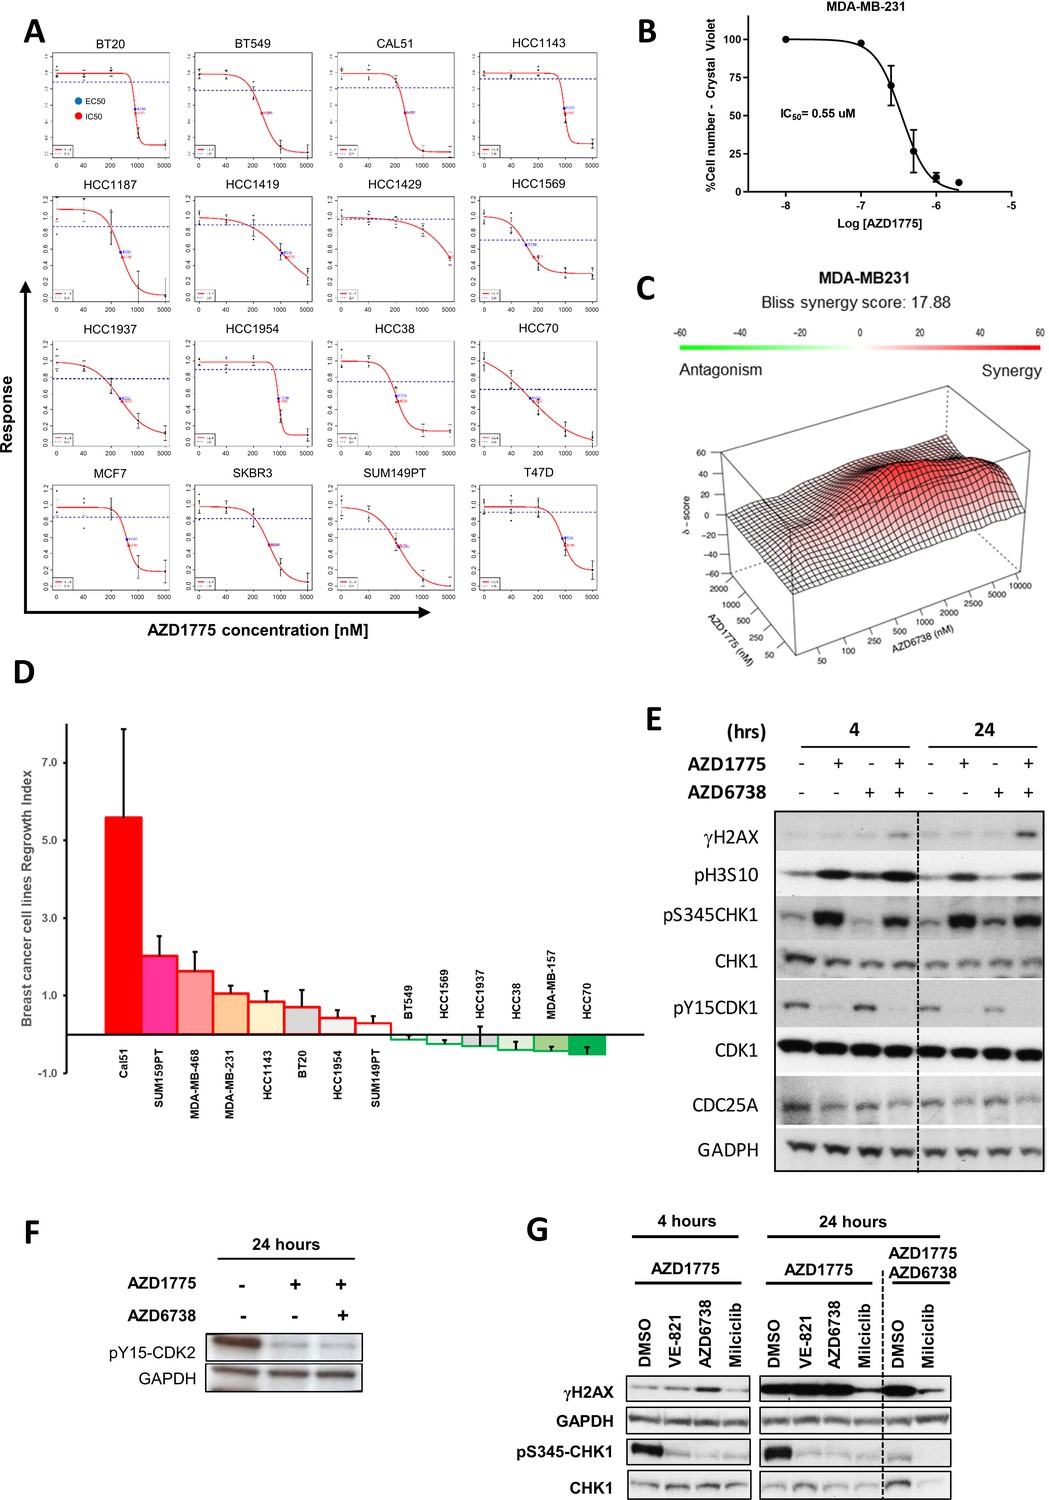
(A) AZD1775 dose-response curves of the panel of BC cell lines representing luminal and basal-like breast cancer subtypes (analysed by high-content imaging screening, see also Materials and methods, Figure 6—figure supplement 1F and Supplementary file 1). Response parameters were set to the area above the response curve, Activity Area, concentration of compound achieving 50% of the maximum effect, EC50, or concentration of compound achieving 50% reduction in cell number, IC50. (B) AZD1775 dose-response analysed by crystal violet staining assay in MDA-MB-231 cells treated with AZD1775 for 72 hr. Data are represented as mean ± SD calculated from three independent experiments (IC50 = 0.55 µM). (C) MDA-MB-231 cells were treated with the indicated compounds at different concentrations for three days. Drug synergies from dose-response matrices are shown as surface plots to visualize interaction at different drug concentrations. Plots were generated and synergy scores calculated based on the Bliss model using the publicly-available online tool SynergyFinder (Ianevski et al., 2017). Overall Bliss score = 17.88. Most synergistic area score = 32.61. (D) Quantification of recovery of proliferation following removal of AZD1775 in different BC cell lines. Cells were treated for three days and allowed to recover for an additional four days without the drugs. Regrowth was calculated by crystal violet stainings (Regrowth index; RI = OD after 4 days recovery minus OD after 3 days treatment, divided by OD 3 days treatment). Data are represented as mean ± SD calculated from three independent experiments. (E) Immunoblots of HCC1954 cells treated with the indicated drugs for 4 hr and 24 hr and probed with the specified antibodies. (F) Phosphorylation of Y15-CDK2 in response to AZD1775 (500 nM) or the combination (500 nM AZD1775 + 1 μM AZD6738) was assessed by immunoblot analysis. GAPDH was used as loading control. (G) Immunoblot analysis of γH2AX and CHK1 activation (MDA-MB-231 cells) in response to AZD1775 (500 nM) mono-treatment, or in combination with ATR inhibitors (1 μM) VE-821 and AZD6738, or CDK2 inhibitor Milciclib (1 μM), as indicated.
Figure 1—figure supplement 2
Differential response and recovery of basal-like breast cancer (BLBC) cell lines to AZD1775 monotherapy.
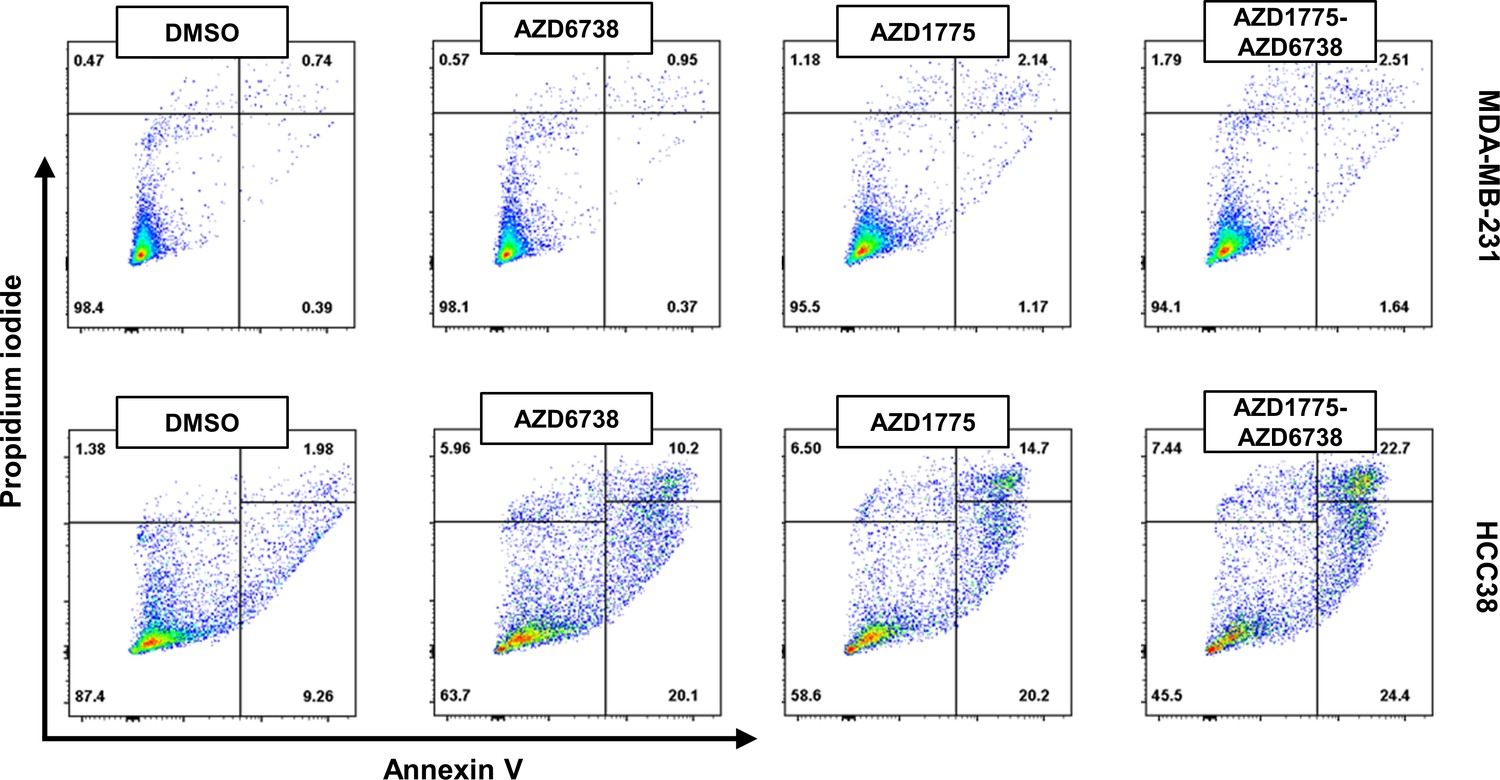
MDA-MB-231 and HCC38 cells were treated for 24 hr with the drugs indicated and analysed by flow cytometry. Annexin V/propidium iodide (PI)-double staining was used to assess apoptosis in response to AZD1775 (500 nM), AZD6738 (1 μM), or the combination treatment. Representative (two independent experiments) flow cytometry dot plots is shown.
Figure 2 with 3 supplements
PTEN predicts sensitivity and response to AZD1775 monotherapy.
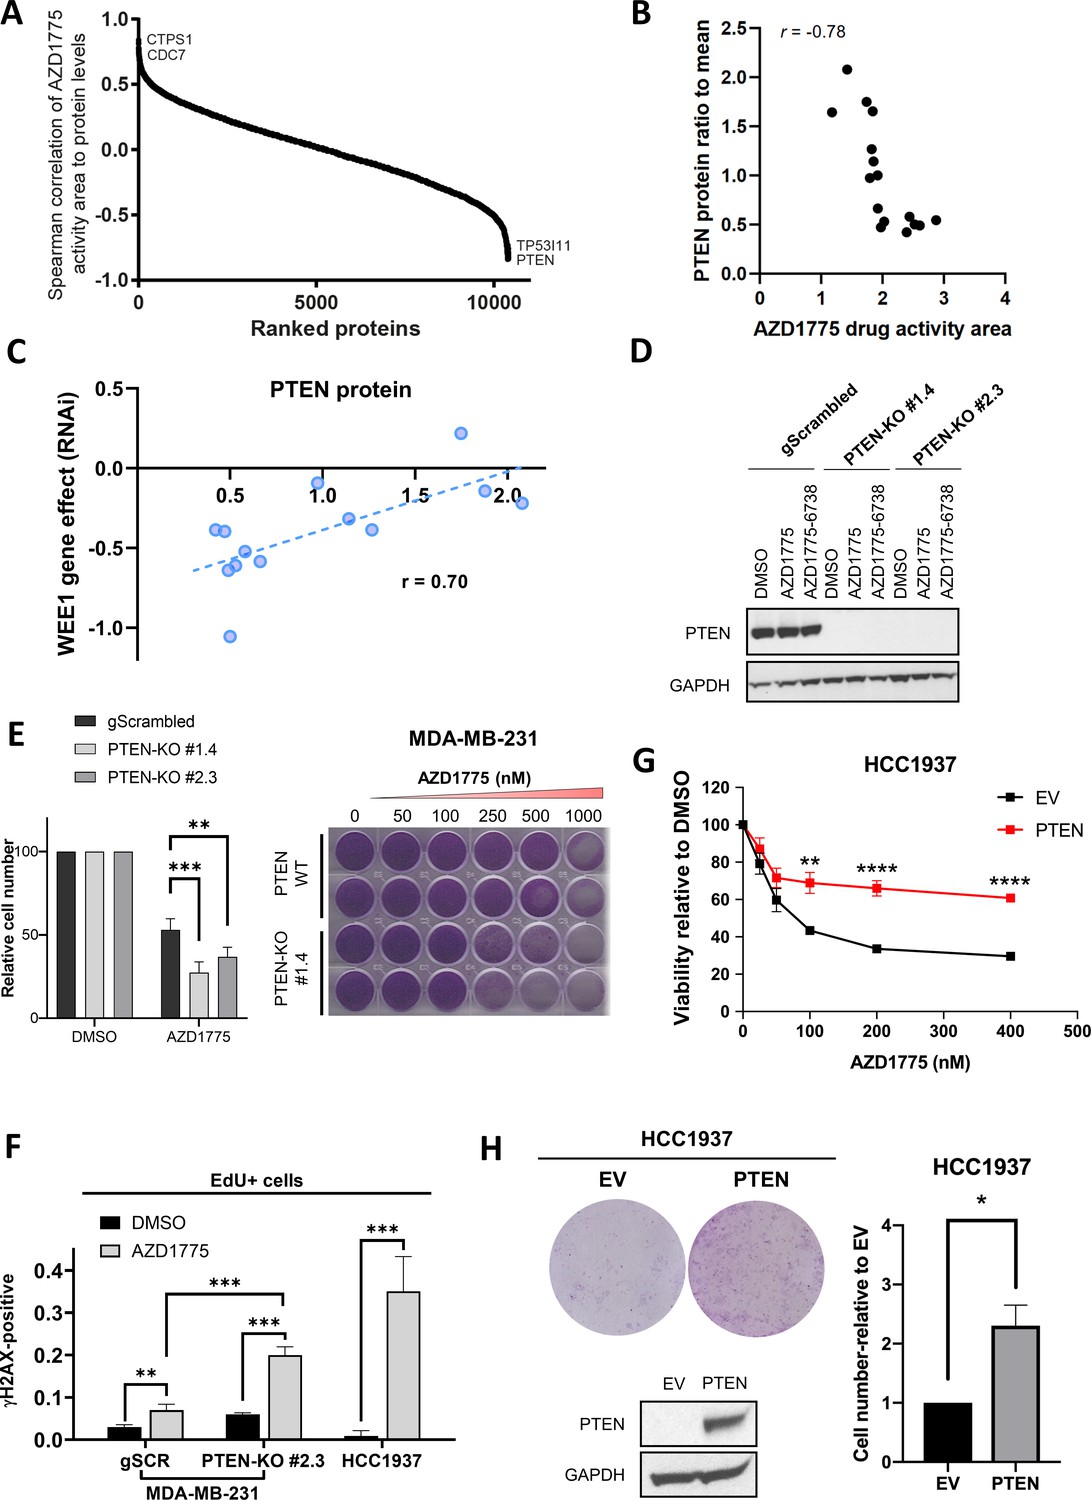
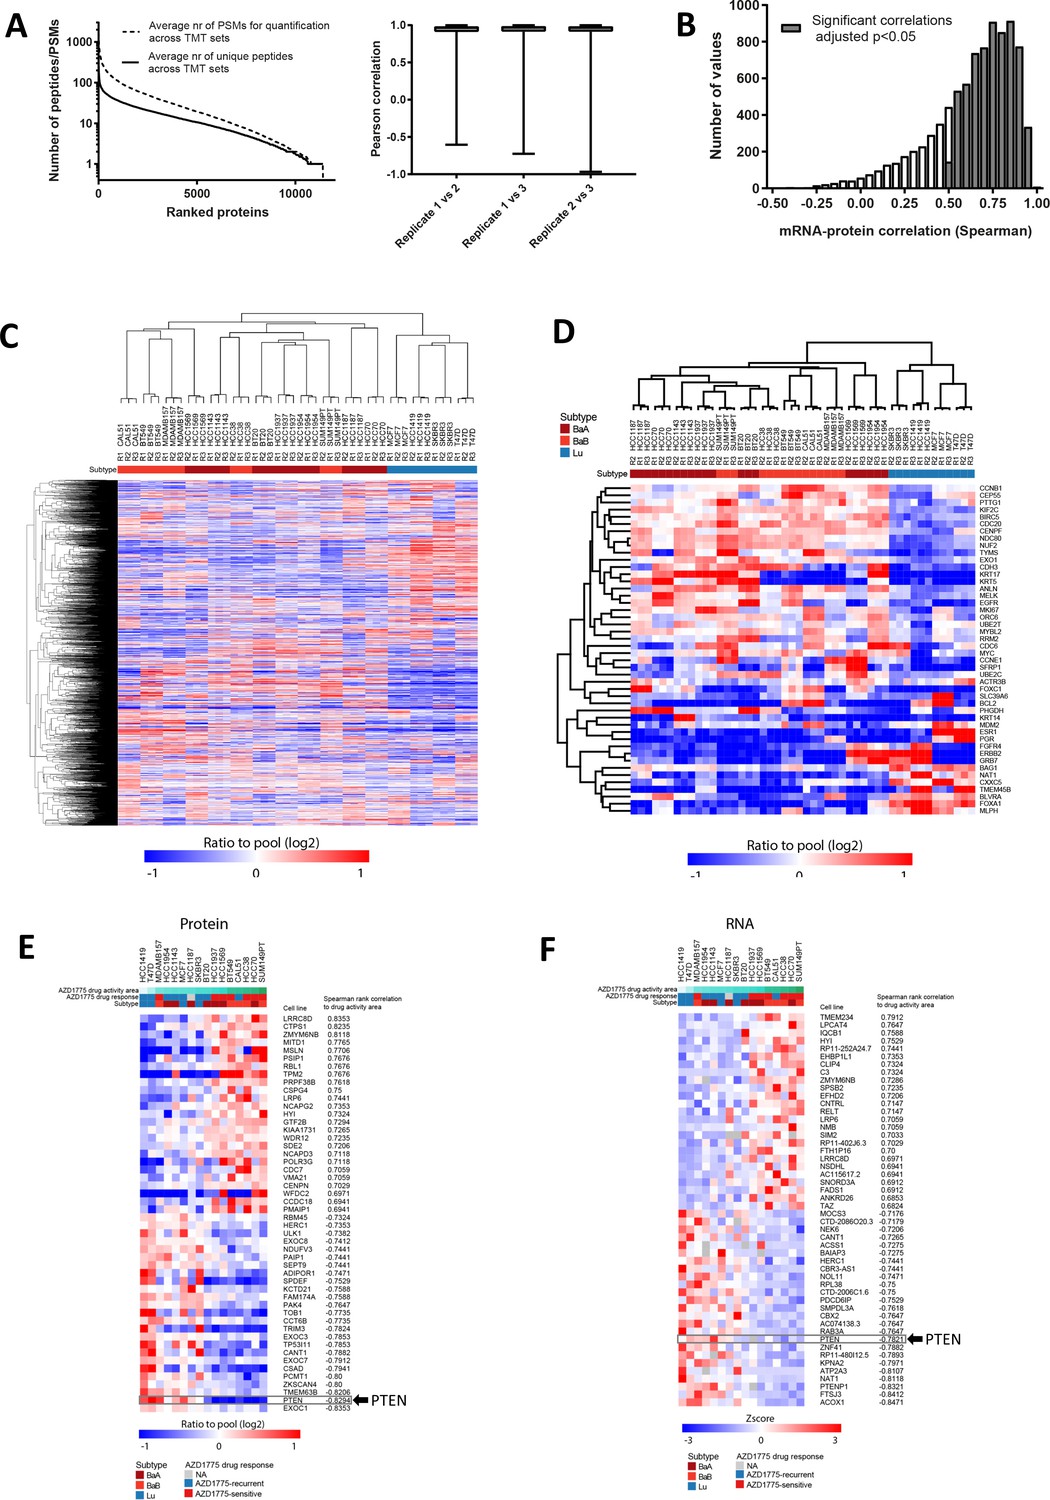
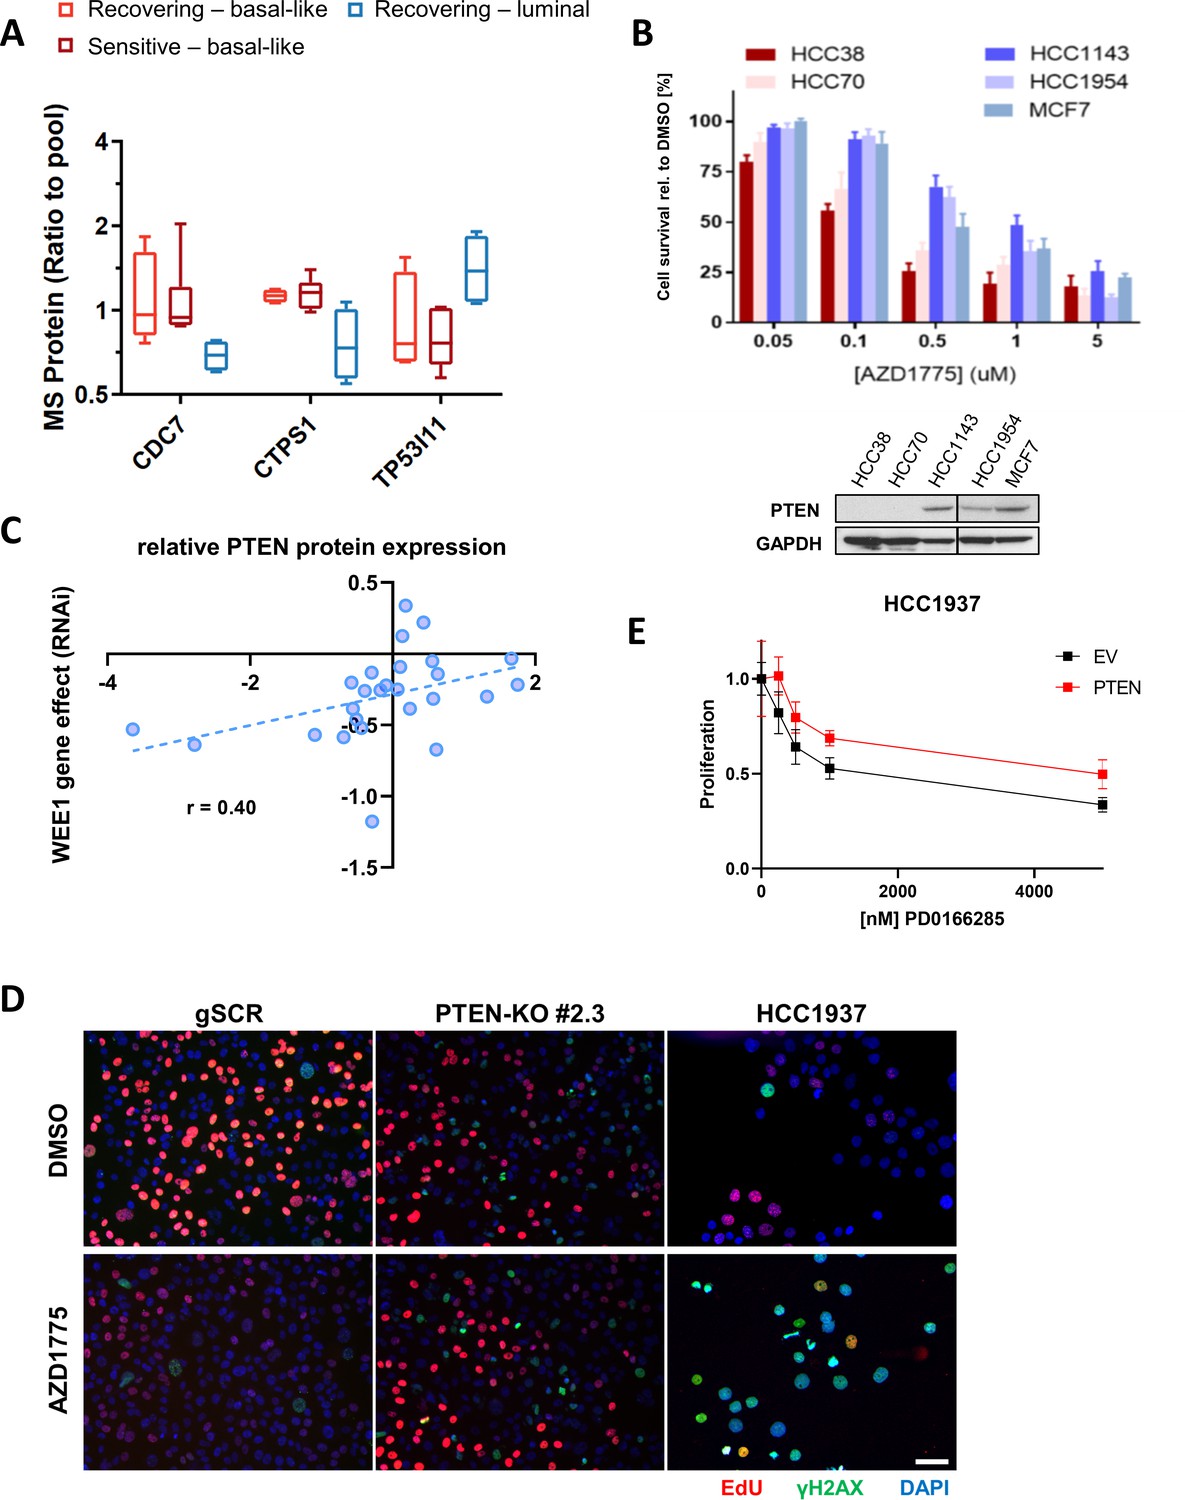
(A) Association of AZD1775 drug response to protein levels. AZD1775 drug response activity area was associated with proteins levels from the 16 cell lines in the screen by Spearman correlation. (B) Correlation between PTEN protein (ratio to mean) and response to AZD1775 (drug response area). Pearson correlation coefficient r = −0.78, p=0.0002. (C) Correlation analysis of WEE1 RNAi gene dependency (combined RNAi, DEMETER2 model, depmap portal [McFarland et al., 2018; Tsherniak et al., 2017]) and PTEN protein levels (ratio to mean) in 13 breast cancer cell lines (Pearson’s correlation, r = 0.70, p=0.008; Spearman’s correlation, r = 0.70, p=0.01). (D) MDA-MB-231 gScrambled and PTEN knockout (KO) clones (#1.4 and #2.3) were treated for 24 hr with AZD1775 (500 nM) or combination of AZD1775 and AZD6738 (1 μM), and whole cell lysates were immunoblotted and probed with the indicated antibodies. (E) Quantification of recovery of proliferation after 72 hr treatment with increasing concentrations of AZD1775 in the indicated isogenic cell lines (left). Data shown are mean ± SD of three independent experiments, **p=0.003 and ***p=0.0003, assessed by Student’s t-test. Images of recovery of proliferation of MDA-MB-231 scrambled control (PTEN-WT) and PTEN-KO (#1.4) cells treated with indicated concentrations of AZD1775 and assessed by staining with crystal violet (right). (F) Quantification of DNA damage by HCI analysis of γH2AX-positive cells in the replicating, EdU+ fraction. PTEN-proficient (MDA-MB-231 scrambled control), PTEN-deficient (PTEN-KO #2.3) and PTEN-deleted HCC1937 cells were treated with AZD1775 (500 nM) or DMSO for 24 hr. Graphs show the proportions of EdU/γH2AX double-positive cells, ** indicates p=0.098 and ***p<0.001 as assessed by Student’s t-test. (G) Quantification of AZD1775 response in HCC1937 (EV, PTEN-negative) cells and HCC1937 cells with reconstituted PTEN (PTEN-positive). Cell viability was analysed by alarmarBlue assay (upper panel). Error bar indicates SEM calculated from five replicates. **p<0.002 and ****p<0.0001 assessed by Student’s t-test. (H) Recovery of proliferation (10 days) of EV and PTEN restored HCC1937 cells following 72 hr treatment with AZD1775 (100 nM) was analysed by crystal violet staining (representative image is shown, top left panel). Recovery of proliferation was measured by crystal violet staining. Error bar indicates SEM calculated from two independent experiments. * indicates p=0.003 assessed by Student’s t-test (right panel). PTEN protein expression was analysed by western blotting and GAPDH level served as loading control (lower left panel).
-
Figure 2—source data 1
PTEN predicts sensitivity and response to AZD1775 monotherapy.
(C) Correlation analysis of WEE1 RNAi gene dependency (combined RNAi, DEMETER2 model, depmap portal [McFarland et al., 2018; Tsherniak et al., 2017]) and PTEN protein levels (ratio to mean) in 13 breast cancer cell lines. (E) Quantification of recovery of proliferation after 72 hr treatment with 500 nM AZD1775 in isogenic MDA-MB-231 gScrambled and PTEN-KO cell lines. (F) Quantification of DNA damage by HCI analysis of γH2AX-positive cells in the replicating, EdU+ fraction. PTEN-proficient (MDA-MB-231 scrambled control), PTEN-deficient (PTEN-KO #2.3) and PTEN-deleted HCC1937 cells were treated with AZD1775 (500 nM) or DMSO for 24 hr. Proportions of EdU/γH2AX double-positive cells are shown. (G) Quantification of AZD1775 response in HCC1937 (EV, PTEN-negative) cells and HCC1937 cells with reconstituted PTEN (PTEN-positive). Cell viability was analysed by alarmarBlue assay. (H) Recovery of proliferation (10 days) of EV and PTEN restored HCC1937 cells following 72 hr treatment with AZD1775 (100 nM) quantified by crystal violet staining. (Supplement 2E) Quantification of response to WEE1 inhibitor PD0166285 in HCC1937 (EV, PTEN-negative) cells and HCC1937 cells with reconstituted PTEN expression. Cell viability was analysed by alamarBlue assay. (Supplement 3) WEE1 was silenced by siRNA transfection in PTEN-proficient and PTEN-deficient cells (MDA-MD-231) and HCC1937 and cell viability analysed by alamarBlue assay.
- https://cdn.elifesciences.org/articles/57894/elife-57894-fig2-data1-v1.xlsx
Figure 2—figure supplement 1
PTEN predicts sensitivity and response to AZD1775 monotherapy.
(A) Unique peptides and peptide spectrum matches (PSMs) for the mass spectrometry-based proteomics data of the 16 cell lines in triplicate. Proteins are ranked according to average number of unique peptides used for protein identification and average number of peptide spectrum matches (PSMs) used for quantification across the triplicates for the 16 cell lines (6 TMT10plex sets). Cell lines are the same as used in the drug screen (left). Quantitate accuracy between replicates in the MS proteomics data set with 16 cell lines. Box plots show the correlation between replicates for each gene (right). (B) Correlation between protein and mRNA for the 16 cell lines. (C) Clustering of all proteins with quantification across all three replicates in the MS proteomics data set. Spearman, average linkage. (D) Clustering based on protein levels of the 16 cell lines based on the PAM50 genes. Spearman, average linkage. (E) Proteins associated with AZD1775 drug response. Top 25 most correlated and anti-correlated proteins and RNAs to AZD1775 drug activity area (as in Figure 2A). (F) RNA expression associated with AZD1775 drug response. Top 25 most correlated and anti-correlated proteins and RNAs to AZD1775 drug activity area (as in Figure 2A).
Figure 2—figure supplement 2
PTEN predicts sensitivity and response to AZD1775 monotherapy.
(A) Box-plots of CDC7, TP53I11 and CTPS1 protein expression levels (ratio to pool) in the different groups of breast cancer cell lines according to AZD1775 response characteristics (recovering-basal, sensitive-basal and recovering-luminal). (B) AZD1775 drug response in HCC38, HCC70, HCC1143, HCC1954 and MCF7 cells as assessed by crystal violet staining and colorimetry after 72 hr treatment with increasing concentrations of AZD1775. Bottom panel shows PTEN expression by immunoblot analysis for a selection of the cell lines. GAPDH expression was used as loading control. (C) Correlation analysis of WEE1 RNAi gene dependency (combined RNAi, DEMETER2 model, depmap portal [McFarland et al., 2018; Tsherniak et al., 2017]) and PTEN protein levels (relative protein expression) in 26 breast cancer cell lines (Nusinow et al., 2020). Pearson’s correlation, r = 0.40, p=0.04; Spearman’s correlation, r = 0.50, p=0.01. (D) Representative images related to Figure 2E. PTEN-proficient (MDA-MB-231 scrambled control), PTEN-deficient (PTEN-KO #2.3) and PTEN-deleted HCC1937 cells were treated with AZD1775 (500 nM) or DMSO for 24 hr. EdU = red, γH2AX = green, DAPI = blue. Scale bar = 60 μm. (E) Quantification of response to WEE1 inhibitor PD0166285 in HCC1937 (EV, PTEN-negative) cells and HCC1937 cells with reconstituted PTEN expression. Cell viability was analysed by alamarBlue assay. Error bars indicate SD calculated from five replicates. **p<0.002 assessed by Student’s t-test.
Figure 2—figure supplement 3
PTEN predicts sensitivity and response to AZD1775 monotherapy.
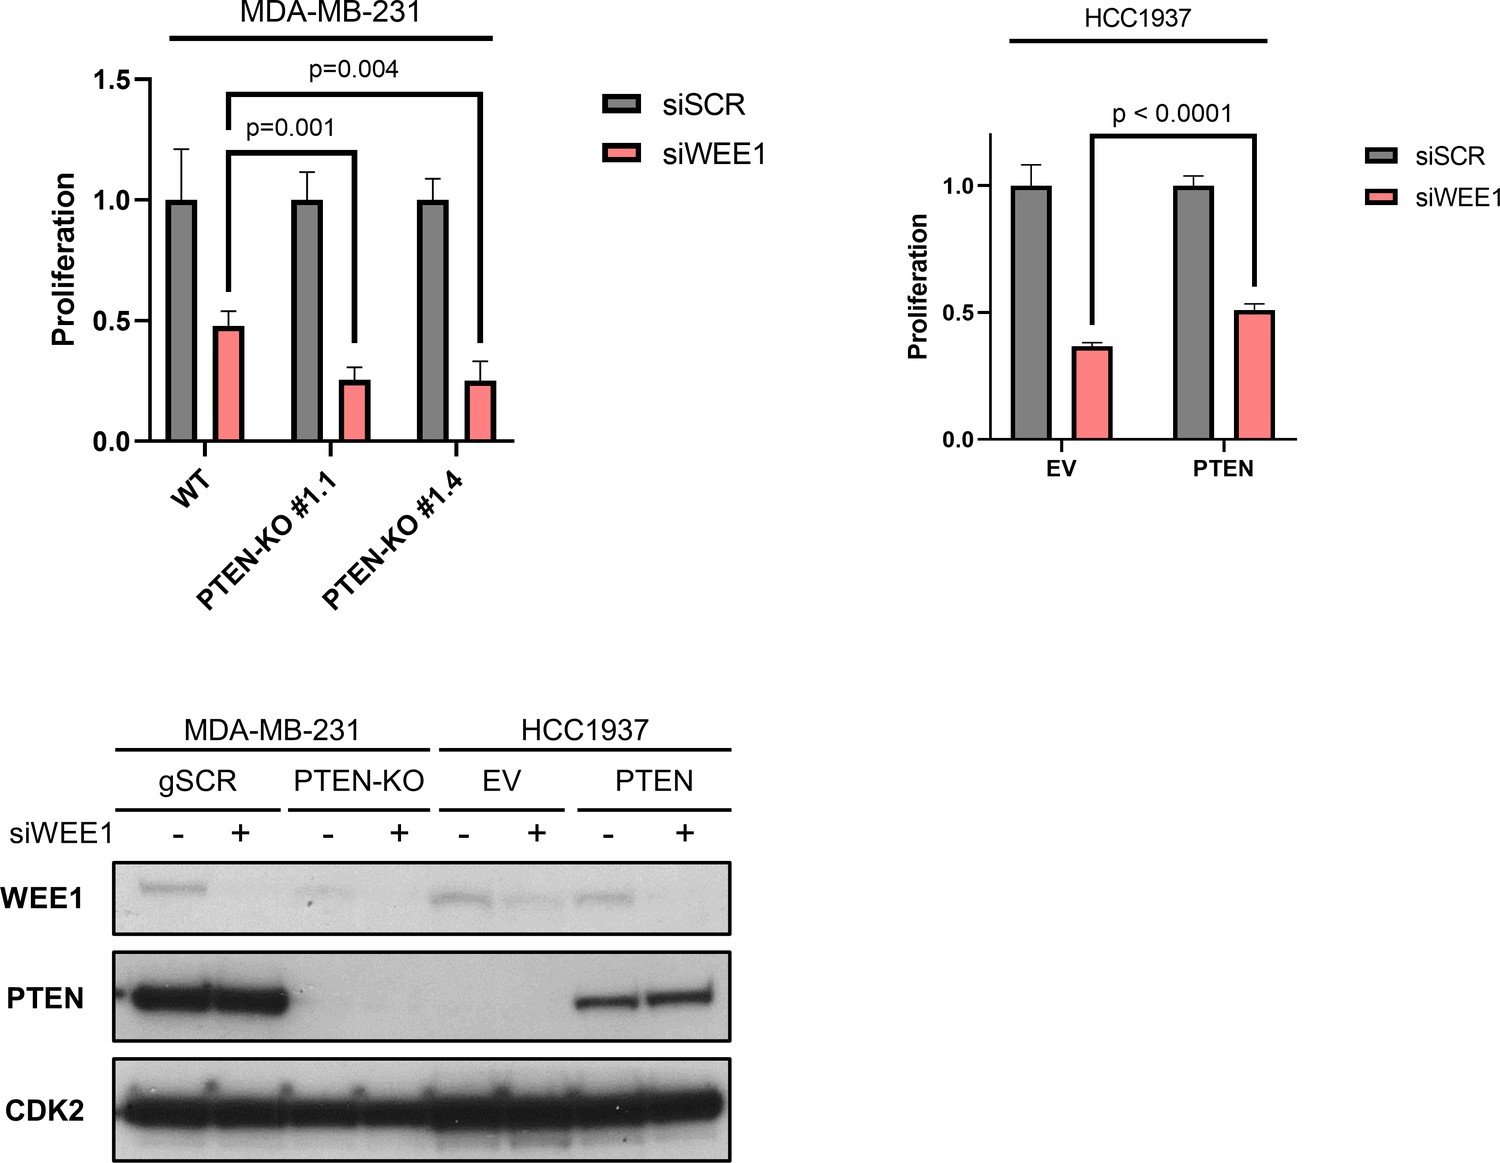
WEE1 was silenced by siRNA transfection in PTEN-proficient and PTEN-deficient cells (MDA-MD-231 (top left) and HCC1937 (top right)) as indicated. Cell viability was analysed by alamarBlue assay. Error bars indicate SD calculated from five replicates. Indicated p-values were assessed by Student’s t-test. WEE1 and PTEN protein expression was analysed by immunoblot analysis and total CDK2 expression used as loading control (bottom panel).
Figure 3 with 2 supplements
ATR inhibition by AZD6738 exacerbates AZD1775-induced RS and abrogates recovery of replication.
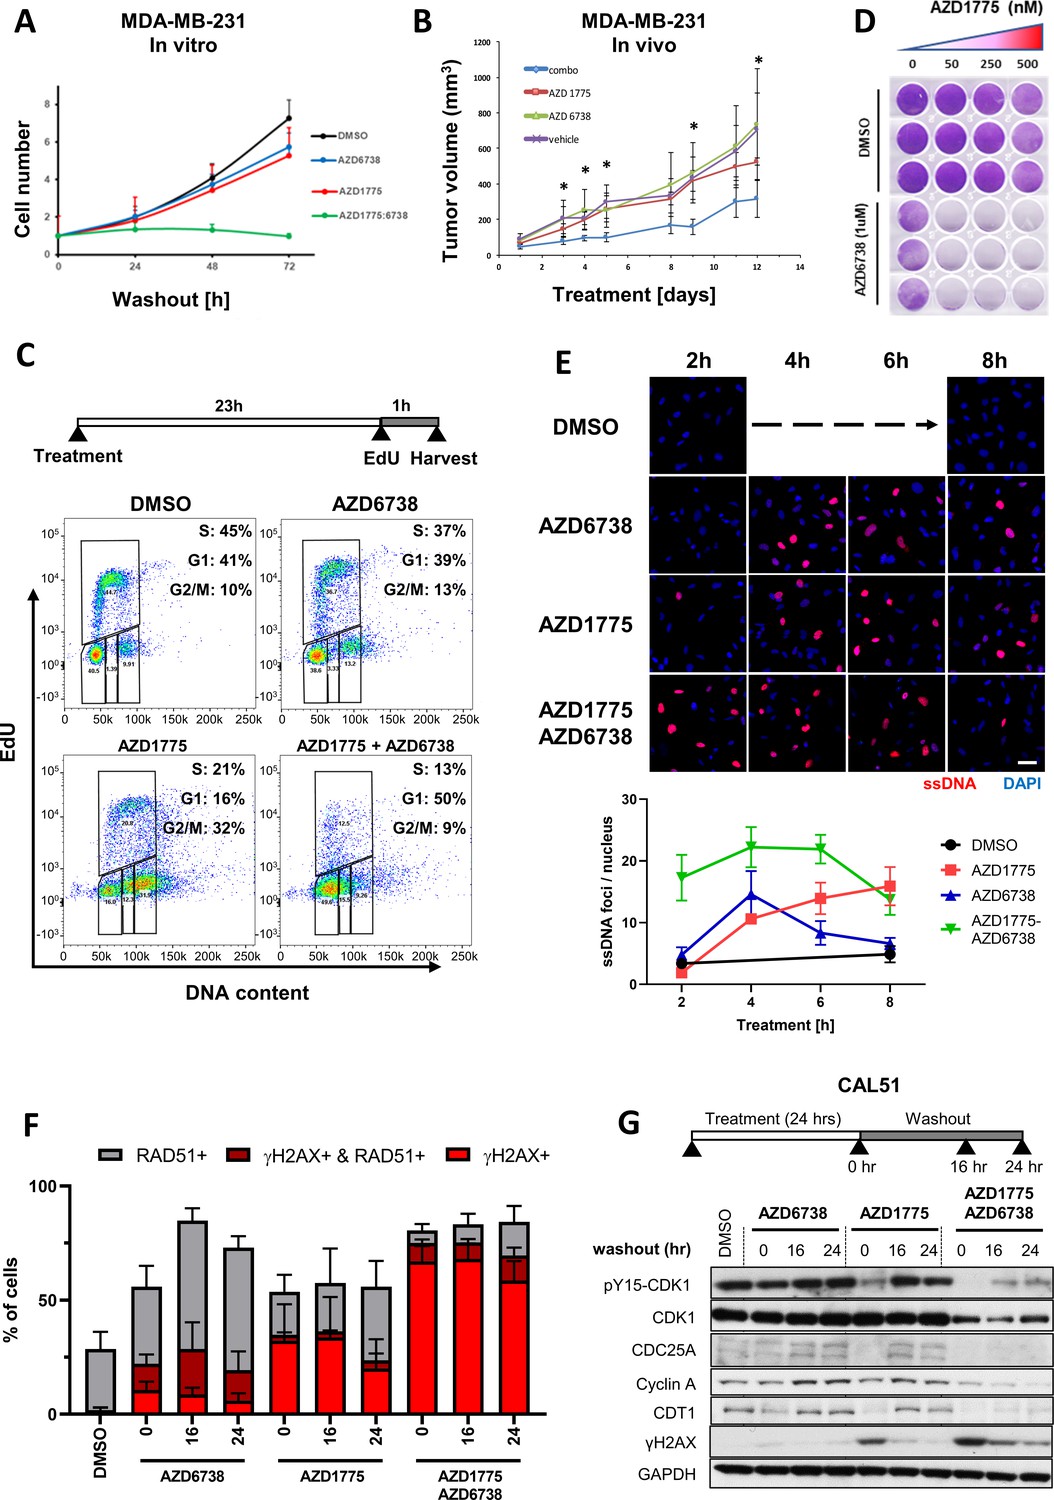
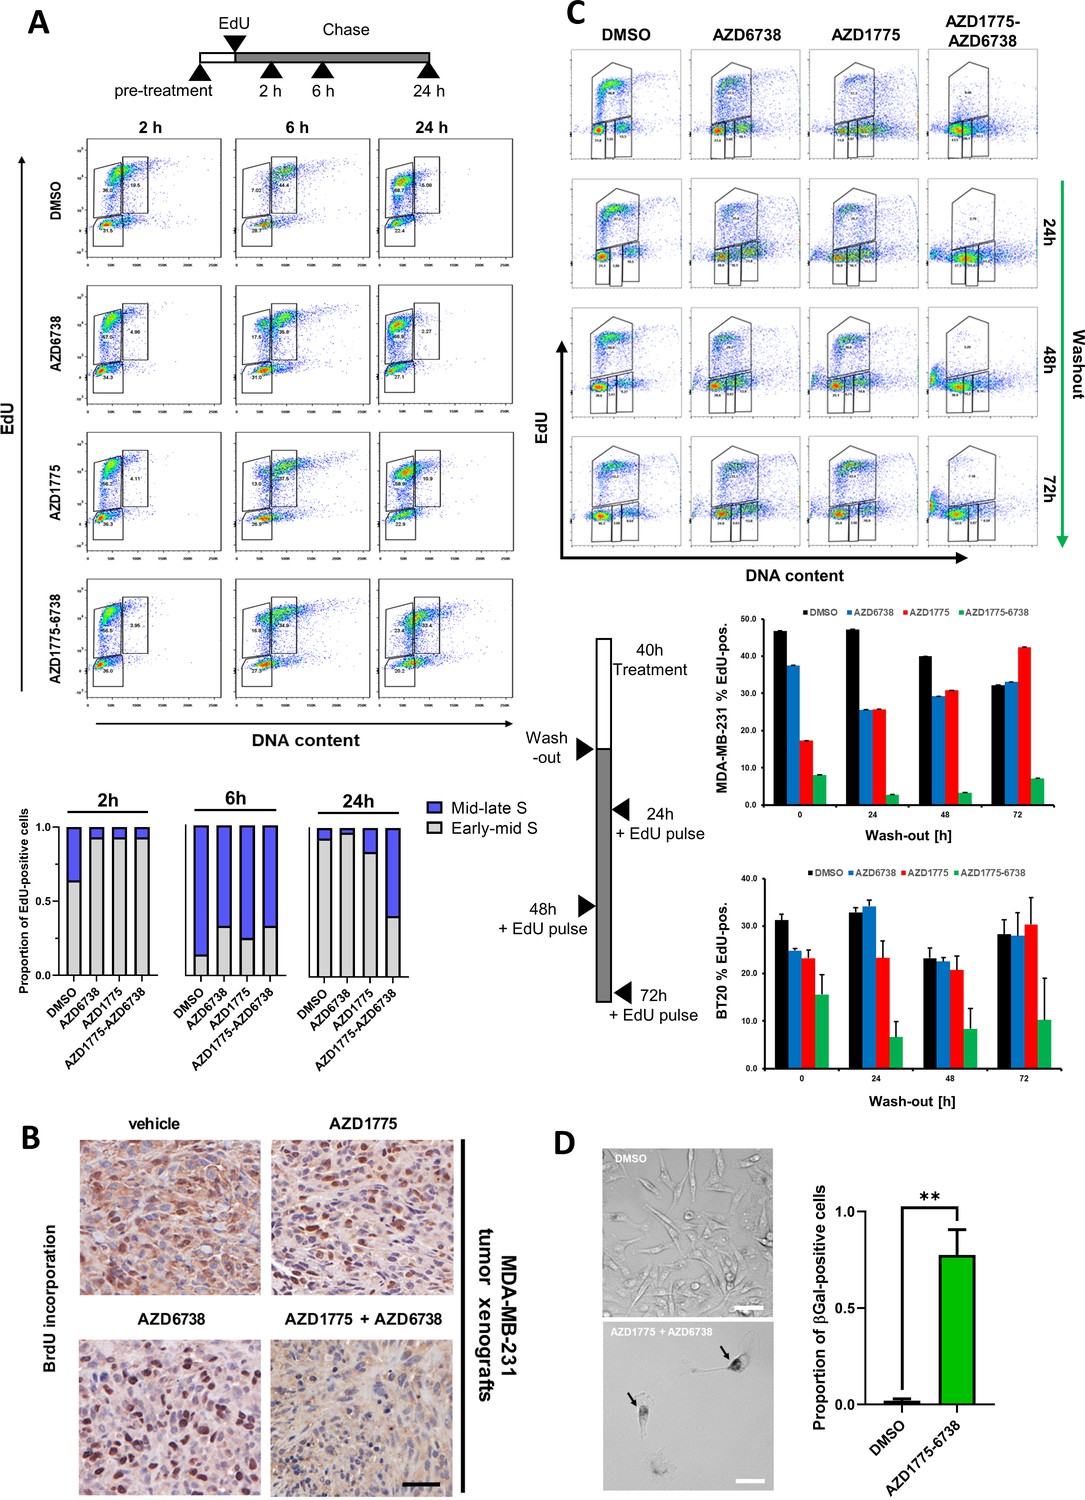
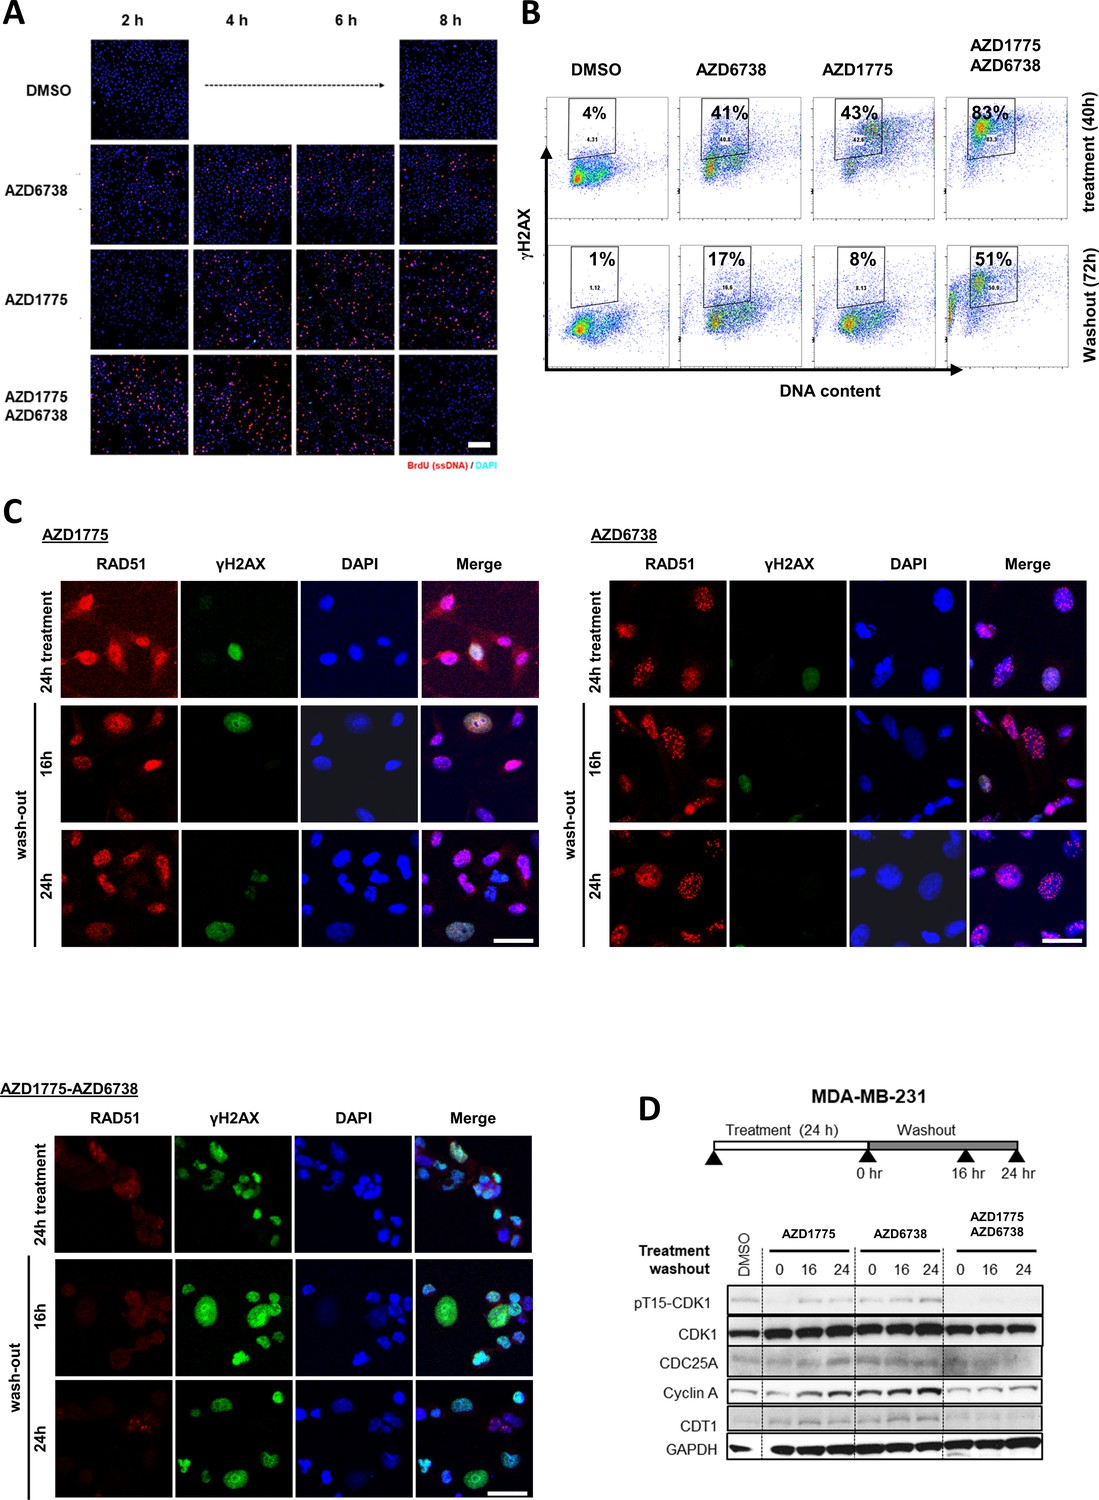
(A) Quantification of cell proliferation post-drug treatment as indicated in MDA-MB-231 cells. Error bars indicate standard deviation calculated from three independent experiments. Cell proliferation was determined by trypan blue cell counting in triplicates for each condition. (B) Effect of the combination treatment with AZD1775 and AZD6738 on tumour growth in vivo. Mice (NOD/SCID female mice, 6–8 weeks old) were injected orthotopically with 106 MDA-MB-231 cells. As tumours reached 67.92mm3 +/- 10.66 mm3 (mean +/- SEM) mice started receiving one of the following treatments by oral gavage: vehicle (n = 4), AZD6738 25 mg/kg (n = 4), AZD1775 25 mg/kg (n = 4) or AZD6738 25 mg/kg + AZD1775 25 mg/kg (‘combo’) (n = 6) for 12 days. Tumours were measured periodically, and tumour volume calculated with the formula: V = D X d2 X π/6, where V is volume, D is the largest diameter, d is the shortest diameter. *p<0.05 as assessed by Student’s t-test with respect to combination treatment vs. vehicle. The statistical analysis is based on tumour growth index that is the relative increase in tumour volume at a particular time point compared with the tumour volume at the start of treatment for each tumour. (C) DNA replication in MDA-MB-231 cells treated as indicated was assessed by flow cytometry. Cells were pulse-labelled with EdU for one hour at the end of the treatment before fixation and staining. Cells were gated for EdU and DNA content (propidium iodide) to determine cell cycle phase. Y- and X-axes represent EdU incorporation and DNA content, respectively. (D) MDA-MB-231 cells were treated with increasing concentrations of AZD1775 alone (50, 250 and 500 nM) or in combination with AZD6738 (1 µM) for three days, and recovery of proliferation was assessed four days post-treatment by crystal violet staining. (E) Representative, high-magnification images related to Figure 3—figure supplement 2A visualizing ssDNA DNA by native BrdU staining (red) in response to AZD1775, AZD6738 or the combination treatment in MDA-MB-231 cells as indicated. Quantification of ssDNA in response to the different treatment times is depicted with error bars indicating SEM calculated from five replicates. Scale bar = 30 μM. (F) Quantification of data from HCI analysis of MDA-MB-231 cells treated with AZD1775 (500 nM), AZD6738 (1 µM) or their combination as indicated (Figure 3—figure supplement 2C). The staining signals of RAD51 and γH2AX were measured at single cell resolution (DAPI-stained area) and the fraction of RAD51/γH2AX-positive cells were quantified and shown as histograms with error bars, standard deviation derived from three independent replicates. (G) Expression level and phosphorylation of cycle regulatory proteins during the course of recovery following treatment with AZD1775 (500 nM), AZD6738 (1 μM), or their combination in recovering Cal51 cells. CDC25A, cyclin A, CDT1, phosphorylation of CDK1-Y15 and γH2AX was analysed by western blotting as indicated. GAPDH expression level served as loading control.
-
Figure 3—source data 1
ATR inhibition by AZD6738 exacerbates AZD1775-induced RS and abrogates recovery of replication.
(E) Quantification of ssDNA foci numbers per nucleus in response to different treatments and durations as indicated. (F) Quantification of γH2AC, RAD51 and 53BP1 (the latter not shown in histograms) positive MDA-MB-231 cells treated with AZD1775 (500 nM), AZD6738 (1 µM) or their combination. (Supplement 1C) Quantification of percentage of cell population in active S-phase (EdU+) from two independent experiments in MDA-MB-231 and BT20 cells. (Supplement 1D) Proportion of senescence associated-β-Galactosidase-positive cells after 72 hr of AZD1775-AZD6738 combination or DMSO control treatment (500 nM AZD1775 and 1 μM AZD6738) and 5 days drug wash-out.
- https://cdn.elifesciences.org/articles/57894/elife-57894-fig3-data1-v1.xlsx
Figure 3—figure supplement 1
ATR inhibition by AZD6738 exacerbates AZD1775-induced RS and abrogates recovery of replication.
(A) MDA-MB-231 cells were pre-treated with AZD1775 (500 nM), AZD6738 (1 µM) or their combination, pulse-labelled for 30 min with EdU, and chased for the times indicated. DNA content and EdU-intensity were assessed by flow cytometry at 2, 6 and 24 hr to visualize replication for the different treatments. Upper panel: representative FACS plots. Y- and X-axes represent EdU and DNA content (propidium iodide), respectively. Bottom panel: Graphs representing proportion of EdU-positive mid-late S (blue) versus early-mid S DNA content (gray). (B) BrdU incorporation in tumour tissues. Mice bearing MDA-MB-231 tumours and treated with AZD1775, AZD6738, AZD1775+AZD6738 combination or vehicle control received an i.p. injection of BrdU 1 hr before termination. Formalin-fixed paraffin-embedded tumour tissue was analysed by IHC for detection of incorporated BrdU. Brown nuclear staining defines positive cells. Representative images are shown. Scale bar = 50 μM. (C) Representative cell cycle plots of MDA-MB-231 and BT20 cells labelled by EdU-PI and analysed by flow cytometry after 40 hr drug treatment following drug washout for the indicated times. Before fixing at the respective time points, cells were pulsed with EdU for 30 min to assess actively replicating cells. Upper panel: Representative FACS plots for the indicated time points and treatments in MDA-MB-231 cells; Bottom panel: Quantification of percentage of cell population in active S-phase (EdU+) from two independent experiments in MDA-MB-231 and BT20 cells, respectively (± SEM). (D) Senescence associated-β-Galactosidase staining following 72 hr of AZD1775-AZD6738 combination treatment (500 nM AZD1775 and 1 μM AZD6738) and 5 days drug wash-out. Left: Representative images of DMSO and AZD1775-AZD6738 combination-treated cells. Right: Bars indicate mean proportion of β-Galactosidase-positive cells and (± SEM) of four replicates. ** denotes p=0.001 as assessed by Student’s t-test. Scale bar = 20 μM.
Figure 3—figure supplement 2
ATR inhibition by AZD6738 exacerbates AZD1775-induced RS and abrogates recovery of replication.
(A) Lower-magnification of immunofluorescence images related to Figure 3E visualizing ssDNA-positive MDA-MB-231 cells by native BrdU staining (red) in response to AZD1775, AZD6738 or the combination treatment as indicated. Scale bar = 200 μM. (B) γH2AX staining was assessed by flow cytometry in MDA-MB-231 cells treated with the indicated drugs for 40 hr and following drug washout (72 hr) to assess DNA damage. Representative FACS data (two independent experiments) are shown and the percentage of γH2AX-positive cells are indicated in gated dot-plots. (C) Representative images of immunofluorescence staining for γH2AX (green), RAD51 (red) and DAPI (blue) quantifications in Figure 3F. MDA-MB-231 cells were treated with AZD1775 (500 nM), AZD6738 (1 μM) or their combination for 24 hr followed by 16 and 24 hr of drug wash-out. Merged images are separated by white lines. Scale bar = 30 μM. (D) Expression levels of cycle regulatory proteins including CDC25A, cyclin A, CDT1 and phosphorylation of CDK1-Y15 and γH2AX during the course of recovery following treatment with AZD1775 (500 nM), AZD6738 (1 μM), or their combination, were analysed by western blotting in recovering MDA-MB-231 cells. GAPDH expression level served as loading control.
Figure 4 with 2 supplements
DNA-PK is phosphorylated in response to AZD1775 and preserves CHK1 phosphorylation independent of ATR.
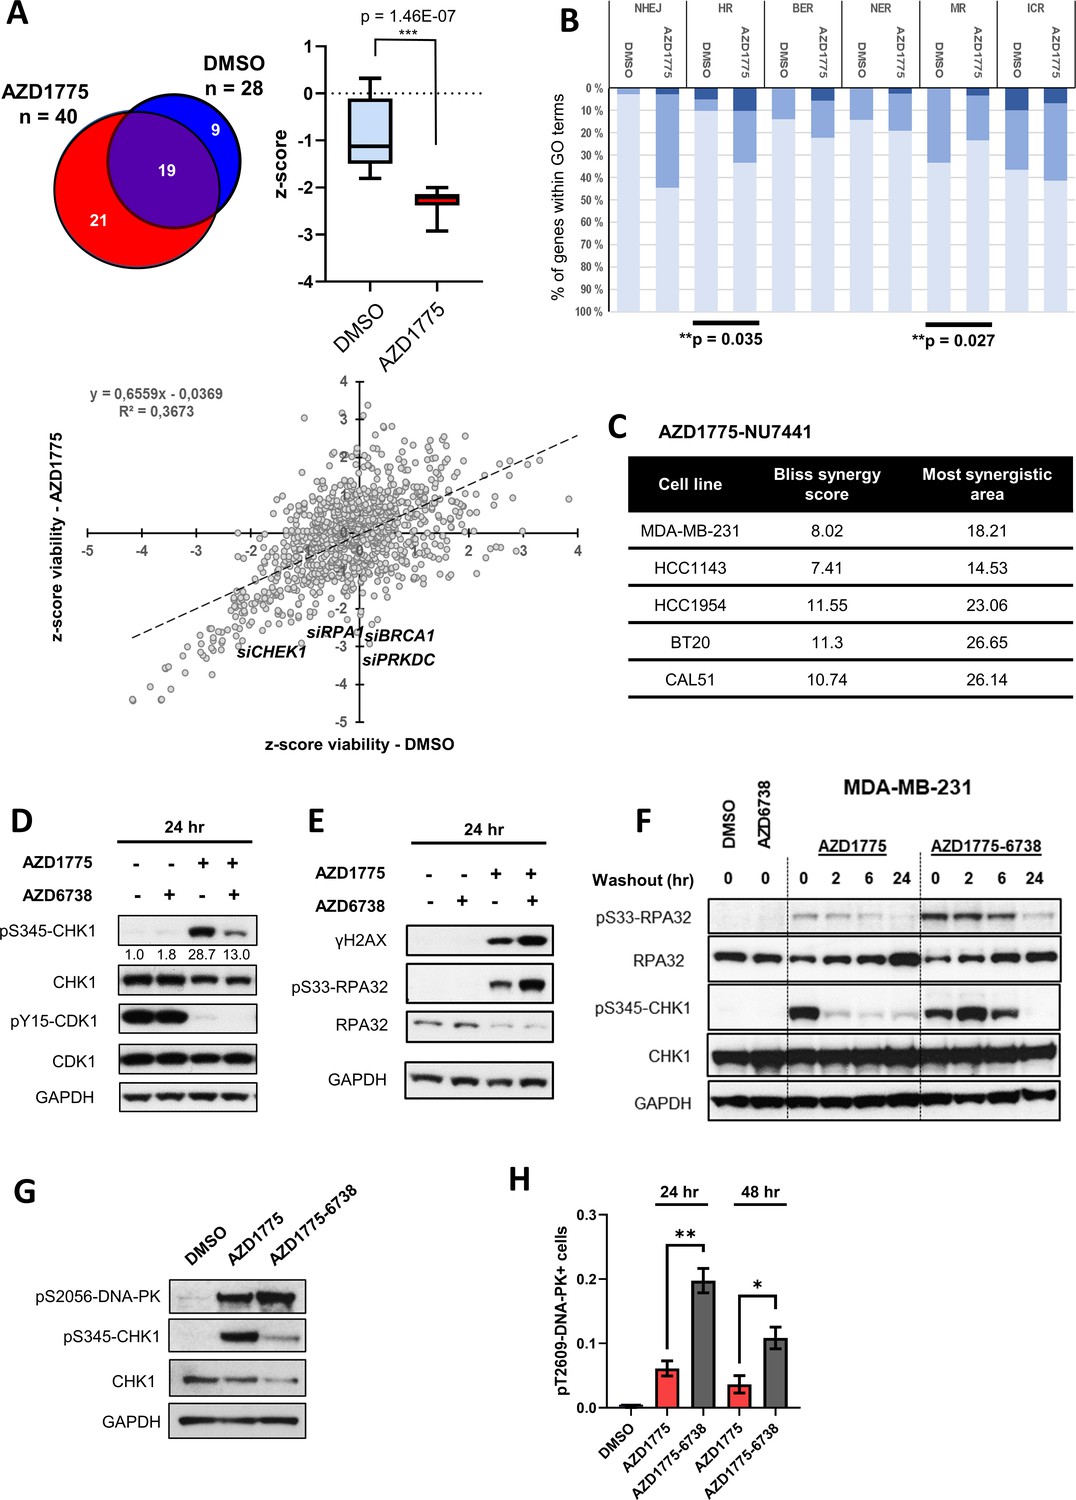
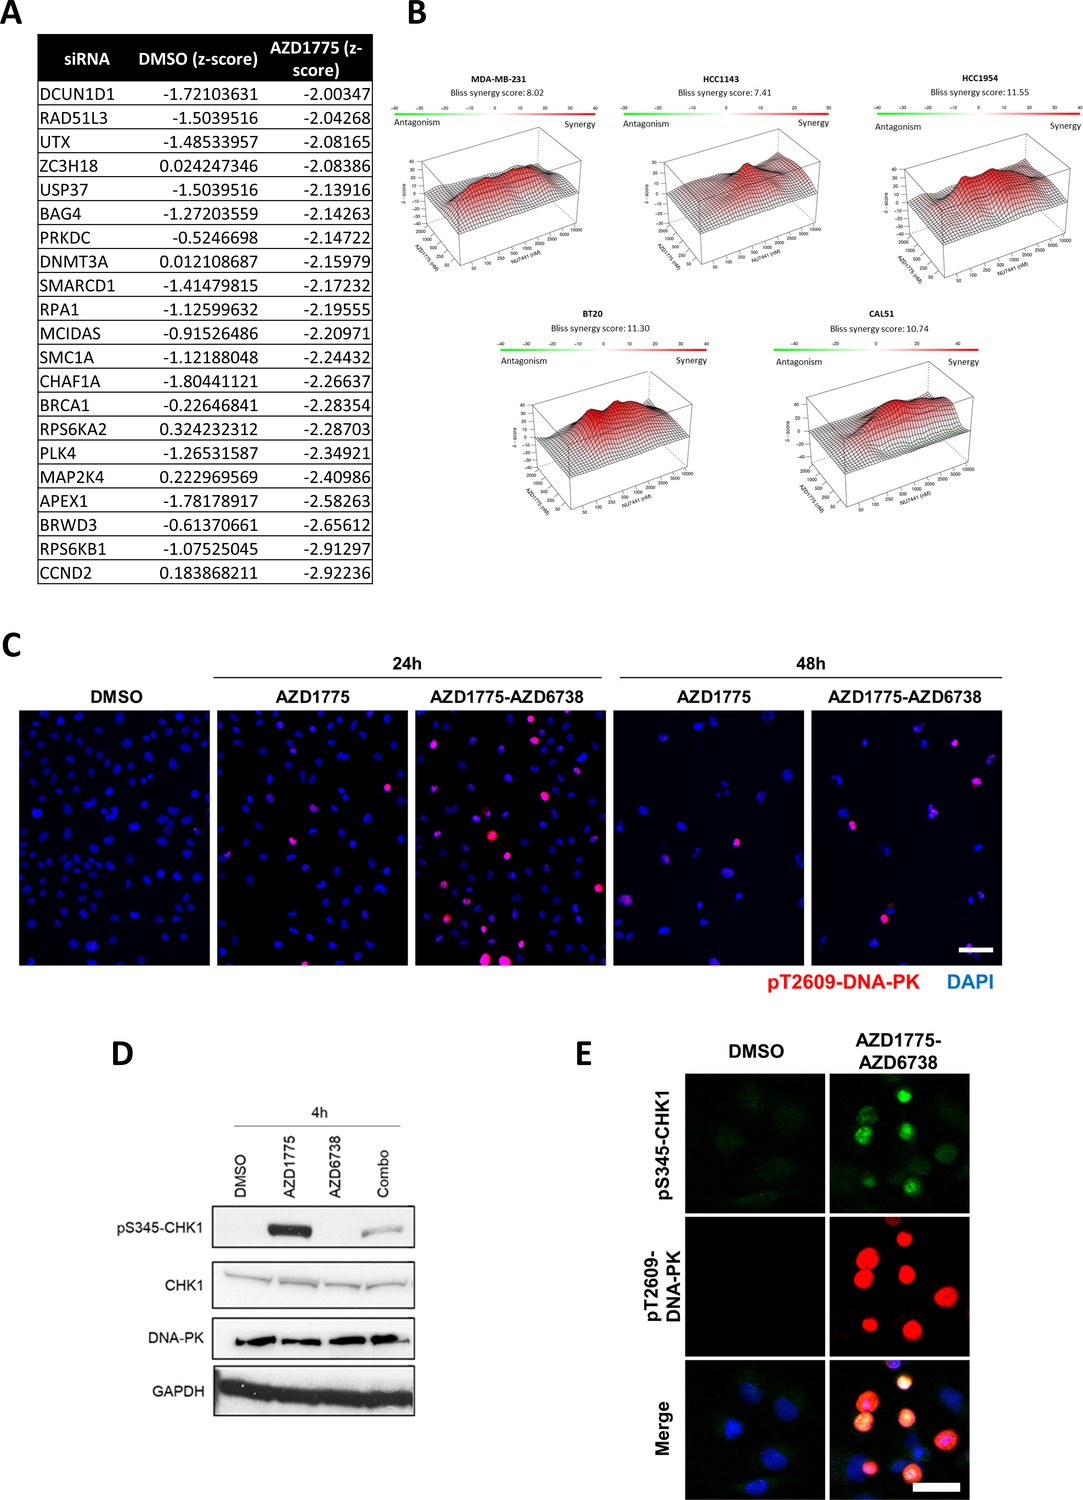
(A) MDA-MB-231 cells were transfected with a library of siRNAs targeting 300 DNA repair genes and analysed for siRNA hits (three siRNAs per gene) reducing viability in response to AZD1775 treatment by high-content image analysis. siRNAs targeting 28 genes resulted in significant loss of viability in control conditions compared to 40 genes in combination with AZD1775. 21 genes selectively reduced viability when combined with AZD1775 (p=1.46E-7) (Upper panel). Scatter plot visualisation of the viability z-score correlation of all siRNAs in the screen. Target genes (siRNAs) affecting MDA-MB-231 cell viability from the DDR siRNA library in response to 72 hr treatment of AZD1775 are marked in the plot (Lower panel). (B) Grouping of different DNA repair pathway-associated genes from high-content siRNA screen based on gene ontologies. Knockdown of homologous recombination (HR) genes associates with increased sensitivity to AZD1775 (p=0.035). Bars are coloured according to z-score. z-score < −2 (dark), z-score < −1 (medium) and z-score - n.s. (light). (C) BLBC cell lines were treated with NU7441 and AZD1775 at different concentrations for three days. Drug synergy scores (Bliss model) calculated from dose-response matrices are shown as indicated. (D) MDA-MB-231 cells were treated for 24 hr with the indicated drugs or DMSO control as specified. Whole cell lysates were collected, and expression and phosphorylation of CHK1 and CDK1 was analysed by immunoblotting with the specified antibodies. Expression of phosphorylated CHK1 was quantified by normalizing band density to total CHK1 band density. GAPDH level was used as loading control. (E) MDA-MB-231 cells were treated as in D and protein expression and phosphorylation analysed with the specified antibodies, as depicted. (F) MDA-MB-231 cells were treated as in D and harvested or allowed to recover in the absence of the compounds for 2, 6 or 24 hr before harvesting. Total cell lysates were immunoblotted with the indicated antibodies. (G) MDA-MB-231 cells treated for 24 hr with the indicated drugs and phosphorylation of DNA-PK (pS2056) and CHK1 (pS345) was assessed by immunoblotting. GAPDH level was used as loading control. (H) MDA-MB-231 cells were treated with the indicated drugs for 24 or 48 hr and phosphorylation of DNA-PK (pT2609) was analysed by high-content immunofluorescence microscopy. The proportion of pT2609-DNAPK-labelled cells represents mean of three biological replicates ± SEM. * and ** indicate p=0.029 and p=0.0036 respectively, as assessed by Student’s t-test.
-
Figure 4—source data 1
DNA-PK is phosphorylated in response to AZD1775 and preserves CHK1 phosphorylation independent of ATR.
(B) Grouping of different DNA repair pathway-associated genes from high-content siRNA screen based on gene ontologies. (C) Viability matrix based on alamarBlue staining to assess synergy between AZD1775 and NU7441 in MDA-MB-231, HCC1143, HCC1954, BT20 and Cal51 cells. (H) MDA-MB-231 cells were treated with the indicated drugs for 24 or 48 hr and phosphorylation of DNA-PK (pT2609) analysed by high-content immunofluorescence microscopy. The proportions of pT2609-DNAPK-labelled cells are shown.
- https://cdn.elifesciences.org/articles/57894/elife-57894-fig4-data1-v1.xlsx
Figure 4—figure supplement 1
DNA-PK is phosphorylated in response to AZD1775 and preserves CHK1 phosphorylation independent of ATR.
(A) List of genes whose siRNA-mediated knockdown selectively reduced viability of AZD1775-treated MDA-MB-231 cells in the high-content siRNA screen (Figure 4A). z-scores in DMSO and AZD1775-treated conditions are specified (negative values indicating reduced viability). (B) BLBC cell lines were treated with the indicated compounds at different concentrations for three days. Drug synergies from dose-response matrices are shown as surface plots to visualize interaction at different drug concentrations. Plots were generated and synergy scores calculated based on the Bliss model using the publicly-available online tool SynergyFinder (Ianevski et al., 2017). (C) Representative immunofluorescence images for staining of pT2609-DNAPK (red) in MDA-MB-231 cells treated with the AZD1775 or the AZD1775-AZD6738 combination or DMSO for 24 hr and 48 hr. Scale bar = 60 μm. (D) MDA-MB-231 cells were treated as indicated for 4 hr and total cell lysates were immunoblotted with the indicated antibodies. (E) Representative immunofluorescence images for staining of pS345-CHK1 (green) and pT2609-DNA-PK (red) in MDA-MB-231 cells treated with AZD1775, AZD6738, AZD1775-AZD6738 combination or DMSO for 24 hr. Scale bar = 30 μm.
Figure 4—figure supplement 2
DNA-PK is phosphorylated in response to AZD1775 and preserves CHK1 phosphorylation independent of ATR.
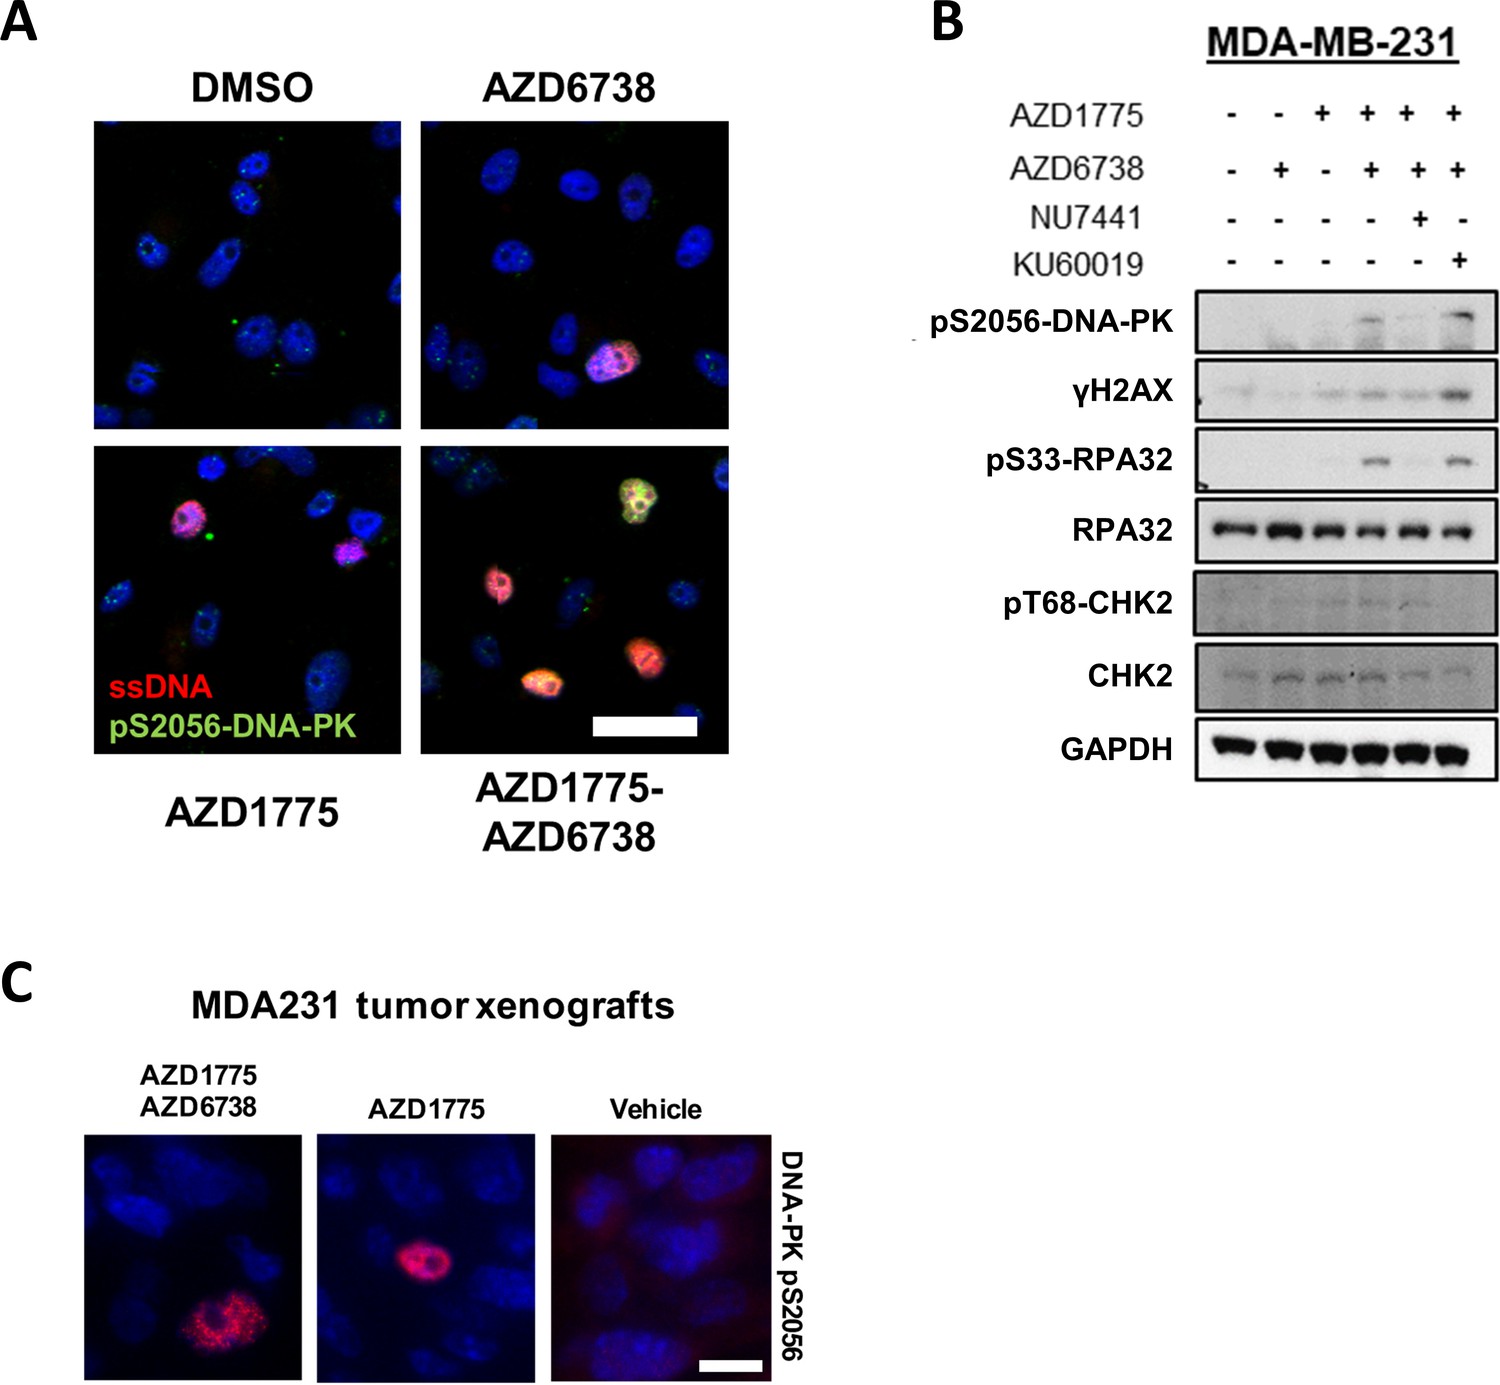
(A) Representative immunofluorescence images for staining of pS2056-DNA-PK (green) and BrdU/ssDNA (red) in MDA-MB-231 cells treated with AZD1775, AZD6738, AZD1775-AZD6738 combination or DMSO for 24 hr. Scale bar = 30 μm. (B) Phosphorylation of DNA-PK (pS2056), RPA32 (pS33-RPA32) and CHK2 (pT68) in MDA-MB-231 cells treated with the indicated drugs (AZD1775 (500 nM), AZD6738 (1 μM), NU-7441 (DNA-PK inhibitor, 1 μM) or KU-60019 (ATM inhibitor, 1 μM) for 24 hr. Whole cell lysates were collected, immunoblotted and probed with the indicated antibodies. GAPDH levels were used as loading control. (C) DNA-PK phosphorylation in MDA-MB-231 tumours. MDA-MB-231 tumours from mice treated with AZD1775, AZD6738, AZD1775-AZD6730 combination or vehicle control (as in Figure 3B) were formalin-fixed, paraffin-embedded and stained for pDNA-PK-S2056. Representative images are shown. Scale bar = 30 μm.
Figure 5 with 2 supplements
DNA-PK regulates recovery of replication and survival in response to AZD1775.
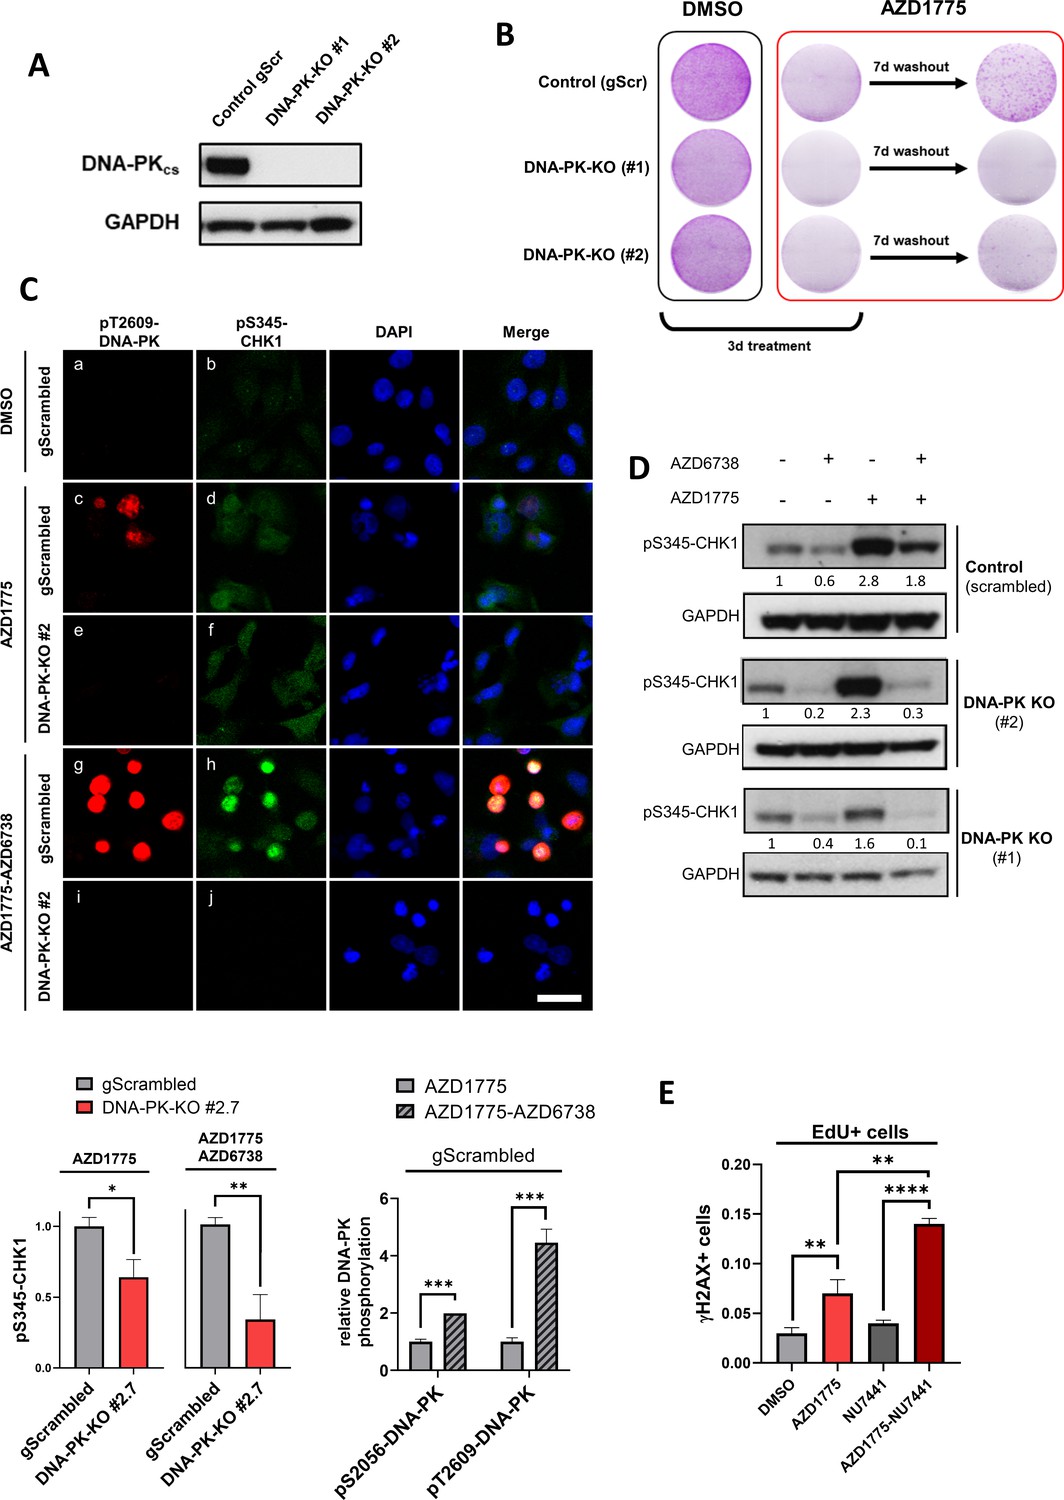
(A) Immunoblot analysis of DNA-PK expression in MDA-MB-231 scrambled control and isogenic DNA-PK knock-out cell lines (clones #1 and #2). GAPDH expression was used as loading control. (B) Recovery of proliferation following AZD1775 mono-treatment (500 nM) in DNA-PK-proficient and DNA-PK-deficient MDA-MB-231 cells. Cells were treated for three days and allowed to recover for seven days without the drug and subsequently analysed by crystal violet staining. Representative images from >three independent experiments are shown. (C) Top panel: Immunofluorescence staining of pS345-CHK1 (green) and pT2609-DNA-PK (red) in DNA-PK-deficient (clone #2) and DNA-PK-proficient (control) MDA-MB-231 cells treated with 500 nM AZD1775, a combination of AZD1775 (500 nM) and AZD6738 (1 μM) or DMSO control. Scale bar = 30 μm. Bottom panels: Quantification of HCI-based analysis of pS345-CHK1 in DNA-PK-deficient (clone #2) and DNA-PK-proficient (control) MDA-MB-231 cells treated as above (left) and pT2609-DNA-PK as well as pS2056-DNA-PK in control cells (right). *p=0.01, **p=0.0032 and ***p<0.0003 as assessed by Student’s t-test. (D) Immunoblot analysis of CHK1 phosphorylation (pS345-CHK1) in MDA-MB-231 scrambled control and DNA-PK knock-out cell lines (clones #1 and #2) treated with the indicated drugs for 24 hr. GAPDH expression was used as loading control. Expression of phosphorylated CHK1 was quantified by normalizing band density to GAPDH band density. (E) Quantification of DNA damage by HCI analysis of γH2AX-positive cells in the replicating (EdU+) fraction. MDA-MB-231 cells were treated with the indicated inhibitors for 24 hr. Graphs show the proportions of EdU/γH2AX double-positive cells, **p<0.01 and ****p<0.0001 as assessed by Student’s t-test.
-
Figure 5—source data 1
DNA-PK regulates recovery of replication and survival in response to AZD1775.
(C) Imaging-based quantification of pS345-CHK1-positive cells in DNA-PK-deficient (clone #2) and DNA-PK-proficient (control) MDA-MB-231 cells treated as indicated, as well as quantification of pT2609-DNA-PK and pS2056-DNA-PK in control cells. (E) Imaging-based quantification of γH2AX-positive cells in the replicating (EdU+) fraction. MDA-MB-231 cells were treated with the indicated inhibitors for 24 hr and proportions of EdU/γH2AX double-positive cells measured. (Supplement 2B) Quantification of HCI-based analysis of CHK1 and DNA-PK in DNA-PK-deficient (clone #2) and DNA-PK-proficient (control) MDA-MB-231 cells treated with 500 nM AZD1775 or the AZD1775 (500 nM)-AZD6738 (1 μM) combination for 24 hr. (Supplement 2C) Cell viability assessment by crystal violet staining assay in response to 72 hr treatment with increasing concentrations of etoposide comparing MDA-MB-231 parental and DNA-PK-deficient cells (clone #2).
- https://cdn.elifesciences.org/articles/57894/elife-57894-fig5-data1-v1.xlsx
Figure 5—figure supplement 1
DNA-PK regulates recovery of replication and survival in response to AZD1775.
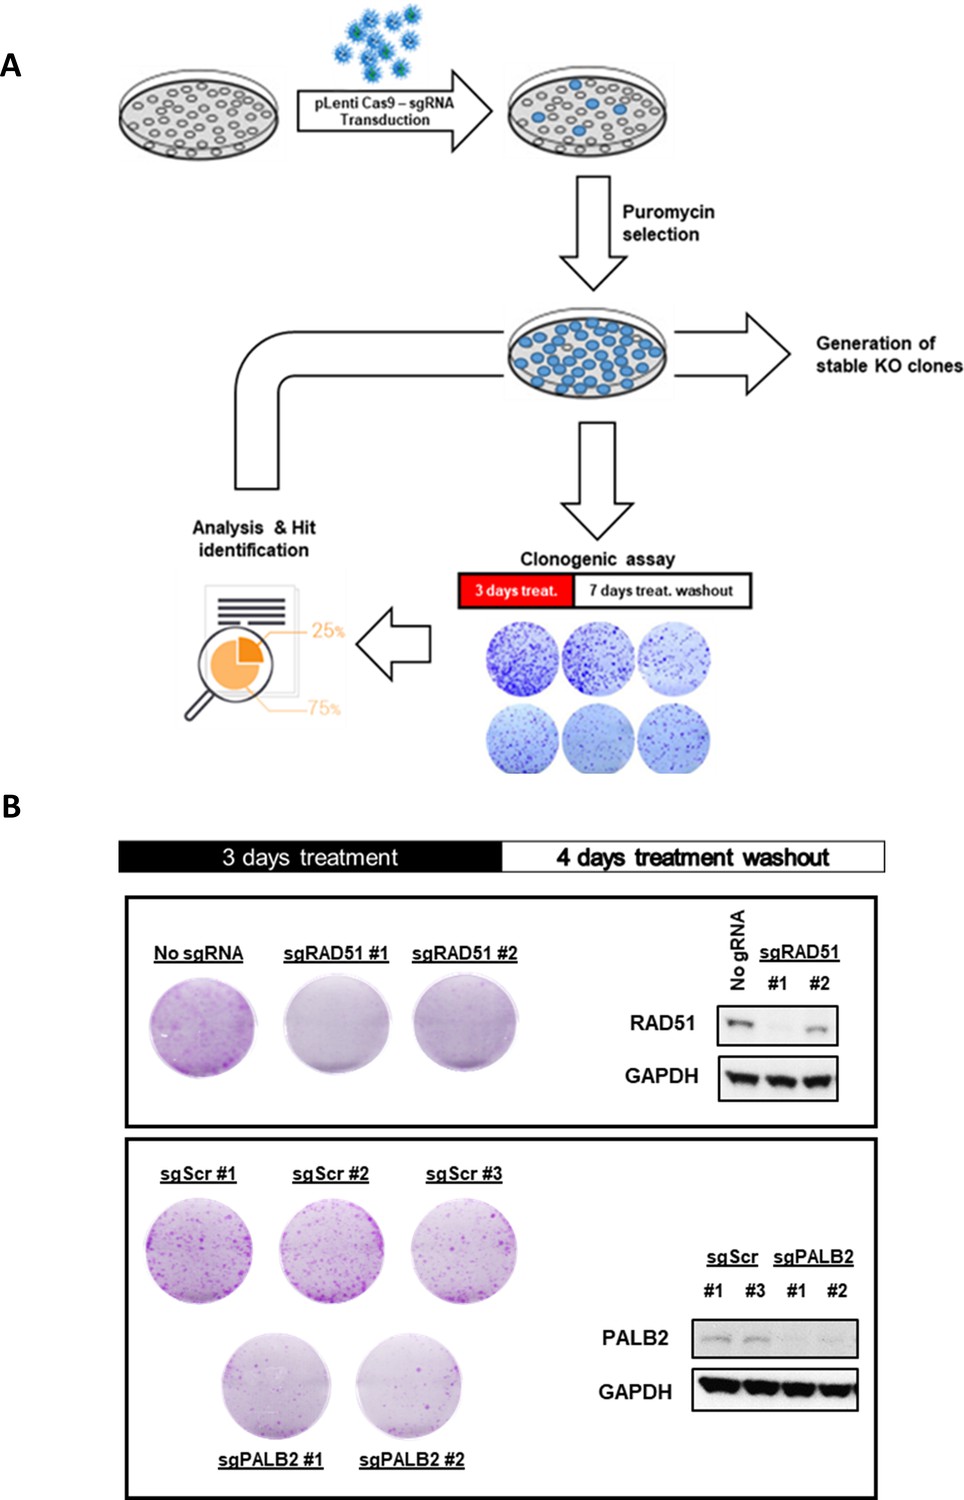
(A) Schematic overview of the CRISPR-Cas9-mediated generation of gene knock-out cells and assessment of sensitivity and recovery after AZD1775 treatment washout. (B) Recovery of proliferation following removal of AZD1775 was analysed by crystal violet staining and quantified by colorimetry. MDA-MB-231 cell lines transduced with Cas9 and scrambled control gRNA or gRNAs targeting RAD51 and PALB2 genes were treated for three days and allowed to recover for an additional four days without the drug. Representative images of crystal violet stainings are shown for each cell line.
Figure 5—figure supplement 2

DNA-PK regulates recovery of replication and survival in response to AZD1775.
(A) DNA sequencing confirming deletion of DNA-PK in MDA-MB-231 DNA-PK-knockout isogenic cell lines, clones #1.3 (#1) and #2.7 (#2). Region targeted by gRNAs was PCR-amplified and cloned into pTopo2.1 and sequenced, revealing presence of the same mutant allele resulting in frameshift mutations and premature stop codons in DNA-PK. Presence of only one allele was verified by mismatch-specific endonuclease-based genome editing detection kit (not shown). (B) Quantification of HCI-based analysis of CHK1 and DNA-PK in DNA-PK-deficient (clone #2) and DNA-PK-proficient (control) MDA-MB-231 cells treated with 500 nM AZD1775 or the AZD1775 (500 nM)-AZD6738 (1 μM) combination for 24 hr. (C) Cell viability assessment by crystal violet staining assay in response to 72 hr treatment with increasing concentrations of etoposide comparing MDA-MB-231 parental cells and DNA-PK-deficient cells (clone #2). *, ** and **** denote p-values obtained from Student’s t-test corresponding to <0.05,<0.01 and<0.0001 respectively. (D) Representative images related to Figure 5E. MDA-MB-231 cells were treated with the indicated inhibitors for 24 hr, spiked with EdU 1 hr prior to fixation and stained for EdU (red) and γH2AX (green). Scale bar = 60 μm. (E) Representative flow cytometry dot plots (upper panel) showing the distribution of EdU and γH2AX incorporation in MDA-MB-231 scrambled control and DNA-PK knockout cells (clone #1) treated for 24 hr with DMSO or AZD1775 (500 nM). Proportion of EdU-positive cells gated in the FACS plots and sub-divided according to γH2AX staining (lower panel, grey = EdU-, red = EdU+).
Figure 6 with 1 supplement

Deletion of DNAPK or PTEN attenuates CHK1 phosphorylation, impedes downregulation of cyclin E and overrides replication arrest in response to AZD1775 monotherapy-induced DNA damage.
(A) HCC38 cells were treated with the indicated drugs for 24 or 48 hr and phosphorylation of DNA-PK (pT2609) was analysed by HCI analysis. The proportion of pT2609-DNA-PK-labelled cells represents mean of three biological replicates ± SEM. (B) Immunoblot analysis of CHK1 phosphorylation (pS345-CHK1) and DNAPK phosphorylation (pS2056-DNAPK) in MDA-MB-231 and HCC38 cells treated with the indicated drugs for 24 hr. GAPDH expression was used as loading control. (C) Phosphorylation of DNAPK (pS2056-DNAPK), CHK1 (pS345-CHK1) and AKT (pS473-AKT) in MDA-MB-231 PTEN-proficient and PTEN-deficient (PTEN-KO clone #1) treated with the indicated drugs for 24 hr. Whole cell lysates were immunoblotted with the specified antibodies. GAPDH expression was used as loading control. Expression of phosphorylated CHK1 was quantified by normalizing band intensity to CHK1 band intensity. (D) Box-plots of HR (BRCA1, BRCA2, ATR) and NHEJ (PRKDC, XRCC5, XRCC6) protein expression levels (ratio to pool) in the different groups of breast cancer cell lines according to AZD1775 response characteristics (recovering-basal, sensitive-basal and recovering-luminal). (E) Expression level (ratio to pool) box-plots of PTEN and select replication/cell cycle-associated proteins in the different groups of BC cell lines according to AZD1775 response characteristics (recovering-basal, sensitive-basal and recovering-luminal). (F) Cyclin E protein expression levels in MDA-MB-231 PTEN-proficient and PTEN-deficient (PTEN-KO clone #1) treated with AZD1775 (500 nM) for the time points indicated. Whole cell lysates were immunoblotted with the specified antibodies and quantified by ImageJ (NIH). (G) Cyclin E protein expression levels in DNA-PK-proficient and DNA-PK-deficient (DNA-PK-KO clone #1) MDA-MB-231 cells treated with the indicated drugs (500 nM AZD1775, 1 µM AZD6738) for 24 hr. Whole cell lysates were immunoblotted with the specified antibodies. (H) Schematic model of the molecular network underlying differential responses to WEE1 inhibition in BLBCs. In DNA-PK and PTEN-proficient cells, AZD1775 mono-treatment results in high levels of replication stress and activation of CHK1 to establish the replication checkpoint and to restrain CDK2 activity, resulting in replication arrest, DNA repair and recovery after drug removal (left). In the absence of ATR, for example due to pharmacological inhibition by AZD6738, activated DNA-PK and PTEN sustain CHK1 activation resulting in replication arrest and cellular senescence in response to AZD1775 treatment (middle). Conversely, in the absence or after inhibition of DNA-PK or PTEN, cells fail to elicit a checkpoint in response to AZD1775 and undergo replication catastrophe and apoptosis (right).
-
Figure 6—source data 1
Deletion of DNAPK or PTEN attenuates CHK1 phosphorylation, impedes downregulation of cyclin E and overrides replication arrest in response to AZD1775 monotherapy-induced DNA damage.
(A) Quantification of the proportion of pT2609-DNA-PK-positive HCC38 cells after 24 or 48 hr treatment with the indicated drugs. (Supplement 1G) HCI cell-cycle analysis of BC cell lines based on integrated nuclear DAPI intensity (nuclear area/DAPI mean intensity).
- https://cdn.elifesciences.org/articles/57894/elife-57894-fig6-data1-v1.xlsx
Figure 6—figure supplement 1
Deletion of DNAPK or PTEN attenuates CHK1 phosphorylation, impedes downregulation of cyclin E and overrides replication arrest in response to AZD1775 monotherapy-induced DNA damage.
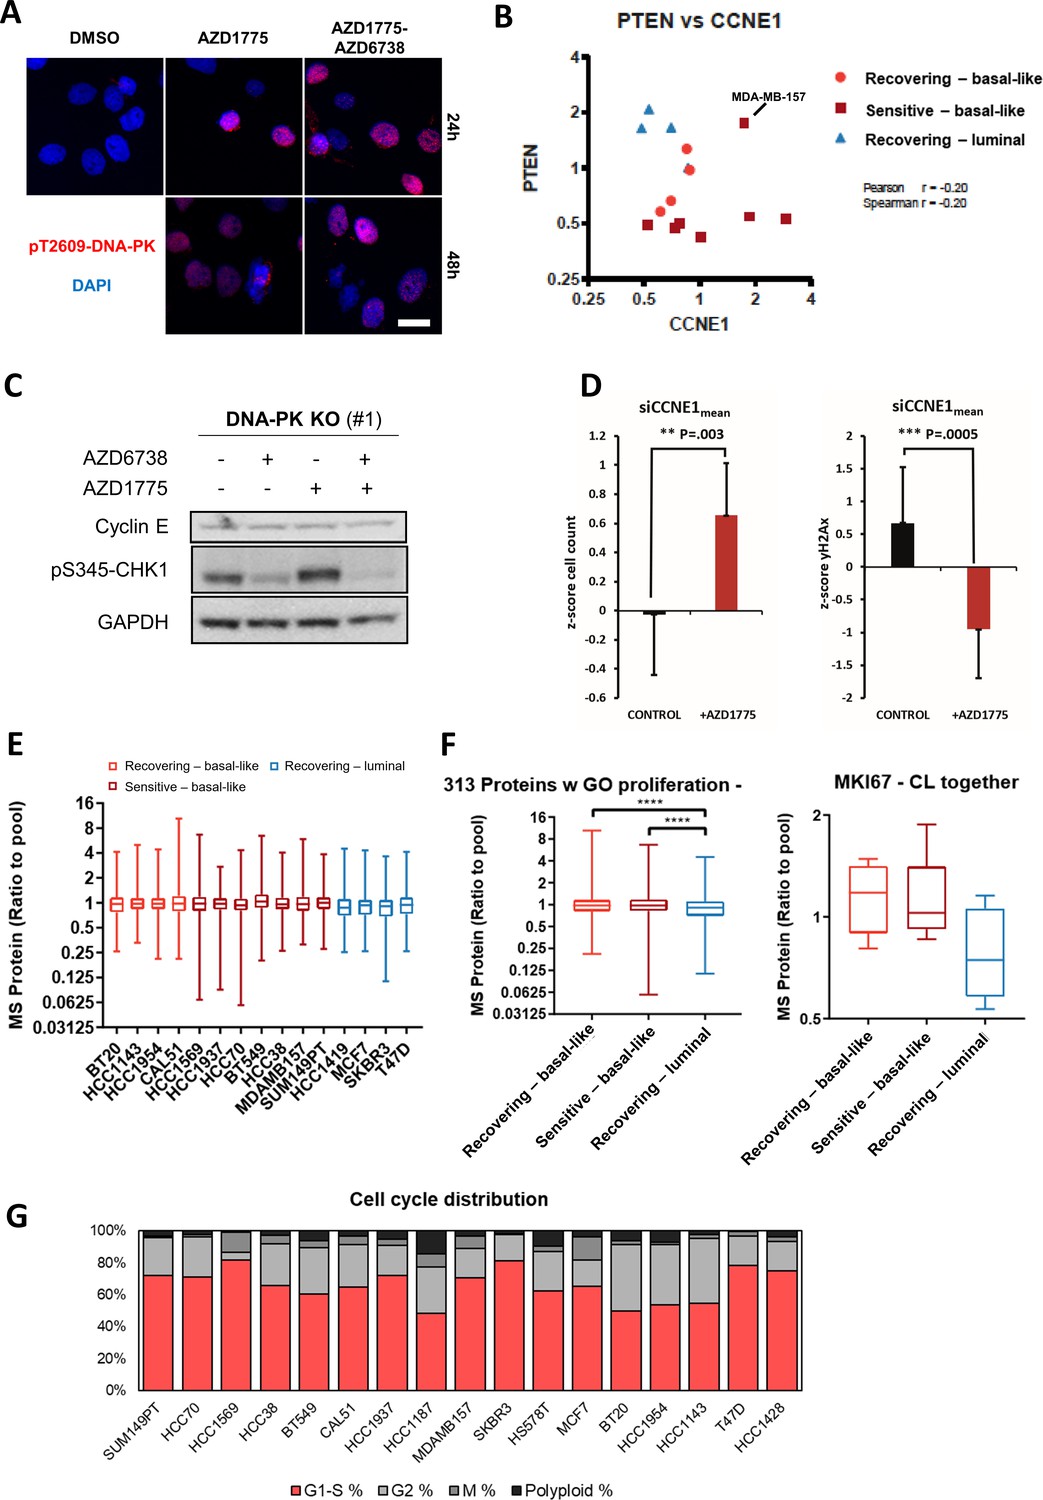
(A) HCC38 cells were treated with the indicated drugs for 24 or 48 hr and phosphorylation of DNA-PK (pT2609) analysed by HCI. Representative images are shown. Scale bar = 30 μM. (B) Correlation between PTEN and CCNE1 protein expression levels in AZD1775 sensitive vs. recovering cell lines. Pearson correlation coefficient r = −0.2, Spearman correlation coefficient r = −0.2. (C) Immunoblot of isogenic MDA-MB-231 DNA-PK knockout cells (clone #1) probed with the indicated antibodies after 24 hr treatment with AZD1775 (500 nM), AZD6738 (1 μM), combination of AZD1775 and AZD6738, or DMSO control as specified. (D) Cell viability (left) and nuclear γH2AX intensity (right) determined by imaging-based cytometry assay in MDA-MB-231 cells transfected 24 hr with CCNE1 siRNAs and followed by 48 hr treatment with AZD1775 (500 nM) or DMSO (n = three CCNE1 siRNAs; mean of two technical replicates each from a representative experiment are shown). (E) Protein expression analysis of proliferation-related proteins (based on Gene Ontology) in different breast cancer cell lines (upper). In box plots, centre line represents median and the boxed region represents the first to third quartile, whiskers according to Tukey. (F) Protein expression analysis of proliferation-related proteins in each respective group (basal-like recurrent, basal-like sensitive and luminal recurrent) (left panel) and MKI67 protein abundance in each respective group (right panel). In box plots, centre line represents median and the boxed region represents the first to third quartile, whiskers according to Tukey. (G) Image based cytometry analysis of integrated nuclear DAPI intensity (nuclear area/DAPI mean intensity) was used for cell cycle analysis of BC cell lines. Coloured bars indicate % of cells classified as G1-S (red), G2 (light grey), M (dark grey) and polyploidy (black).
Tables
Key resources table
| Reagent type (species) or resource | Designation | Source or reference | Identifiers | Additional information |
|---|---|---|---|---|
| Genetic reagent (Mus musculus) | NOD/SCID | Taconic/Denmark | #NODSC | |
| Cell line (Homo sapiens) | MDA-MB-231 | ATCC | Cat #HTB-26 RRID:CVCL_0062 | |
| Cell line (H. sapiens) | MDA-MB-231 gScrambled | This Paper | CRISPR/Cas9-expressing cell line | |
| Cell line (H. sapiens) | MDA-MB-231 PTEN-KO | This Paper | Clone #1.4 Clone #2.3 | CRISPR/Cas9 knock-out cell lines |
| Cell line (H. sapiens) | MDA-MB-231 DNA-PK-KO | This Paper | Clone #1.4 Clone #2.3 | CRISPR/Cas9 knock-out cell lines |
| Cell line (H. sapiens) | HCC1937-Empty vector (EV) | This Paper | Stable pBabe-puro expressing cell line | |
| Cell line (H. sapiens) | HCC1937-PTEN | This Paper | Stable pBabe-puroL-PTEN expressing cell line | |
| Recombinant DNA reagent | pBABE-puro (plasmid) | Addgene | RRID:Addgene_1764 | Retroviral empty backbone construct |
| Recombinant DNA reagent | pBABE-puroL PTEN (plasmid) | Addgene | RRID:Addgen 10785 | Retroviral construct expressing PTEN |
| Chemical compound, drug | AZD1775 | AstraZeneca | ||
| Chemical compound, drug | AZD6738 | AstraZeneca | ||
| Software, algorithm | GraphPad Prism 8 | GraphPad Software | Version 8.3 RRID:SCR_002798 | |
| Software, algorithm | CellProfiler | Carpenter lab, Broad Institute | Version 3.1 RRID:SCR_007358 | |
| Software, algorithm | ImageJ | Wayne Rasband, National Institutes of Health | RRID:SCR_003070 | |
| Software, algorithm | SynergyFinder | Institute for Molecular Medicine Finland | PMCID:PMC5554616 | |
| Software, algorithm | Depmap portal | Broad Institute | RRID:SCR_017655 |
Additional files
-
Supplementary file 1
AZD1775 response characteristics in human breast cancer cell lines.
- https://cdn.elifesciences.org/articles/57894/elife-57894-supp1-v1.xlsx
-
Supplementary file 2
Transcriptomics data for human breast cancer cell lines.
- https://cdn.elifesciences.org/articles/57894/elife-57894-supp2-v1.xlsx
-
Supplementary file 3
Proteomics data for human breast cancer cell lines.
- https://cdn.elifesciences.org/articles/57894/elife-57894-supp3-v1.xlsx
-
Supplementary file 4
List of all antibodies.
- https://cdn.elifesciences.org/articles/57894/elife-57894-supp4-v1.xlsx
-
Transparent reporting form
- https://cdn.elifesciences.org/articles/57894/elife-57894-transrepform-v1.docx
Download links
A two-part list of links to download the article, or parts of the article, in various formats.
Downloads (link to download the article as PDF)
Open citations (links to open the citations from this article in various online reference manager services)
Cite this article (links to download the citations from this article in formats compatible with various reference manager tools)
PTEN and DNA-PK determine sensitivity and recovery in response to WEE1 inhibition in human breast cancer
eLife 9:e57894.
https://doi.org/10.7554/eLife.57894


