Robo functions as an attractive cue for glial migration through SYG-1/Neph
- Department of Molecular Genetics and Microbiology, Duke University Medical Center, United States
- Department of Neurobiology, Regeneration Next Initiative, Duke Center for Neurodegeneration and Neurotherapeutics, and Duke Institute for Brain Sciences, Duke University Medical Center, United States
Figures
Figure 1 with 1 supplement
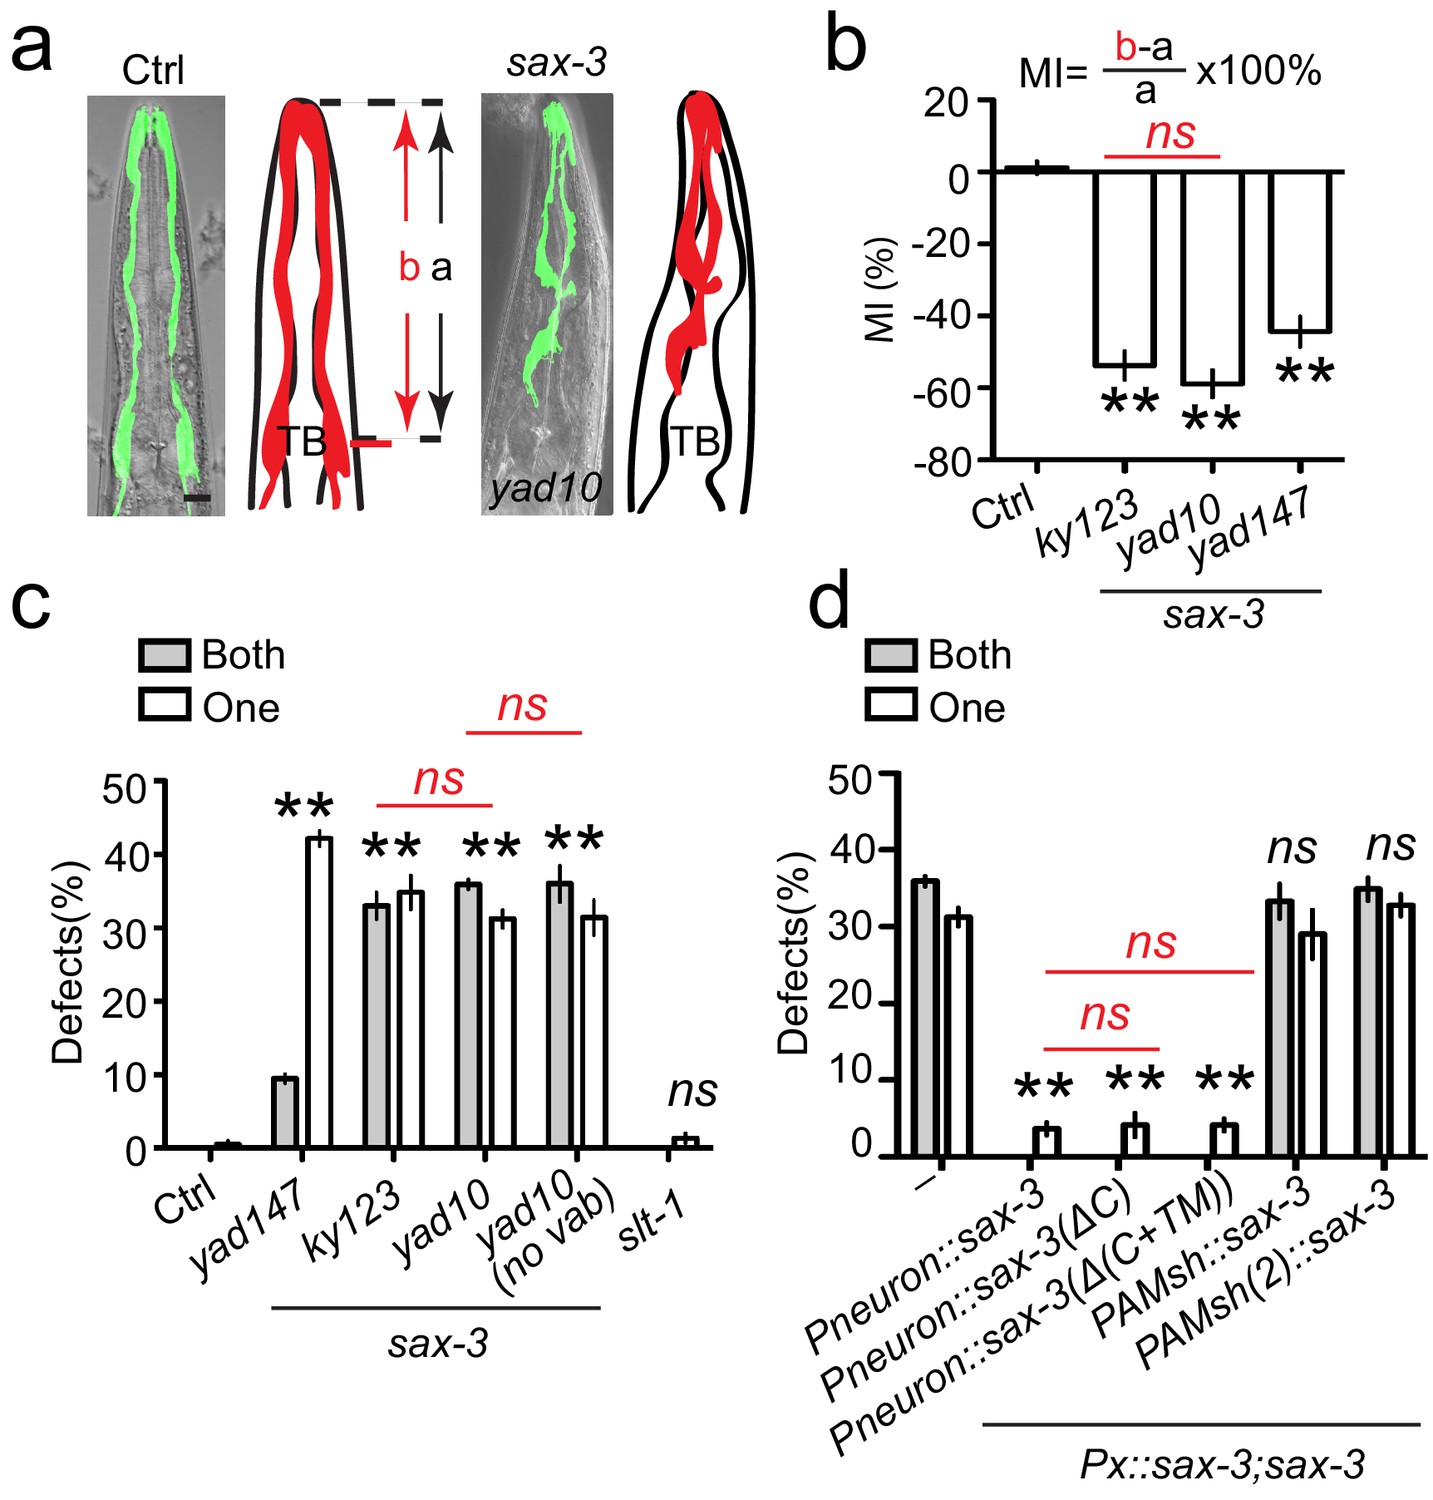
sax-3/Robo regulates AMsh glial migration in a Slit-independent fashion.
(a) Loss-of-function in sax-3 causes defects in AMsh glial migration. Confocal images and schematic representation of AMsh glia in control and sax-3(yad10) animals expressing Pf53f4.13::GFP (yadIs48). TB: pharyngeal terminal bulb. Scale bar, 10 µm. (b) Quantification of Migration Index (MI) in control and three alleles of sax-3(lf) animals. MI is calculated as (b–a)/a × 100%. As illustrated in the (a), ‘a’ represents the distance between the tip of nose and the center of the pharyngeal terminal bulb. ‘b’ shows the distance between the tip of nose and the center of the AMsh cell bodies. (c) The function of sax-3 does not rely on slt-1. White and gray bars show the percentage of animals with defects in one AMsh or both AMsh glia respectively. ‘no vab’: animals with normal head morphology. (d) Expression of a secreted SAX-3 extracellular fragment in neurons rescue AMsh defects in sax-3(lf) animals. Data shows the percentage of animals with AMsh migration defects. Punc-33(Pneuron), Pf53f4.13(PAMsh), and Pf16f9.3(PAMsh(2)) are used as pan-neuronal and AMsh-specific promoters to express genes in neurons or AMsh glia. In (b), data are represented as mean ± SEM. One-way ANOVA test. **, p<0.01; Each point represents at least 30 worms. In (c) and (d), data are represented as mean ± SEM. Two-way ANOVA test. **, p<0.01; ns, no significant difference. Each point represents three experiments of at least 50 worms each.
Figure 1—figure supplement 1
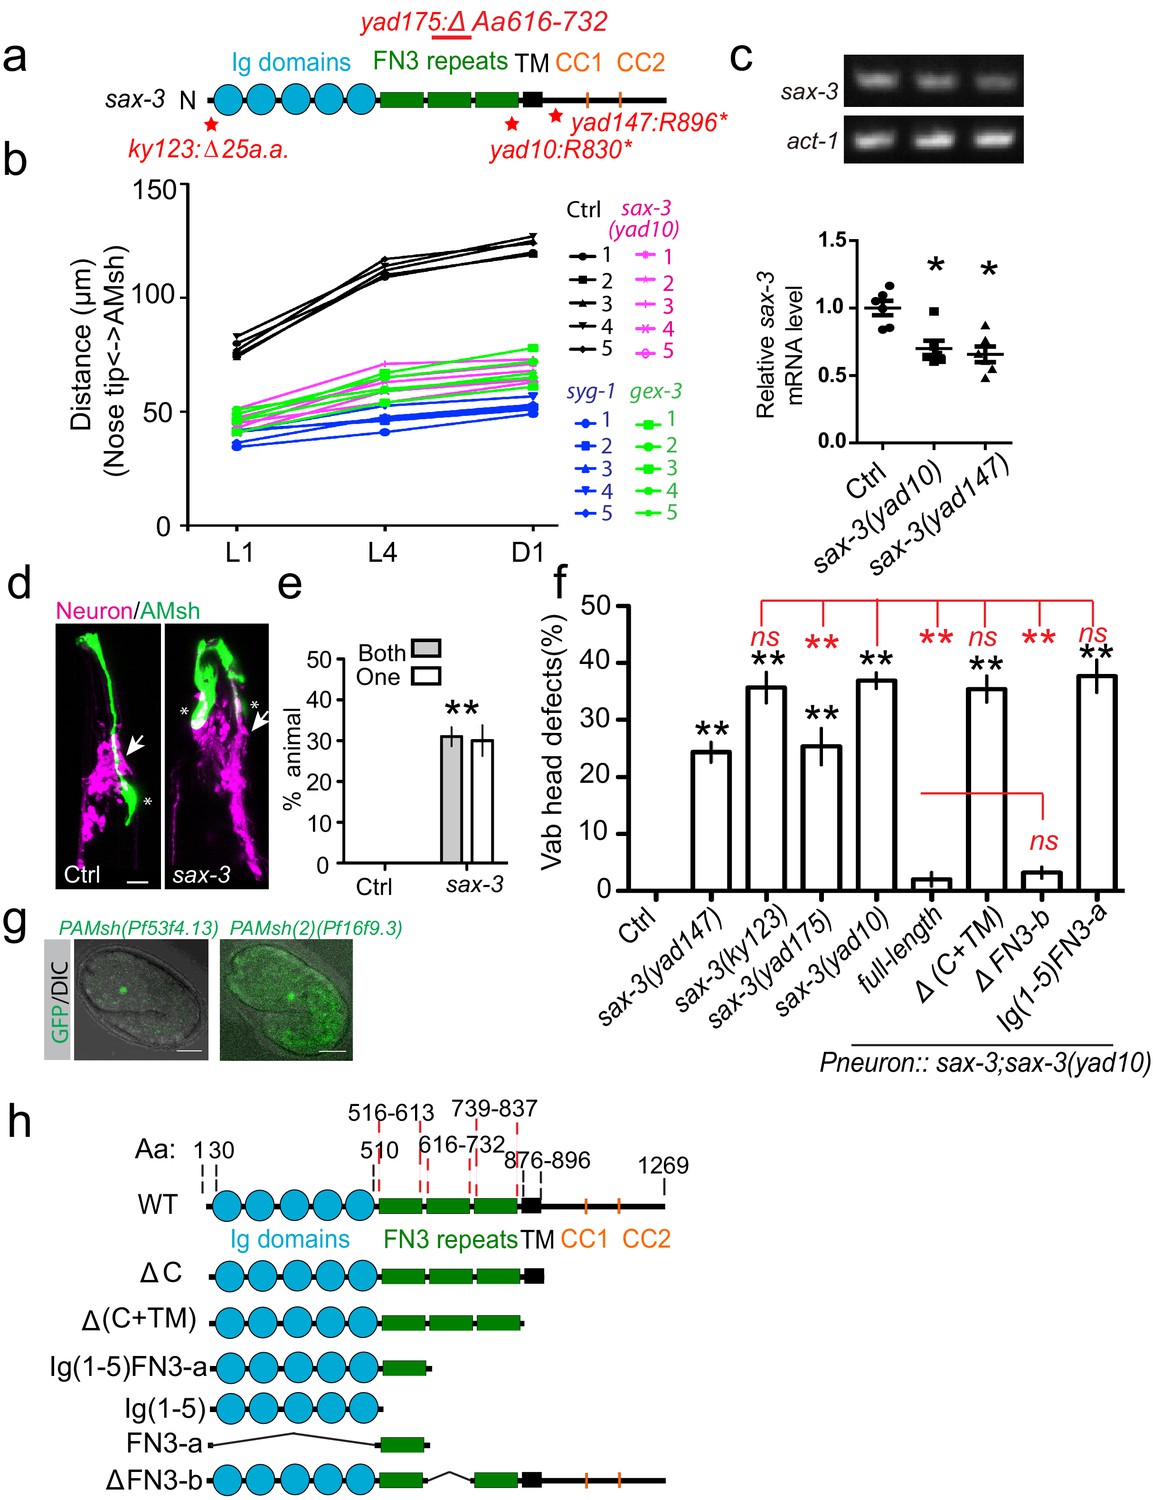
Loss-of-function of sax-3/Robo causes AMsh migration defects.
(a) Diagram shows the mutations in four different sax-3 alleles examined in this study. (b) Data showing the distance between the nose tip and the center of AMsh cell bodies at different developmental stages of individual animals. Five animals were quantified for each genotype, and each animal is represented by a single line. (c) Gel pictures (top) and quantification of RT-PCR results show that both yad10 and yad147 mutations decrease the expression of sax-3 mRNA. act-1/actin was used as a control. Student’s t-test, *p<0.05. (d–e) AMsh migration defects in sax-3 mutants did not originate from a displaced nerve ring. Confocal images (d) and quantification data (e), % of animals with AMsh glia locating at the anterior of the nerve ring, show that AMsh glia are at the anterior of the displaced nerve ring. (g) Confocal images show that both PAMsh (Pf53f4.13) and PAMsh(2) (Pf16f9.3) are expressed in the AMsh glia at the 1.5-fold stage. H2B::GFP was expressed under these promoters. (f) Quantification shows the percentage of animals with ‘vab head’ defects. Punc-33 promoter is used as the pan-neuronal promoter. (h) Diagrams show all constructs used in this study. In (e) and (f), data are represented as mean ± SEM. Two-way ANOVA test. **, p<0.01; ns, no significant difference. Each point represents three experiments of at least 50 worms. Scale bar, 10 µm.
Figure 2 with 1 supplement

The extracellular cleavage of SAX-3 is required for AMsh glial migration.
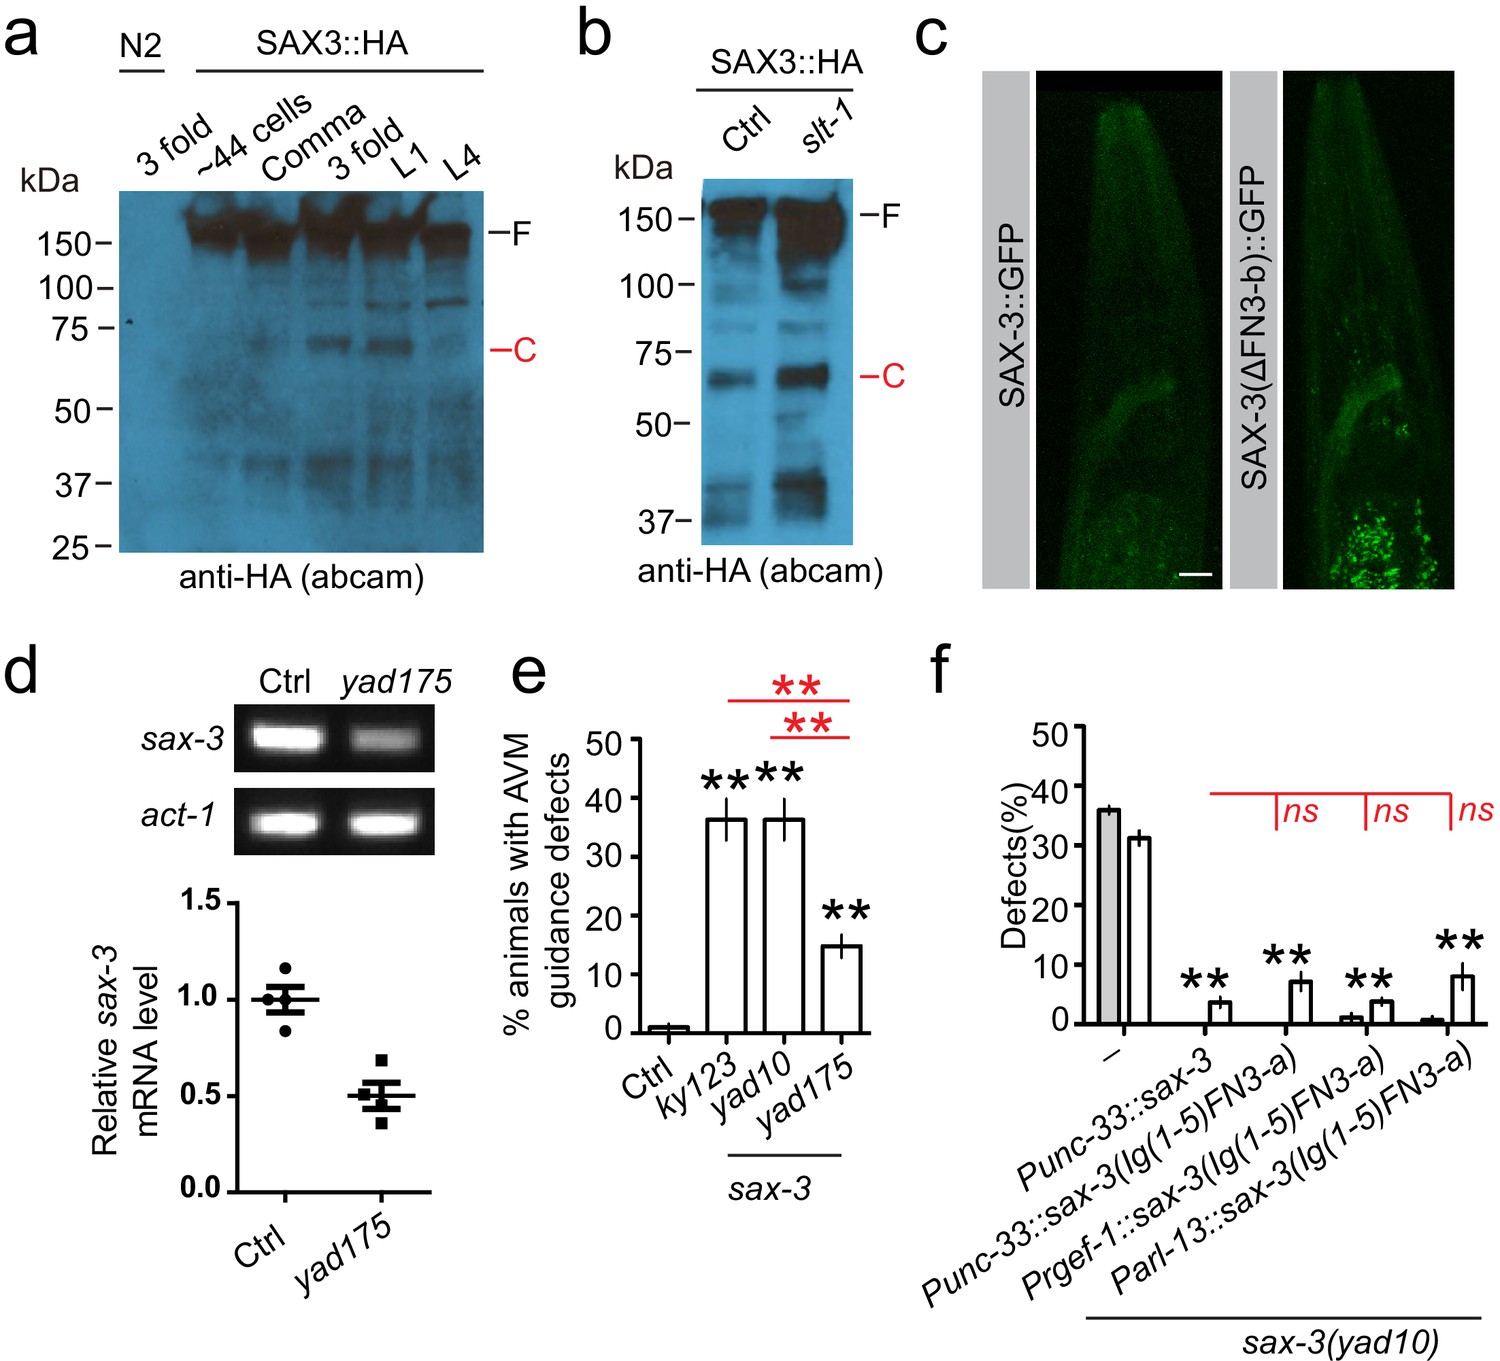
(a) SAX-3 is cleaved in the extracellular region during development. A schematic diagram at the top panel shows that the HA tag was fused at the C-terminal of SAX-3, and the leftover of the extracellular cleavage detected by the HA antibody is about 70 kDa. Results from western blot show a cleavage fragment of SAX-3 in later embryonic and early larval stages. F: full length SAX-3::HA; C: the C-terminal fragment generated by SAX-3 extracellular cleavage. (b) Loss-of-function of slt-1/Slit does not affect the cleavage of SAX-3. F: full length SAX-3::HA; C: SAX-3 cleavage fragment. (c) The FN3 repeats mediate SAX-3 cleavage. FN3: FN3 repeats; TM: transmembrane domain; F: full length; C: cleavage fragment; G: free GFP. (d) FN3-b (the second repeat of FN3 repeats) is required for the cleavage. F: full length; C: cleavage fragment. (e) Deletion of FN3-b prevents SAX-3 cleavage. Images show results from two independent transgenic lines with FN3-b deletion (ΔFN3-b). Although having slightly different expression patterns, they both lose the extracellular cleavage fragment of SAX-3. (f) Expression of a fragment mimicking the SAX-3 extracellular fragment fully rescues AMsh defects in sax-3(lf) animals. Data are represented as mean ± SEM. Two-way ANOVA test. **, p<0.01; ns, no significant difference. Each point represents three experiments of at least 50 worms each.
Figure 2—figure supplement 1
The Slit-independent SAX-3 cleavage.
Images show the results from a second anti-HA antibody to confirm that SAX-3 has a developmental-stage-dependent cleavage (a), and this cleavage does not depend on slt-1 (b). (c) Deletion of the second FN3 repeats (FN3-b) did not decrease the expression or change the expression pattern of SAX-3 in transgenes. (d) Gel pictures (top) and quantification of RT-PCR results show that yad175 mutation decreases the expression of sax-3 mRNA. act-1/actin was used as a control. Student’s t-test, *p<0.05. (e) Quantification shows percentage of animals with AVM guidance defects. AVM was visualized using zdIs5 (Pmec-4::GFP) marker, and AVM guidance defects were defined as any abnormality in AVM axon growth direction. (f) Quantification data show that expression of a fragment (Ig(1-5)-FN3-a) mimicking the SAX-3 extracellular cleavage product by pan-neuronal (Punc-33, Prgef-1) or amphid neuron-specific (Parl-13) promoters can fully rescue AMsh migration defects in sax-3(lf) animals. Data are represented as mean ± SEM. Two-way ANOVA test. **, p<0.01; ns, no significant difference. Each point represents three experiments of at least 50 worms. Scale bar, 10 µm.
Figure 3 with 2 supplements
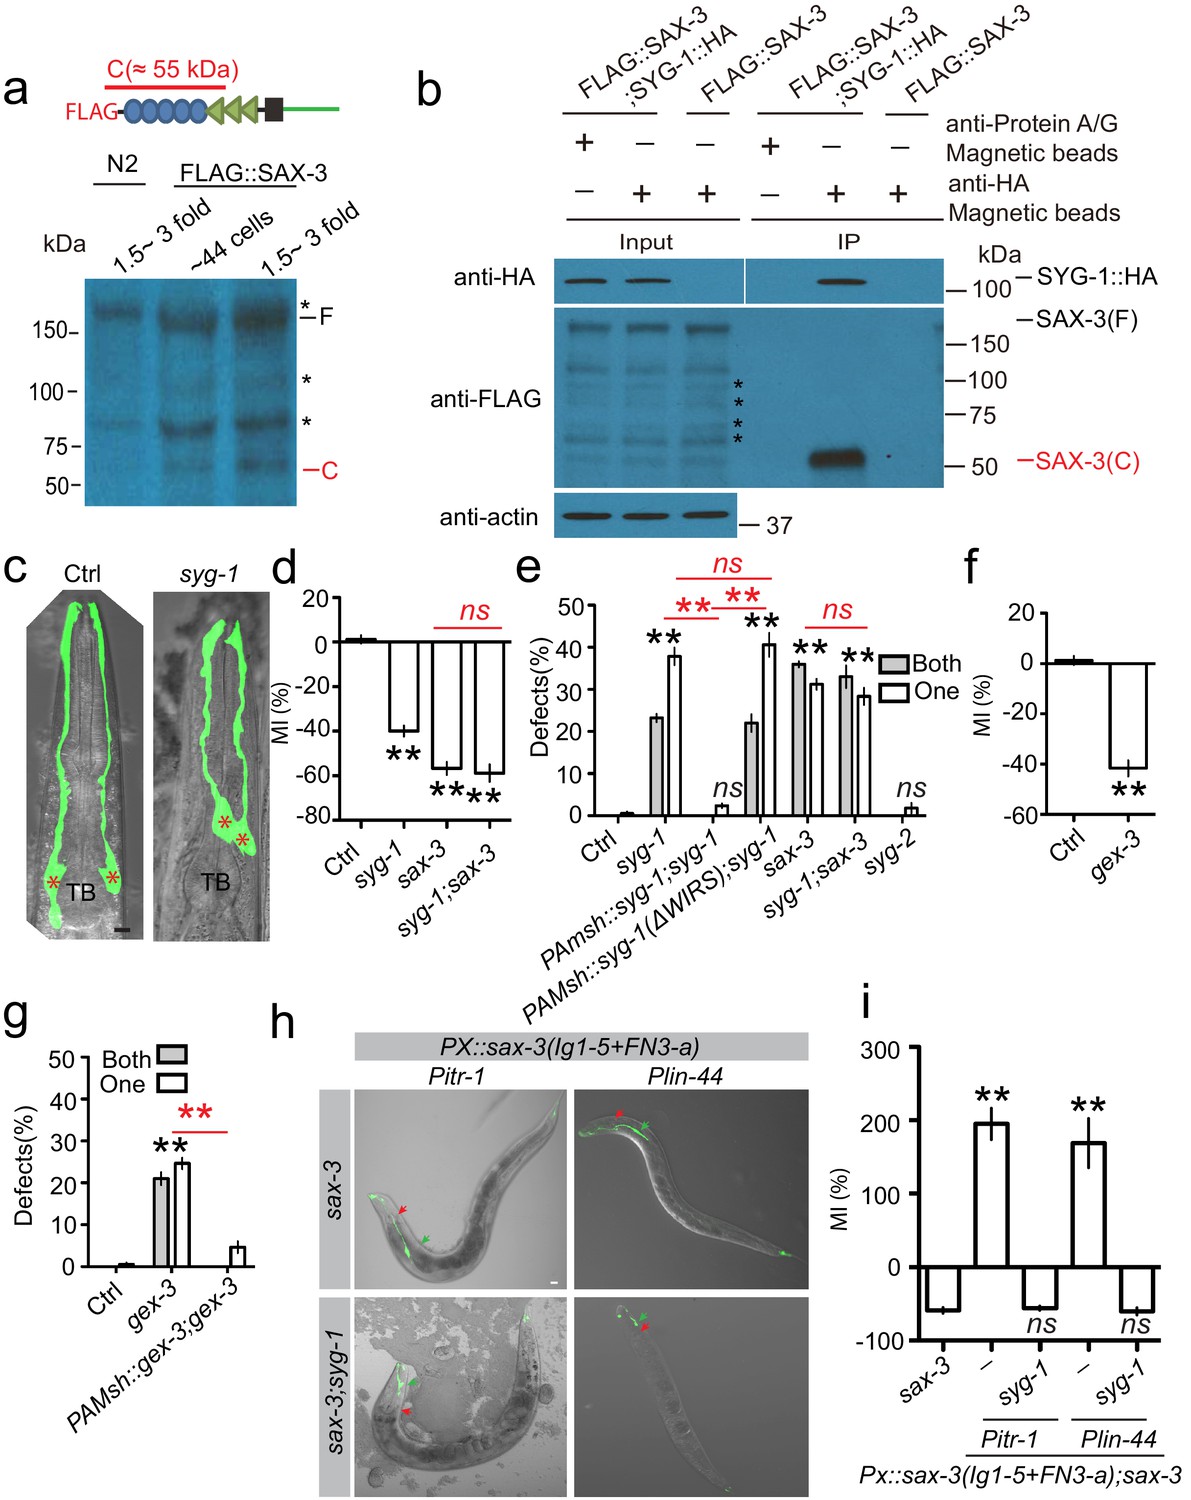
SYG-1 functions as a receptor for the SAX-3 extracellular cleavage fragment during AMsh glial migration.
(a) Image from western blot show the SAX-3 extracellular fragment by N-terminal tagging FLAG transgenes. Stars (*) label bands that are nonspecifically recognized by the anti-FLAG antibody. A schematic diagram at the top panel shows that the FLAG tag was fused at the N-terminal of SAX-3, and the extracellular cleavage fragment detected by the FLAG antibody is about 55 kDa. (b) SYG-1 specifically binds with the SAX-3 extracellular cleavage fragment. SYG-1::HA expression is driven by the pan-glial promoter Pmir-228, and FLAG::SAX-3 is expressed under the pan-neuronal promoter Punc-33. Stars (*) label bands that are nonspecifically recognized by the anti-FLAG antibody. (c) Confocal images of AMsh glia in control and syg-1(ok3640) animals. TB: pharyngeal terminal bulb. Stars (*) label AMsh cell bodies. Scale bar, 10 µm. (d) Quantification of Migration Index (MI) in control, syg-1, sax-3, and syg-1;sax-3 double mutants show that double mutants of syg-1;sax-3 display similar defects as in sax-3 single mutants. (e) syg-1 cell autonomously regulates AMsh glial migration, and the WAVE regulatory receptor sequence is required for syg-1 function. (f and g) gex-3 cell autonomously regulates AMsh glial migration. Quantification of Migration Index (f) and the percentage of animals with AMsh defects (g) show that gex-3 is required for AMsh migration. (h and i) Confocal images (h) and quantification (i) show that ectopic expression of a fragment mimicking the SAX-3 cleavage fragment in the tail neurons (Pitr-1) or hypodermis (Plin-44) causes syg-1-dependent over-migration of AMsh glia. Red arrowheads point to the center of the pharyngeal terminal bulb. Green arrowheads indicate AMsh cell body position. Scale bar, 10 µm. In d, f, and i, data are represented as mean ± SEM. One-way ANOVA test. **, p<0.01; Each point represents at least 30 worms. In (e and g), data are represented as mean ± SEM. Two-way ANOVA test. **, p<0.01; ns, no significant difference. Each point represents three experiments of at least 50 worms each.
Figure 3—figure supplement 1
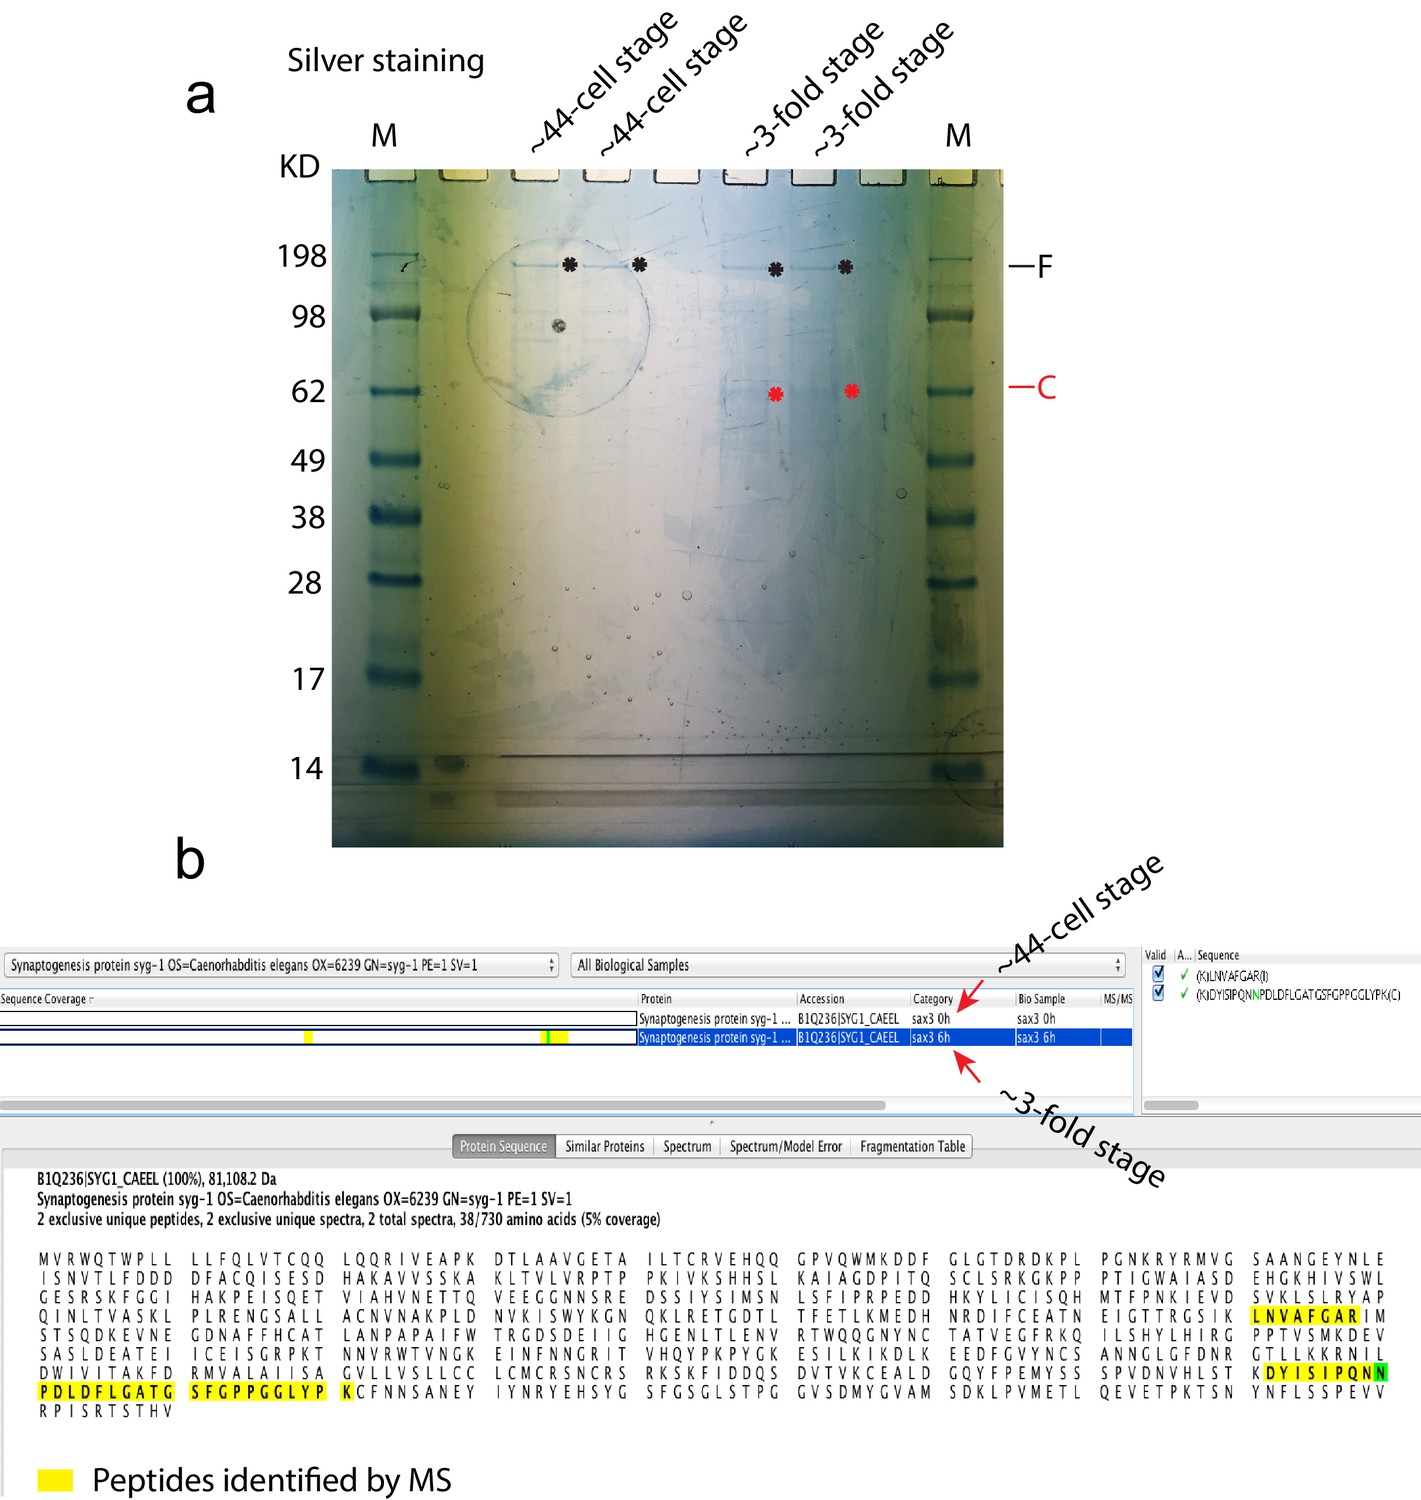
Identification of SAX-3 interacting proteins by proteomics.
(a) A image from silver staining shows the full length (black stars) and cleaved fragment (red stars) of SAX-3. These samples were then submitted for proteomics. (b) A screenshot of the Scaffold software that shows that SYG-1 was identified with specific interactions with SYG-1 in threefold but not in 44-cell stage embryos. The green color of the asparagine(N) means that this amino acid was deamidated to either aspartic acid or isoaspartic acid.
Figure 3—figure supplement 2
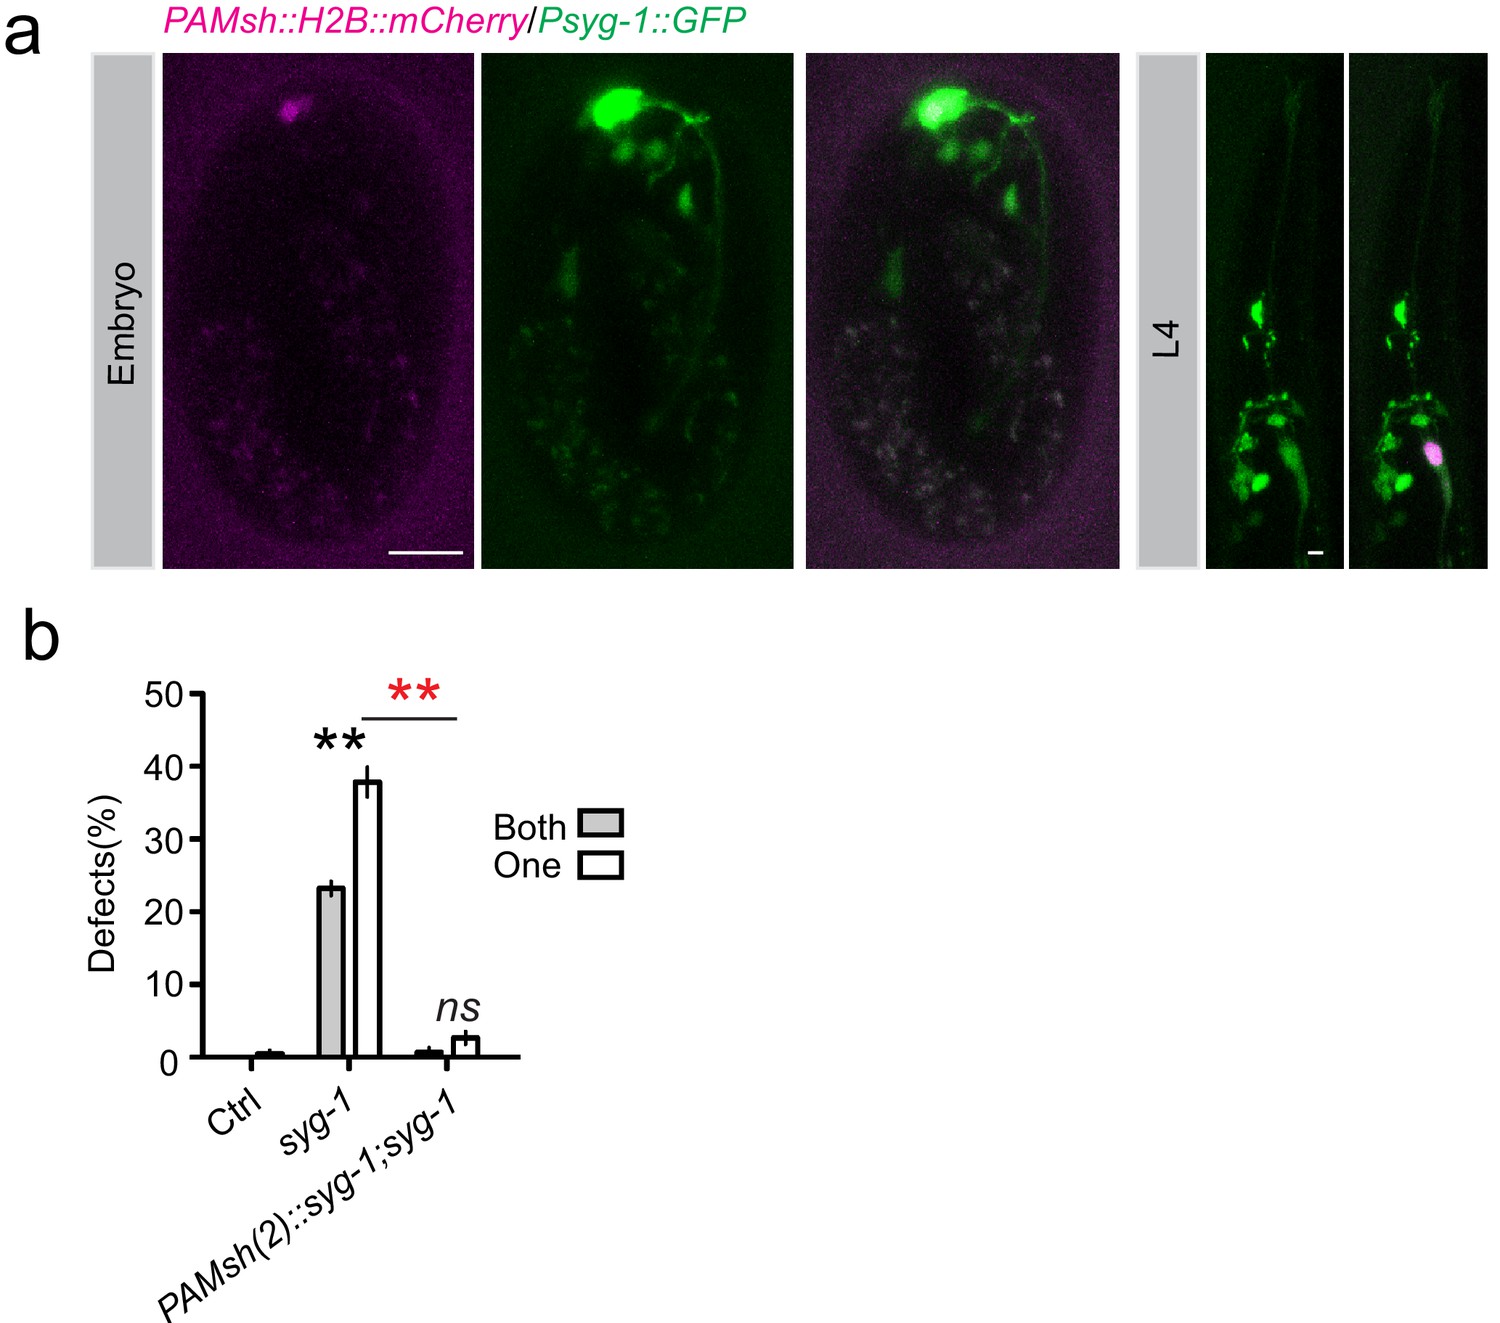
SYG-1 is expressed in AMsh glia.
(a) Confocal images show that a 2.5 kb syg-1 promoter can drive GFP expression in AMsh (labeled by Pf53f4.13::H2B::mCherry) in embryos (left) and larva (right). Scale bar, 10 µm. (b) Expression of syg-1 in AMsh glia driven by PAMsh(2) (Pf16f9.3) can rescue syg-1(lf) phenotypes.
Figure 4
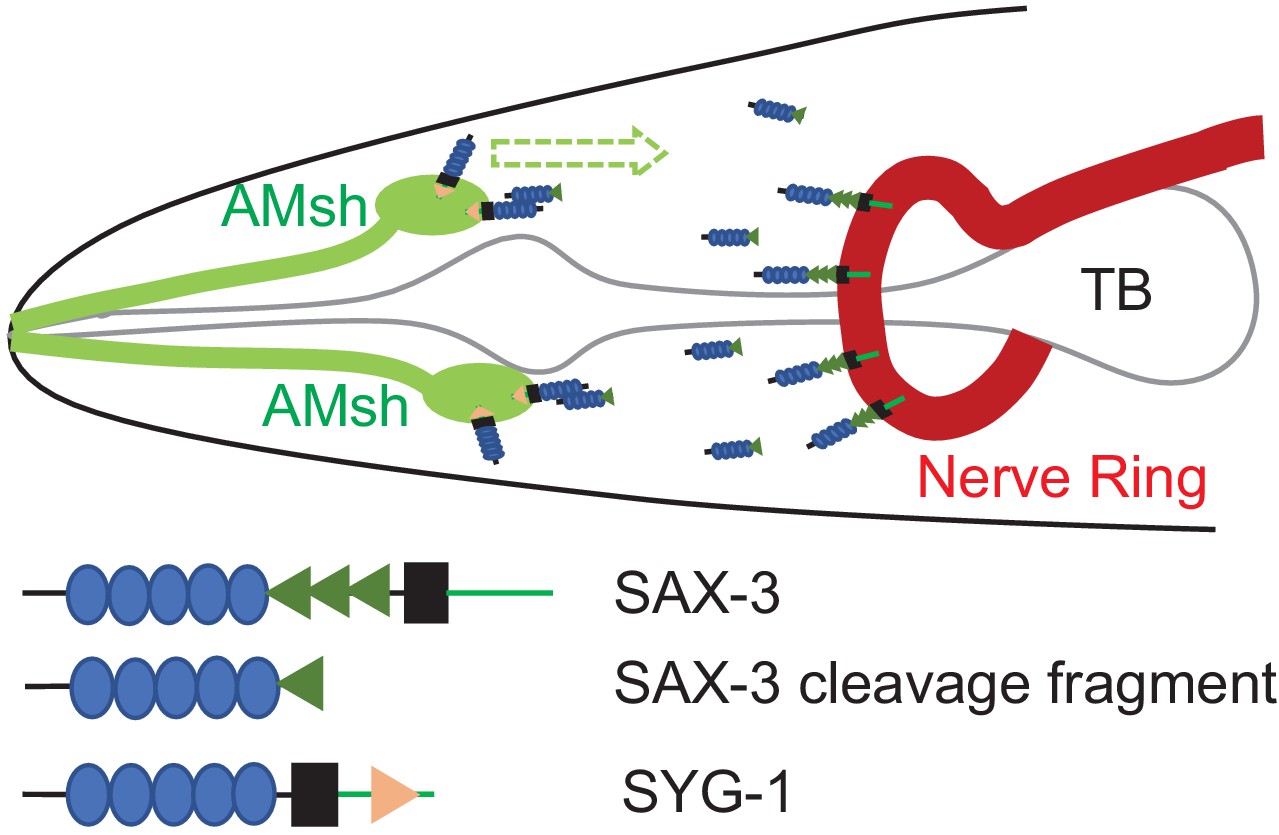
A model for regulation of AMsh glial migration by SAX-3 and SYG-1.
Additional files
-
Supplementary file 1
Strains and plasmids used in this study.
- https://cdn.elifesciences.org/articles/57921/elife-57921-supp1-v1.docx
-
Supplementary file 2
A list of protein identified by proteomics show specific interactions with SAX-3 in 1.5- to 3-fold stage embryos.
- https://cdn.elifesciences.org/articles/57921/elife-57921-supp2-v1.xlsx
-
Transparent reporting form
- https://cdn.elifesciences.org/articles/57921/elife-57921-transrepform-v1.docx
Download links
A two-part list of links to download the article, or parts of the article, in various formats.
Downloads (link to download the article as PDF)
Open citations (links to open the citations from this article in various online reference manager services)
Cite this article (links to download the citations from this article in formats compatible with various reference manager tools)
Robo functions as an attractive cue for glial migration through SYG-1/Neph
eLife 9:e57921.
https://doi.org/10.7554/eLife.57921


