The birth of a bacterial tRNA gene by large-scale, tandem duplication events
- Department of Evolutionary Theory, Max Planck Institute for Evolutionary Biology, Germany
- Asia Pacific Center for Theoretical Physics, Republic of Korea
Figures
Figure 1 with 1 supplement
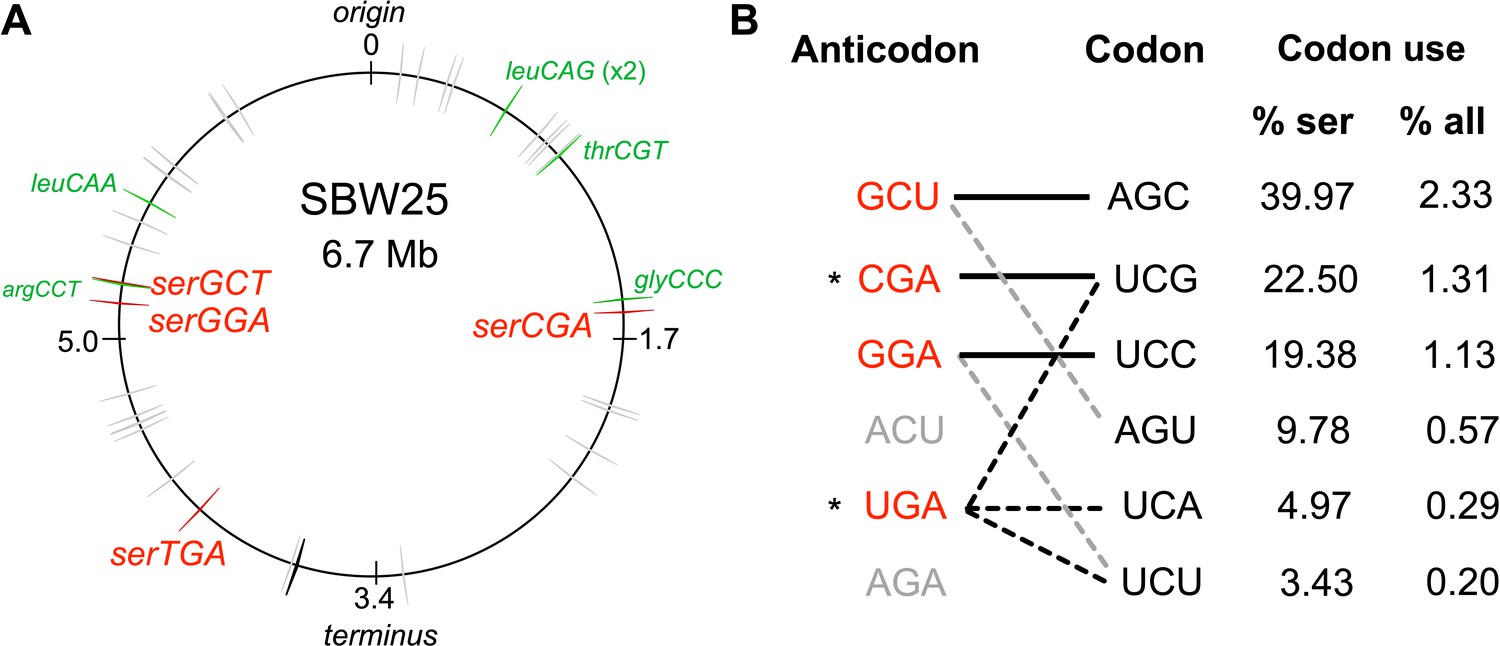
The tRNA gene set and serine translation system in P. fluorescens SBW25.
(A) Genomic location of the 66 canonical (grey arrows) and one non-canonical (cysGCA-2; black arrow) tRNA genes. Four tRNA genes encode seryl-tRNAs (red arrows). One of these, serCGA, is predicted to encode a non-essential tRNA type. Six other tRNA genes encoding the remaining five non-essential tRNA types (green arrows). Replication origin and terminus are indicated. (B) The predicted translational relationship between seryl-tRNAs and serine codons. The six theoretically possible seryl-tRNA anticodons are listed on the left (red = present in SBW25, grey = absent, * = theoretically capable of translating codon UCG), and six cognate codons are listed in column 2. Connections signify a theoretical match (solid black lines = Watson Crick pairing; black dotted lines = wobble pairing through post-transcriptional modification; grey dotted line = G:U wobble pairing). Columns 3 and 4 list codon use as a percentage of serine and all codons, respectively (Chan and Lowe, 2016). Anticodons and codons are 5'→3'.
Figure 1—figure supplement 1
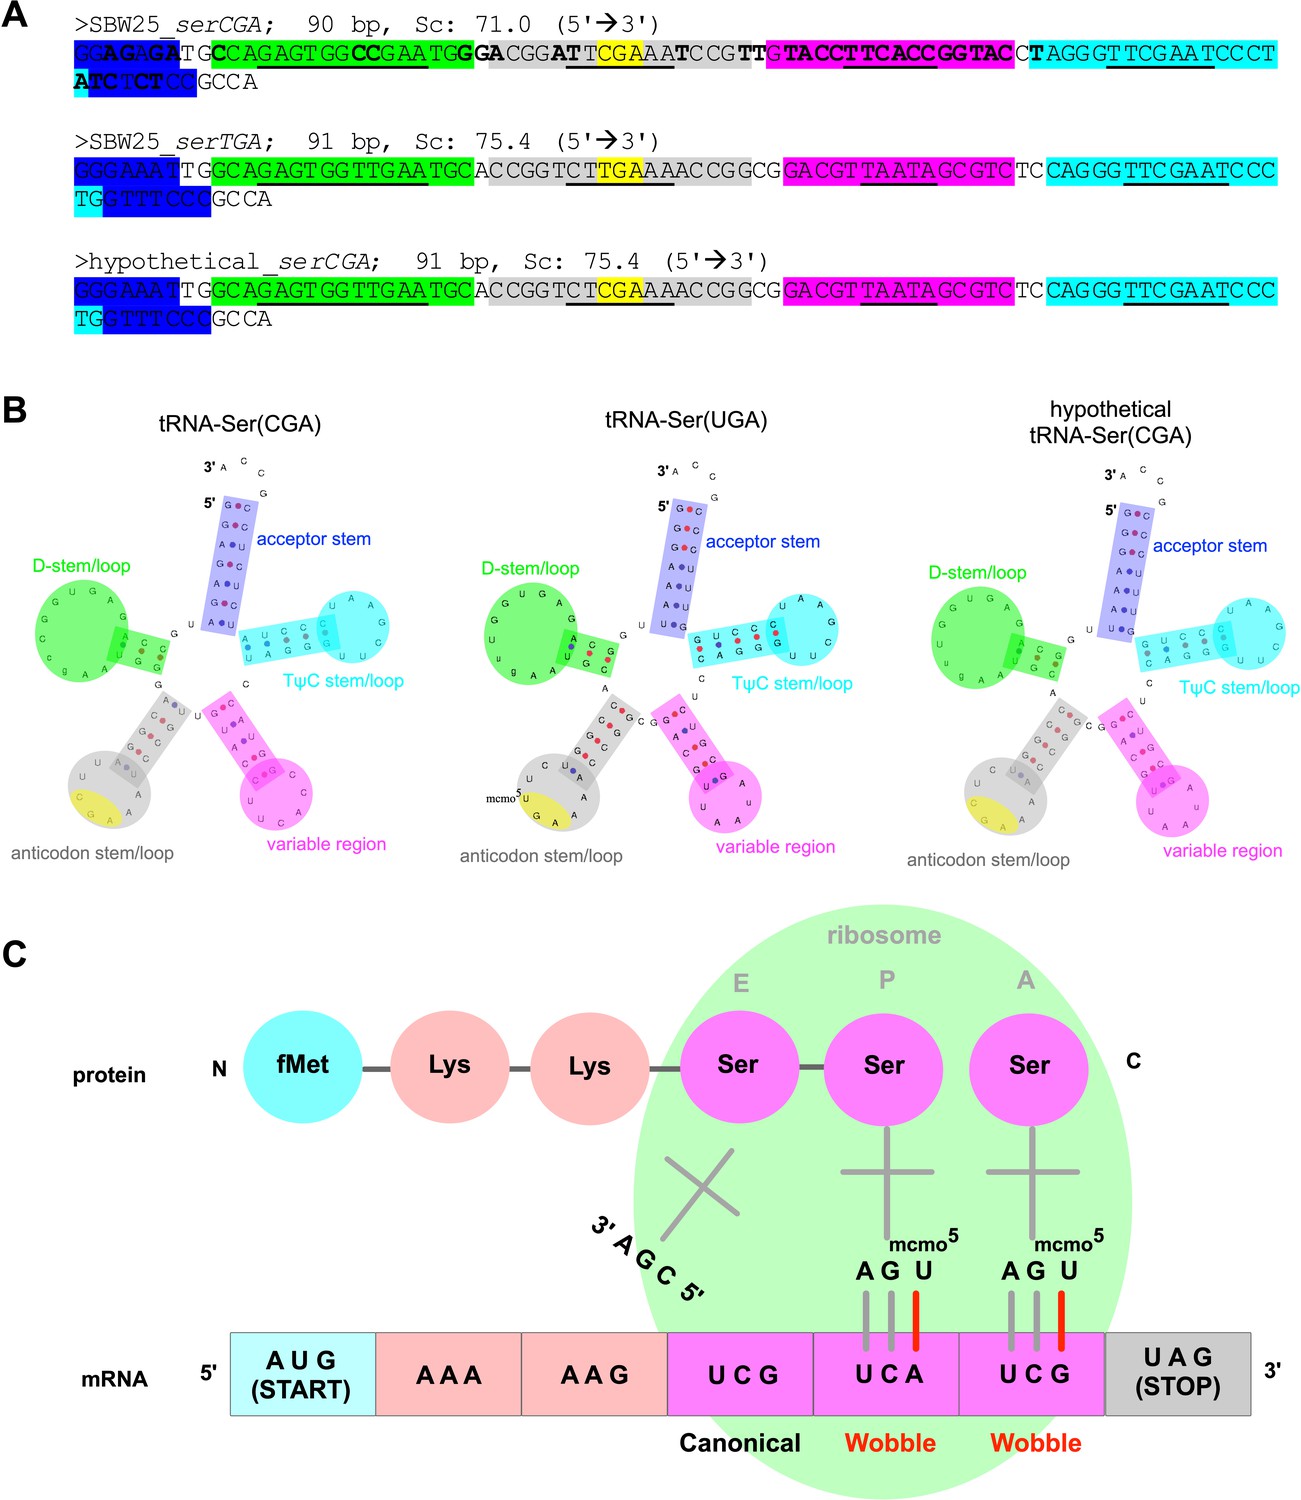
Predicted structure and function of tRNA types tRNA-Ser(CGA) and tRNA-Ser(UGA) in P. fluorescens SBW25.
(A) Gene sequences for P. fluorescens SBW25 serCGA (top), P. fluorescens SBW25 serTGA (middle), and hypothetical serCGA (serTGA backbone with a single point mutation to a CGA anticodon; see Discussion). Colour highlights indicate various parts of each tRNA, with the base pairing (stem) components in each region underlined (blue = acceptor stem, green = D stem/loop, grey = anticodon stem/loop, yellow = anticodon, pink = variable region, turquoise = TψC stem/loop). Bold letters in serCGA indicate 36 nucleotide differences from serTGA. (B) Predicted mature tRNA structures for the tRNA sequences in panel A, using tRNAscan-SE v2.0 (Chan and Lowe, 2019). The predicted CmoA/B/M mediated post-transcriptional modification U34→cmo5U34 is also shown in tRNA-Ser(UGA). (C) Cartoon depicting translation of serine codons: canonical base pairing occurred between tRNA-Ser(CGA) and UCG, and wobble base pairing is occurring between post-transcriptionally modified tRNA-Ser(UGA) and codons UCA and UCG.
Figure 2 with 1 supplement
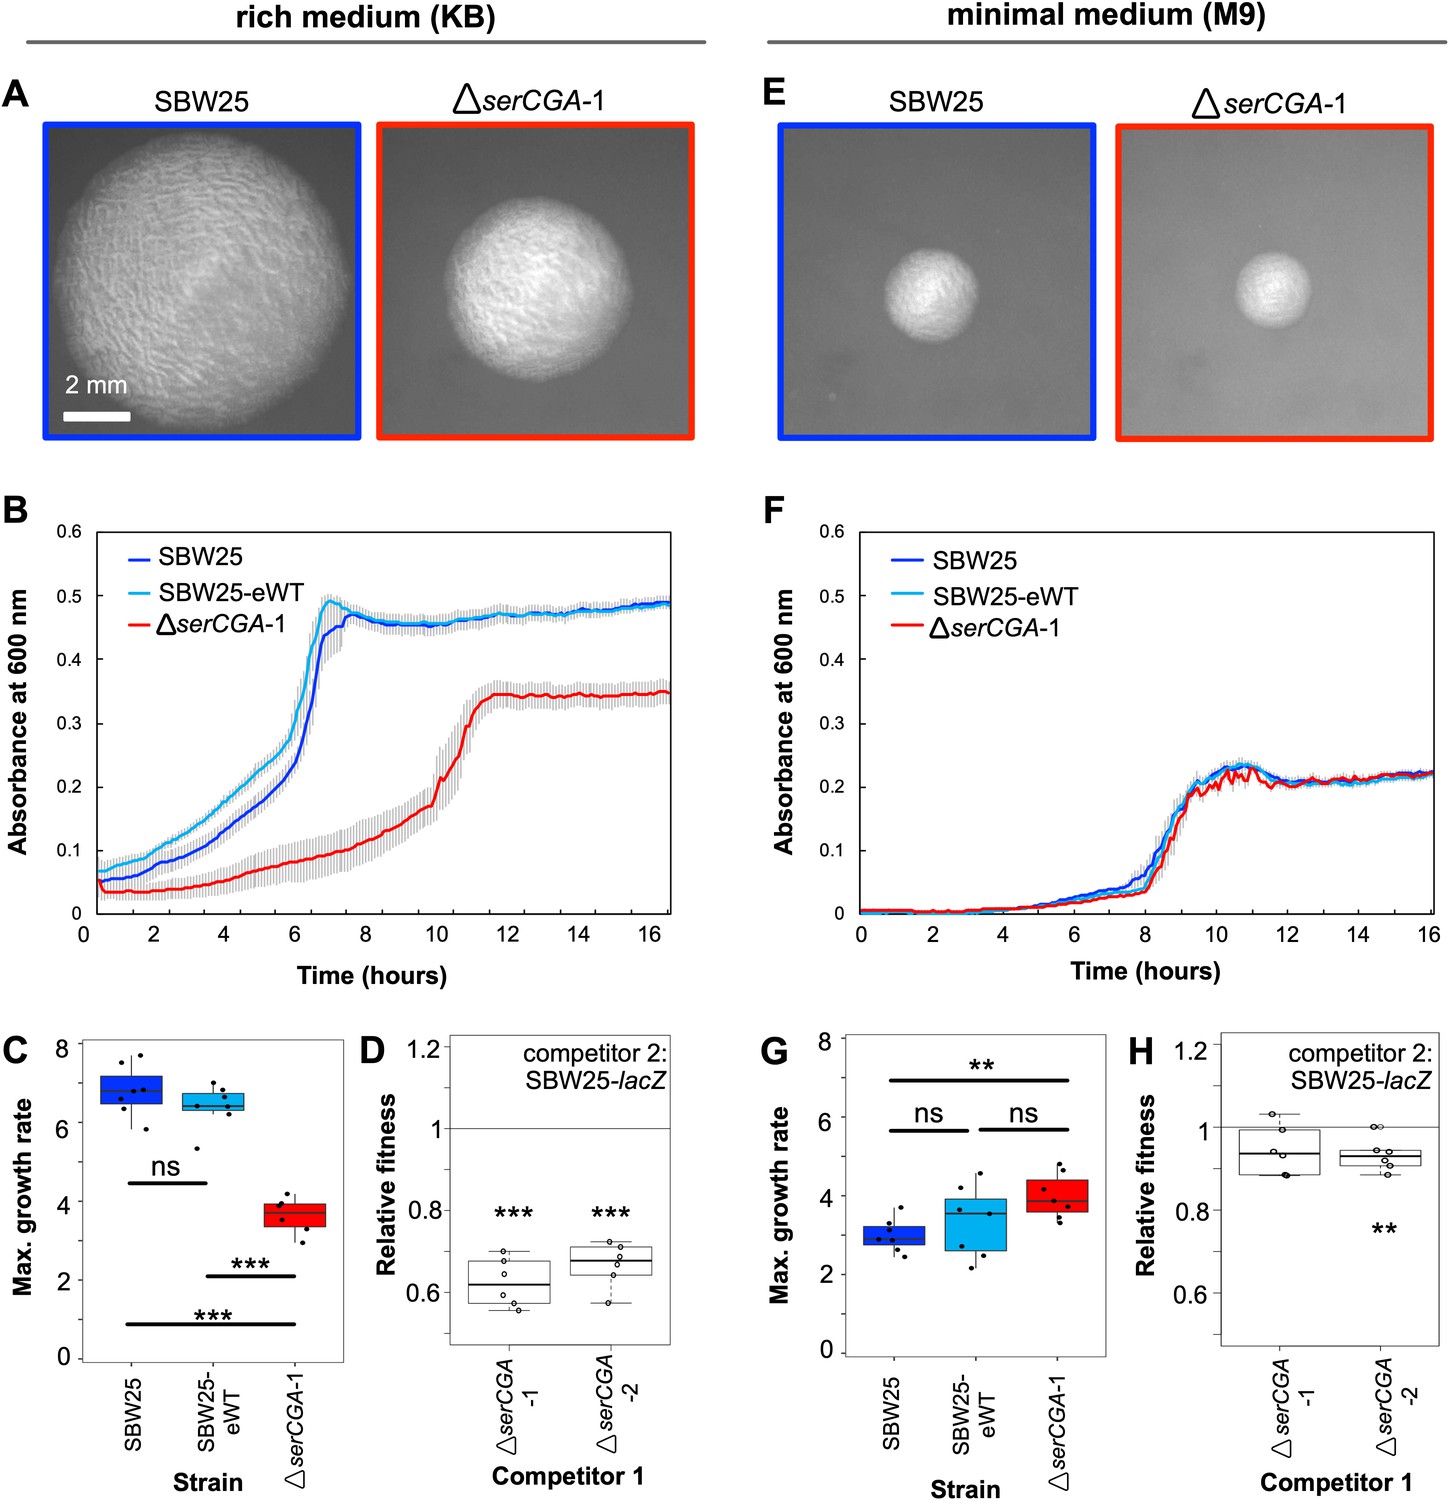
Deletion of serCGA leads to a growth defect in a rich medium.
(A) 45 hr colonies on KB agar. (B) Growth (absorbance at 600 nm) in KB. Lines = mean of six (ΔserCGA-1) or seven (SBW25 and SBW25-eWT) replicates; error bars = one standard error. (C) Maximum growth rate (change in mOD min−1) in KB, calculated with a sliding window of nine points between hours 2 and 12. (D) Relative fitness values from direct 1:1 competitions between competitor 1 (ΔserCGA-1 or ΔserCGA-2) and the neutrally marked wild-type strain, SBW25-lacZ (six replicates per competition), in KB. Relative fitness of 1 = no difference, <1 = SBW25-lacZ wins, >1 = competitor one wins. (E) 45 hr colonies on M9 agar, at same magnification and time as in panel A. (F) Growth in M9. Lines = mean of seven replicates, error bars = one standard error. (G) Maximum growth rate (change in mOD min−1) in M9, calculated with a sliding window of nine points between hours 2 and 12. (H) Relative fitness values from direct 1:1 competitions between competitor 1 (ΔserCGA-1 or ΔserCGA-2) and SBW25-lacZ (six replicates per competition), in M9. Parametric two-tailed two-sample t-tests (panel C, G) and parametric two-tailed one sample t-tests (panel D, H) ***p<0.001, **p<0.01, *p<0.05, ns = not significant (p>0.05).
-
Figure 2—source data 1
This file contains the growth data used in Figure 2 panels B, C, F, and G.
Raw absorbance reads are provided for each sample, as well as plots of absorbance over time for each genotype, calculations of maximum growth rate and lag time, and details of statistical tests used to detect differences in growth profiles between genotypes.
- https://cdn.elifesciences.org/articles/57947/elife-57947-fig2-data1-v2.xlsx
-
Figure 2—source data 2
This file contains the fitness data used to draw Figure 2 panels D and H, and Figure 3 panel E.
Raw colony counts are provided, as well as details regarding the calculation of Malthusian parameters and relative fitness, and details of statistical tests used to detect deviations of relative fitness from 1.
- https://cdn.elifesciences.org/articles/57947/elife-57947-fig2-data2-v2.xlsx
Figure 2—figure supplement 1
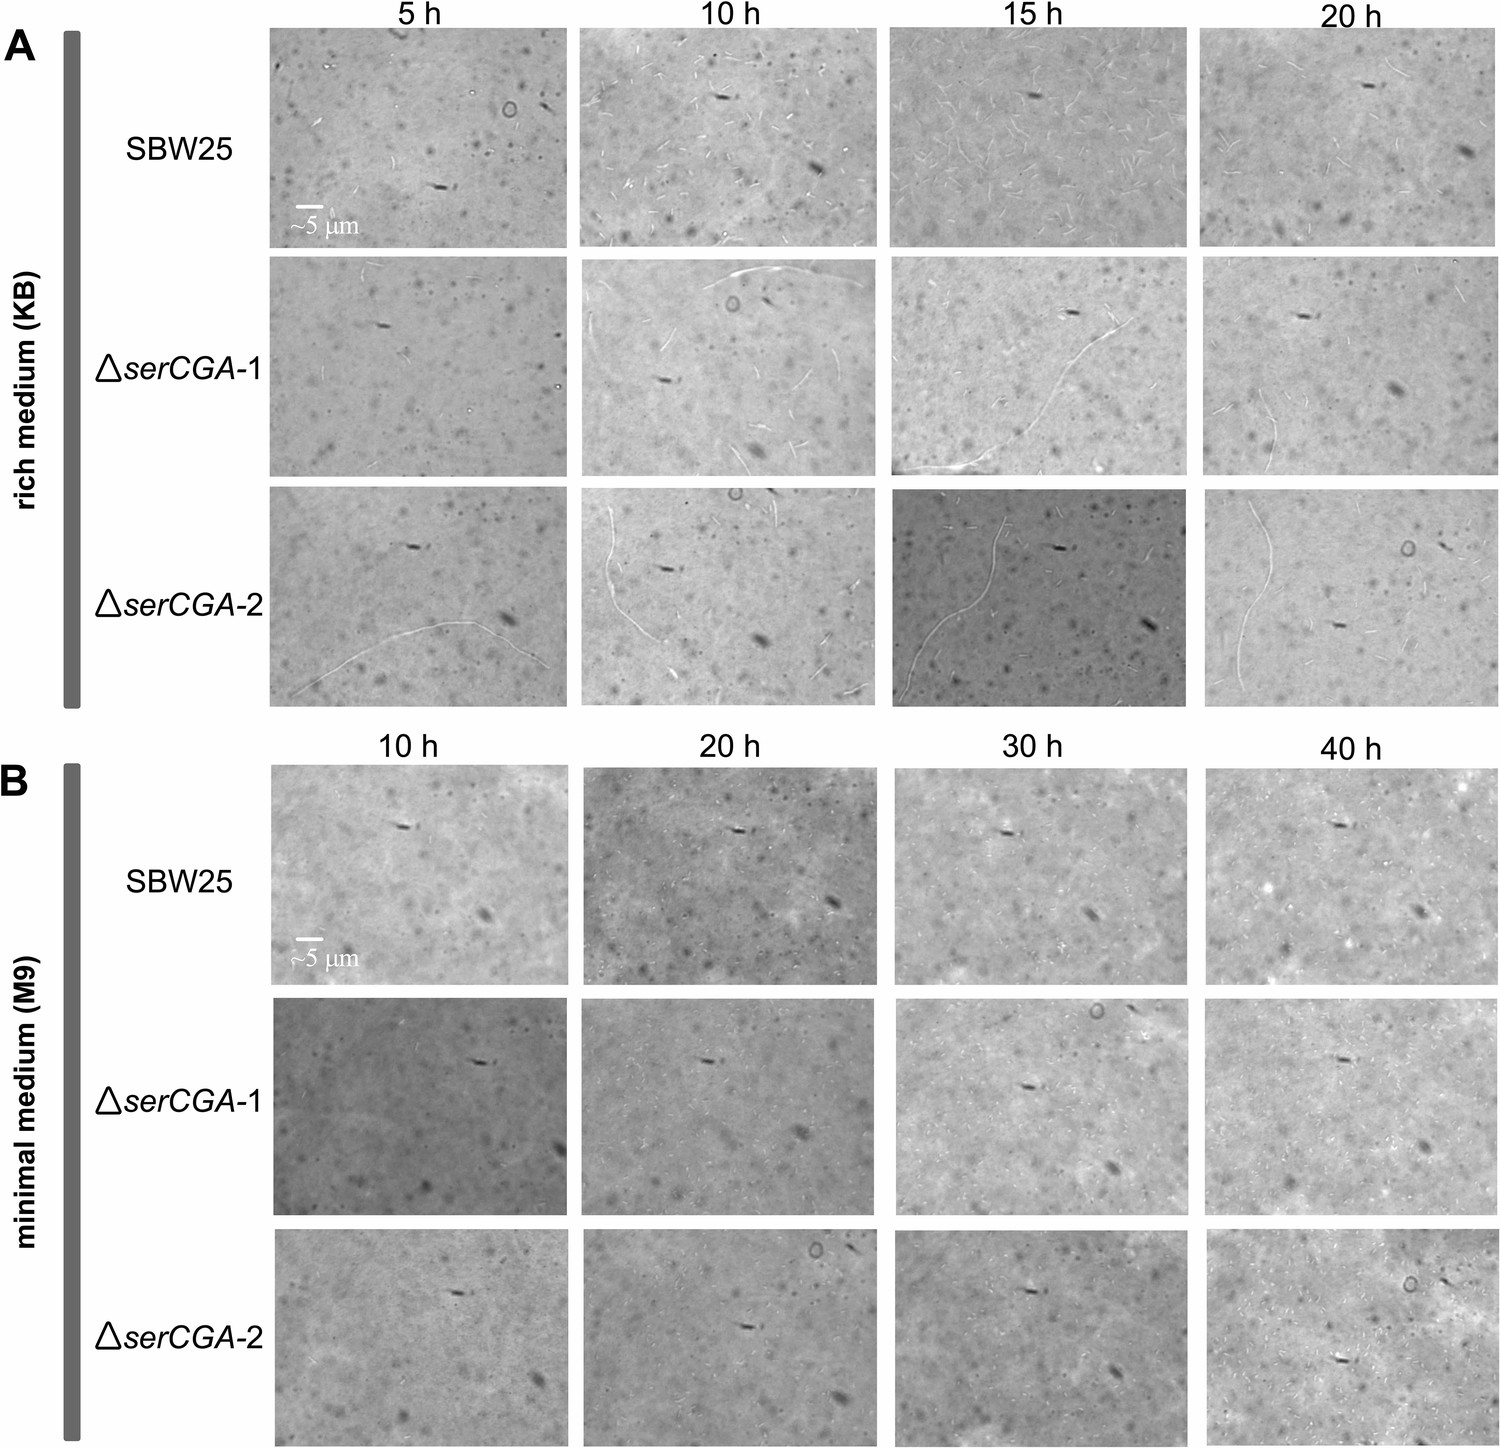
The effect of serCGA deletion on cell morphology during growth in liquid KB and M9.
The effect of serCGA deletion on cell morphology was determined by microscopically examining P. fluorescens SBW25, ΔserCGA-1, and ΔserCGA-2 cells (rows) at various stages of growth in liquid KB (A) and M9 (B). The three strains were grown to stationary phase in liquid KB or M9 (28 °C, shaking). Stationary phase cultures were diluted 1:1000 in fresh medium and growth continued (28 °C, shaking). The morphology of cells from each strain was observed periodically (columns) during growth in each medium. Cell samples were removed from the growing culture and, during earlier stages of growth, concentrated by pelleting and re-suspending in a smaller volume. Cells were then stained with a 1:8 dilution of India ink (Pébéo), viewed under the ×60 magnification lens of a bright field microscope (VisiScope 200; VWR International), and photographed with a VisiCam 1.3 (VWR International). The same scale bar applies to all images.
Figure 3

Loss of serCGA is repeatedly and rapidly compensated by experimental evolution.
(A) Colony morphology of founder (solid outlines) and evolved (dotted outlines) isolates on KB agar (30 hr, 28°C). Lineage M2 yielded two large colony morphotypes: standard (left) and opaque (‘op’, right). Image border colours match line colours in panel B. (B) 12 hr growth curves in liquid KB for founder (day 0, solid lines) and evolved (day 13, dotted lines) isolates. Lines = mean of six replicates; error bars = 1 standard error. (C, D) Box plots showing the maximum growth rate (change in mOD min−1) and lag time (hours) of founding and evolved strains from the evolution experiment, grown in liquid KB (n = 6; maximum growth rates and lag times calculated using a sliding window of nine points between 2 and 12 hr). Statistically significant differences were determined using parametric t-tests (solid black lines), non-parametric t-tests (solid grey lines), or Mann–Whitney–Wilcoxon rank sum tests (dotted grey line). (E) Box plots of the relative fitness of competitor 1 (x-axis) and competitor 2 (horizontal bars at top). Direct, 1:1 competitions were performed in liquid KB for 24 hr (28 °C, shaking). Six replicate competitions were performed for each set of strains. Relative fitness >1 means competitor one wins and <1 means competitor two wins. The first two competitions are also presented in Figure 2G. Statistically significant deviations of relative fitness from one were determined using parametric two-tailed one-sample t-tests. ***p<0.001, **p<0.01, *p<0.05, ns = not significant (p>0.05).
-
Figure 3—source data 1
This file contains the growth data used in Figure 3 panels B, C, and D.
Raw absorbance reads are provided for each sample, as well as plots of absorbance over time for each genotype, calculations of maximum growth rate and lag time, and details of statistical tests used to detect differences in growth profiles between genotypes.
- https://cdn.elifesciences.org/articles/57947/elife-57947-fig3-data1-v2.xlsx
Figure 4 with 2 supplements
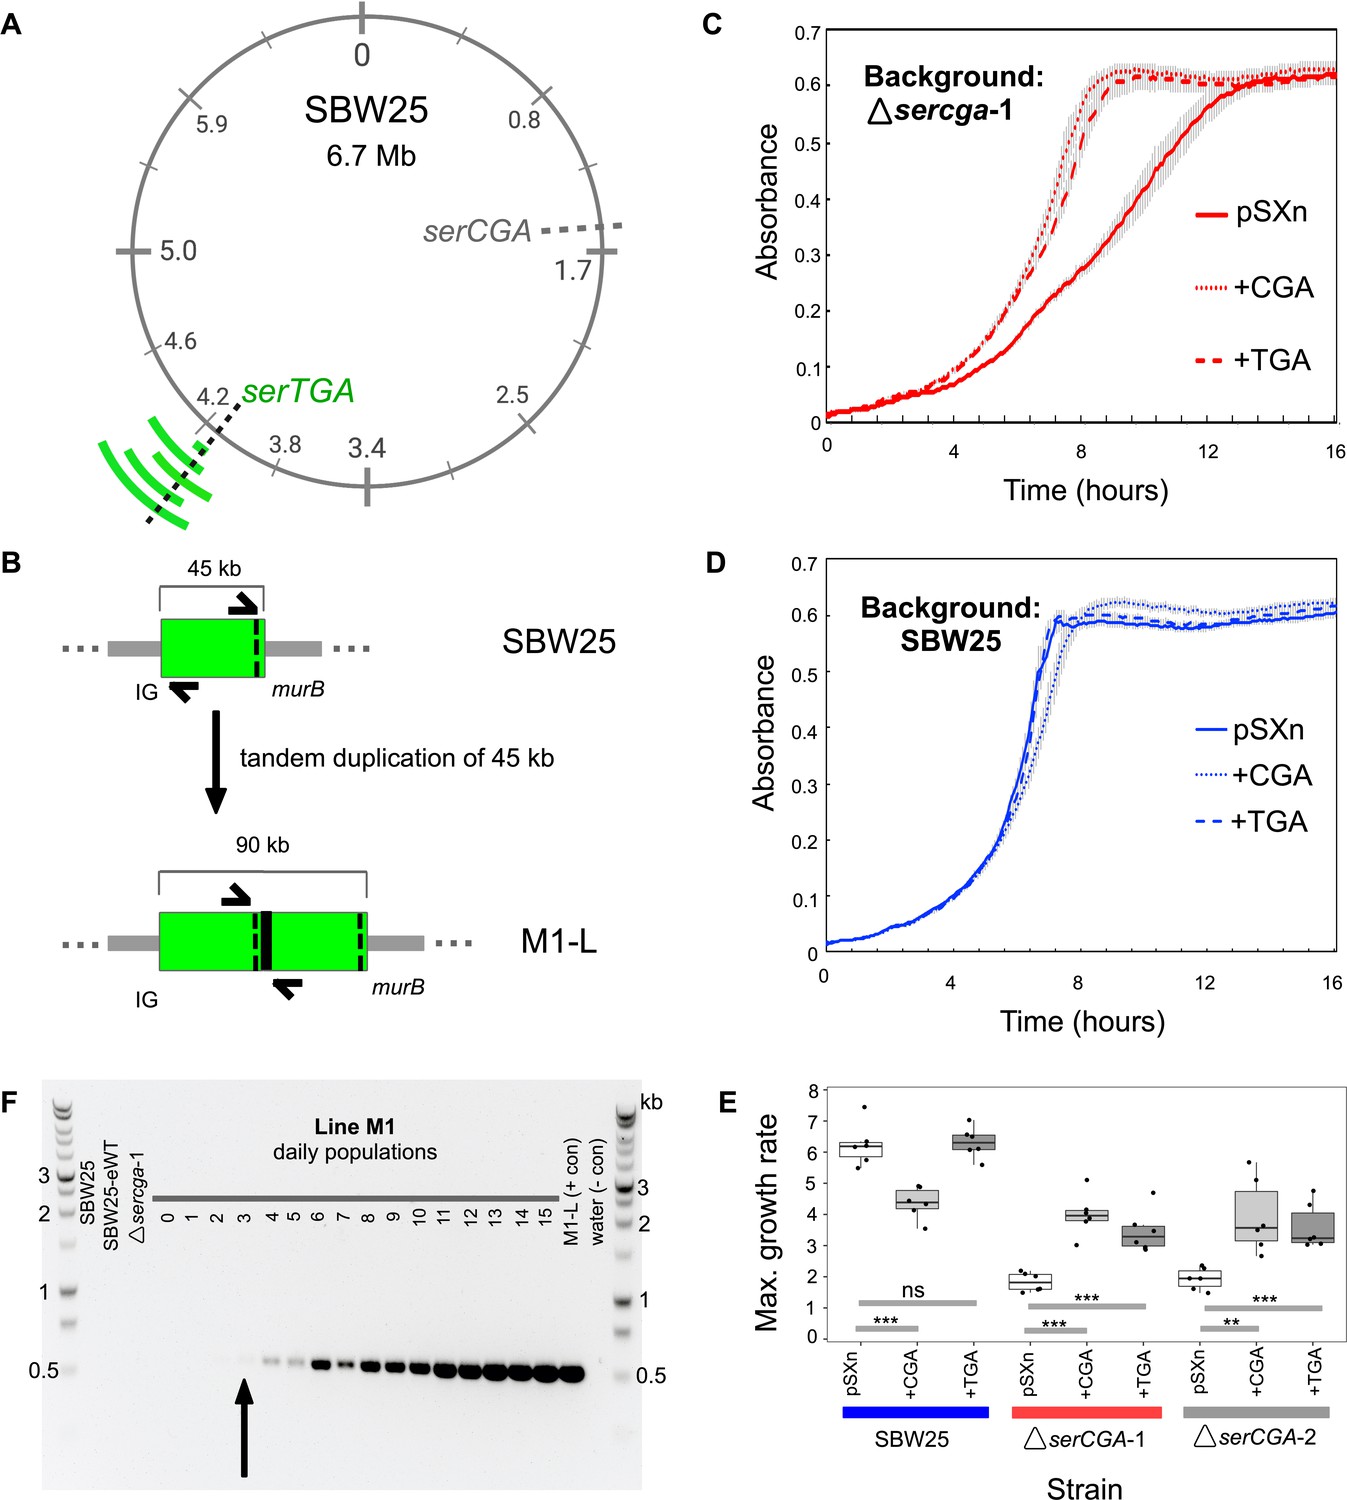
Direct, tandem duplications spanning serTGA compensate for serCGA loss.
(A) Five isolates from the mutant Lines have unique, large, tandem duplications between 4.05 and 4.34 Mb of the SBW25 chromosome (green arcs; moving outwards: M1-L, M2-L, M2-Lop, M3-L, and M4-L). The duplications contain a shared 45 kb region with serTGA (dotted black line; see also Figure 4—figure supplement 1). (B) Cartoon depiction of the duplication event in M1-L, resulting in two copies of a 45 kb fragment (green) and an emergent junction (thick black line). The junction can be PCR-amplified using primers to either side (black arrows). IG = intergenic, black dotted line = serTGA. (C) 12 hr growth curves in LB+Gm (20 μg ml−1) for ΔserCGA-1 (red) and SBW25 (blue) expressing serCGA or serTGA from the pSXn plasmid. Lines = mean of six replicates, error bars = 1 standard error. (D) Maximum growth speed (change in mOD min−1; calculated with a sliding window of points between 0 and 23 hr) of SBW25, ΔserCGA-1, ΔserCGA-2 carrying empty pSXn, pSXn-serCGA (+CGA) and pSXn-serTGA (+TGA). Parametric two-tailed, two-sample t-tests ***p<0.001, **p<0.01, *p<0.05, ns = not significant (p>0.05). (E) The duplication junction in lineage M1 was first definitively amplified from lineage M1 population on day 3 (black arrow). Gel photograph colours were inverted using Preview to better detect faint PCR products. See Figure 4—figure supplement 2 for the history of other junctions.
-
Figure 4—source data 1
This file contains the growth data used in Figure 4 panels C and D.
Raw absorbance reads are provided for each sample, as well as plots of absorbance over time for each genotype, calculations of maximum growth rate and lag time, and details of statistical tests used to detect differences in growth profiles between genotypes.
- https://cdn.elifesciences.org/articles/57947/elife-57947-fig4-data1-v2.xlsx
Figure 4—figure supplement 1
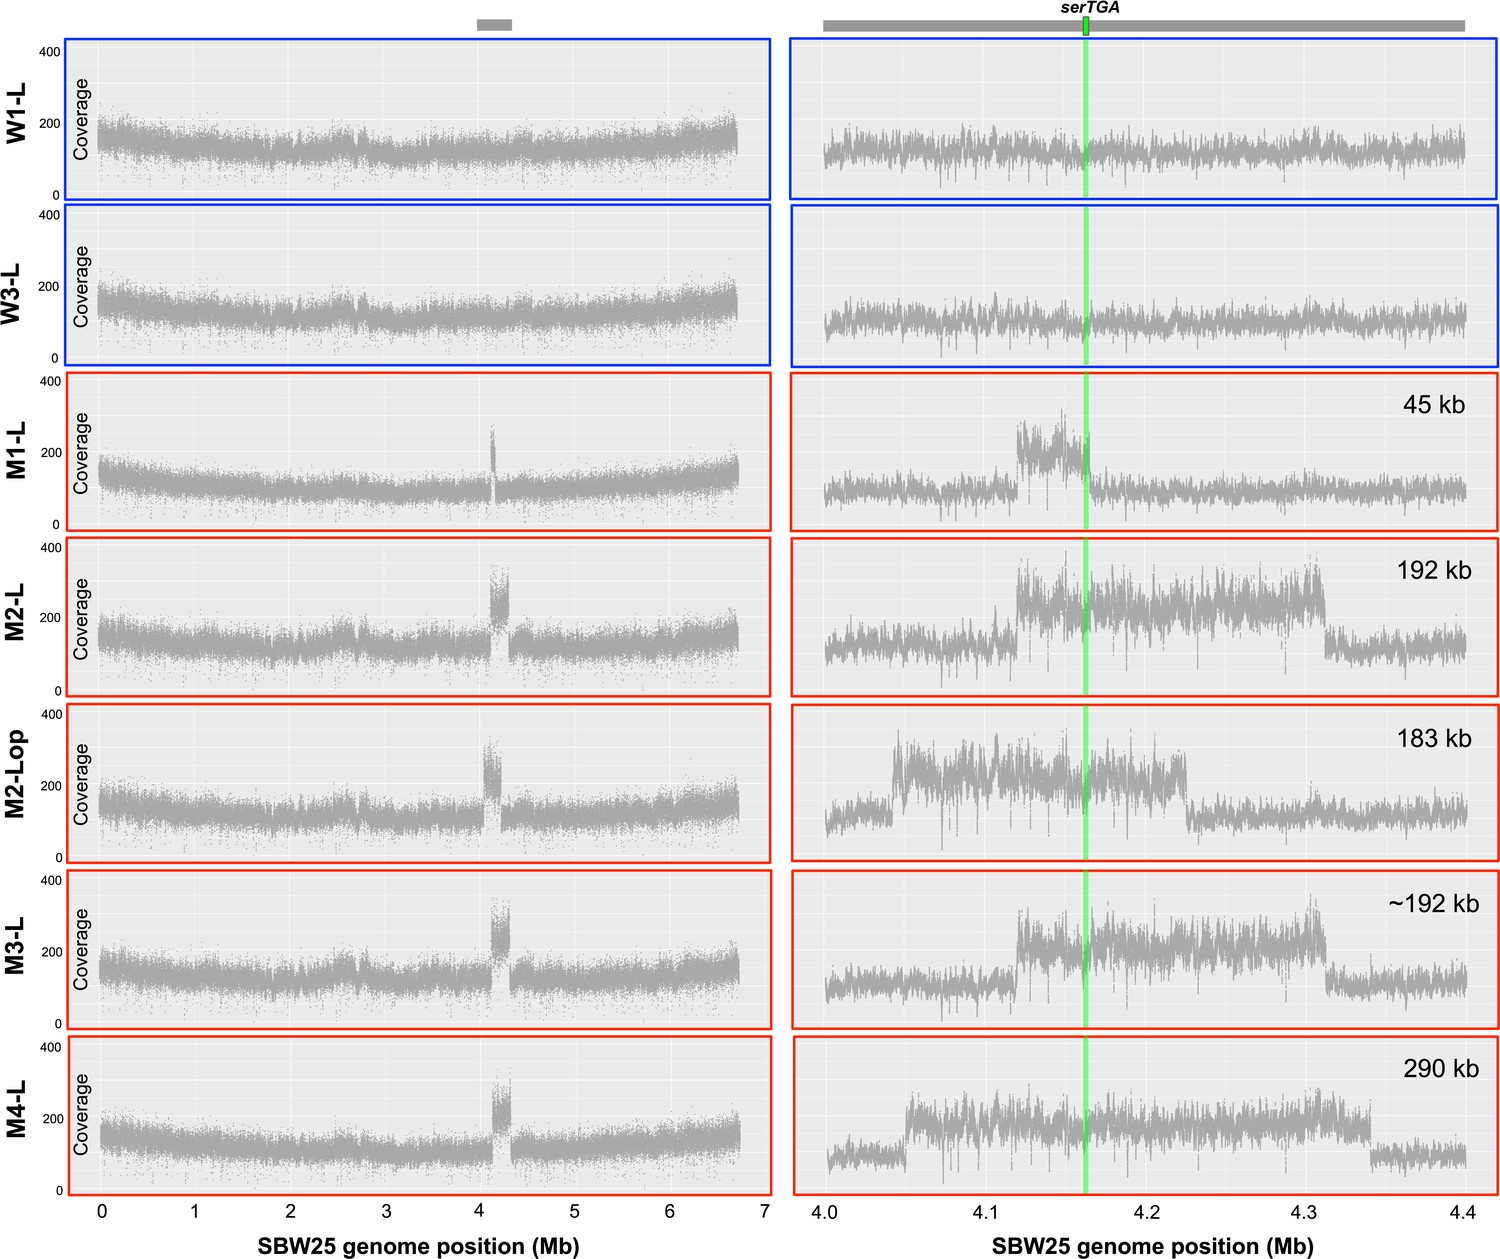
Coverage plots from whole genome sequencing data provide evidence of large-scale, tandem duplication events in evolutionary lineages M1–M4.
Whole genome sequence data (Illumina NextSeq, 150 bp, paired-end reads) were obtained for seven strains from day 13 of the evolution experiment: W1-L and W3-L (derived from independent SBW25 and SBW25-eWT control lineages; outlined in blue), and M1-L, M2-L, M2-Lop, M3-L, and M4-L (derived from four independent serCGA deletion lineages; outlined in red). For each of the seven strains, a minimum of 4.5 million raw sequencing reads were aligned to the SBW25 genome sequence (Silby et al., 2009) in Geneious, using the settings described in the main manuscript methods. The number of reads aligned to every 100th base of the SBW25 genome was plotted in R (version 3.6.0; left). This revealed a twofold increase in coverage between ~4 Mb and ~4.4 Mb of the SBW25 chromosome, indicating the occurrence of a single, tandem duplication in each of the mutant-derived lineages. Coverage plots for every nucleotide between 4.0 and 4.4 Mb of the SBW25 chromosome (right) indicate that there are at least four distinct tandem duplications among the five mutant isolates. These range between 45 kb and 290 kb in size, and each includes the serTGA gene, encoding tRNA-Ser(UGA) (green horizontal bar on right-hand coverage plots).
Figure 4—figure supplement 2
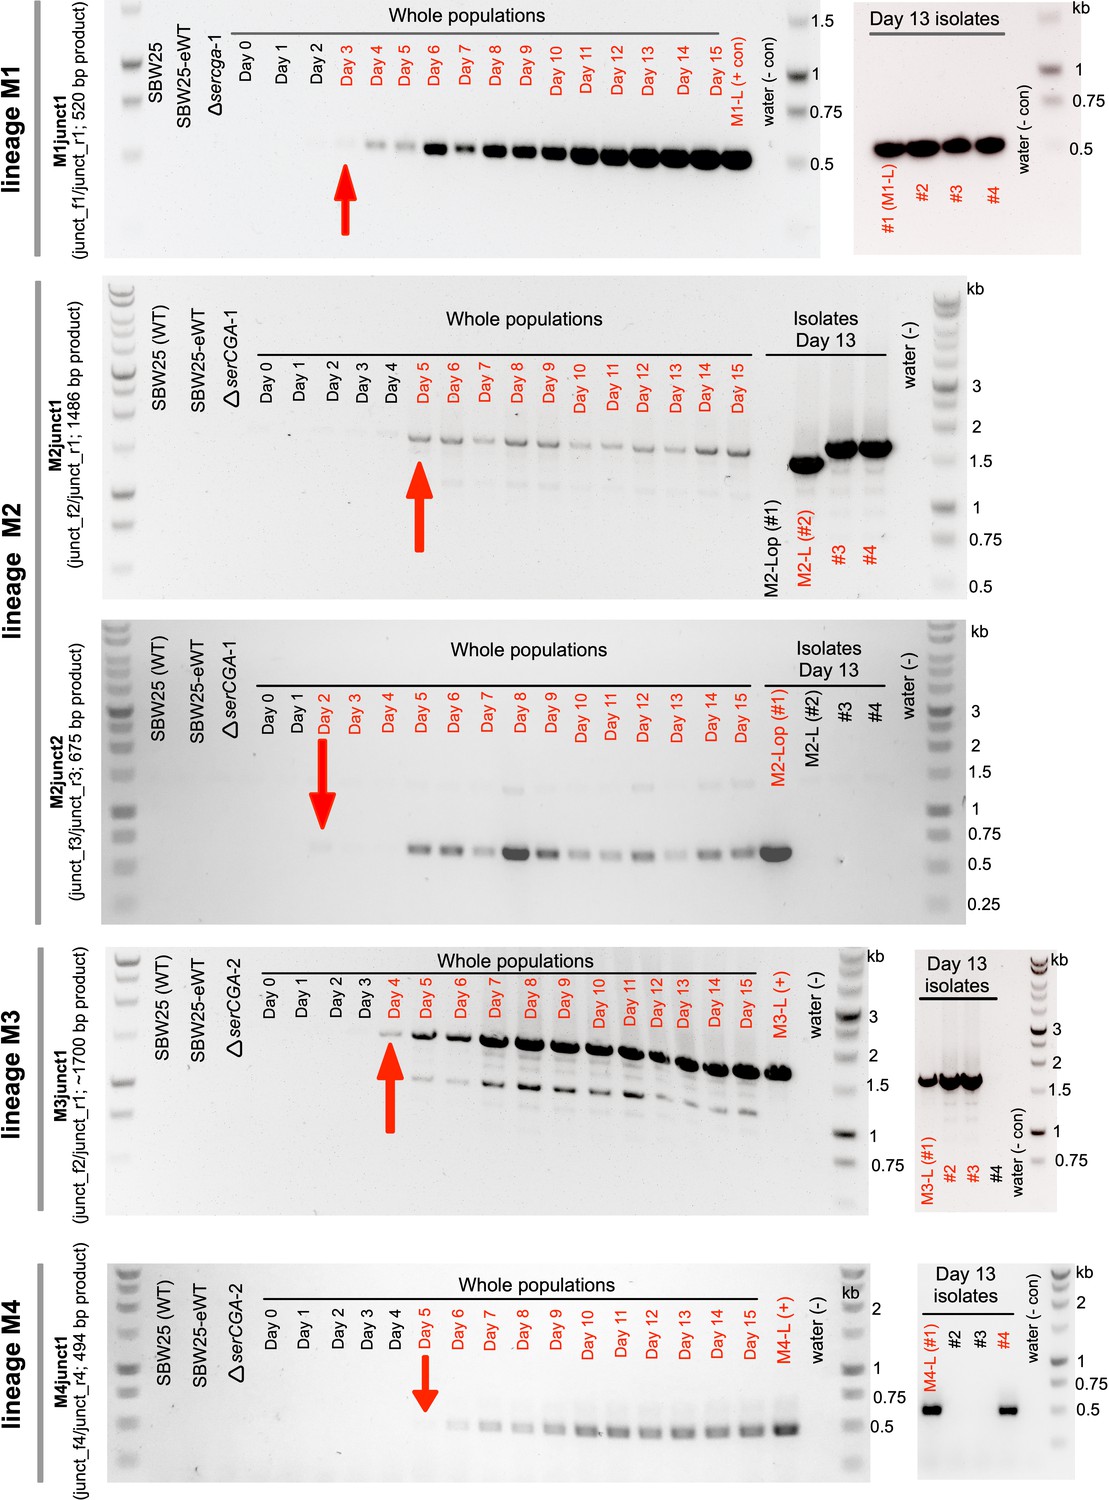
Large tandem duplications are detected between days 2 and 5 of the evolution experiment.
The emergence of five duplication junctions (top to bottom: M1junct1, M2junct1, M2junct2, M3junct1, and M4junct1) was tracked across the relevant lineage (M1, M2, M2, M3, and M4, respectively) using duplication junction PCR on daily population samples. Each PCR product was first observed between days 2 and 5 of the evolution experiment (first appearance is indicated by red arrows). Junction PCRs performed on several large colony isolates from each lineage on day 13 indicate that while the identified duplication fragment is present in a sizeable proportion of large colony isolates, some genetic heterogeneity exists. Red writing = relevant PCR product detected, black writing = relevant PCR product not detected. The colours in each gel photograph were inverted using Preview (v11.0) to better detect faint PCR products. The left-hand gel for lineage M1 is also presented in the main manuscript (Figure 4E) and is included here for completeness.
Figure 5 with 1 supplement
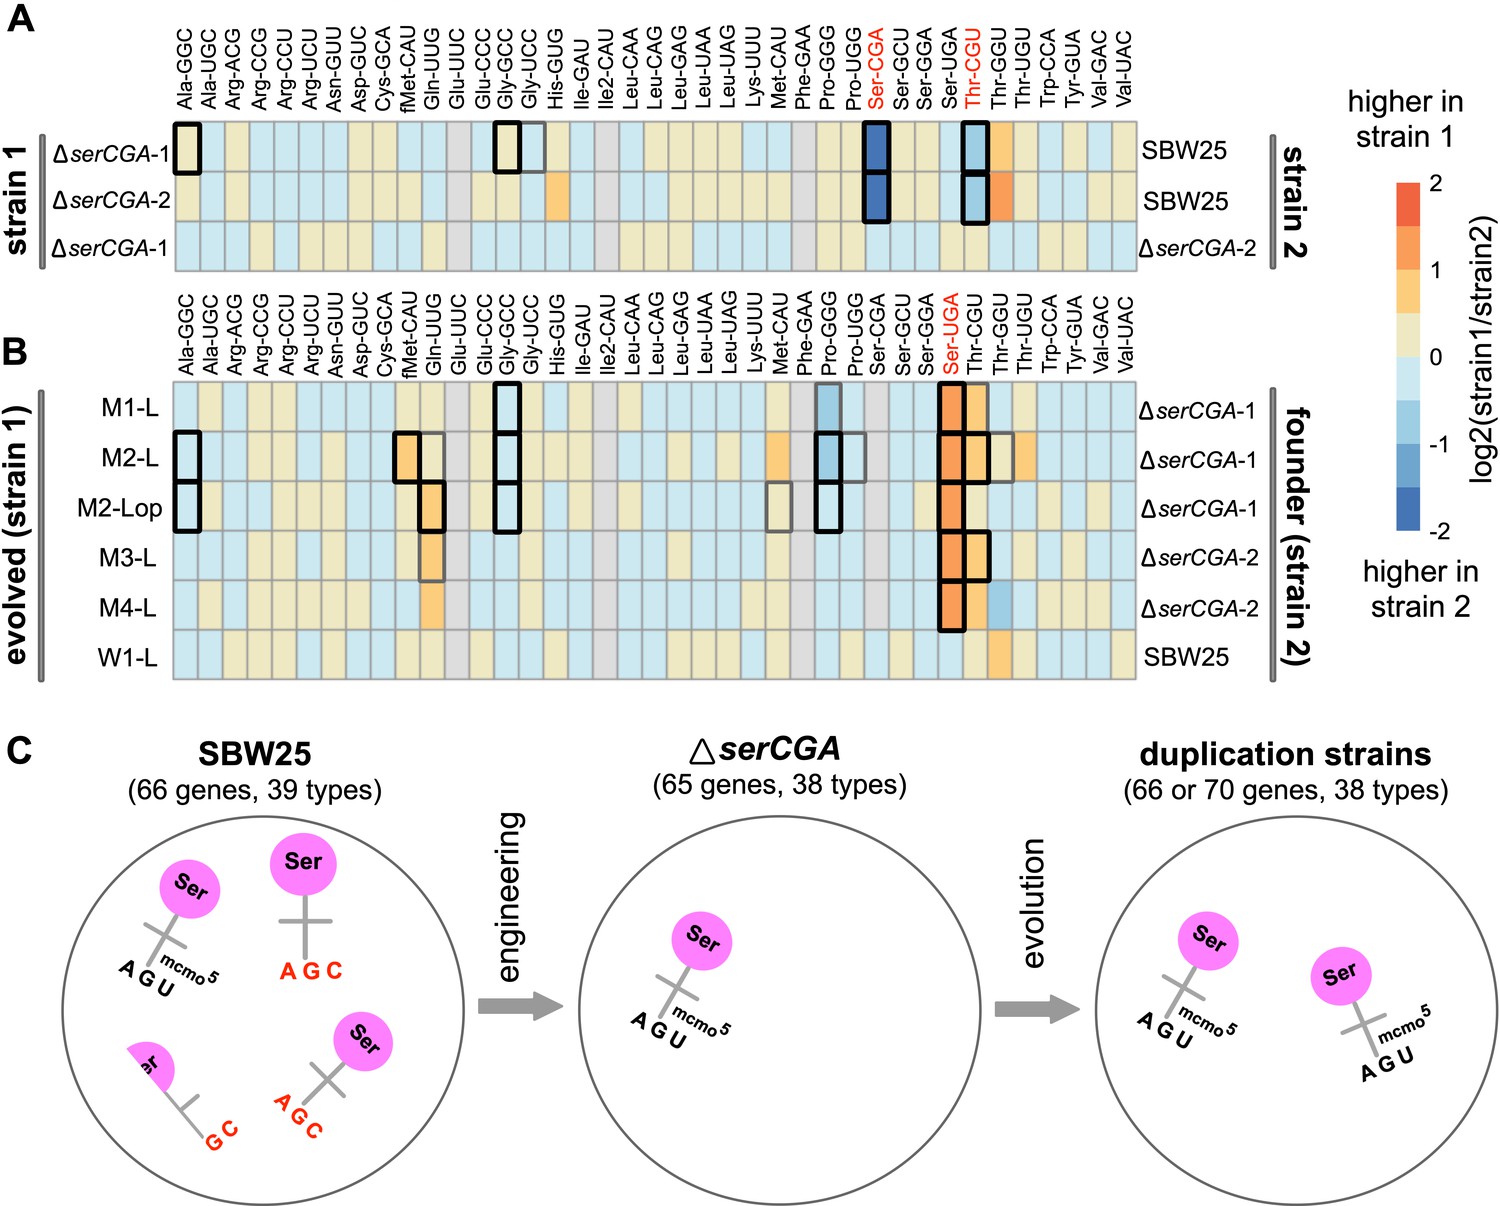
Heatmaps showing differences in mature tRNA levels between strains.
The log2-fold.change(strain1/strain2) difference in expression for 36 mature tRNA types (with 38 different primary sequences) was determined for pairs of strains using DESeq2. (A) Mature tRNA expression levels in the serCGA deletion mutants compared with SBW25, demonstrating a consistently lower levels of tRNA-Ser(CGA) and tRNA-Thr(CGU) upon deletion of serCGA. tRNAs in red show a consistent difference in all comparisons except ΔserCGA-1 versus ΔserCGA-2 (row 3), the control comparison for which no significant differences in mature tRNA levels were detected. (B) tRNA-Ser(UGA) is higher in the mature tRNA pool in each of the five serTGA duplication isolates compared with the deletion mutant (with no significant differences detected in the wild type control Line, row 6). Some tRNA types were removed from the DESeq2 analysis (filled grey boxes): Glu-UUC, Ile2-CAU, Phe-GAA, and – in some comparisons – Ser-CGA, consistently gave low read numbers. Box borders represent statistical significance: thin grey = adjusted p>0.01, thick grey = 0.01 > adjusted p>0.001, black = adjusted p<0.001. tRNAs in red show a consistent difference in all comparisons except for the control (row 6). (C) Cartoon depicting the major effects of serCGA deletion (loss of tRNA-Ser(CGA)) and subsequent serTGA duplication (twofold increase of tRNA-Ser(UGA)) on the relative proportions of seryl-tRNAs in the mature tRNA pool.
-
Figure 5—source data 1
This file contains the DESeq2 values from the tRNA expression analysis used in Figure 5 panels A and B, and Figure 5—figure supplement 1.
Using the aligned YAMAT-seq read data (Supplementary file 7) as input, DESeq2 output consists of: baseMean1 and baseMean2 (the normalized mean expression level of three replicates of strains 1 and 2); fold.change1 and fold.change2 (fold change calculated by baseMean1/baseMean2 or baseMean2/baseMean1, respectively); log2.fold.change1 (log2 of fold.change1); p-value (calculated by assuming a binomially distributed read coverage analogous to Fisher’s exact test [Robinson and Smyth, 2008; Anders and Huber, 2010; Anders et al., 2015]); padj (p-value adjusted for multiple testing with the Benjamini–Hochberg procedure, which controls for false discovery rate Anders and Huber, 2010; Anders et al., 2015). For each pairwise comparison, rows (tRNA types) are ordered according to increasing padj. Next, all rows with a padj < 0.01 (above the solid black line) were ordered by decreasing log2(fold.change1), and those with a negative log2(fold.change1) value were reordered according to decreasing fold.change2. This puts the tRNA types with statistically significant differences first, with those higher in strain 1 listed at the top (ordered by decreasing size of expression difference; green), followed by those higher in strain 2 (ordered by decreasing expression difference; pink). The first tab contains the comparisons investigating the effect of deleting the serCGA gene (Figure 5A). The second tab contains the comparisons investigating the effect of duplicating the serTGA gene (Figure 5B). The third tab contains the comparisons between the five different duplication strains (Figure 5—figure supplement 1). The fourth tab contains the comparisons between each of the five duplication strains and SBW25.
- https://cdn.elifesciences.org/articles/57947/elife-57947-fig5-data1-v2.xlsx
Figure 5—figure supplement 1
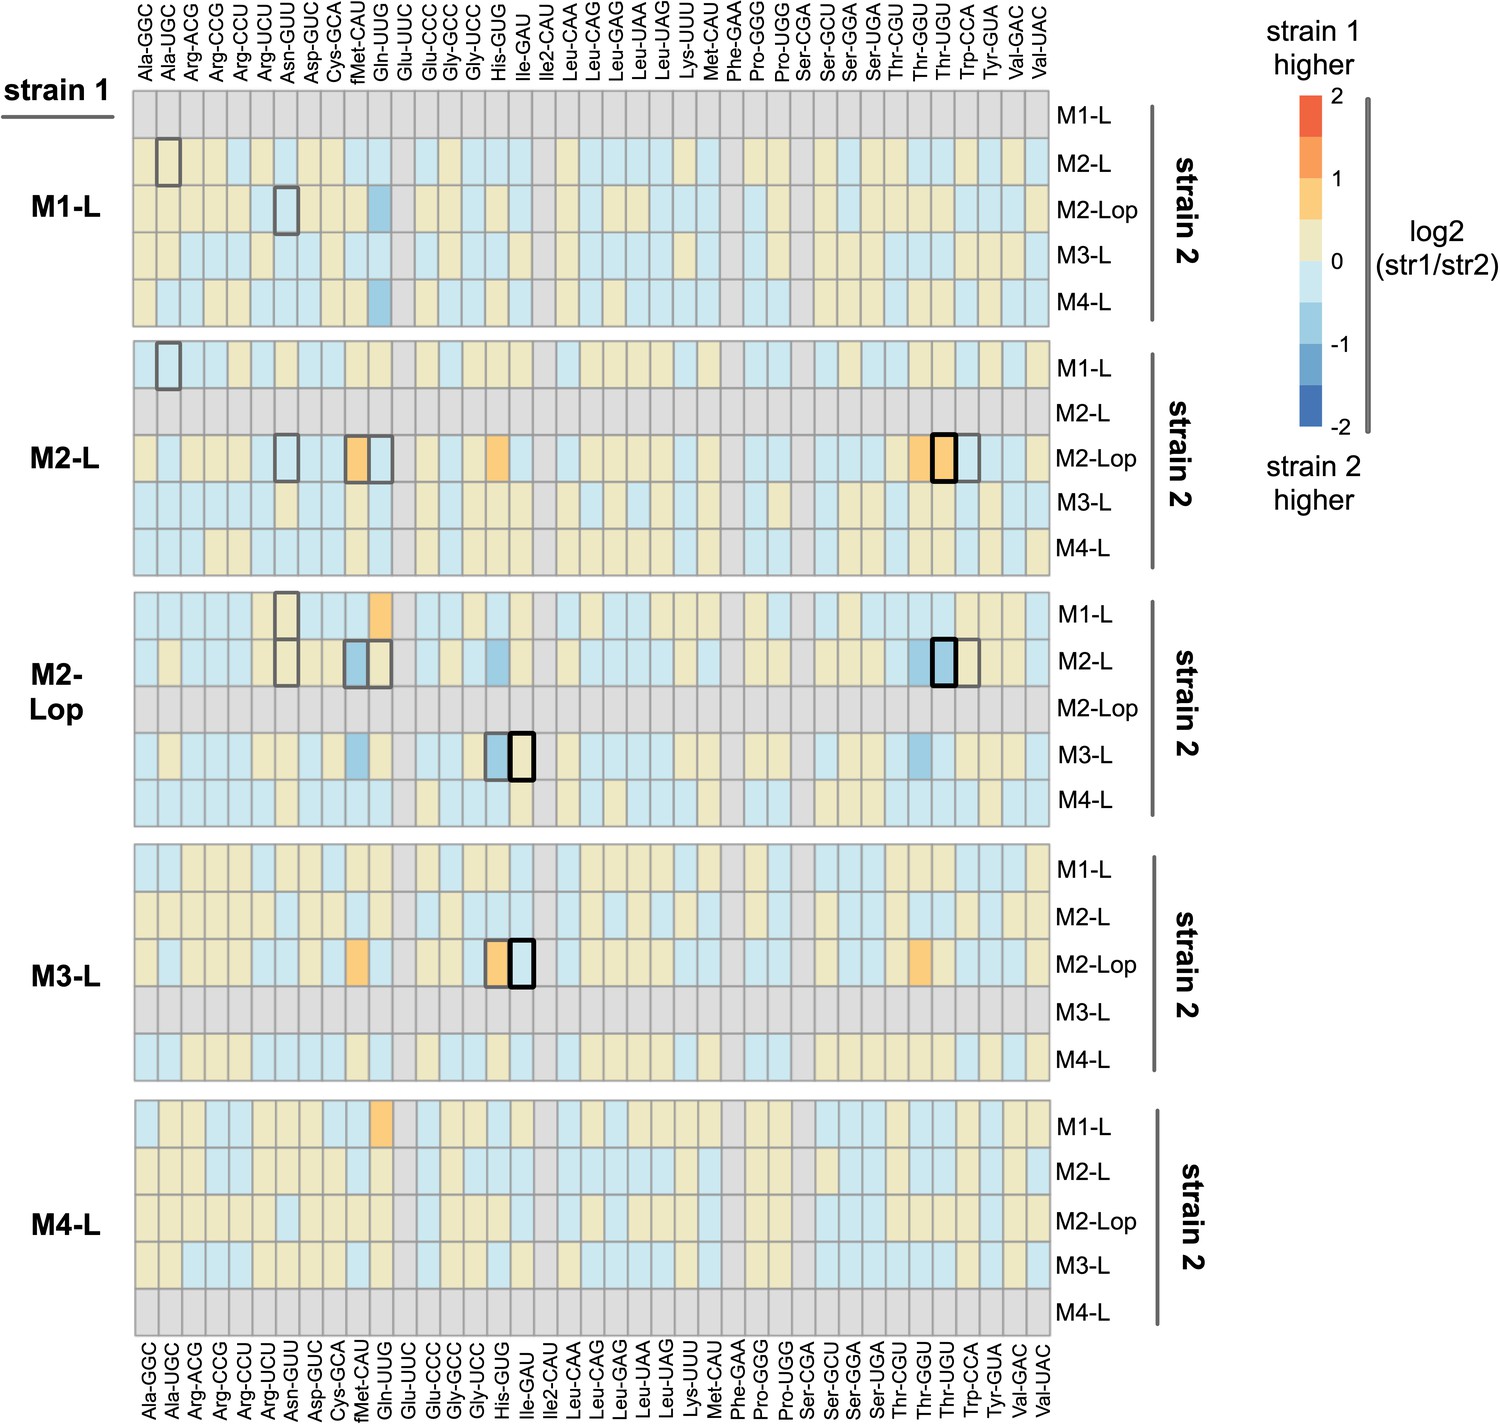
Comparison of expression levels of tRNA types in five strains isolated from mutant lineages on day 13.
YAMAT-seq was performed, and data analysed, as described in the manuscript. The read numbers provided in Supplementary file 7 were used for DESeq2 pairwise comparisons between three replicates of each strain (output is in source data file 5). Here, the log2-foldchange of each tRNA type is plotted as a heat map for all 20 pairwise comparisons between the five mutant lineage isolates (e.g., M1-L versus each of M2-L, M2-Lop, M3-L, and M4-L). Orange/red colouration indicates higher expression in strain 1, blue in strain 2 (colour intensity denotes the size of the difference; darker colour = larger difference). Boxes for four tRNA types (Glu-UUC, Ile2-GAU, Phe-GAA, Ser-CGA) are filled in grey; these were removed from the analysis due to very low YAMAT-seq read numbers for both strains (see main manuscript Results). Boxes for tRNA types with statistically significant differences are highlighted by black or dark grey borders (black border DESeq2 p<0.001, dark grey 0.001 < p< 0.01; light grey p>0.01).
Author response image 1
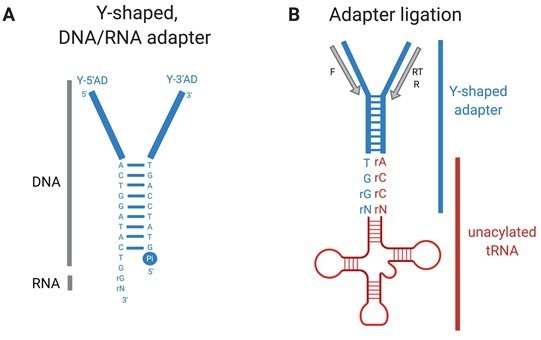
YAMAT-seq (Shigematsu et al., 2017) quantifies mature uncharged and charged tRNAs in growing cells.
Total RNA isolated for YAMAT-seq includes both charged and uncharged tRNAs. The amino acids are removed from charged tRNAs in alkaline conditions. Y-shaped, DNA/RNA hybrid adapters (A) are ligated specifically to mature, uncharged tRNAs (B). Adapter-tRNA complexes are reverse transcribed and products PCR amplified, purified, and deep sequenced (Illumina). Pi=inorganic phosphate, RT=reverse transcription (RT) primer, F= forward PCR primer, R=reverse PCR primer.
Tables
Table 1
Duplication junctions in five isolates from the mutant lineages reveal duplication fragments of 45–290 kb.
Base positions refer to the SBW25 wild type genome sequence (Silby et al., 2009). For a list and details of the genes contained within each duplication segment, see Supplementary file 4.
| Strain name | Dup. size (bp) | Junction name | Junction side 1 | Junction side 2 | ||
|---|---|---|---|---|---|---|
| Base | Region | Base | Region | |||
| M1-L | 45,043 | M1junct | 4,164,966 | murB | 4,119,923 | Intergenic repeat |
| M2-L | 191,833 | M2junct1 | 4,310,940–4,311,029 | Intergenic repeat | 4,119,235–4,119,352 | Intergenic repeat |
| M2-Lop | 182,877 | M2junct2 | 4,224,306 | nuoL | 4,042,455 | pflu3649 |
| M3-L | ~192,000 | M3junct1 | ~4,310,800 | Intergenic repeat | ~4,119,100 | Intergenic repeat |
| M4-L | 290,335 | M4junct1 | 4,339,314 | Intergenic | 4,048,979 | pflu3655 |
Table 2
Numerical estimates of relative translation times using the mature tRNA pool measurements obtained during YAMAT-seq.
| Strain | YAMAT-seq proportion | relative to tRNA gene set 1 | ||||
|---|---|---|---|---|---|---|
| tRNA-Ser(UGA)a | tRNA-Ser(CGA)b | |||||
| tRNA gene set 1: wild type (one serCGA, one serTGA) | ||||||
| SBW25 | 0.0059 | 0.015 | 169 | 47.8 | 385 | 0.970 |
| W1-L | 0.0056 | 0.014 | 179 | 51.0 | 408 | 1.03 |
| Mean | 174 | 49.4 | 397 | 1 | ||
| tRNA gene set 2: serCGA deletion (0 serCGA, one serTGA) | ||||||
| ΔserCGA-1 | 0.0050 | 0 | 200 | 200 | 1100 | 2.77 |
| ΔserCGA-2 | 0.0047 | 0 | 213 | 213 | 1170 | 2.95 |
| Mean | 207 | 207 | 1135 | 2.86 | ||
| tRNA gene set 3: serCGA deletion and serTGA duplication (0 serCGA, two serTGA) | ||||||
| M1-L | 0.013 | 0 | 76.9 | 76.9 | 423 | 1.07 |
| M2-Lop | 0.012 | 0 | 83.3 | 83.3 | 458 | 1.15 |
| M2-L | 0.012 | 0 | 83.3 | 83.3 | 458 | 1.15 |
| M3-L | 0.011 | 0 | 90.9 | 90.9 | 500 | 1.26 |
| M4-L | 0.010 | 0 | 100 | 100 | 550 | 1.39 |
| Mean | 86.9 | 86.9 | 478 | 1.20 | ||
Key resources table
| Reagent type (species) or resource | Designation | Source or reference | Identifiers | Additional information |
|---|---|---|---|---|
| Gene (P. fluorescens SBW25) | serCGA | N/A | PFLUt39 | Encodes tRNA-Ser(CGA) |
| Gene (P. fluorescens SBW25) | serTGA | N/A | PFLUt51 | Encodes tRNA-Ser(UGA) |
| Strain, strainbackground (P. fluorescens SBW25) | Pseudomonas fluorescens SBW25 | Rainey and Bailey, 1996; Silby et al., 2009 | Wild type | |
| Genetic reagent (P. fluorescens SBW25) | SBW25-lacZ | Zhang and Rainey, 2007 | Neutrally marked SBW25 for competition experiments | |
| Genetic reagent (P. fluorescens SBW25) | ΔserCGA-1 | This work | Bases 1624957–1625092, encompassing serCGA, removed. Biological replicate of ΔserCGA-2 | |
| Genetic reagent (P. fluorescens SBW25) | ΔserCGA-2 | This work | Bases 1624957–1625092, encompassing serCGA, removed. Biological replicate of ΔserCGA-1 | |
| Genetic reagent (P. fluorescens SBW25) | SBW25-eWT | This work | Wild type SBW25 that has been through the engineering process | |
| Genetic reagent (P. fluorescens SBW25) | W1-L | This work | Evolution isolate from day 13 of lineage W1 (founded by SBW25) | |
| Genetic reagent (P. fluorescens SBW25) | W3-L | This work | Evolution isolate from day 13 of lineage W3 (founded by SBW25-eWT) | |
| Genetic reagent (P. fluorescens SBW25) | M1-L | This work | Evolution isolate from day 13 of lineage M1 (founded by ΔserCGA-1) | |
| Genetic reagent (P. fluorescens SBW25) | M2-L | This work | Evolution isolate from day 13 of lineage M2 (founded by ΔserCGA-1) | |
| Genetic reagent (P. fluorescens SBW25) | M2-Lop | This work | Second evolution isolate from day 13 of lineage M2 (founded by ΔserCGA-1) | |
| Genetic reagent (P. fluorescens SBW25) | M3-L | This work | Evolution isolate from day 13 of lineage M3 (founded by ΔserCGA-2) | |
| Genetic reagent (P. fluorescens SBW25) | M4-L | This work | Evolution isolate from day 13 of lineage M4 (founded by ΔserCGA-2) | |
| Recombinant DNA reagent | pSXn (plasmid) | Owen and Ackerley, 2011; Frederic Bertels | pSX with one copy of a 38 bp direct repeat removed | |
| Recombinant DNA reagent | pSXn-CGA (plasmid) | This work | pSXn carrying serCGA | |
| Recombinant DNA reagent | pSXn-TGA (plasmid) | This work | pSXn carrying serTGA | |
| Commercial assay or kit | DNeasy Blood and Tissue Kit | Qiagencat. no. 69506 | ||
| Commercial assay or kit | NextSeq 550 Output v2.5 kit | Illuminacat.no. 20024904 | ||
| Commercial assay or kit | TRIzol Max Bacterial RNA isolation kit | Life Technologiescat.no. 16096040 | ||
| Commercial assay or kit | DNA 7500 kit | Agilent Technologies | ||
| Software, algorithm | GtRNAdb 2.0 | Chan and Lowe, 2016 | https://www.gtrnadb.ucsc.edu | |
| Software, algorithm | tRNAscan-SE 2.0 | Chan and Lowe, 2019 | https://www.lowelab.ucsc.edu/tRNAscan-SE/ | |
| Software, algorithm | BLASTp | Altschul et al., 1990 | https://blast.ncbi.nlm.nih.gov/Blast.cgi?PAGE=Proteins | |
| Software, algorithm | Gen5 | BioTek | https://www.biotek.com/ | |
| Software, algorithm | Geneious v11.1.4 | Geneious | https://www.geneious.com/home/ | |
| Software, algorithm | breseq v0.33.2 | Deatherage et al., 2014a; Deatherage and Barrick, 2014b | https://barricklab.org/twiki/bin/view/Lab/ToolsBacterialGenomeResequencing | |
| Software, algorithm | R v3.6.0 | R Foundation for Statistical Computing, 2013 | https://www.r-project.org/ | |
| Other | SuperScript III reverse transcriptase | ThermoFisher Scientific cat.no.18080093 | ||
| Other | T4 RNA ligase 2 | New England BioLabs cat.no. M0239L | Also known as T4 Rnl2 | |
| Other | Phusion | ThermoFisher Scientific cat.no.M0531S | ||
| Other | 5% Mini-PROTEANTBE Gels | Bio-Rad Laboratories cat.no.4565015 |
Additional files
-
Supplementary file 1
Details of tRNA types predicted in the P. fluorescens SBW25 genome, and a putative codon-tRNA matching pattern.
A list of 62 theoretically possible tRNA types (61 elongator tRNAs and one initiator tRNA) is provided. Of these, 23 are absent from the SBW25 tRNA gene set. Codon-tRNA matching patterns are based on the G-U wobble rule (Crick, 1966), and post-transcriptional modifications predicted using a combination of MODOMICS (Boccaletto et al., 2018), tRNAmod (Panwar and Raghava, 2014), and tRNAmodpred (Machnicka et al., 2016). Following current wobble rules (described in Agris et al., 2018) and the predicted post-transcriptional modifications, the 39 tRNA types present in SBW25 are split into 33 theoretically essential types (pink highlighting) and six theoretically non-essential types (green highlighting). Gene copy numbers and genome-wide proportions of codon use (from GtRNAdb; Chan and Lowe, 2016) are listed for each tRNA type present. Further notes are provided where appropriate.
- https://cdn.elifesciences.org/articles/57947/elife-57947-supp1-v2.xlsx
-
Supplementary file 2
List of strains, plasmids, oligonucleotides, and duplication junctions used in this study.
- https://cdn.elifesciences.org/articles/57947/elife-57947-supp2-v2.xlsx
-
Supplementary file 3
Complete list of mutations predicted from the whole genome sequencing of isolates from day 13 of the evolution experiment.
Whole genome sequence data (Illumina NextSeq, 150 bp, paired-end reads; SRA accession number: PRJNA558233) were obtained for seven strains from day 13 of the evolution experiment: W1-L, W3-L (each derived from two independent SBW25 control lineages), M1-L, M2-L, M2-Lop, M3-L, and M4-L (each derived from four independent serCGA deletion lineages). A minimum of 4.5 million raw reads was obtained for each sample, and these were aligned to the P. fluorescens SBW25 genome sequence (Silby et al., 2009) and subsequently analysed using a combination of breseq (Barrick et al., 2014) and Geneious. This file provides a summary and a full report of the mutations predicted in each isolate. In addition to the large tandem duplications detailed in Table 1, two unique point mutations were identified: W3-L carries a non-synonymous point mutation in ytfH (encoding a probable transcriptional regulator), and M2-L carries a synonymous point mutation in edd (encoding phosphogluconate dehydratase). There is evidence for some non-ubiquitous deletions in repetitive, intergenic, DNA elements in M1-L, M2-L, M2-Lop, and M4-L. These deletions affect areas outside of the large duplication regions. Some putative mutations were identified in all (or most) isolates, many of which have also been identified in unrelated experiments (i.e., are likely to be present in the starting strain; Gallie et al., 2015, Gallie et al., 2019). As such, these putative mutations are not expected to be relevant for the fitness effects described in this manuscript.
- https://cdn.elifesciences.org/articles/57947/elife-57947-supp3-v2.xlsx
-
Supplementary file 4
List of genes in each duplication fragment.
The spreadsheet lists the SBW25 gene annotations from NCBI (6176 genes; left of the spreadsheet), followed by the details of which genes are duplicated in M1-L, M2-L, M2-Lop, M3-L, and M4-L. Note that for comparison purposes, the duplication details for each strain are provided on the same line numbers as the SBW25 list (scroll down until the first duplicated genes is visible in each duplication isolate). The core set of 45 genes that is duplicated in each of the five isolates is highlighted in pink.
- https://cdn.elifesciences.org/articles/57947/elife-57947-supp4-v2.xlsx
-
Supplementary file 5
Whole genome sequencing base calls reveal no evidence of mutations in either copy of serTGA (or its promoter) in any of the five duplication-carrying strains.
This file contains details of the raw read numbers of proportions of the dominant base called at SBW25 chromosome positions 4,163,616–4,163,861 in strains W1-L, W3-L (each carrying one serTGA copy), M1-L, M2-L, M2-Lop, M3-L, and M4-L (each carrying two serTGA copies). This 245 bp segment encompasses the serTGA gene and ~155 bp of the upstream region, which is expected to contain the serTGA promoter. Any point mutation in either serTGA copy in the duplication strains (M1-L, M2-L, M2-Lop, M3-L, and M4-L) is expected to be reflected by a drop in the proportion of the dominant base (to around 0.5). For example, if in M1-L one serTGA copy had gained a C→T point mutation in tRNA position 34 (i.e., an anticodon switch event; see Discussion), one would expect approximately half the 214 reads covering base 4,163,669 to contain a T, and the other half to carry a C. Therefore, the dominant base proportion would be expected to drop to ~0.5. No evidence was found of any mutations in any copy of serTGA or its promoter; all 245 bp were covered by a minimum of 127 reads in each duplication strain, with at least 94% of reads at each position carrying the dominant base.
- https://cdn.elifesciences.org/articles/57947/elife-57947-supp5-v2.xlsx
-
Supplementary file 6
Reference list of 42 unique tRNA sequences in P. fluorescens SBW25 GtRNAdb 2.0 predicts 67 tRNA genes in P. fluorescens SBW25 (Chan and Lowe, 2016).
These include 42 unique primary tRNA sequences, each of which is listed in this file. These 42 sequences are used as references to align the YAMAT-seq data in this work (see Supplementary file 7). Note that the list of 42 sequences includes one likely pseudo tRNA (11_Cys-GCA-2–1). This sequence is not predicted to form a tRNA with conserved cloverleaf secondary structure (Chan and Lowe, 2019). Further, no YAMAT-seq sequences were aligned to this reference sequence in any sample. We conclude that Cys-GCA-2–1 does not form part of the functional mature tRNA pool in SBW25. In addition, the serCGA sequence (30_Ser-CGA-1–1) is expected to be absent from 21 of 27 samples (samples 2–8, 11–17, and 20–26); this tRNA is encoded by serCGA (the gene that was deleted by genetic engineering in this work and remains absent in all derived strains). As expected, almost no reads were obtained for this reference sequence in these 21 samples. The very low numbers of Ser-CGA reads obtained in some of these samples (e.g., two reads in sample 20, the third replicate of ΔserCGA-1) are likely to be barcode misallocations from one of the six SBW25 or W1-L samples.
- https://cdn.elifesciences.org/articles/57947/elife-57947-supp6-v2.docx
-
Supplementary file 7
YAMAT-seq data showing elimination of tRNA-Ser(CGA) followed by elevating of tRNA-Ser(UGA) expression in each of the five duplication isolates.
The first tab contains index details and a summary of the raw YAMAT-seq reads (GEO accession number GSE144791; Edgar et al., 2002) for each of the 27 samples (three replicates of nine strains): a minimum of 636,995 reads of the expected size (80–151 bp) was obtained per sample. In each case, between 86.4% and 93.0% of these aligned to the list of 42x reference SBW25 tRNA sequences (provided in Supplementary file 6). The subsequent nine tabs contain the YAMAT-seq data for each of the nine strains tested (SBW25, ΔserCGA-1, ΔserCGA-2, W1-L, M1-L, M2-L, M2-Lop, M3-L, and M4-L). Each tab contains (i) the numbers of reads for 42 reference tRNAs, for three replicates (left), (ii) numbers of reference reads for 39 tRNA types in SBW25 (e.g., tRNA-Asn-GTT is the sum of reference sequences 7_Asn-GTT-1–1 and 8_Asn-GTT-2–1; middle), (iii) the proportion of each tRNA type in the mature tRNA pool for each of the three samples (right), and (iv) a scatter plot of the YAMAT-seq proportions versus the proportion of the tRNA gene set encoding the tRNA type. Blue = tRNA-Ser(CGA), green = tRNA-Ser(UGA). The final tab contains information regarding the unused reads for each sample.
- https://cdn.elifesciences.org/articles/57947/elife-57947-supp7-v2.xlsx
-
Transparent reporting form
- https://cdn.elifesciences.org/articles/57947/elife-57947-transrepform-v2.pdf
Download links
A two-part list of links to download the article, or parts of the article, in various formats.
Downloads (link to download the article as PDF)
Open citations (links to open the citations from this article in various online reference manager services)
Cite this article (links to download the citations from this article in formats compatible with various reference manager tools)
The birth of a bacterial tRNA gene by large-scale, tandem duplication events
eLife 9:e57947.
https://doi.org/10.7554/eLife.57947


