G protein-regulated endocytic trafficking of adenylyl cyclase type 9
- Program in Biochemistry and Cell Biology, University of California San Francisco, United States
- Cardiovascular Research Institute and Department of Biochemistry and Biophysics, University of California San Francisco, United States
- Department of Integrative Biology and Pharmacology, University of Texas Health Science Center, United States
- Lung Biology Center, Department of Medicine, University of California San Francisco, United States
- Department of Pharmacology and Moores Cancer Center, University of California San Diego, United States
- Graduate School of Pharmaceutical Sciences, Tohoku University, Aoba-ku, Japan
- Department of Psychiatry and Department of Cellular and Molecular Pharmacology, University of California San Francisco, United States
Figures
Figure 1 with 1 supplement
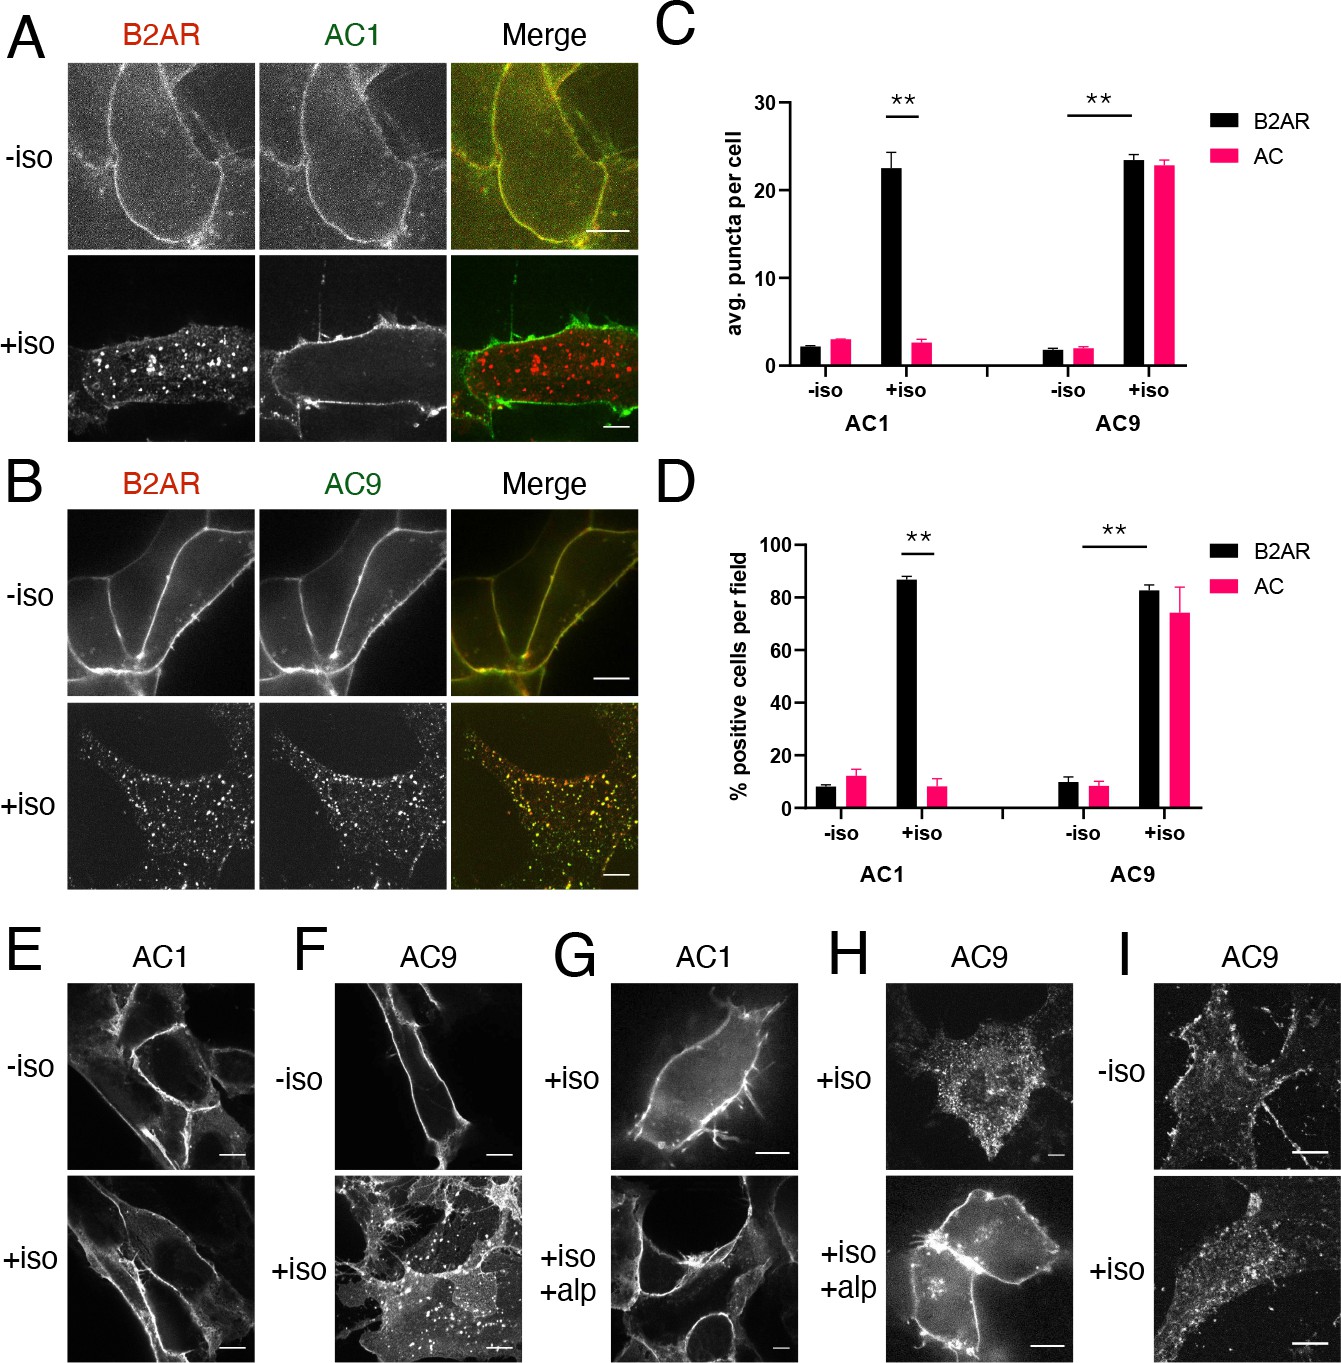
β2AR activation promotes redistribution of AC9 but not AC1.
(A) Representative confocal imaging of HEK293 cells coexpressing HA-β2AR and Flag-AC1 after treatment with 10 µM isoproterenol or control for 30 min. Scale Bar is 8 µm. (B) Representative confocal images of HEK293 cells coexpressing HA-β2AR and Flag-AC9 after treatment with 10 µM isoproterenol or control for 30 min. Scale Bar is 8 µm. (C) Quantification of internal puncta that are β2AR or AC1/9 positive, taken from wide field images (see Figure 1—figure supplement 1D and E) [mean ± SEM; n = 3 experiments, 10 visual fields and 200+ cells per condition]. **p<0.01 by two-tailed t-test. (D) Quantification of cells with >10 internal puncta that are β2AR or AC1/9 positive, taken from wide field images (see Figure 1—figure supplement 1D andE) [mean ± SEM; n = 3 experiments, 10 visual fields and 200+ cells per condition]. **p<0.01 by two-tailed t-test. (E–F) Representative confocal imaging of HEK293 cells expressing Flag-AC1 (E) or Flag-AC9 (F) after treatment with 10 µM isoproterenol or control for 30 min. Scale Bar is 8 µM. (G–H) Representative confocal imaging of HEK293 cells expressing Flag-AC1 (G) or Flag-AC9 (H). Cells were stimulated with 100 nM isoproterenol for 30 min with or without 15 min of pretreatment with 10 µM alprenolol. (I) Representative confocal images of primary culture human airway smooth muscle cells immunostained for endogenous AC9 after treatment with 10 µM isoproterenol or control for 30 min. Scale Bar is 16 µm.
Figure 1—figure supplement 1
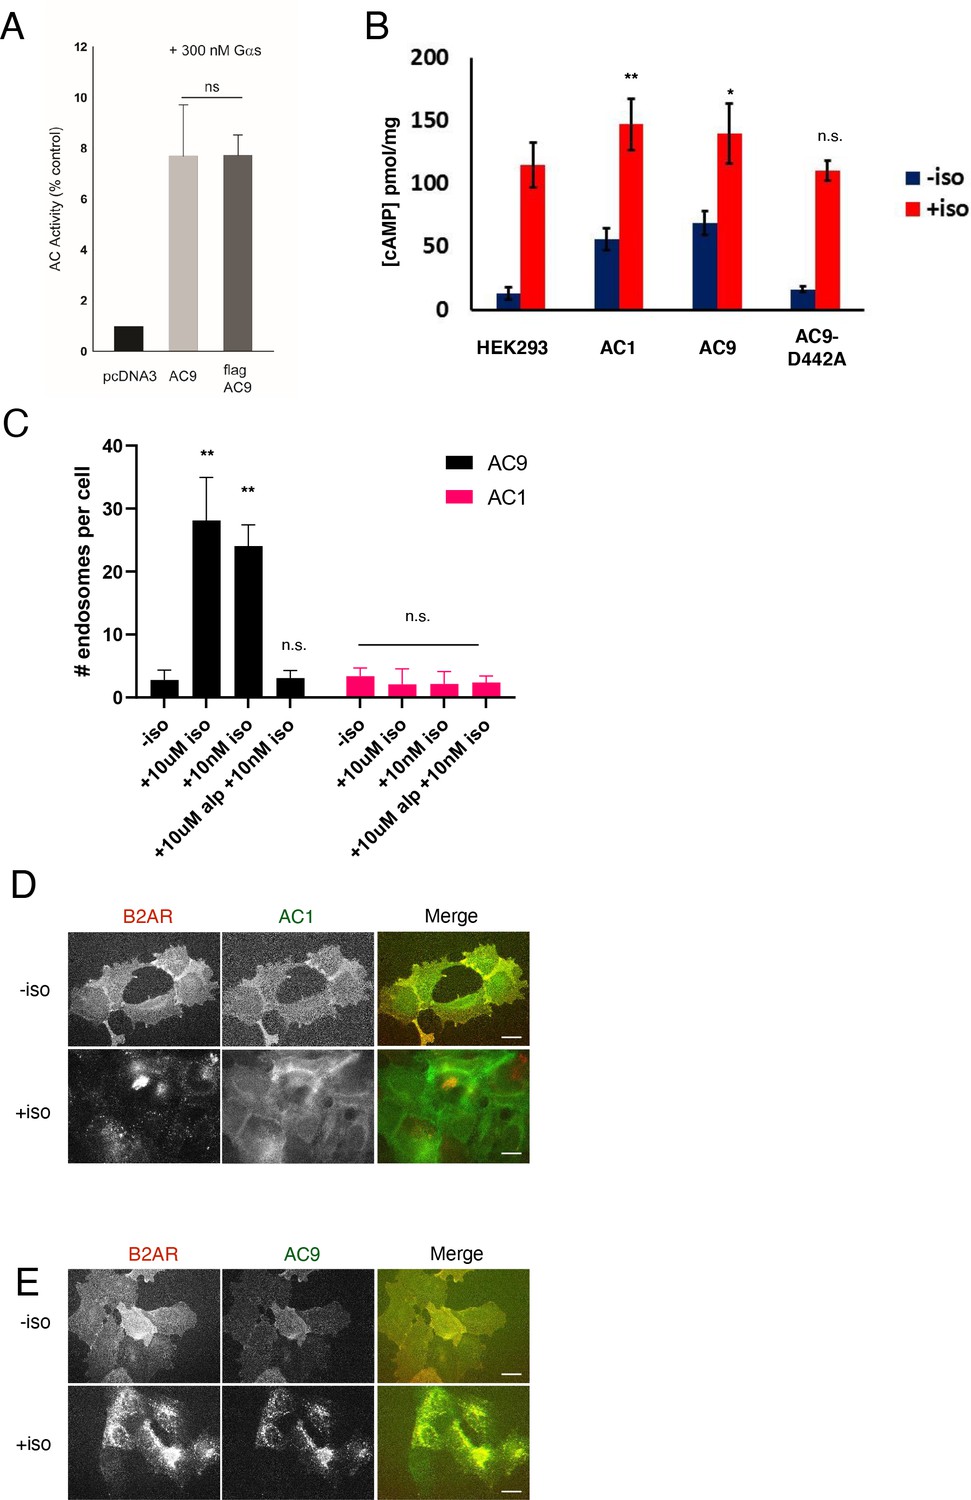
Functional validation of Flag-tagged AC9 and quantification of isoform-specific localization to endosomes.
(A) Quantification of the in vitro cAMP response by pcDNA3 control, untagged AC9, and Flag-tagged AC9 to 300 nM Gs (alpha subunit). (B) Quantification of the cAMP response to 10 µM isoproterenol in control HEK293 cells and cells overexpressing Flag-AC1, Flag-AC9, or Flag-AC9-D442A by ELISA assay. [mean ± SEM; n = 3 experiments] (C) Quantification of the number of endosomes in cells from (Figure 1E–H) [mean ± SEM; n = 3 experiments, 25 cells per condition]. (D) Wide field images of HEK293 cells coexpressing HA-β2AR and Flag-AC9, after treatment with 10 µm isoproterenol or control for 30 min. Scale bar is 16 µm. (E) Wide field images of HEK293 cells coexpressing HA-β2AR and Flag-AC1, after treatment with 10 µm isoproterenol or control for 30 min. Scale bar is 16 µm.
Figure 2 with 1 supplement
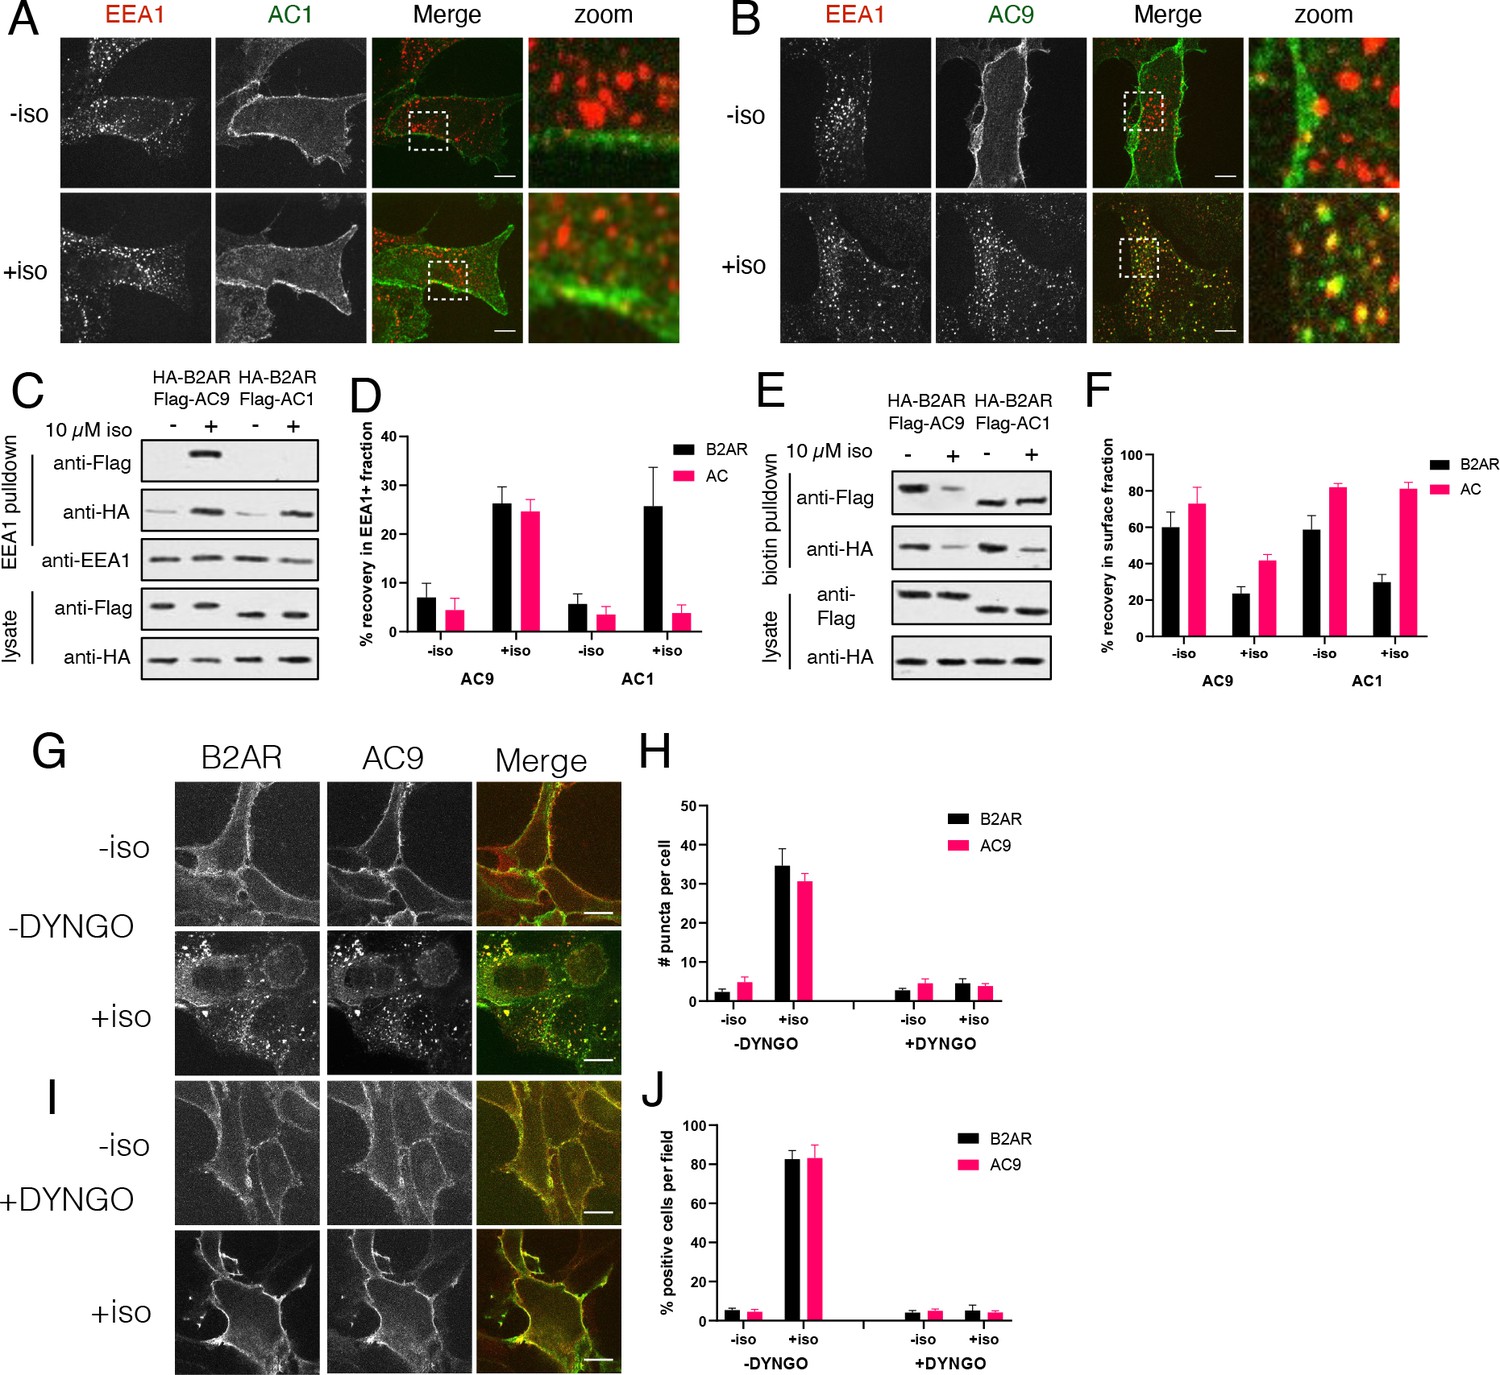
AC9 undergoes dynamin-dependent endocytosis and accumulates in endosomes marked by EEA1.
(A–B) Representative confocal images of HEK293 cells expressing Flag-AC1 (A) or Flag-AC9 (B) after treatment with 10 µM isoproterenol or control for 30 min and stained for endogenous EEA1. Scale bar is 8 µm. (C) Representative western blot of a fraction isolated using antibodies to EEA1. Lanes 1–2 correspond to control HEK293 cells, lanes 3–4 to cells coexpressing Flag-AC9 and HA-β2AR, and lanes 5–6 to cells coexpressing Flag-AC1 and HA-β2AR. (D) Quantification of recovery of HA-β2AR, Flag-AC9 and Flag-AC1 in the endosome fraction relative to cell lysate. [mean ± SEM; n = 7 experiments]. **p<0.01 by two-tailed t-test. (E) Representative western blot of the surface exposed fraction isolated by surface labeling with Sulfo-NHS-biotin and purified with streptavidin. Lanes 1–2 correspond to cells coexpressing Flag-AC9 and HA-β2AR, and lanes 3–4 to cells coexpressing Flag-AC1 and HA-β2AR. (F) Quantification of recovery of HA-β2AR, Flag-AC9 and Flag-AC1 in the surface biotinylated fraction relative to total cell lysate. [mean ± SEM; n = 7 experiments]. **p<0.01 by two-tailed t-test. (G) Representative confocal images of HEK293 cells coexpressing HA-β2AR and Flag-AC9 after treatment with 10 µM isoproterenol or control for 30 min. Cells were treated with DMSO for 15 min prior to agonist exposure. (H) Quantification of internal puncta that are β2AR or AC9 positive, taken from wide field images (see Figure 2—figure supplement 1D and E) [mean ± SEM; n = 3 experiments, 10 visual fields and 200+ cells per condition]. **p<0.01 by two-tailed t-test. (I) Representative confocal images of HEK293 cells coexpressing HA-β2AR and Flag-AC9 after treatment with 10 µM isoproterenol or control for 30 min. Cells were treated with DYNGO-4a for 15 min prior to agonist exposure. (J) Quantification of cells with >10 internal puncta that are β2AR or AC1/9 positive, taken from wide field images (see Figure 2—figure supplement 1D and E) [mean ± SEM; n = 3 experiments, 10 visual fields and 200+ cells per condition]. **p<0.01 by two-tailed t-test.
Figure 2—figure supplement 1
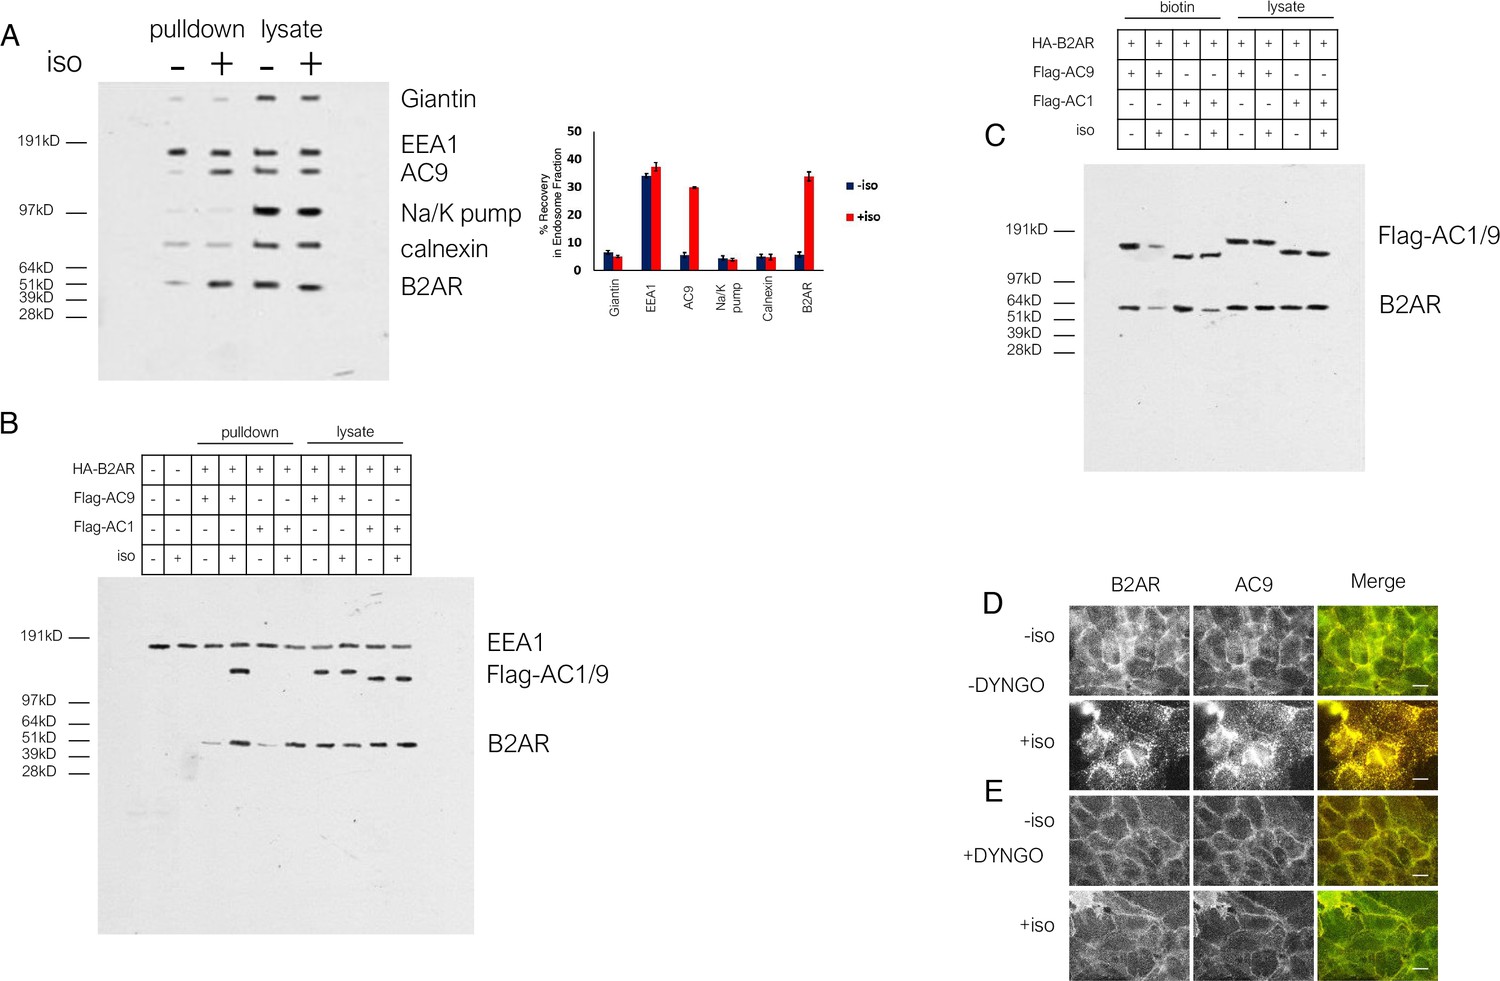
Assessment of endosome fraction purity and wide field images of DYNGO-4a effect.
(A) Full western blot of the endosome fraction vs total cell lysate, probed for cellular markers Giantin (Golgi), Na/K pump (plasma membrane), calnexin (endoplasmic reticulum). Quantification of 3 such experiments. (B) uncut western blot from Figure 2C. (C) uncut western blot from Figure 2E. (D) Wide field images of HEK293 cells coexpressing HA-β2AR and Flag-AC9, pretreated with DMSO control for 15 min, after treatment with 10 µm isoproterenol or control for 30 min. Scale bar is 16 µm. (E) Wide field images of HEK293 cells coexpressing HA-β2AR and Flag-AC1, pretreated with 30 uM DYNGO-4a, after treatment with 10 µm isoproterenol or control for 30 min. Scale bar is 16 µm.
Figure 3 with 1 supplement
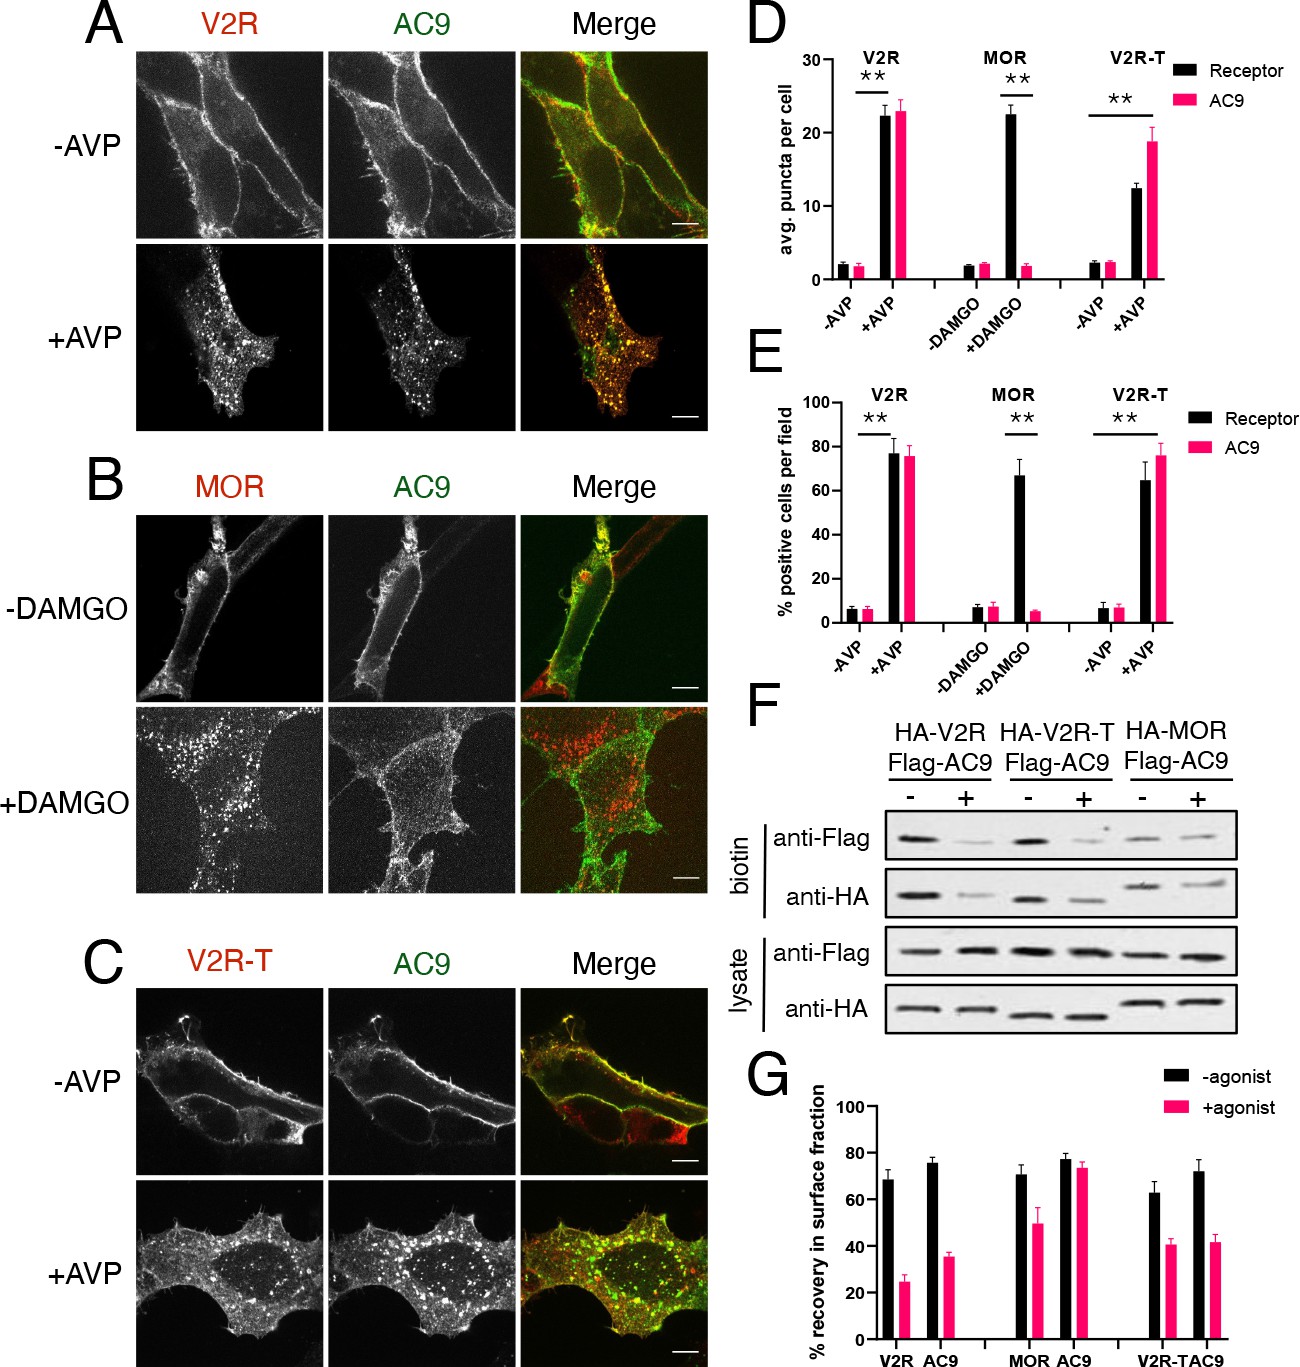
Gs but not Gi -coupled GPCRs promote AC9 trafficking.
(A–C) Representative confocal imaging of HEK293 cells coexpressing Flag-AC9 and HA-V2R (A), HA-MOR (B), or HA-V2R-trunc (C), after treatment with 10 µM agonist (AVP or DAMGO) or control for 30 min. Scale Bar is 8 µm. (D) Quantification of internal puncta that are V2R, MOR, V2R-T, or AC1/9 positive, taken from wide field images (see Figure 3—figure supplement 1D, E and F) [mean ± SEM; n = 3 experiments, 10 visual fields and 200+ cells per condition]. **p<0.01 by two-tailed t-test. (E) Quantification of cells with >10 internal puncta that are V2R, MOR, V2R-T or AC1/9 positive, taken from wide field images (see Figure 3—figure supplement 1D, E and F) [mean ± SEM; n = 3 experiments, 10 visual fields and 200+ cells per condition]. **p<0.01 by two-tailed t-test. (F) Representative western blot of the surface biotinylated fraction from HEK293 cells coexpressing HA-V2R and Flag-AC9 (lanes 1–2), HA-V2R-T and Flag-AC9 (lanes 3–4), or HA-MOR and Flag-AC9 (lanes 5–6). (G) Recovery of tagged protein in the surface biotinylated fraction relative to the total cell lysate as seen in (F) [mean ± SEM; n = 7 experiments]. **p<0.01 by two-tailed t-test.
Figure 3—figure supplement 1
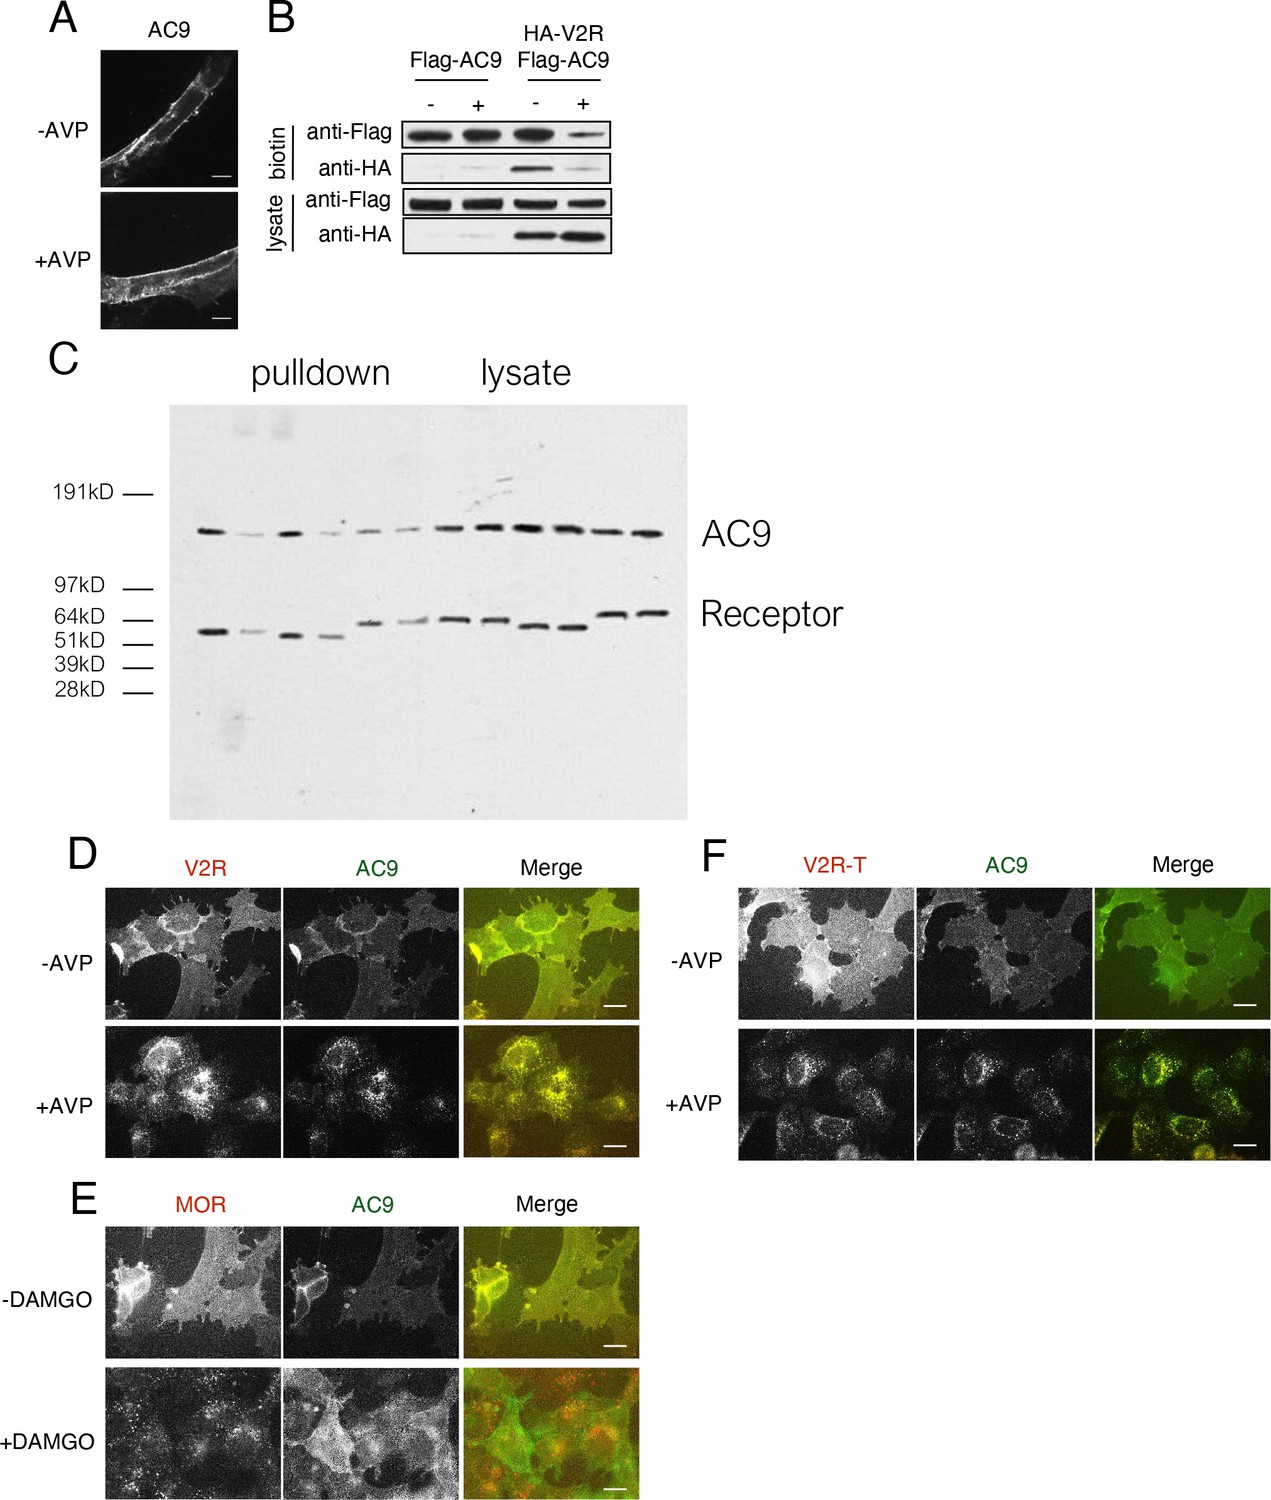
Validation that V2R and V2R-T activation stimulate AC9 trafficking.
(A) Representative confocal imaging of HEK293 cells expressing Flag-AC9, after treatment with 10 µM AVP or control for 30 min. Scale Bar is 8 µm. (B) Representative western blot of the surface biotinylated fraction from HEK293 cells expressing Flag-AC9 (lanes 1–2) or coexpressing HA-V2R and Flag-AC9 (lanes 3–4) [mean ± SEM; n = 3 experiments]. (C) Uncut blot from Figure 3F. (D) Wide field images of HEK293 cells coexpressing HA-V2R and Flag-AC9, after treatment with 10 µm arginine vasopressin (AVP) or control for 30 min. Scale bar is 16 µm. (E) Wide field images of HEK293 cells coexpressing HA-MOR and Flag-AC9, after treatment with 10 µm [D-Ala2, N-MePhe4, Gly-ol]-enkephalin (DAMGO) or control for 30 min. Scale bar is 16 µm. (F) Wide field images of HEK293 cells coexpressing HA-V2R-trunc and Flag-AC9, after treatment with 10 µm arginine vasopressin (AVP) or control for 30 min. Scale bar is 16 µm.
Figure 4 with 3 supplements
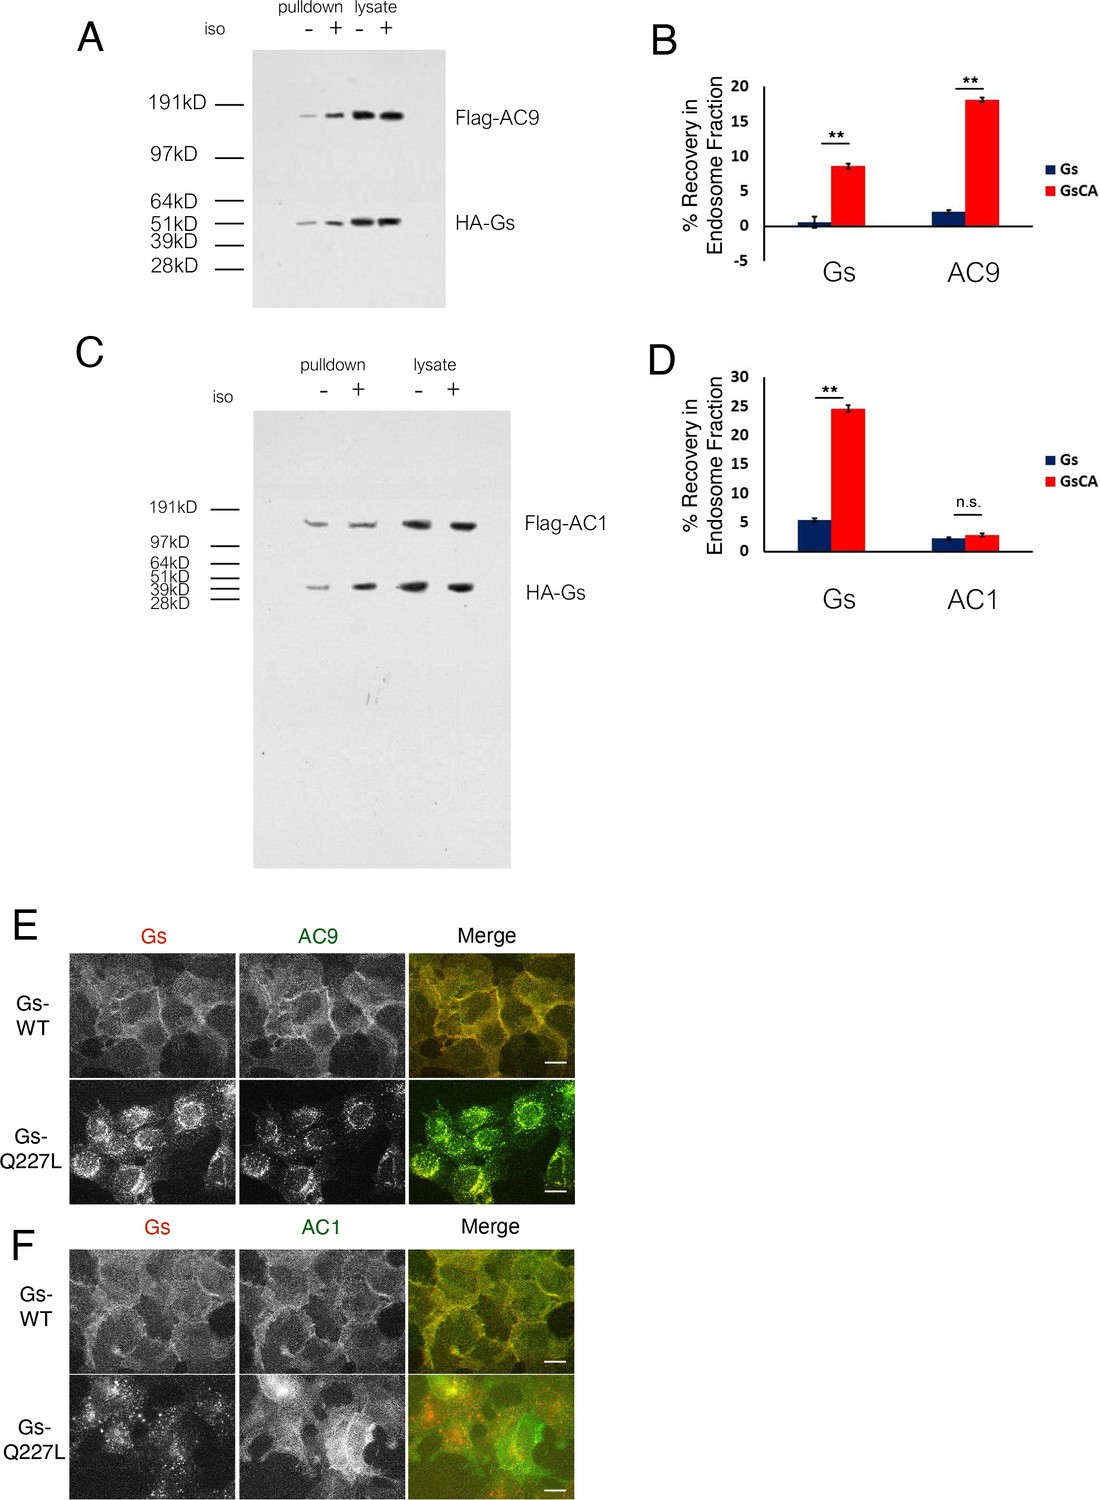
Gs activation is sufficient to promote AC9 internalization.
(A) Representative confocal imaging of HEK293 cells cells coexpressing Flag-AC9, Gsβ, Gsγ and either HA-Gsα (HA-Gs) or HA-Gsα-CA (HA-GsCA). (B) Representative confocal imaging of HEK293 cells coexpressing Flag-AC1, Gsβ, Gsγ and either HA-Gsα (HA-Gs) or HA-Gsα-CA (HA-GsCA). (C) Quantification of internal puncta that are Gs or AC1/9 positive, taken from wide field images (see Figure 4—figure supplement 2C and D) [mean ± SEM; n = 3 experiments, 10 visual fields and 200+ cells per condition]. **p<0.01 by two-tailed t-test. (D) Quantification of cells with >10 internal puncta that are Gs or AC1/9 positive, taken from wide field images (see Figure 4—figure supplement 2C and D) [mean ± SEM; n = 3 experiments, 10 visual fields and 200+ cells per condition]. **p<0.01 by two-tailed t-test. (E) Representative western blot of an EEA1+ fraction from HEK293 cells coexpressing Flag-AC9 and HA-Gs (lanes 1 and 3) or Flag-AC9 and HA-GsCA (lanes 2 and 4) and after treatment with 10 µM isoproterenol (lanes 1–2) or control (lanes 3–4) for 30 min. (F) Quantification of the fraction of Flag-AC9 and HA-Gs/HA-GsCA recovered in the EEA1+ fraction (E) relative to total cell lysate. [mean ± SEM; n = 3 experiments] *p<0.05 **p<0.01 by two-tailed t-test.
Figure 4—figure supplement 1
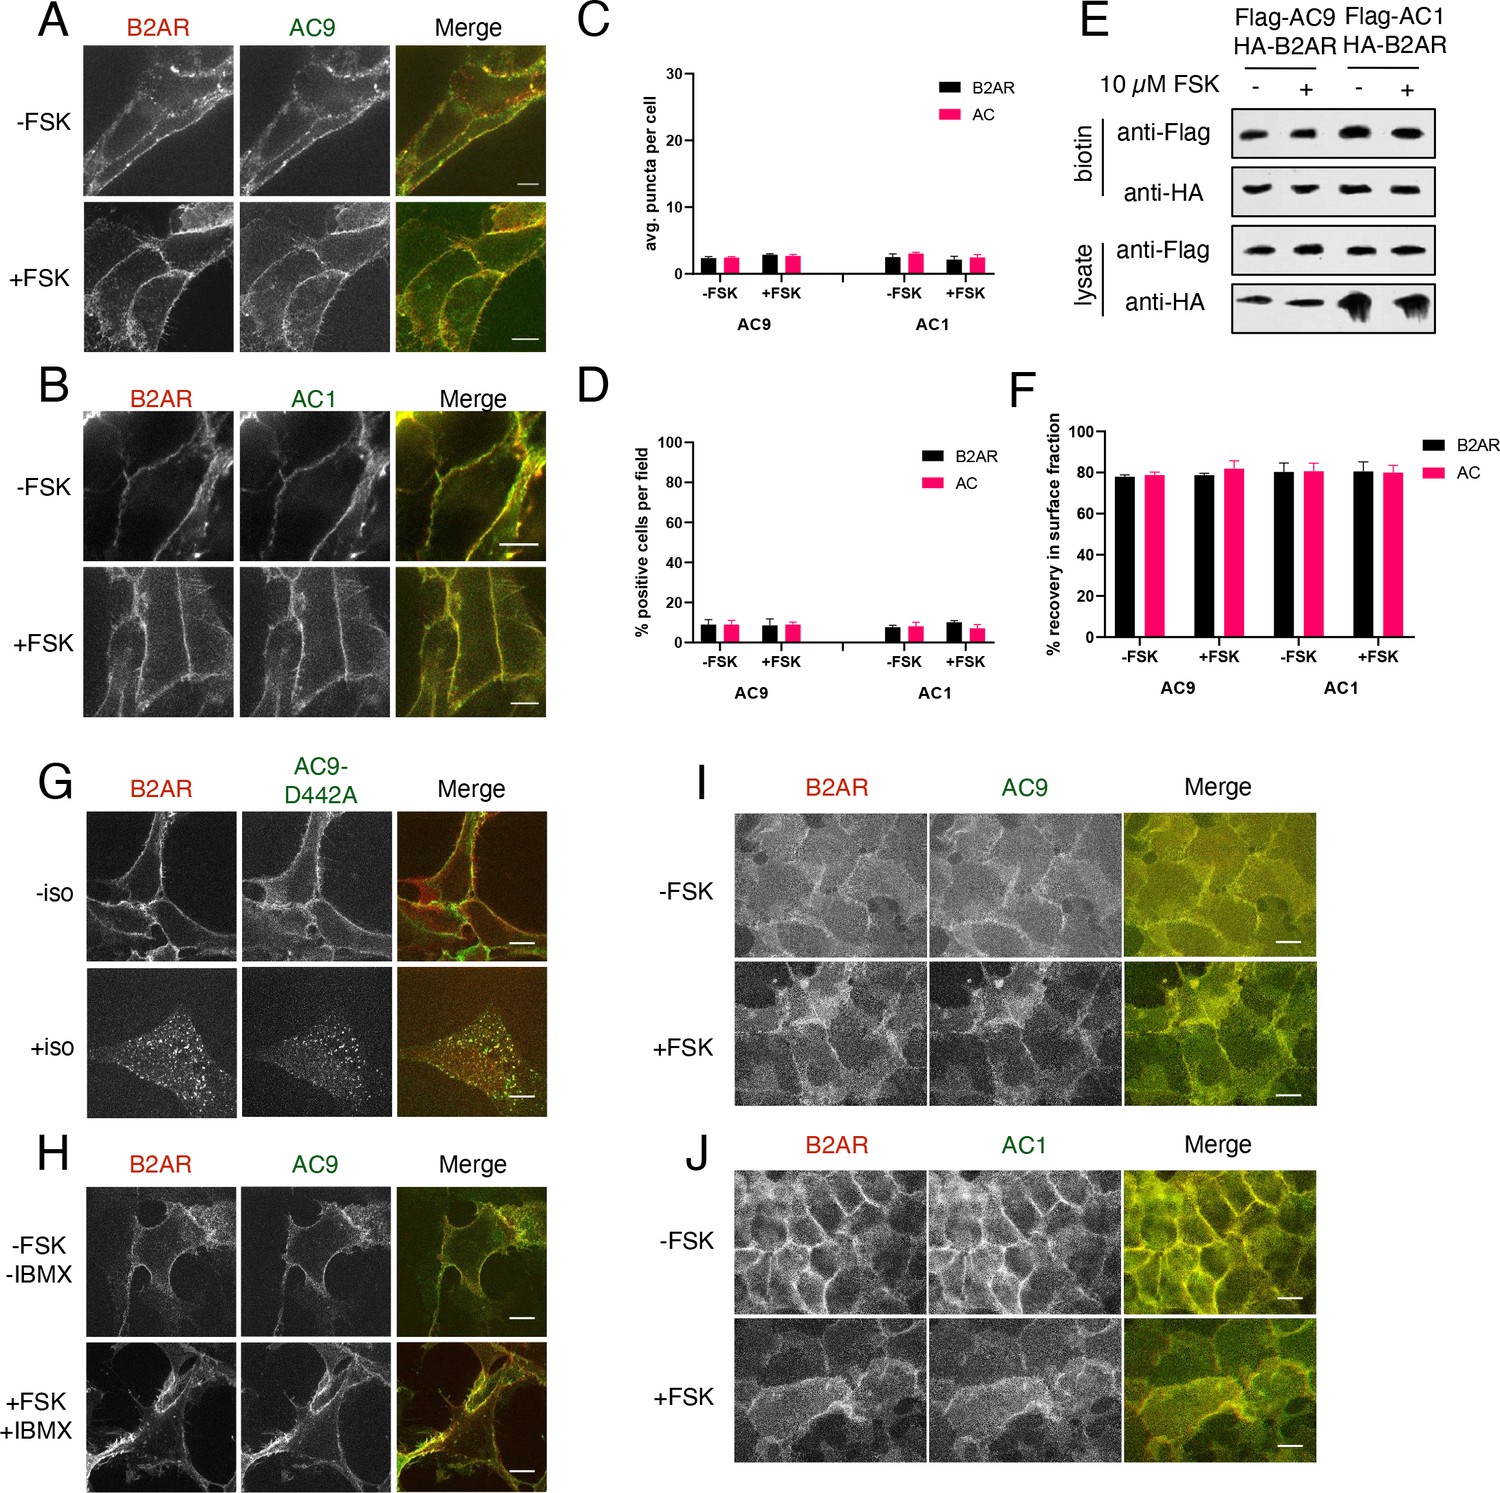
Confirmation that forskolin does not promote AC9 trafficking.
(A) Representative confocal imaging of HEK293 cells coexpressing HA-β2AR and Flag-AC9 were treated with 10 µM FSK or control for 30 min. Scale Bar is 5 µm. (B) Representative confocal imaging of HEK293 cells coexpressing HA-β2AR and Flag-AC1 were treated with 10 µM FSK or control for 30 min. Scale Bar is 5 µm. (C) Quantification of internal puncta that are β2AR or AC1/9 positive, taken from wide field images (see: Figure 4—figure supplement 2E and F [mean ± SEM; n = 3 experiments, 10 visual fields and 200+ cells per condition]. **p<0.01 by two-tailed t-test. (D) Quantification of cells with >10 internal puncta that are β2AR or AC1/9 positive, taken from wide field images (see: Figure 4—figure supplement 2E and F) [mean ± SEM; n = 3 experiments, 10 visual fields and 200+ cells per condition]. **p<0.01 by two-tailed t-test. (E) Representative western blot of the surface biotinylated fraction of cells from (A,C). (F) Quantification of the percent loss from the surface biotinylated fraction relative to the total cell lysate as seen in (E) [mean ± SEM; n = 5 experiments]. (G) Representative confocal images of HEK293 cells coexpressing HA-β2AR and the catalytic inactive mutant Flag-AC9-D442A were treated with 10 µM isoproterenol or control for 30 min. Scale Bar is 5 µm. (H) Representative confocal images of HEK293 cells coexpressing HA-β2AR and Flag-AC9 were treated with 10 µM FSK and 10 µM IBMX or control for 30 min. Scale Bar is 5 µm. (I) Representative wide-field images of HEK293 cells coexpressing HA-β2AR and Flag-AC9 which were treated with 10 µM FSK or control for 30 min. Scale Bar is 16 µm. (J) Representative wide-field images of HEK293 cells coexpressing HA-β2AR and Flag-AC1 which were treated with 10 µM FSK or control for 30 min. Scale Bar is 16 µm.
Figure 4—figure supplement 2
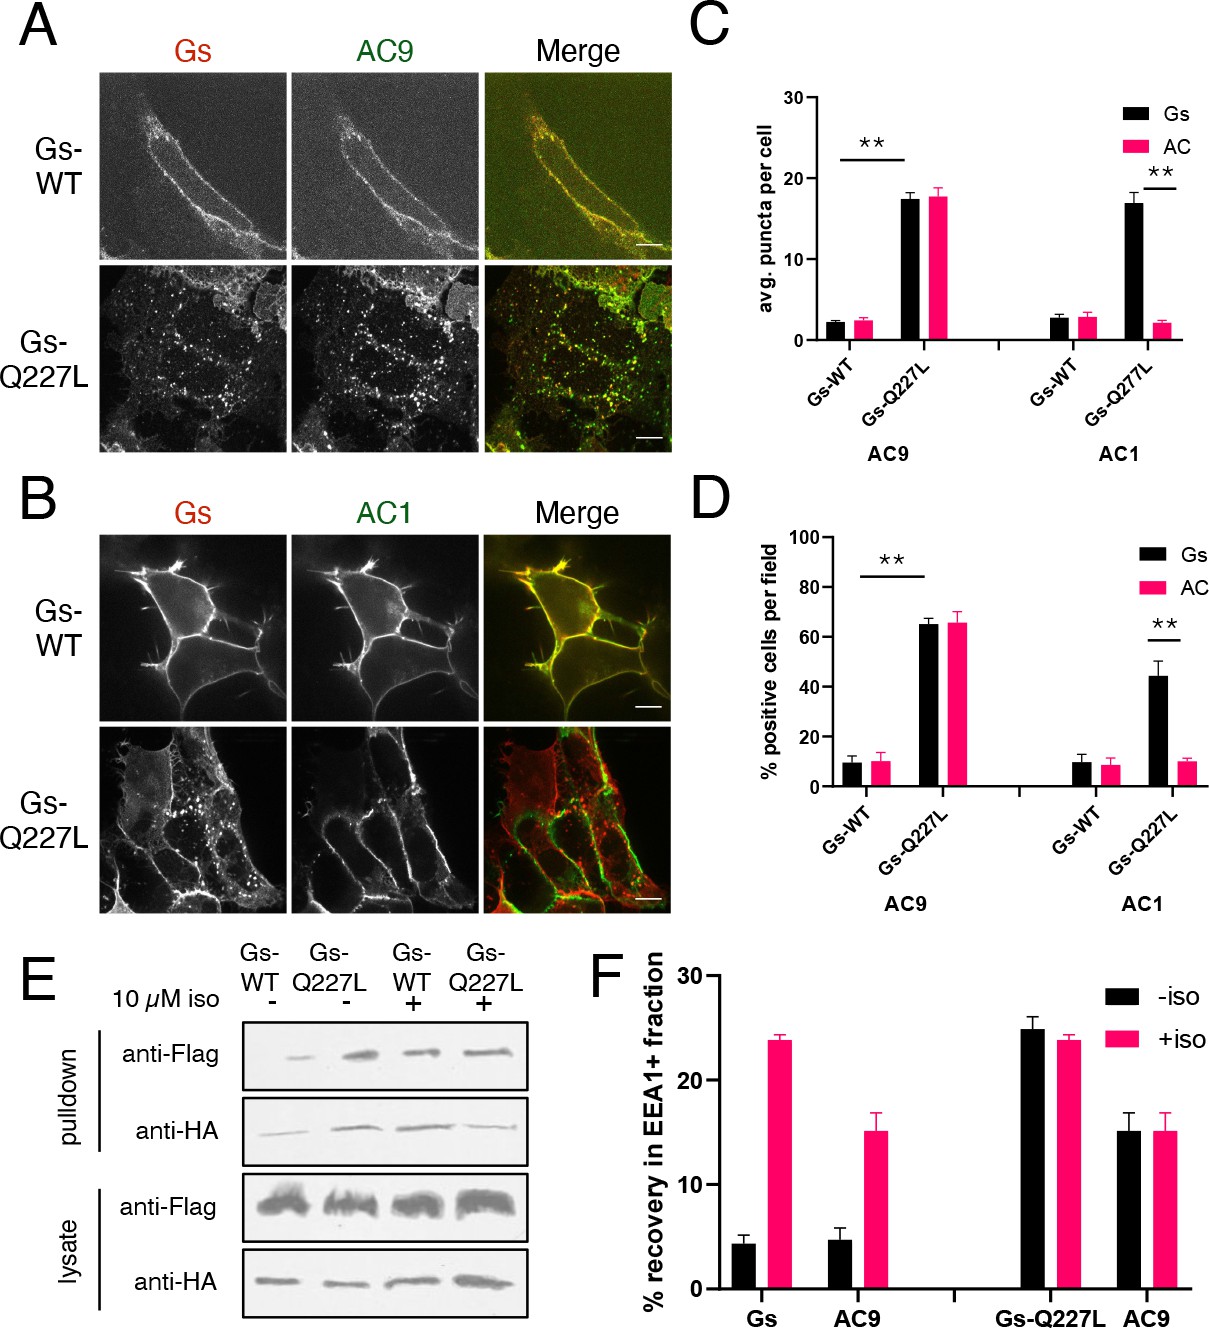
Gs accumulation in endosomes and verification that mutational activation of Gs is sufficient to stimulate AC9 trafficking.
(A) Representative western blot of an EEA1 positive endosome fraction from HEK293 cells coexpressing Flag-AC9, Gsβ, Gsγ and HA-Gs (lane 1) or HA-GsCA (lane 2). (B) Quantification of endosome enrichment of Flag-AC9 and HA-Gs or HA-GsCA as seen in (A) by normalizing to the EEA1 signal. [mean ± SEM; n = 5 experiments] **p<0.01 by two-tailed t-test. (C) Representative western blot of an EEA1 positive endosome fraction from HEK293 cells coexpressing Flag-AC1, Gsβ, Gsγ and HA-Gs (Gs, lane 1) or HA-Gs-Q227L (GsCA, lane 2). (D) Quantification of endosome enrichment of Flag-AC1 and HA-Gs or HA-GsCA as seen in (B) by normalizing to the EEA1 signal. [mean ± SEM; n = 5 experiments] **p<0.01 by two-tailed t-test. (E) Representative wide-field images of HEK293 cells coexpressing HA-Gs (wild type) or HA-Gs-Q227L and Flag-AC9. Scale Bar is 16 µm. (F) Representative wide-field images of HEK293 cells coexpressing HA-Gs (wild type) or HA-Gs-Q227L and Flag-AC1. Scale Bar is 16 µm.
Figure 4—figure supplement 3
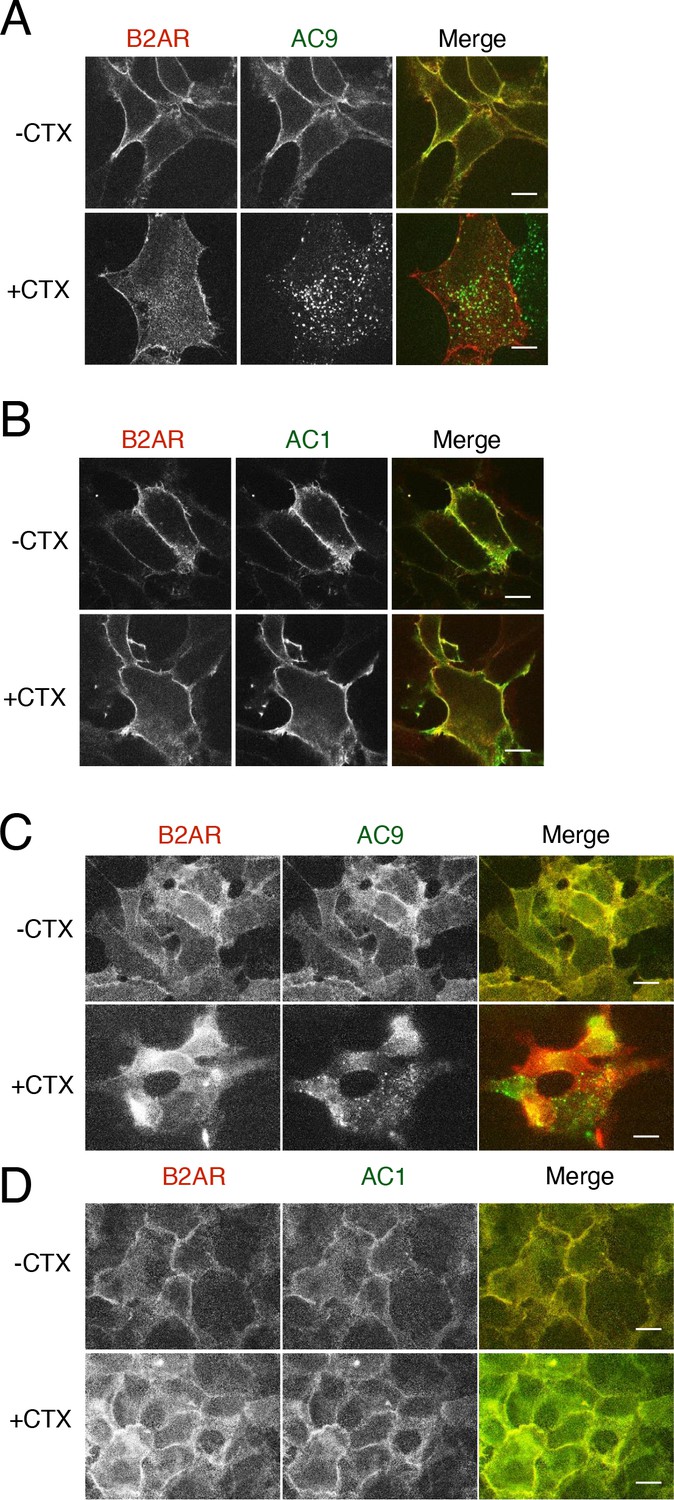
Effect of cholera toxin on AC9 trafficking.
(A) Representative confocal images of HEK293 cells coexpressing HA-β2AR and Flag-AC9 were treated with 100 nM cholera toxin overnight. Scale Bar is 8 µm. (B) Representative confocal images of HEK293 cells coexpressing HA-β2AR and Flag-AC1 were treated with 100 nM cholera toxin overnight. (C) Representative wide-field images of HEK293 cells coexpressing HA-β2AR and Flag-AC9 were treated with 100 nM cholera toxin overnight. Scale Bar is 8 µm. (D) Representative wide-field images of HEK293 cells coexpressing HA-β2AR and Flag-AC1 were treated with 100 nM cholera toxin overnight.
Figure 5 with 1 supplement
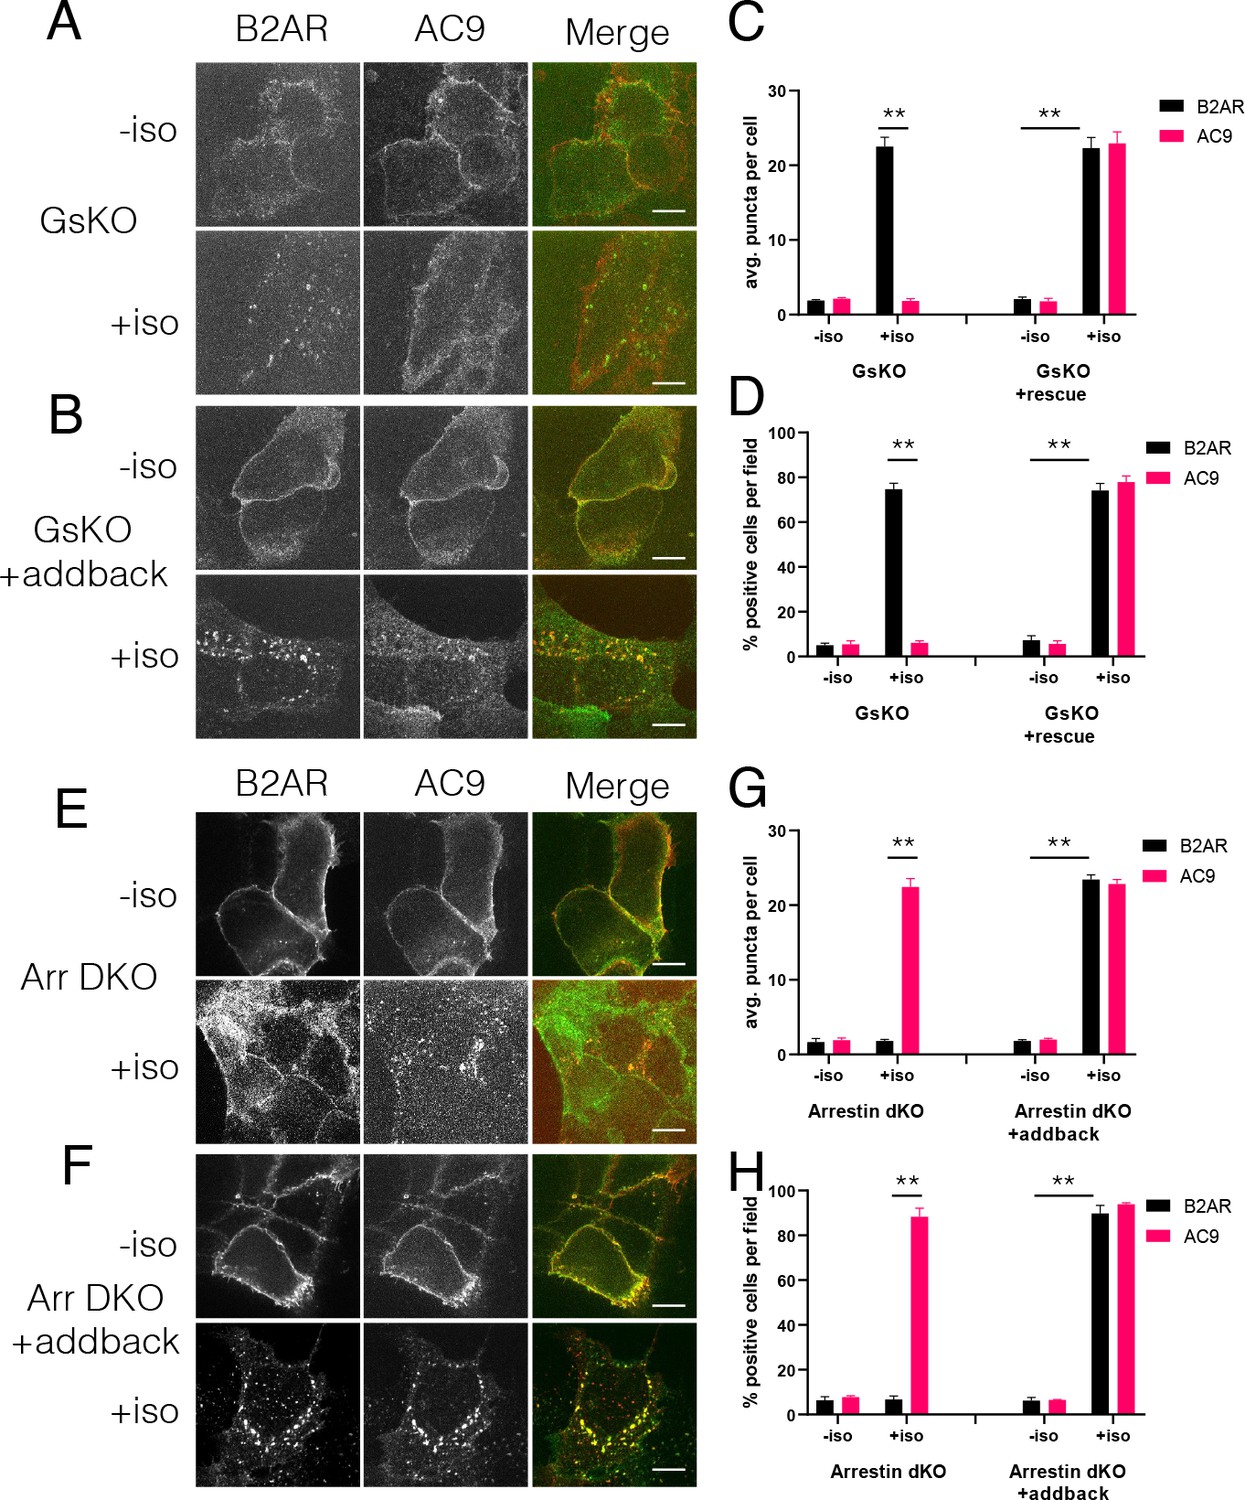
Regulation of AC9 internalization requires Gs but not beta-arrestin.
(A–B) Representative confocal imaging of Gs-knockout (GsKO) HEK293 cells coexpressing Flag-β2AR, AC9-EGFP, and either pcDNA3 (A) or wild-type HA-Gs rescue (B). (C–D) Representative confocal imaging of Arrestin2/3 (β-arrestin −1 and 2) double knockout (Arr DKO) cells coexpressing Flag-β2AR, AC9-EGFP, and either pcDNA3 (C) or HA-Arrestin three rescue (D). (E) Quantification of internal puncta that are β2AR or AC9 positive, taken from wide field images (see Figure 5—figure supplement 1A and B) [mean ± SEM; n = 3 experiments, 10 visual fields and 200+ cells per condition]. **p<0.01 by two-tailed t-test. (F) Quantification of cells with >10 internal puncta that are β2AR or AC9 positive, taken from wide field images (see Figure 5—figure supplement 1A and B) [mean ± SEM; n = 3 experiments, 10 visual fields and 200+ cells per condition]. **p<0.01 by two-tailed t-test. (G) Quantification of internal puncta that are β2AR or AC9 positive, taken from wide field images (see Figure 5—figure supplement 1C and D) [mean ± SEM; n = 3 experiments, 10 visual fields and 200+ cells per condition]. **p<0.01 by two-tailed t-test. (H) Quantification of cells with >10 internal puncta that are Gs or AC1/9 positive, taken from wide field images (see Figure 5—figure supplement 1C and D) [mean ± SEM; n = 3 experiments, 10 visual fields and 200+ cells per condition]. **p<0.01 by two-tailed t-test.
Figure 5—figure supplement 1
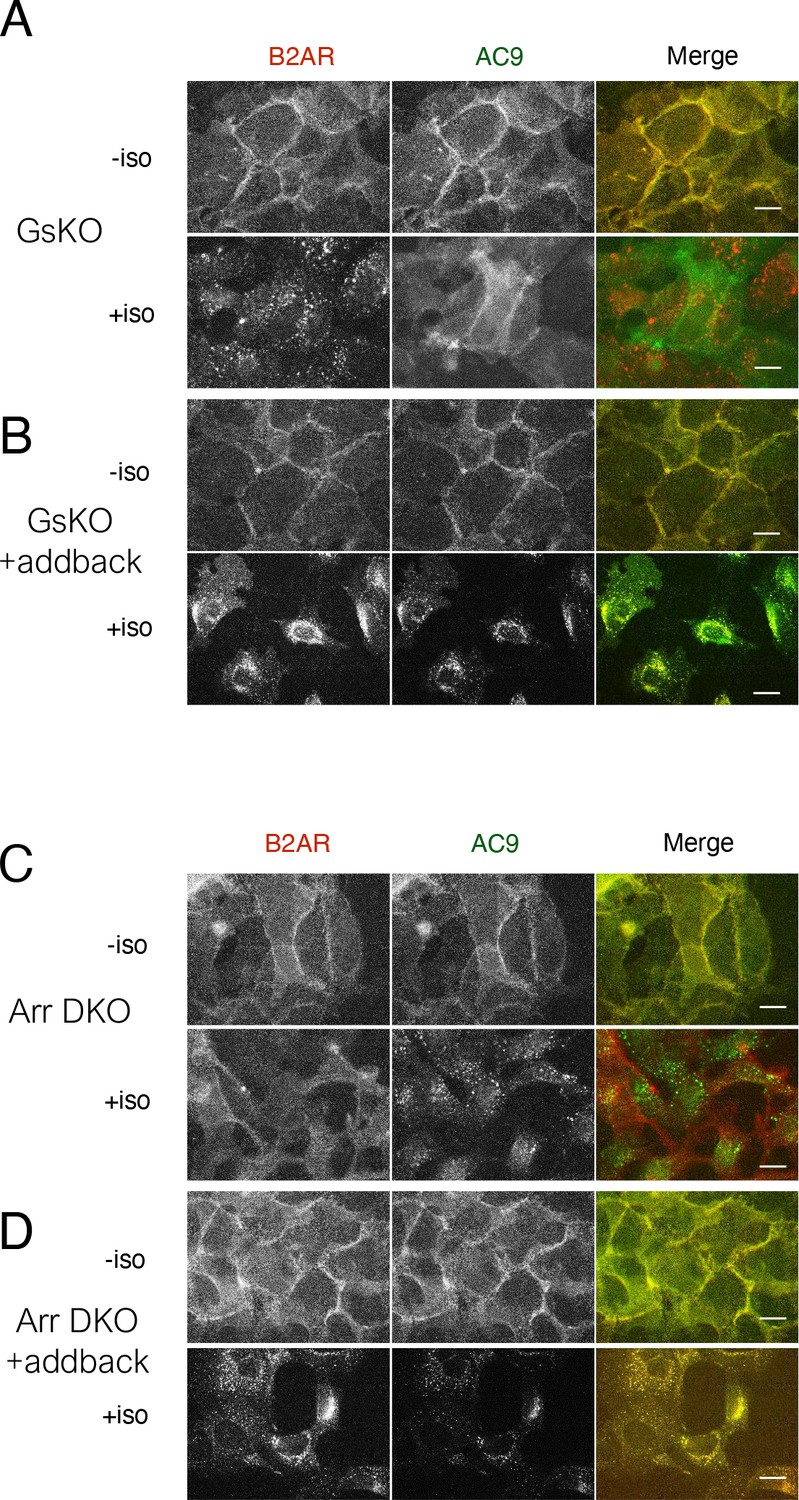
Wide field images supporting distinct trafficking effects of Gs KO and Arr DKO.
(A) Representative wide-field images of Gs-knockout HEK293 cells coexpressing HA-β2AR and Flag-AC9 were treated with 10 µM isoproterenol for 30 min. Scale Bar is 16 µm. (B) Representative wide-field images of Gs-knockout HEK293 cells coexpressing Gs (wild type) HA-β2AR and Flag-AC9 were treated with 10 µM isoproterenol for 30 min. Scale Bar is 16 µm. (C) Representative wide-field images of Arrestin 2/3 double knockout HEK293 cells coexpressing HA-β2AR and Flag-AC9 were treated with 10 µM isoproterenol for 30 min. Scale Bar is 16 µm. (D) Representative wide-field images of Arrestin 2/3 double knockout HEK293 cells coexpressing Arrestin 2, HA-β2AR and Flag-AC9 were treated with 10 µM isoproterenol for 30 min. Scale Bar is 16 µm.
Figure 6 with 1 supplement

AC9 selectively contributes to the β2AR-mediated cAMP response from endosomes.
(A) Recruitment of conformational biosensors to β2AR-containing endosomes is reversed by application of the membrane permeable antagonist alprenolol for 20 min. Scale Bar is 8 µm. See Video 2 for full image series. (B) Recruitment of conformational biosensors to β2AR-containing endosomes is unaffected by application of the membrane impermeable antagonist CGP12177 for 20 min. Scale Bar is 8 µm. See Video 3 for full image series. (C) Quantification of the maximum cAMP response in control and in AC9 siRNA knockdown HEK293 cells pretreated with 100 nM isoproterenol and exposed to supersaturating conditions of membrane permeable antagonist (10 µM alprenolol) or membrane impermeable antagonist (10 µM CGP12177). [mean ± SEM; n = 4 experiments] (D) Quantification of the maximum cAMP response in control in AC1 siRNA knockdown HEK293 cells pretreated with 100 nM isoproterenol and exposed to supersaturating conditions of membrane permeable antagonist (10 µM alprenolol) or membrane impermeable antagonist (10 µM CGP12177). [mean ± SEM; n = 4 experiments] (E) Quantification of the maximum cAMP response in AC3/6KO HEK293 cells due to AC9 overexpression as the delta between the Flag-AC9 and pcDNA3 conditions. Cells were pretreated with 100 nM isoproterenol and exposed to supersaturating conditions of membrane permeable antagonist (10 µM alprenolol) or membrane impermeable antagonist (10 µM CGP12177). [mean ± SEM; n = 4 experiments] (F) Quantification of the maximum cAMP response in AC3/6KO HEK293 cells due to AC1 overexpression as the delta between the Flag-AC1 and pcDNA3 conditions. Cells were pretreated with 100 nM isoproterenol and exposed to supersaturating conditions of membrane permeable antagonist (10 µM alprenolol) or membrane impermeable antagonist (10 µM CGP12177). [mean ± SEM; n = 4 experiments] (G) Model: Ligand binding causes initial signaling event at the PM followed by arrestin-dependent endocytosis of β2AR. AC1 is restricted to the PM but AC9 is dynamically redistributed by a distinct Gs regulated process, and contributes to the β2AR-mediated cAMP response from the endosome.
Figure 6—figure supplement 1
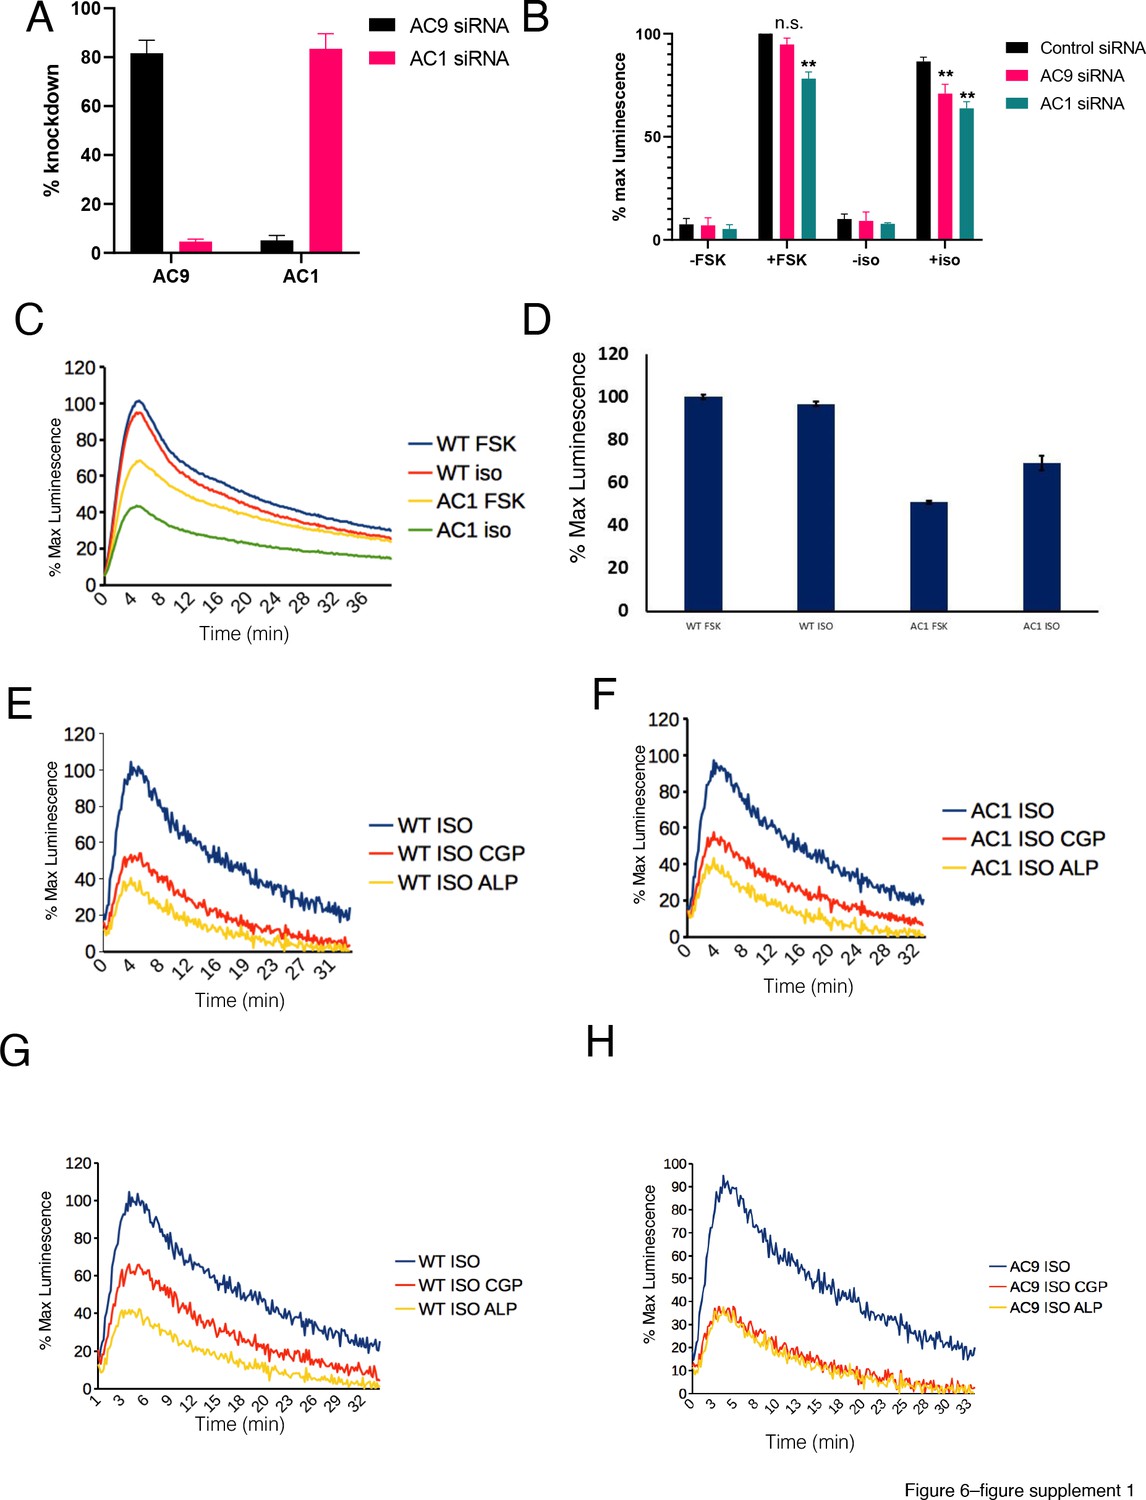
Verification that AC9 selectively contributes to cAMP production stimulated by endogenous receptor activation in endosomes.
(A) Percent knockdown of AC9 and AC1 in HEK293 cells as determined by qPCR. [mean ± SEM; n = 3 experiments] (B) Effect of siRNA knockdown of AC9 and AC1 expression in HEK293 cells on the cAMP response to 10 µM FSK and 10 µM isoproterenol stimulation [mean ± SEM; n = 4 experiments] *p<0.05 by two-tailed t-test. (C) Representative cAMP response to 10 µM FSK or 10 µM isoproterenol under conditions of siRNA knockdown of AC1 expression or control (ASD). (D) Quantification of the maximum cAMP response as seen in (C) [mean ± SEM; n = 3 experiments]. (E) Representative normalized β2AR-mediated cAMP response in control HEK293 cells pretreated with 100 nM isoproterenol and exposed to supersaturating antagonist conditions (10 µM CGP12177, 10 µM alprenolol). (F) Representative normalized β2AR-mediated cAMP response in AC1 knockdown HEK293 cells pretreated with 100 nM isoproterenol and exposed to supersaturating antagonist conditions (10 µM CGP12177, 10 µM alprenolol). (G) Representative normalized β2AR-mediated cAMP response in control HEK293 cells pretreated with 100 nM isoproterenol and exposed to supersaturating antagonist conditions (10 µM CGP12177, 10 µM alprenolol). (H) Representative normalized β2AR-mediated cAMP response in AC9 knockdown HEK293 cells pretreated with 100 nM isoproterenol and exposed to supersaturating antagonist conditions (10 µM CGP12177, 10 µM alprenolol).
Videos
Video 1
This movie shows a confocal image series of AC9-EGFP overexpressed in a HEK293 cell.
Cell was treated with 10 µM isoproterenol added at t = 0 in the time stamp. AC9 recruitment to internal puncta is observed over the course of 30 min.
Video 2
This movie shows a confocal image series of β2AR (red) and Nb80-EGFP (green) from a HEK293 cell pre-incubated for 20 min with 100 nM isoproterenol.
10 µM alprenolol, added at t = 0 time point indicated in the time stamp, reverses Nb80-EGFP recruitment to β2ARs at both the plasma membrane and endosomes.
Video 3
This movie shows a confocal image series of β2AR (red) and Nb80-EGFP (green) from a HEK293 cell pre-incubated for 20 min with 100 nM isoproterenol.
10 µM CGP12177, added at t = 0 indicated in the time stamp, reverses Nb80-EGFP recruitment to β2ARs at the plasma membrane but not at endosomes.
Video 4
This movie shows an image series of the luminescence-based cAMP biosensor from HEK293 cells that have been treated with control siRNA (columns 1 and 2) or AC9 siRNA (columns 3 and 4).
Cells were preincubated with 100 nM isoproterenol for 20 min prior to imaging, and 10 µM CGP12177 or 10 µM alprenolol were added immediately before imaging, where indicated.
Tables
Key resources table
| Reagent type (species) or resource | Designation | Source or reference | Identifiers | Additional information |
|---|---|---|---|---|
| Cell line (Homo sapiens) | HEK293 | ATCC | CRL-1573; RRID:CVCL_0045 | Human embryonic kidney (female) |
| Cell line (Homo sapiens) | GNAS-knockout | Stallaert et al., 2017 | HEK293 parental | |
| Cell line (Homo sapiens) | Arrestin 2 and 3 double knockout | O'Hayre et al., 2017 | HEK293 parental | |
| Cell line (Homo sapiens) | ADCY 3 and 6 double knockout | Soto-Velasquez et al., 2018 | HEK293 parental | |
| Biological sample (Homo sapiens) | Human smooth airway muscle cells (HSAMs) | Prepared from lung biopsy (Tsvetanova et al., 2017) | Primary cell culture | |
| Antibody | Mouse anti-FLAG (M1) | Sigma-Aldrich | F-3040; RRID:AB_439712 | (1:1000) |
| Antibody | Rabbit anti-Flag | Sigma-Aldrich | F7425; RRID:AB_439687 | (1:1000) |
| Antibody | Mouse anti-HA | Biolegend | 16B12; RRID:AB_2820200 | (1:1000) |
| Antibody | Goat anti-AC9 | Santa Cruz Biotech | sc-8576; RRID:AB_2223286 | (1:50) |
| Antibody | Mouse anti-EEA1 | Fisher Scientific | 610457; RRID:AB_397830 | (1:1000) |
| Antibody | Mouse anti-Golgin-97 | Thermo | A-21270; RRID:AB_221447 | (1:1000) |
| Antibody | Rabbit anti-calnexin | Cell Signaling | 2679P; RRID:AB_2228381 | (1:1000) |
| Antibody | Mouse anti-Sodium/Potassium ATPase | Novus Biologicals | NB300-540SS; RRID:AB_306023 | (1:1000) |
| Recombinant DNA reagent (human) | Flag-AC9 (plasmid) | Paterson et al., 2000 | pcDNA3 backbone | |
| Recombinant DNA reagent (human) | Flag-AC1 | Chen et al., 1997 | pcDNA3 backbone | |
| Recombinant DNA reagent (human) | Flag-AC9-D442A | This study | pcDNA3 backbone | |
| Recombinant DNA reagent (human) | AC9-EGFP | This study | EGFP-C1 backbone | |
| Recombinant DNA reagent (human) | HA-B2AR | von Zastrow and Kobilka, 1992 | pcDNA3 backbone | |
| Recombinant DNA reagent (human) | HA-V2R | Rochdi et al., 2010 | pcDNA3 backbone | |
| Recombinant DNA reagent (mouse) | HA-MOR | Whistler and von Zastrow, 1998 | pcDNA3 backbone | |
| Recombinant DNA reagent (human) | HA-V2R-T | Rochdi et al., 2010 | pcDNA3 backbone | |
| Recombinant DNA reagent | Nb80-EGFP | Irannejad et al., 2013 | EGFP-C1 backbone | |
| Recombinant DNA reagent (human) | HA-G(alpha)s | Irannejad et al., 2013 | pcDNA3 backbone | |
| Recombinant DNA reagent (human) | G(beta-1) | Irannejad et al., 2013 | pcDNA3 backbone | |
| Recombinant DNA reagent (human) | G(gamma-2) | Irannejad et al., 2013 | pcDNA3 backbone | |
| Recombinant DNA reagent (human) | HA-G(alpha)s-Q227L | Masters et al., 1989 | pcDNA3 backbone | |
| Recombinant DNA reagent | pGloSensor-20F | Promega | E1171 | |
| Transfected construct (human) | AC9-siRNA | This study | See Materials and methods for sequence | |
| Transfected construct (human) | AC1 siRNA | This study | See Materials and methods for sequence | |
| Chemical compound, drug | Isoprenaline (iso) | Sigma-Aldrich | 51-30-9 | |
| Chemical compound, drug | Arginine-vasopressin (AVP) | Sigma-Aldrich | 113-79-1 | |
| Chemical compound, drug | DAMGO, [D-Ala2, N-Me-Phe4, Gly5-ol]-Enkephalin acetate salt | Sigma-Aldrich | E7384 | |
| Chemical compound, drug | DYNGO-4a | Abcam Biochemicals | ab120689 | |
| Chemical compound, drug | Alprenolol | Sigma | 3707-88-5 | |
| Chemical compound, drug | CGP12177 | Tocris | 1134 | |
| Chemical compound, drug | Forskolin | Sigma-Aldrich | 66575-29-9 | |
| Chemical compound, drug | 3-isobutyl-1-methylxanthine (IBMX) | Sigma-Aldrich | 28822-58-4 | |
| Chemical compound | D-Luciferin, sodium salt | Gold Biosciences | LUCNA-1G | |
| Chemical compound | Anti-mouse IgG Magnetic microbeads | Miltenyi | 130-047-101 | |
| Chemical compound | EZ-link Sulfo-NHS-biotin | Pierce | 21425 | |
| Commercial assay or kit | Alexa Fluor 647 Protein Labeling Kit | Thermo Fisher Scientific | A20173 | |
| Commercial assay or kit | Alexa Fluor 488 Protein Labeling Kit | Thermo Fisher Scientific | A20181 | |
| Commercial assay or kit | Direct cAMP ELISA | Enzo Life Sciences | ADI-900–066 | |
| Software, algorithm | Prism | GraphPad | 8.1.1 | |
| Software, algorithm | ImageJ | Imagej.net | 2.0.0-rc-69/1.52 p | |
| Software, algorithm | MATLAB | MathWorks | R2014b |
Additional files
Download links
A two-part list of links to download the article, or parts of the article, in various formats.
Downloads (link to download the article as PDF)
Open citations (links to open the citations from this article in various online reference manager services)
Cite this article (links to download the citations from this article in formats compatible with various reference manager tools)
G protein-regulated endocytic trafficking of adenylyl cyclase type 9
eLife 9:e58039.
https://doi.org/10.7554/eLife.58039


