Vibrio deploys type 2 secreted lipase to esterify cholesterol with host fatty acids and mediate cell egress
- Department of Molecular Biology, University of Texas Southwestern Medical Center, United States
- Howard Hughes Medical Institute, University of Texas Southwestern Medical Center, United States
- Department of Microbiology, University of Texas Southwestern Medical Center, United States
- Department of Physiology, University of Texas Southwestern Medical Center, United States
- Department of Internal Medicine, University of Texas Southwestern Medical Center, United States
- Center for Human Nutrition, University of Texas Southwestern Medical Center, United States
- Faculty of Agriculture and Biology, Warsaw University of Life Sciences, Poland
- Department of Molecular Genetics, University of Texas Southwestern Medical Center, United States
Figures
Figure 1 with 2 supplements
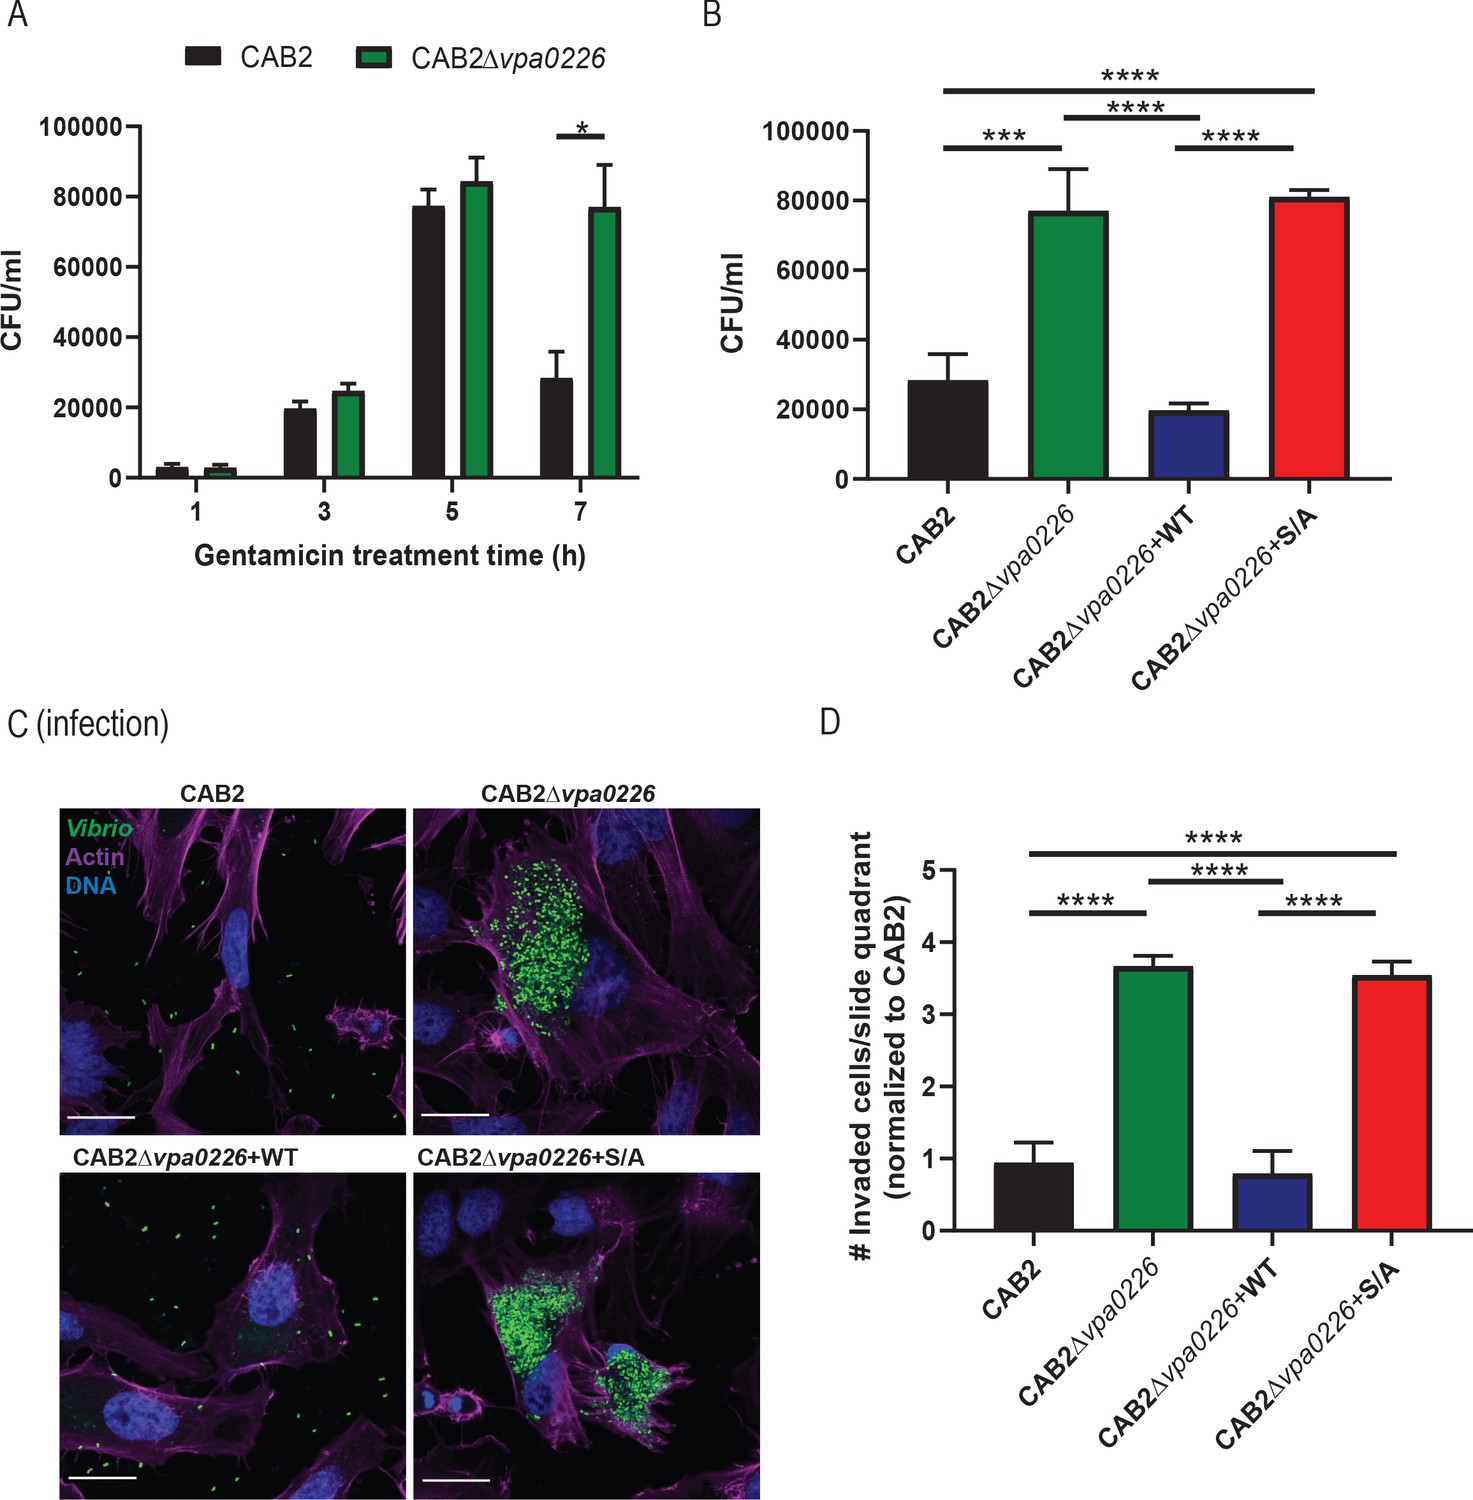
VPA0226 mediates bacterial egress from the host cell.
(A) HeLa cells were infected with CAB2 or CAB2Δvpa0226 for 1, 3, 5, and 7 hr PGT. Host cell lysates were serially diluted and plated onto MMM agar plates for intracellular bacterial colony counting (CFU/mL). Numbers are expressed as an average of three technical replicates for one of three independent experiments. Error bars represent standard deviation from the mean. Asterisks represent statistical significance (*=p < 0.05) using two-way ANOVA and Turkey’s multiple comparison test. (B) HeLa cells were infected with CAB2, CAB2Δvpa0226, CAB2Δvpa0226+WT, or CAB2Δvpa0226+S/A for 7 hr PGT. Host cell lysates were serially diluted and plated onto MMM agar plates for intracellular bacterial colony counting (CFU/mL). Numbers are expressed as an average of three technical replicates for one out of three independent experiments. Error bars represent standard deviation from the mean. Asterisks represent statistical significance (***=p < 0.001, ****=p < 0.0001) using one-way ANOVA and Turkey’s multiple comparison test. (C) Confocal micrographs of HeLa cells infected with GFP-expressing (green) CAB2, CAB2Δvpa0226, CAB2Δvpa0226+WT, or CAB2Δvpa0226+S/A for 7 hr PGT. Host cell actin was stained with Alexa 680-phalloidin (magenta) and DNA was stained with Hoechst (blue). Scale bars = 25 μm. (D, relative to C) Quantification of HeLa cells containing intracellular bacteria per quadrant of slide. Numbers were normalized to CAB2 and are expressed as an average of three independent experiments. Error bars represent standard deviation from the mean. Asterisks represent statistical significance (****=p < 0.0001) using one-way ANOVA and Turkey’s multiple comparison test.
Figure 1—figure supplement 1

VPA0226 is GCAT lipase that contributes to bacterial cell egress but does not contribute to V. parahaemolyticus’ escape from its containing vacuole.
(A) Sequence alignment between the Salmonella T3SS2 effector SseJ and the V. parahaemolyticus lipase VPA0226. Conserved active sites are boxed in red. (B) Sequence alignment between V. parahaemolyticus’ VPA0226 and bacterial glycerophospholipid acyltransferases (GCAT). Asterisks and yellow columns indicate conserved active sites. (C) HeLa cells were infected with CAB2, CAB2Δvpa0226, CAB2Δvpa0226+WT, or CAB2Δvpa0226+S/A for 7 hr PGT. Cell lysis was assessed by quantification of release of cytosolic lactate dehydrogenase (LDH). Numbers represent the average of nine technical replicates for one out of three independent experiments. Error bars represent standard deviation from the mean. Asterisks represent statistical significance (**=p < 0.01, ***=p < 0.001) using one-way ANOVA and Turkey’s multiple comparison test. (D) HeLa cells were infected with CAB2, CAB2Δvpa0226, CAB2Δvpa0226+WT, or CAB2Δvpa0226+S/A for 2 hr, after which samples were treated with 100 μg/mL gentamicin for 3 hr. Gentamicin was washed away and cells were incubated for additional 3 hr. Host cell supernatants were serially diluted and plated onto MMM agar plates for extracellular bacterial colony counting (CFU/mL). Numbers are expressed as an average of three technical replicates for one out of three independent experiments. Error bars represent standard deviation from the mean. Asterisks represent statistical significance (***=p < 0.001, ****=p < 0.0001) using one-way ANOVA and Turkey’s multiple comparison test. (E) Caco-2 cells were infected with either CAB2, CAB2Δvpa0226, CAB2Δvpa0226+WT or CAB2Δvpa0226+S/A for 1, 3, 5, and 7 hr PGT. Host cell lysates were serially diluted and plated onto MMM agar plates for intracellular bacterial colony counting (CFU/mL). Numbers are expressed as an average of three technical replicates for one of three independent experiments. Error bars represent standard deviation from the mean. Asterisks represent statistical significance (****=p < 0.0001) using 2way ANOVA and Turkey’s multiple comparison test.
Figure 1—figure supplement 2
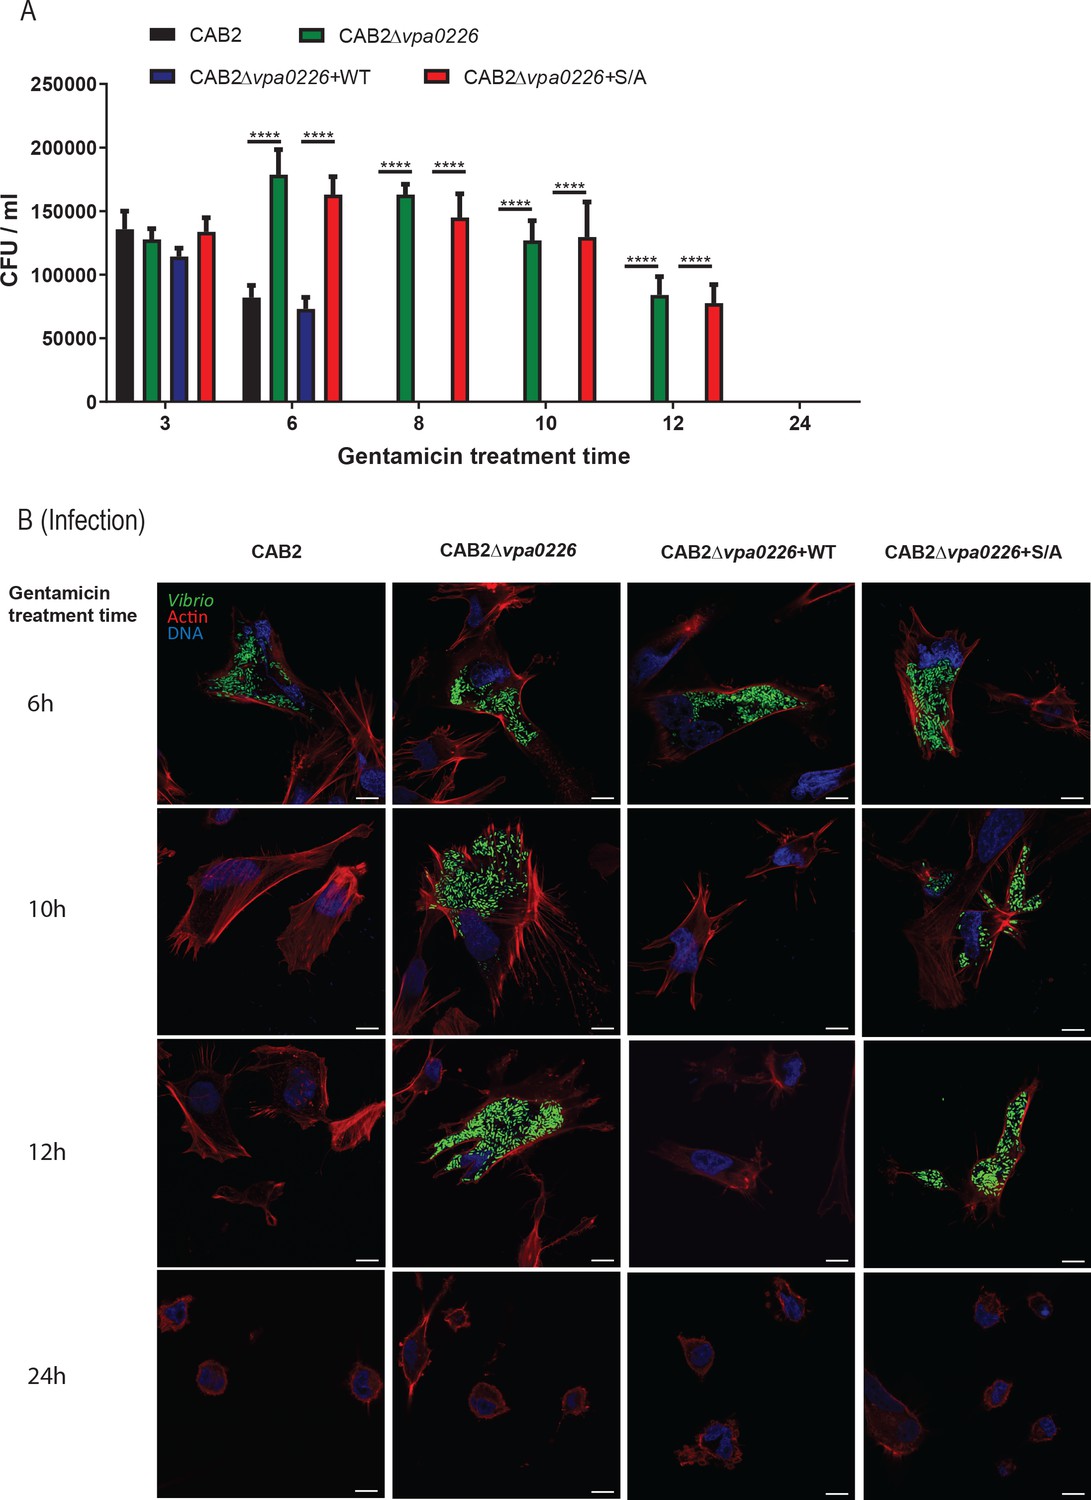
Extended time course for gentamicin protection assay.
(A) HeLa cells were infected with CAB2, CAB2Δvpa0226, CAB2Δvpa0226+WT, or CAB2Δvpa0226+S/A for 2 hr, treated with 100 μg/mL gentamicin for 1 hr followed by treatment with 10 μg/mL gentamicin for the remainder of the infection. Host cell lysates were serially diluted and plated onto MMM agar plates for intracellular bacterial colony counting (CFU/mL). Numbers are expressed as an average of three technical replicates for one of three independent experiments. Error bars represent standard deviation from the mean. Asterisks represent statistical significance (****=p < 0.0001) using two-way ANOVA and Turkey’s multiple comparison test. (B) Confocal micrographs of HeLa cells infected with GFP-expressing (green) CAB2, CAB2Δvpa0226, CAB2Δvpa0226+WT, or CAB2Δvpa0226+S/A in a extended time course gentamicin protection assay as detailed above in (A). Host cell actin was stained with rhodamine phalloidin (red) and DNA was stained with Hoechst (blue). Scale bars = 10 μm.
Figure 2 with 1 supplement
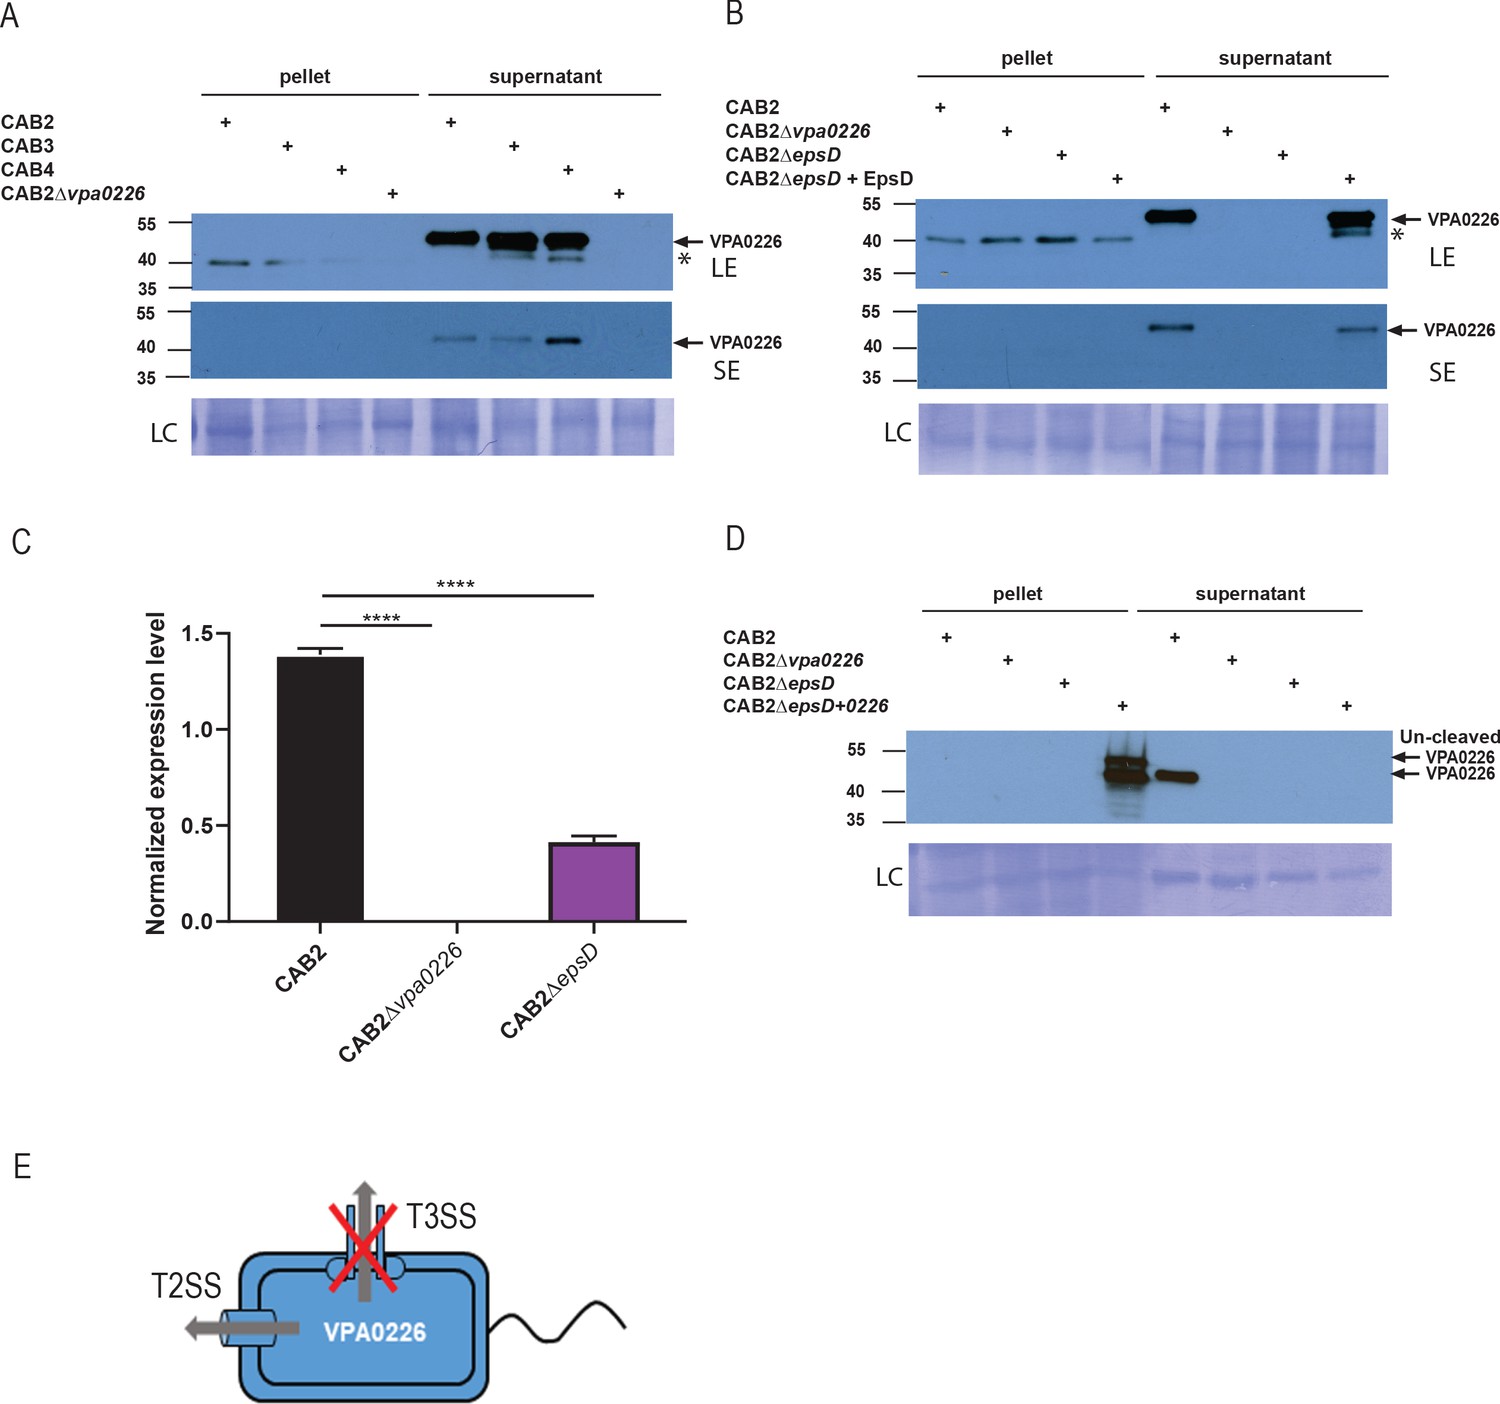
VPA0226 is a T2SS secreted protein.
(A) Expression (pellet) and secretion (supernatant) of VPA0226 from CAB2, CAB3, CAB4 and CAB2Δvpa0226 detected by immunoblotting with anti-VPA0226 antibody. LC: loading control from total bacterial lysate or total secretion media, LE: Long exposure, SE: Short exposure and asterisk represents a variable non-specific band that disappears upon washing and short exposure. (B) Expression (pellet) and secretion (supernatant) of VPA0226 from CAB2, CAB2Δvpa0226, CAB2ΔepsD and CAB2ΔepsD + EpsD detected by immunoblotting with anti-VPA0226 antibody. LC: loading control from total bacterial lysate or total secretion media, LE: Long exposure, SE: Short exposure and asterisk represents a variable non-specific band that disappears upon washing and short exposure. (C) qPCR analysis for relative expression of VPA0226 in CAB2, CAB2Δvpa0226, CAB2ΔepsD. Expression was normalized to the house keeping gene RecA and asterisks represent statistical significance (****=p < 0.0001) using one-way ANOVA and Turkey’s multiple comparison test. (D) Expression (pellet) and secretion (supernatant) of VPA0226 from CAB2, CAB2Δvpa0226, CAB2ΔepsD and CAB2ΔepsD + VPA0226 detected by immunoblotting with anti-VPA0226 antibody. LC: loading control from total bacterial lysate or total secretion media. (E) Schematic of VPA0226 secretion through T2SS and not T3SS2.
Figure 2—figure supplement 1
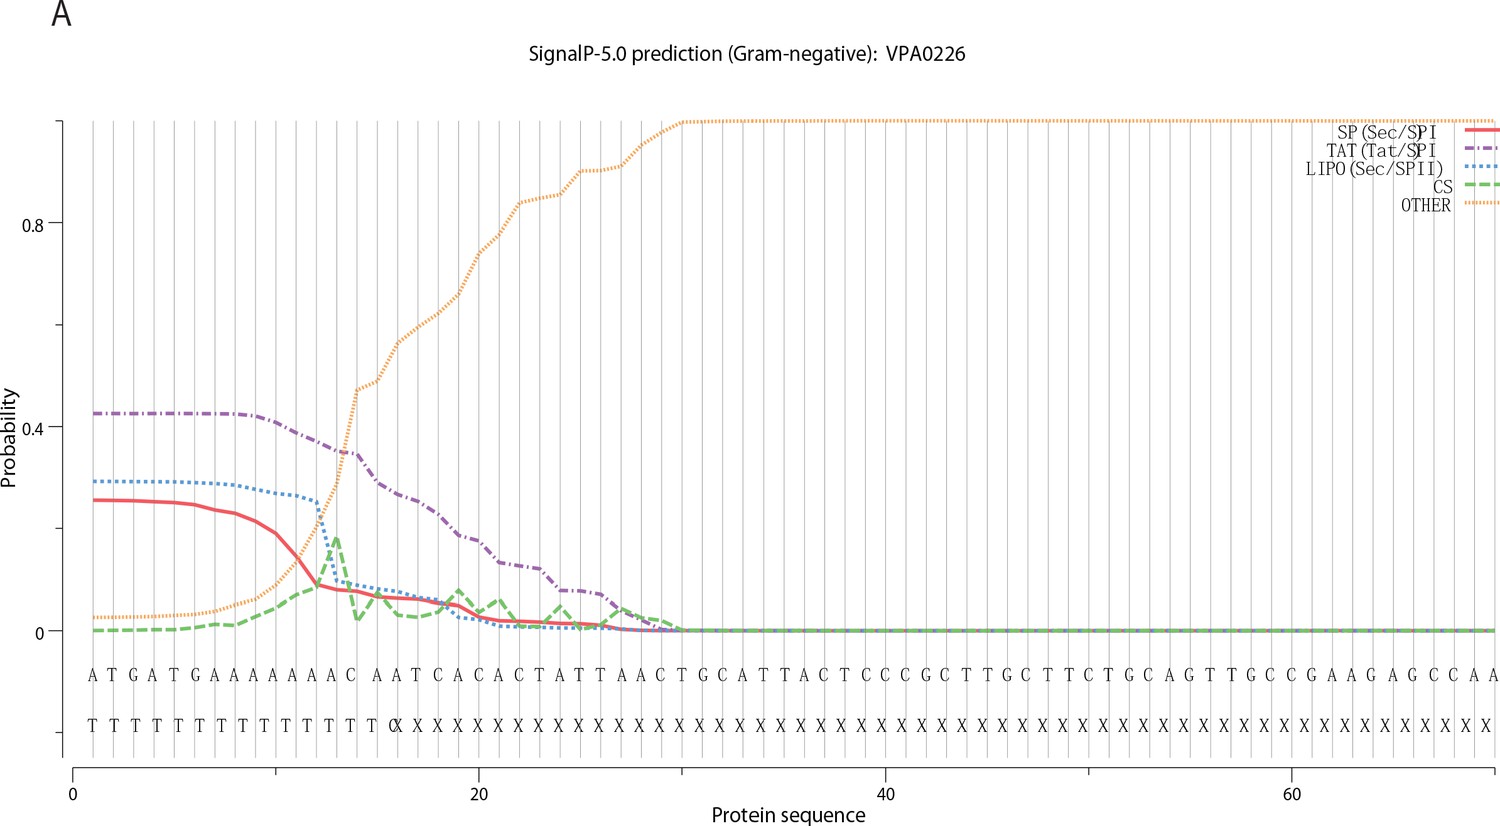
Signal P-5 prediction of VPA0226.
VPA0226 Prediction: Signal peptide (Sec/SPI), (------) denotes the length of the signal peptide). Cleavage site between positions 20 and 21 (-----).
Figure 3 with 2 supplements
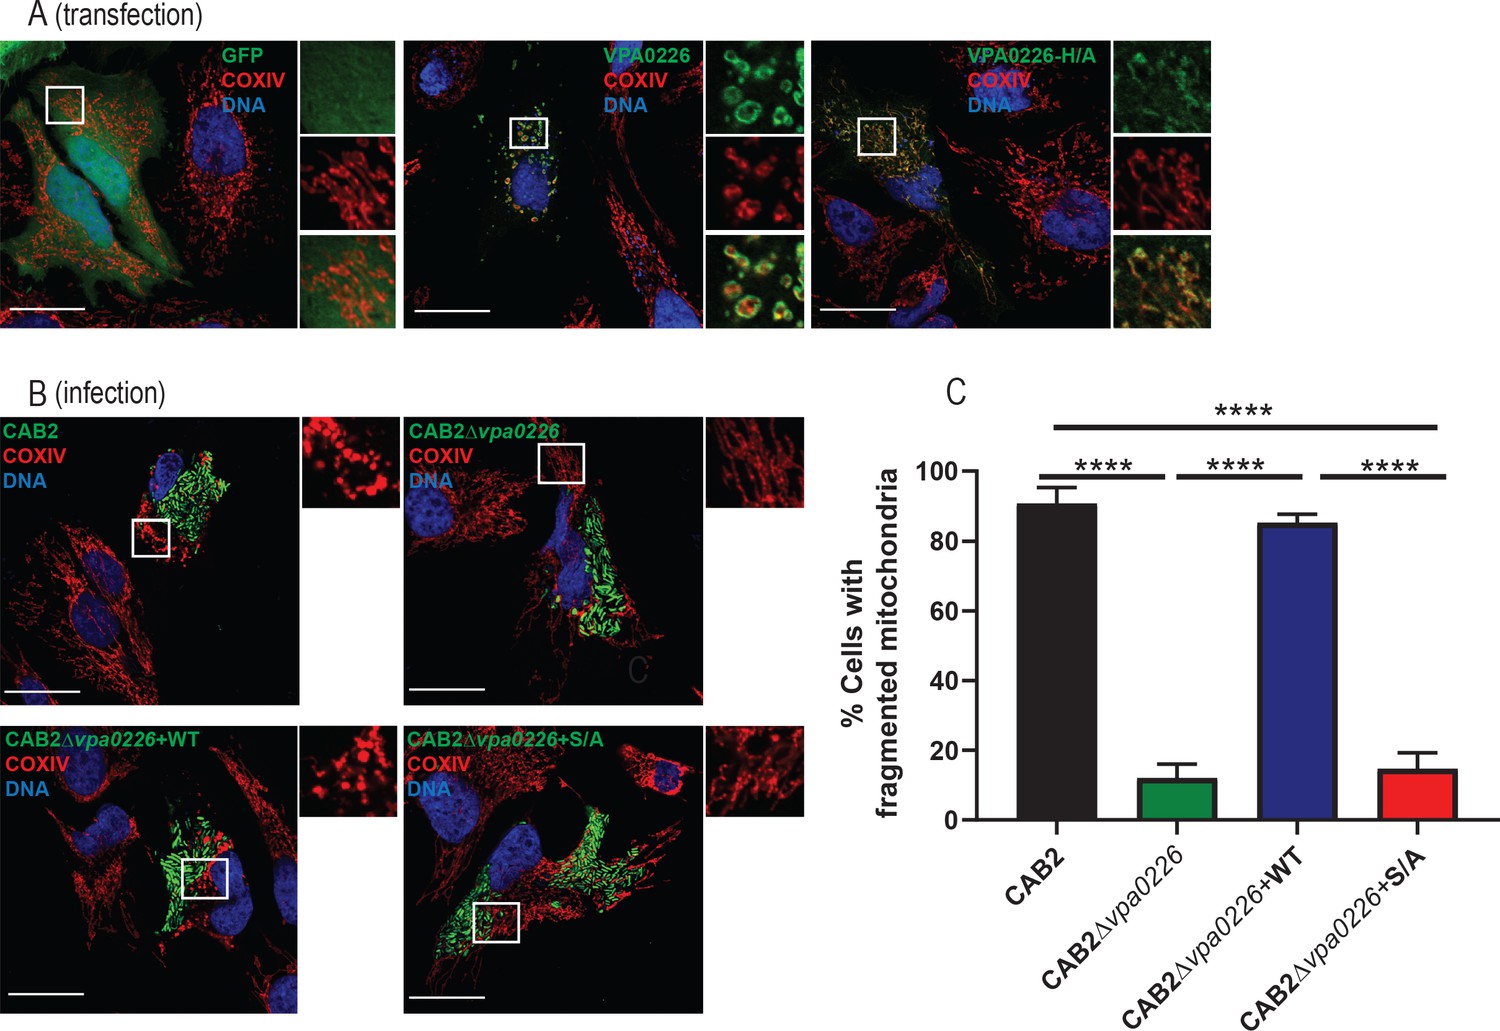
VPA0226 localizes to and fragments mitochondria in the host cell.
(A) Confocal micrographs of HeLa cells transiently transfected with empty vector, VPA0226- or VPA0226-H/A-sfGFPN1 (green) for 14 hr. Mitochondria were stained with anti-COXIV antibody (red) and DNA was stained with Hoechst (blue). Scale bars = 25 μm. White boxes frame magnified areas. (B) Confocal micrographs of HeLa cells infected with GFP-expressing (green) CAB2, CAB2Δvpa0226, CAB2Δvpa0226+WT, or CAB2Δvpa0226+S/A. Mitochondria were stained with anti-COXIV antibody (red) and DNA was stained with Hoechst (blue) at 3.5 hr PGT. Scale bars = 25 μm. White boxes frame magnified areas. (C, relative to B) Quantification of HeLa cells exhibiting fragmented mitochondria. Numbers are expressed as an average of three independent experiments for 150 cells counted for each sample. Error bars represent standard deviation from the mean. Asterisks represent statistical significance (****=p < 0.0001) using one-way ANOVA and Turkey’s multiple comparison test.
Figure 3—figure supplement 1
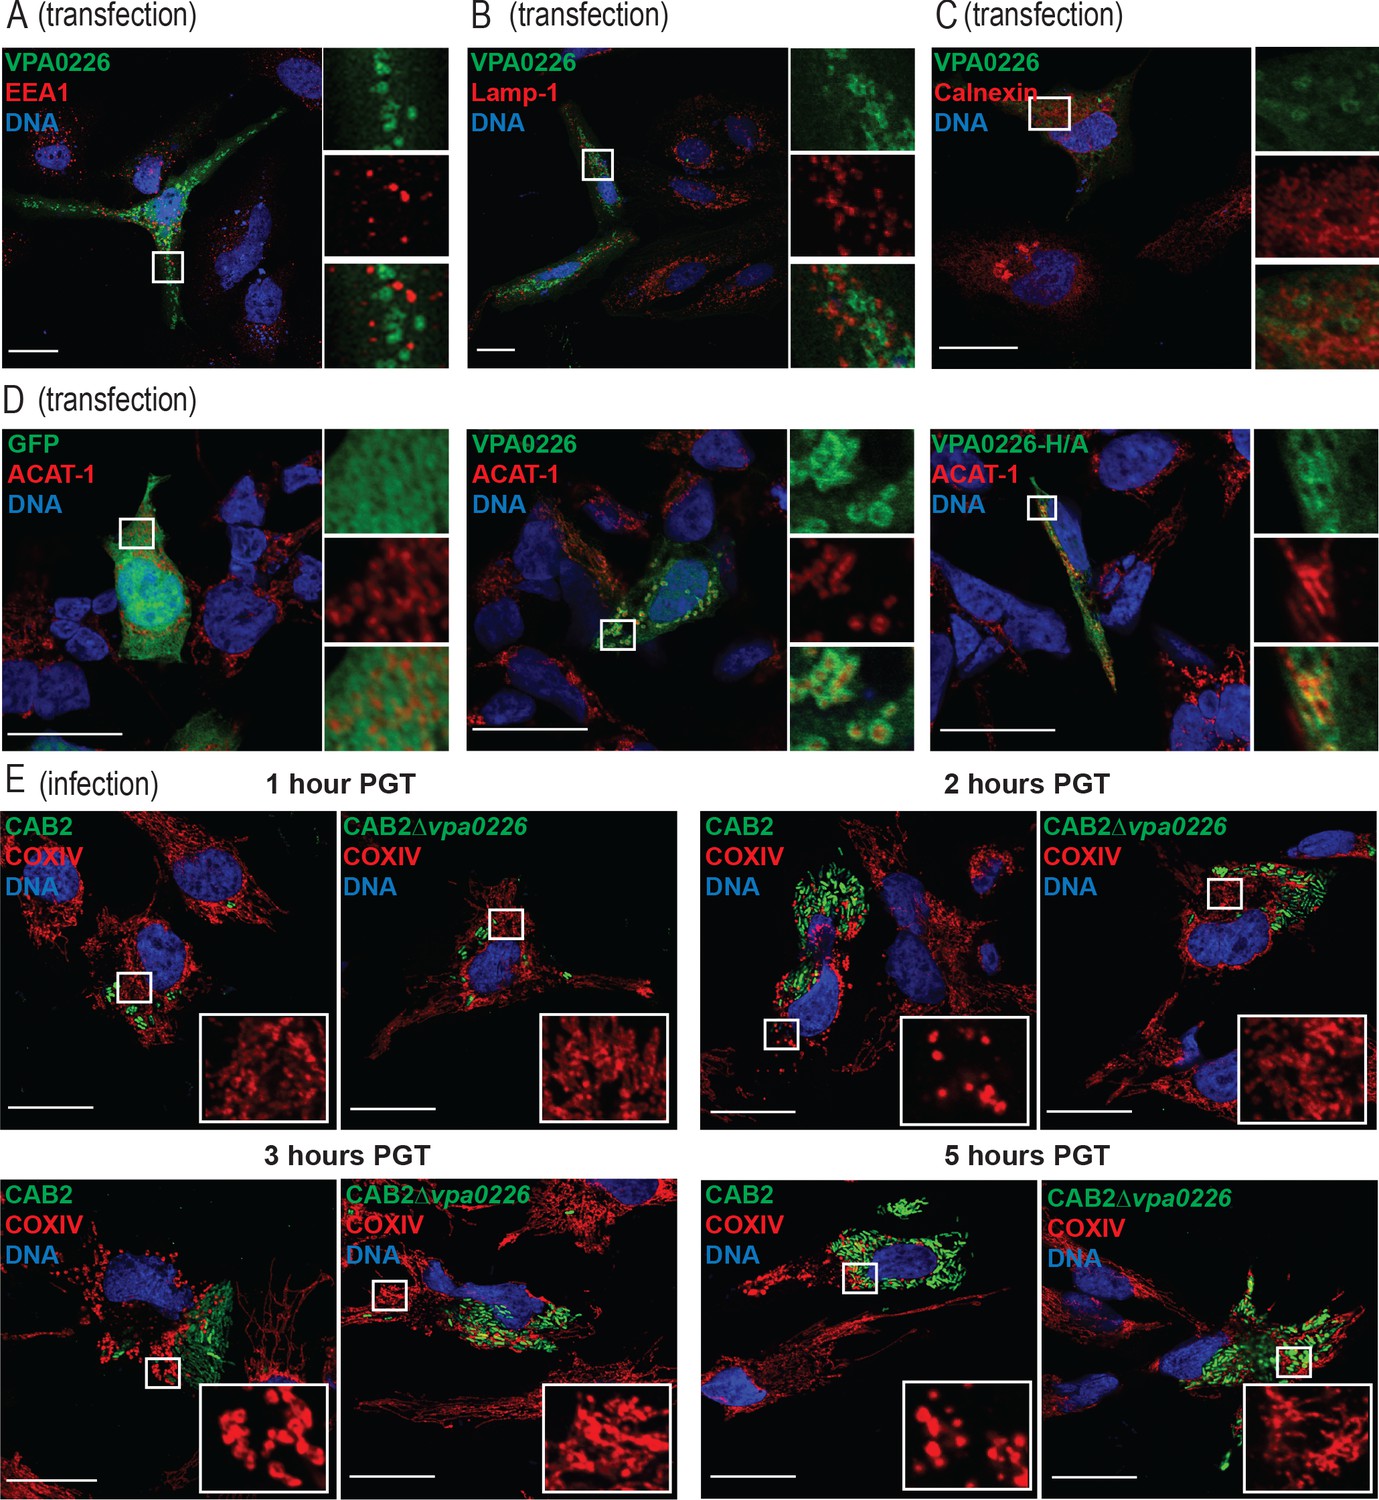
VPA0226 exclusively localizes to the mitochondria.
Confocal micrographs of HeLa cells transiently transfected with VPA0226-sfGFPN1 (green) for 24 hr. Early endosomes, late endosomes/lysosomes, and endoplasmic reticulum were stained with (A) anti-EEA1, (B) anti-lamp1, and (C) anti-calnexin antibodies (red), respectively, and DNA was stained with Hoechst (blue). Scale bars = 25 μm. White boxes frame magnified areas. (D) Confocal micrographs of HEK293T cells transiently transfected with empty vector, VPA0226- or VPA0226 H/A-sfGFPN1 (green) for 24 hr. Mitochondria were stained with anti-ACAT1 antibody (red) and DNA was stained with Hoechst (blue). Scale bars = 25 μm. White boxes frame magnified areas. (E) Confocal micrographs of HeLa cells infected with GFP-expressing (green) CAB2, CAB2Δvpa0226, CAB2Δvpa0226+WT, or CAB2Δvpa0226+S/A with anti-COXIV antibody (red) and DNA was stained with Hoechst (blue) at 1, 2, 3 and 5 hr PGT. Scale bars = 25 μm. White boxes frame magnified areas.
Figure 3—figure supplement 2

Bacterially invaded cells display apoptotic signatures in a VPA0226-dependent manner.
(A) Confocal micrographs of HeLa cells infected with GFP-expressing (green) CAB2, CAB2Δvpa0226, CAB2Δvpa0226+WT, or CAB2Δvpa0226+S/A tested for release of Cytochrome C (Cyto C) from the mitochondria into the cytosol was assessed by staining of Cyto C with anti-Cytochrome C antibody (red) and DNA was stained with Hoechst (blue) at 5 hr PGT. Scale bars = 25 μm. White boxes frame magnified areas. (B, relative to A) Quantification of HeLa cells exhibiting cytosolic CytoC. Numbers are expressed as an average of three independent experiments for 150 cells counted for each sample. Error bars represent standard deviation from the mean. Asterisks represent statistical significance (***=p < 0.001, ****=p < 0.0001) using one-way ANOVA and turkey’s multiple comparison test. (C) Confocal micrographs of HeLa cells infected with GFP-expressing (green) CAB2, CAB2Δvpa0226, CAB2Δvpa0226+WT, or CAB2Δvpa0226+S/A followed by TUNEL staining (green) of host cell nuclei and DNA staining with Hoechst (blue) at 5 hr PGT. Arrows point to TUNEL positive or negative nuclei. Scale bars = 25 μm. (D, relative to C) Quantification of HeLa cells positive for TUNEL staining. Numbers are expressed as an average of three independent experiments for 150 cells counted for each sample. Error bars represent standard deviation from the mean. Asterisks represent statistical significance (*=p < 0.05, ***=p < 0.001) using one-way ANOVA and turkey’s multiple comparison test. (E) HeLa cells were infected with CAB2 or CAB2Δvpa0226 for 2 hr, in the absence or presence of 50 μM Z-VAD-FMK. Next, samples were treated with 100 μg/mL gentamicin for 1, 3, 5, and 7 hr, in the absence or presence of Z-VAD-FMK. Host cell lysates were serially diluted and plated onto MMM agar plates for intracellular bacterial colony counting (CFU/mL). Asterisks represent statistical significance (****=p < 0.0001) using two-way ANOVA and turkey’s multiple comparison test. (F) HeLa cells were treated with 1.2 μM staurosporine for 24 hr in the absence or presence of 50 μM Z-VAD-FMK and cell viability was assessed by staining with Trypan Blue. Asterisks represent statistical significance (***=p < 0.001) using Student’s two tailed t-test.
Figure 4 with 2 supplements
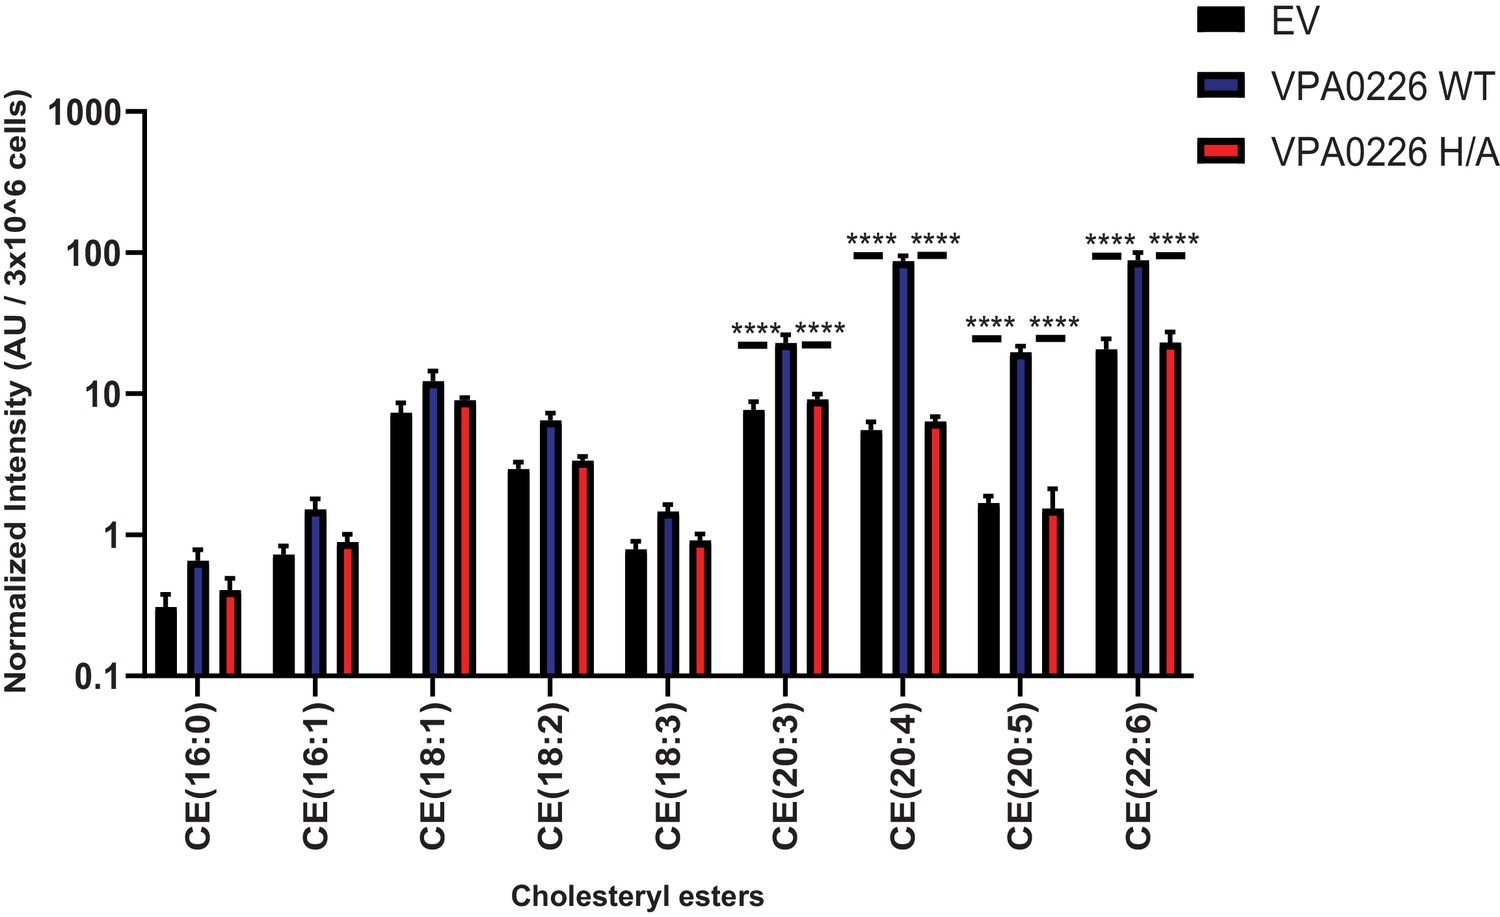
VPA0226 changes lipid profile in cells.
Quantification of polyunsaturated and saturated fatty acyl cholesteryl esters extracted from transfected HeLa cells (empty vector (EV), wildtype VPA0226-sfGFPN1 and VPA0226-H/A-sfGFPN1). Numbers are expressed as an average of five technical replicates for one of three independent experiments. Error bars represent standard deviation from the mean. Asterisks represent statistical significance (****=p < 0.0001) using one-way ANOVA and Turkey’s multiple comparison test.
Figure 4—figure supplement 1
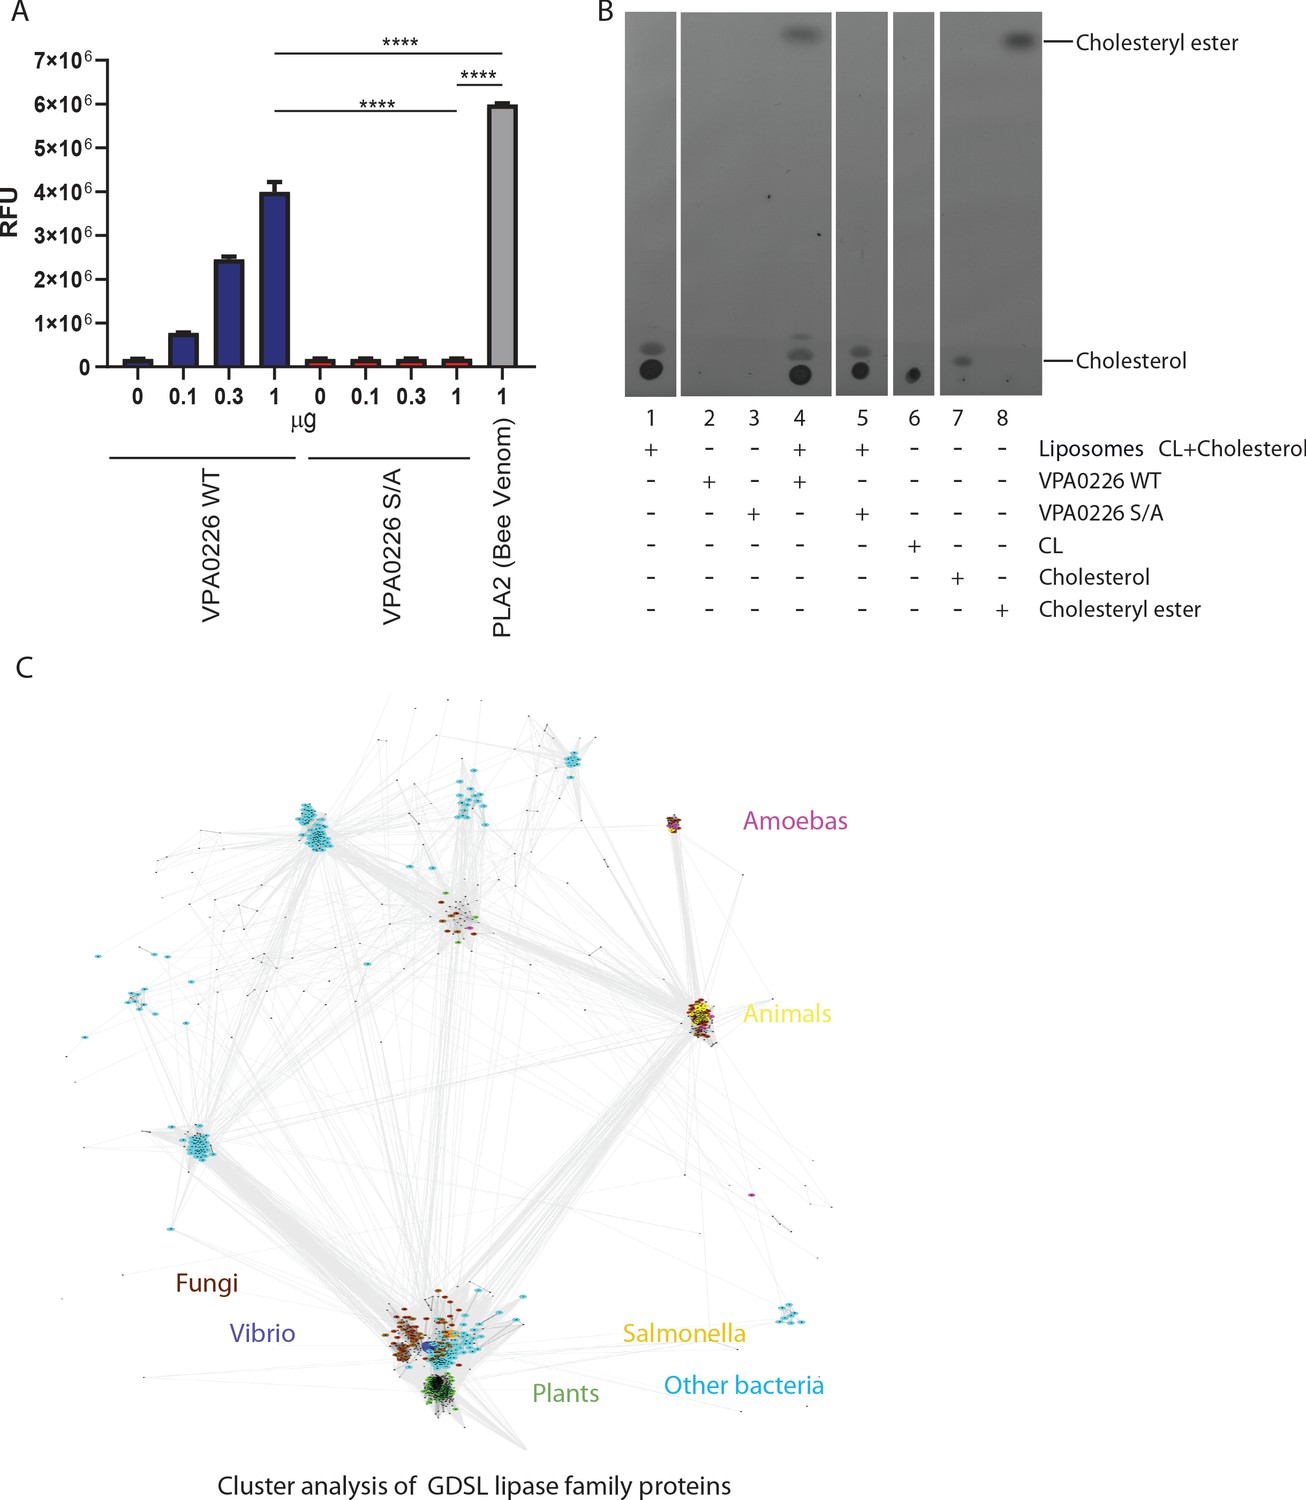
VPA0226 displays phospholipase 2 (PLA 2) activity.
(A) Increasing amounts of purified VPA0226WT or catalytically inactive S/A version were incubated with the fluorogenic PLA2-specific substrate BODIPY PC-A2 (EnzCheck Phospholipase A2 Assay kit, Invitrogen) for 30 min at RT and fluorescence was measured at Ex/Em 460/515 nm. Error bars represent standard deviation from the mean. Asterisks represent statistical significance (*=p < 0.05, ***=p < 0.0005) using one-way ANOVA and Turkey’s multiple comparison test. (B) Thin layer chromatography of lipids extracted from the liposome assay demonstrating the formation of esterified cholesterol in reactions containing cardiolipin (CL) and cholesterol liposomes incubated with wildtype VPA0226 (lane 4). For standards, 10 µg each of CL, cholesterol and cholesteryl ester were loaded on TLC plate (lanes 6, 7 and 8, respectively). (C) CLANS graph depicts sequence similarity relationships between GDSL lipases, by clustering protein sequences according to pairwise BLAST-derived scores. 1500 representative sequences of representatives of the Lipase_GDSL family shown. Coloring by taxonomy: Vibrio – dark blue, Salmonella – orange, other bacteria – cyan, fungi – brown, plants – green, animals – yellow, amoebas – magenta.
Figure 4—figure supplement 2
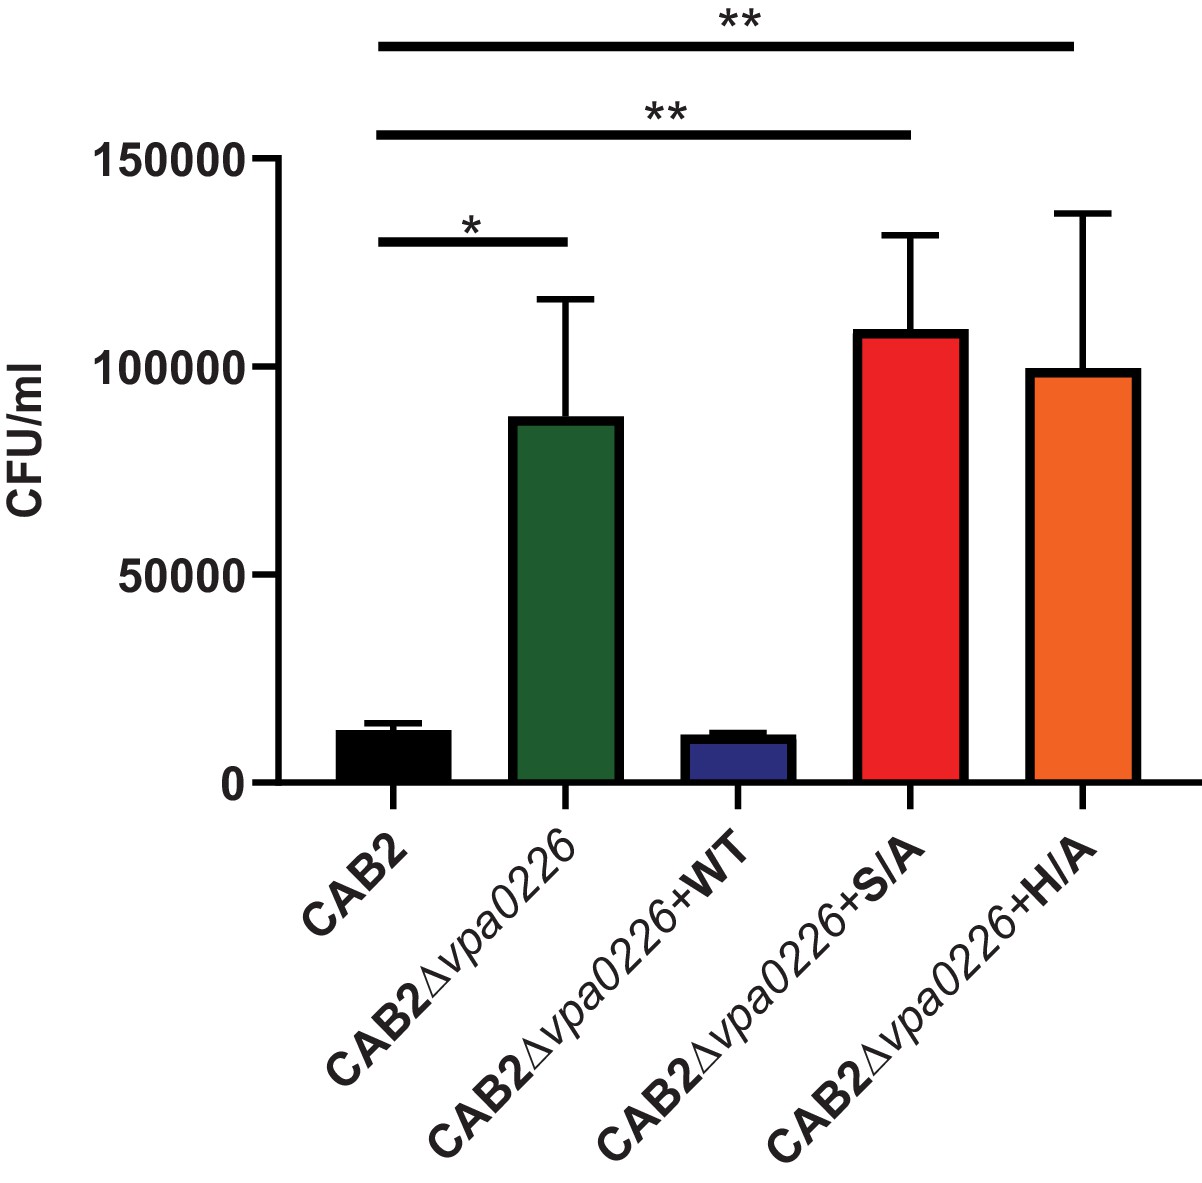
CAB2Δvpa0226+H/A mutant displays an egression defect similar to CAB2Δvpa0226 and CAB2Δvpa0226+S/A.
HeLa cells were infected with either CAB2, CAB2Δvpa0226, CAB2Δvpa0226+WT, CAB2Δvpa0226+S/A or CAB2Δvpa0226+H/A for 7 hr PGT. Host cell lysates were serially diluted and plated onto MMM agar plates for intracellular bacterial colony counting (CFU/mL). Numbers are expressed as an average of three technical replicates for one of three independent experiments. Error bars represent standard deviation from the mean. Asterisks represent statistical significance (*=p < 0.05, **=p < 0.01) using 2way ANOVA and Turkey’s multiple comparison test.
Figure 5 with 1 supplement

VPA0226 modifies cholesterol content in the plasma membrane, upregulates cholesterol synthesis gene expression in cells and permeabilizes the host cell plasma membrane.
(A) qPCR analysis for relative expression of HMGCR, HMGCS and DHCR24, signature genes involved in cholesterol synthesis (SREBP2) pathway in HeLa cells transfected with empty vector (EV), wildtype VPA0226-sfGFPN1 and VPA0226-H/A-sfGFPN1. Expression was normalized to the house keeping gene GAPDH and asterisks represent statistical significance (*=p < 0.05, **=p < 0.01, ***=p < 0.001) using one-way ANOVA and Turkey’s multiple comparison test. (B) Quantification of cholesterol in plasma membranes isolated from HeLA cells transfected with empty vector (EV), wildtype VPA0226-sfGFPN1 and VPA0226-H/A-sfGFPN1. Asterisks represent statistical significance (*=p < 0.05) using one-way ANOVA and Turkey’s multiple comparison test. (C) Susceptibility to mechanical stress as measured by propidium iodide (PI) binding in transfected HeLA cells (empty vector (EV), wildtype VPA0226-sfGFPN1 and VPA0226-H/A-sfGFPN1), **=p < 0.01 using one-way ANOVA and Turkey’s multiple comparison test. (D) Confocal micrographs of HeLa cells infected with GFP-expressing (green) CAB2, CAB2Δvpa0226, CAB2Δvpa0226+WT, or CAB2Δvpa0226+S/A at 5 hr PGT. Cell permeability was assessed by staining with dye sytox (red), bacteria (green), and DNA (blue, stained with Hoechst). Scale bars = 25 μm. Arrows point to the sytox permeable HeLA cell nuclei in CAB2, and CAB2Δvpa0226+WT, or sytox impermeable nuclei in CAB2Δvpa0226, CAB2Δvpa0226+S/A infections. (E, relative to D) Quantification of HeLa cells positive for Sytox staining. Numbers are expressed as an average of three independent experiments for 150 cells counted for each sample. Error bars represent standard deviation from the mean. Asterisks represent statistical significance (**=p < 0.01, ****=p < 0.0001) using one-way ANOVA and Turkey’s multiple comparison test. (F, G and H) HeLa cells were infected with CAB2 or CAB2Δvpa0226 for 6, 7 and 8 hr PGT along with either cholesterol/MCD or HPCD or without. Host cell lysates were serially diluted and plated onto MMM agar plates for intracellular bacterial colony counting (CFU/mL). Numbers are expressed as an average of three technical replicates for one of three independent experiments. Error bars represent standard deviation from the mean. Asterisks represent statistical significance (**=p < 0.01, ****=p < 0.0001) using 2way ANOVA and Turkey’s multiple comparison test.
Figure 5—figure supplement 1
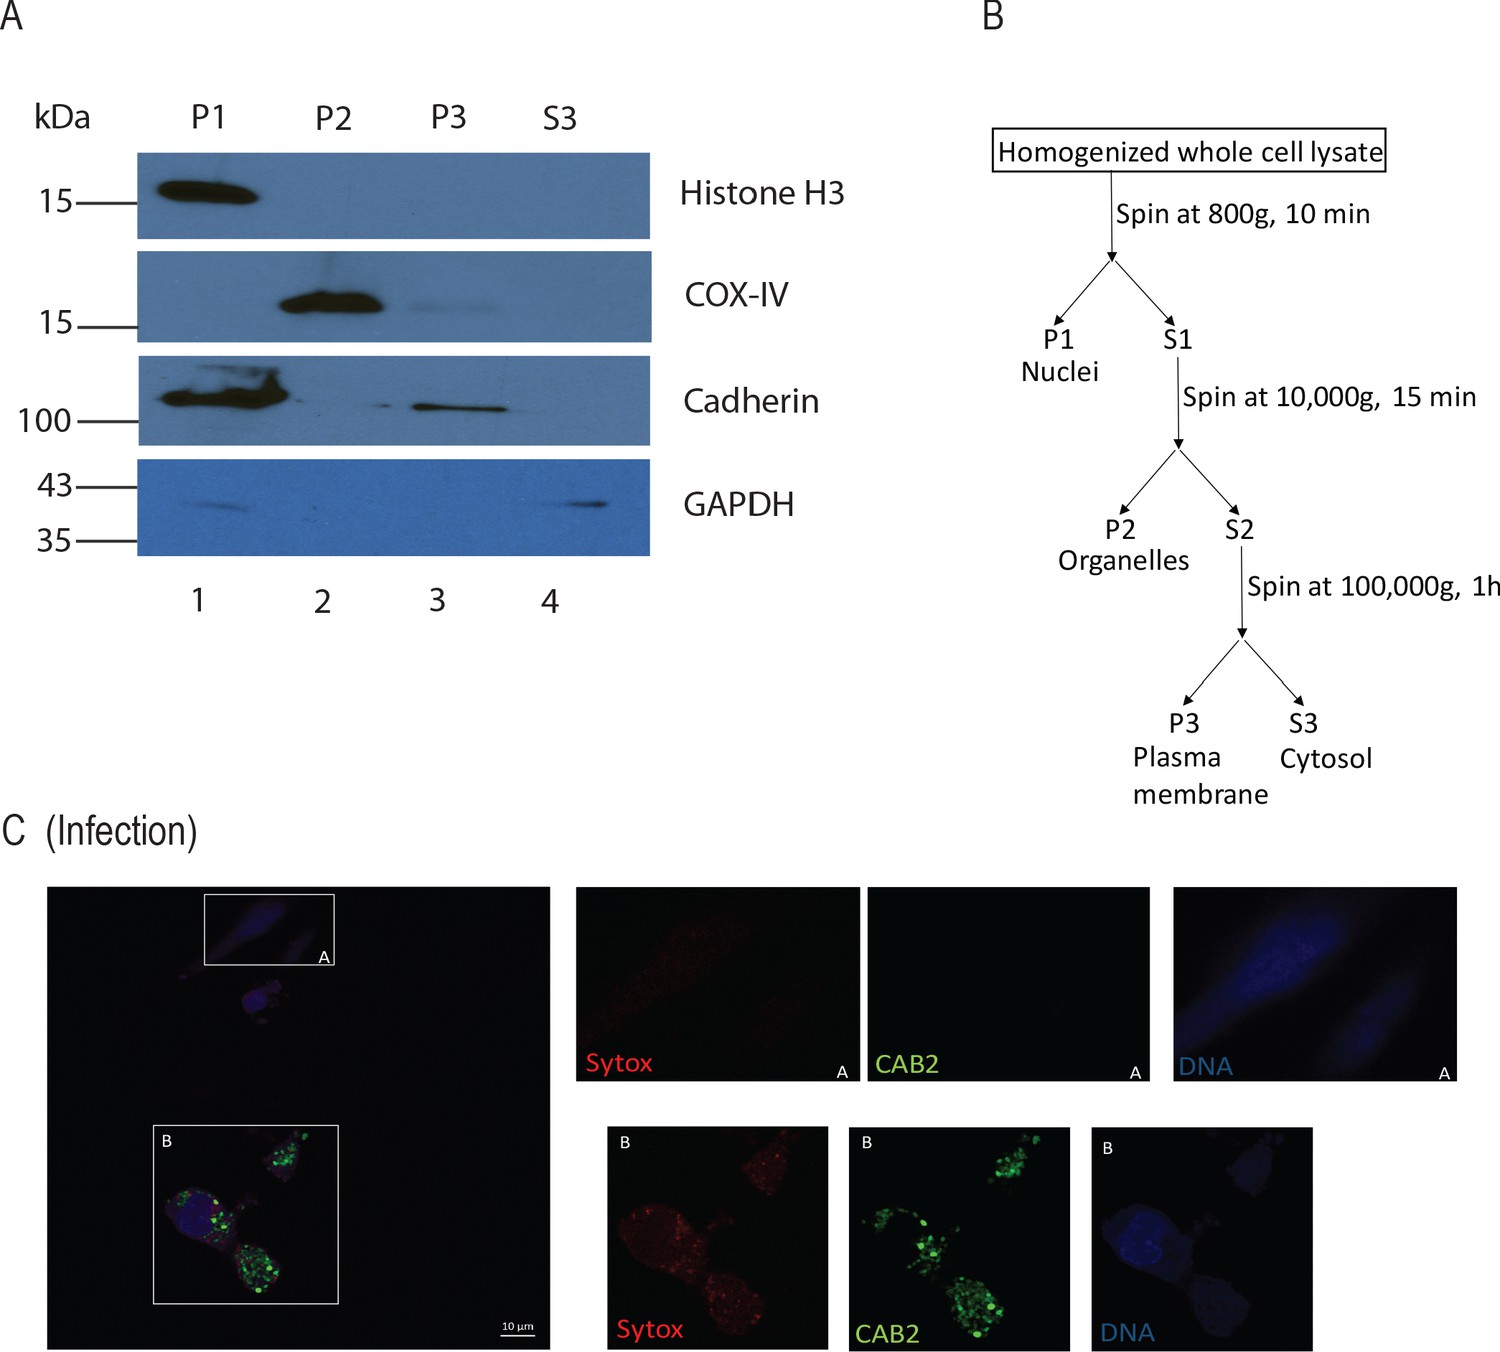
Subcellular fractionation and sytox staining of HeLa cells infected with GFP-expressing (green) CAB2.
(A) Western blot analysis for subcellular fractionation to isolate plasma membrane fraction from HeLa cells. (B) Schematic representation of subcellular fractionation through differential centrifugation. (C) Confocal micrographs of HeLa cells infected with GFP-expressing (green) CAB2 including non-invaded (A) and invaded (B) cells at 5 hr PGT. Cell permeability was assessed by staining with dye sytox (red), bacteria (green), and DNA (blue, stained with Hoechst). Scale bars = 10 μm.
Additional files
Download links
A two-part list of links to download the article, or parts of the article, in various formats.
Downloads (link to download the article as PDF)
Open citations (links to open the citations from this article in various online reference manager services)
Cite this article (links to download the citations from this article in formats compatible with various reference manager tools)
Vibrio deploys type 2 secreted lipase to esterify cholesterol with host fatty acids and mediate cell egress
eLife 9:e58057.
https://doi.org/10.7554/eLife.58057


