Postnatal mechanical loading drives adaptation of tissues primarily through modulation of the non-collagenous matrix
- Institute of Ageing and Chronic Disease, Faculty of Health and Life Sciences, University of Liverpool, United Kingdom
- Comparative Biomedical Sciences, The Royal Veterinary College, Royal College Street, United Kingdom
- University College London, Department of Orthopaedics and Musculoskeletal Science, Stanmore Campus, Royal National Orthopaedic Hospital, United Kingdom
- Institute of Bioengineering, School of Engineering and Materials Science, Queen Mary University of London, United Kingdom
Figures
Figure 1 with 1 supplement
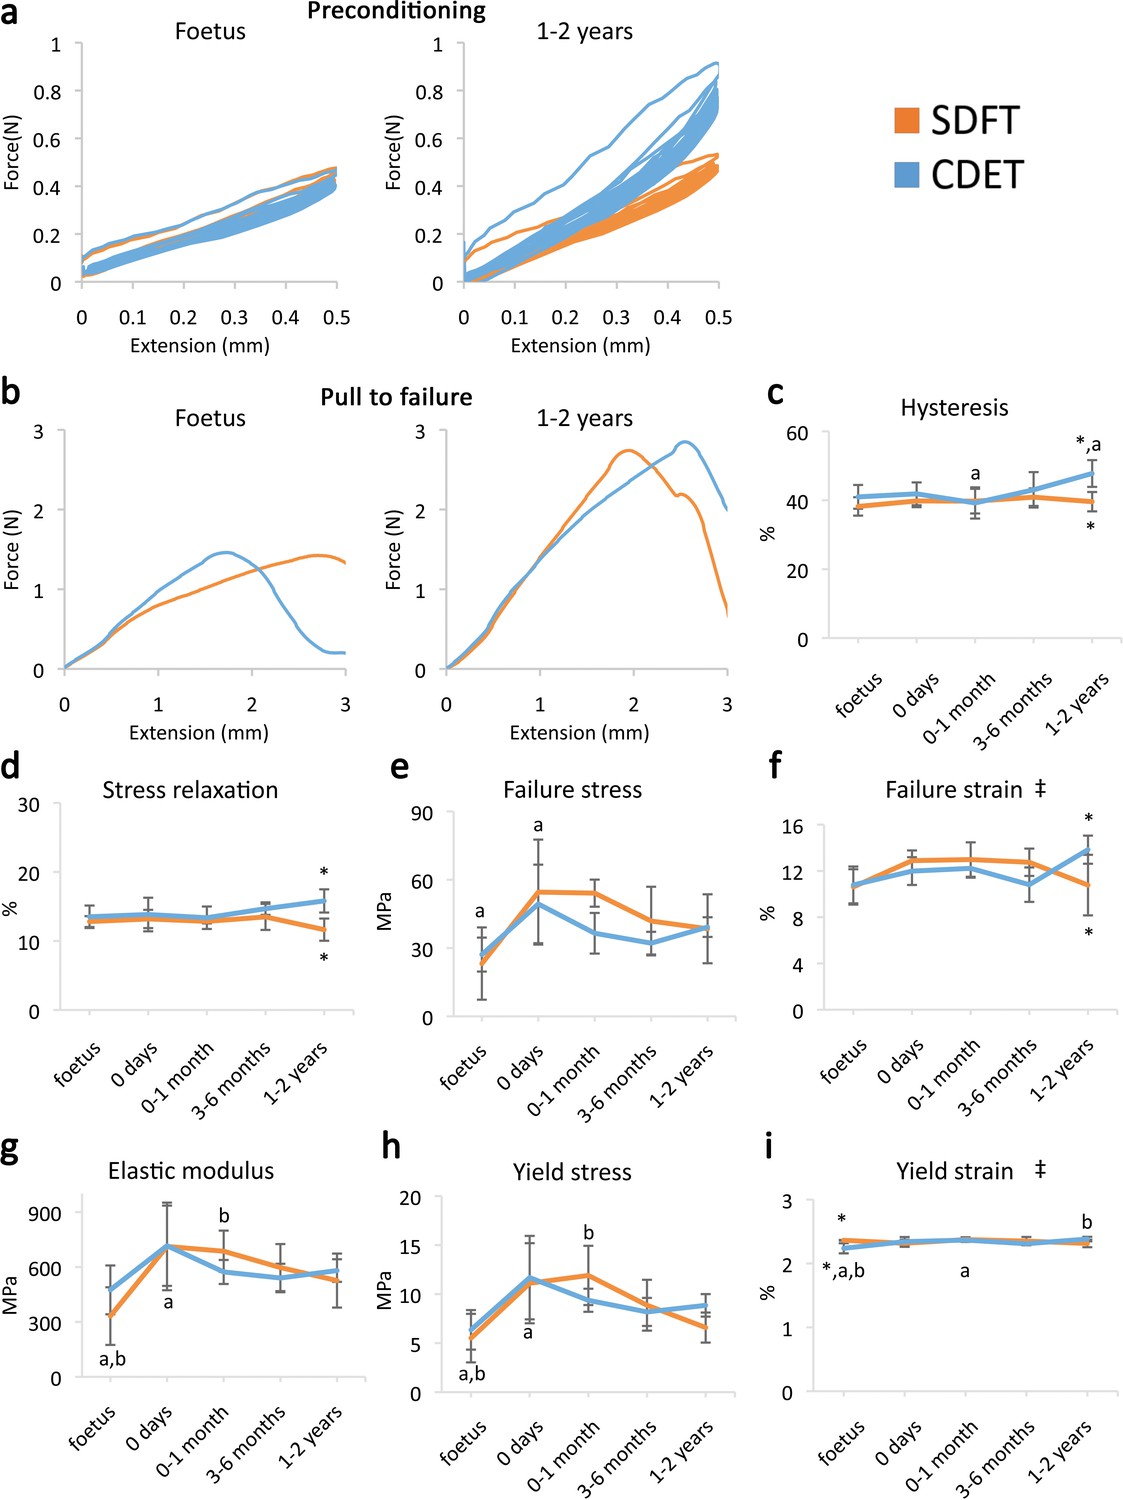
Fascicle response to mechanical testing shows increase in strength with development but few significant differences between tendon types, indicating that the fascicles show minimal structural specialisation in response to loading.
(a) Representative curves for 10 preconditioning cycles for the SDFT and CDET fascicles in the foetus and 1–2 years age group. (b) Representative force-extension curves to failure for the SDFT and CDET fascicles in the same age groups. (c–i) Mean SDFT and CDET fascicle biomechanical properties are presented across development, with data grouped into age groups: foetus, 0 days (did not weight-bear), 0–1 month, 3–6 months, 1–2 years. ‡ significant interaction between tendon type and development, * significant difference between tendons, a-b significant difference between age groups. Error bars depict standard deviation. Figure 1—figure supplement 1. SDFT and CDET in the equine forelimb, tendon structure, and schematic showing procedure for biomechanical testing.
-
Figure 1—source data 1
Fascicle and IFM mechanical properties.
- https://cdn.elifesciences.org/articles/58075/elife-58075-fig1-data1-v2.xlsx
Figure 1—figure supplement 1
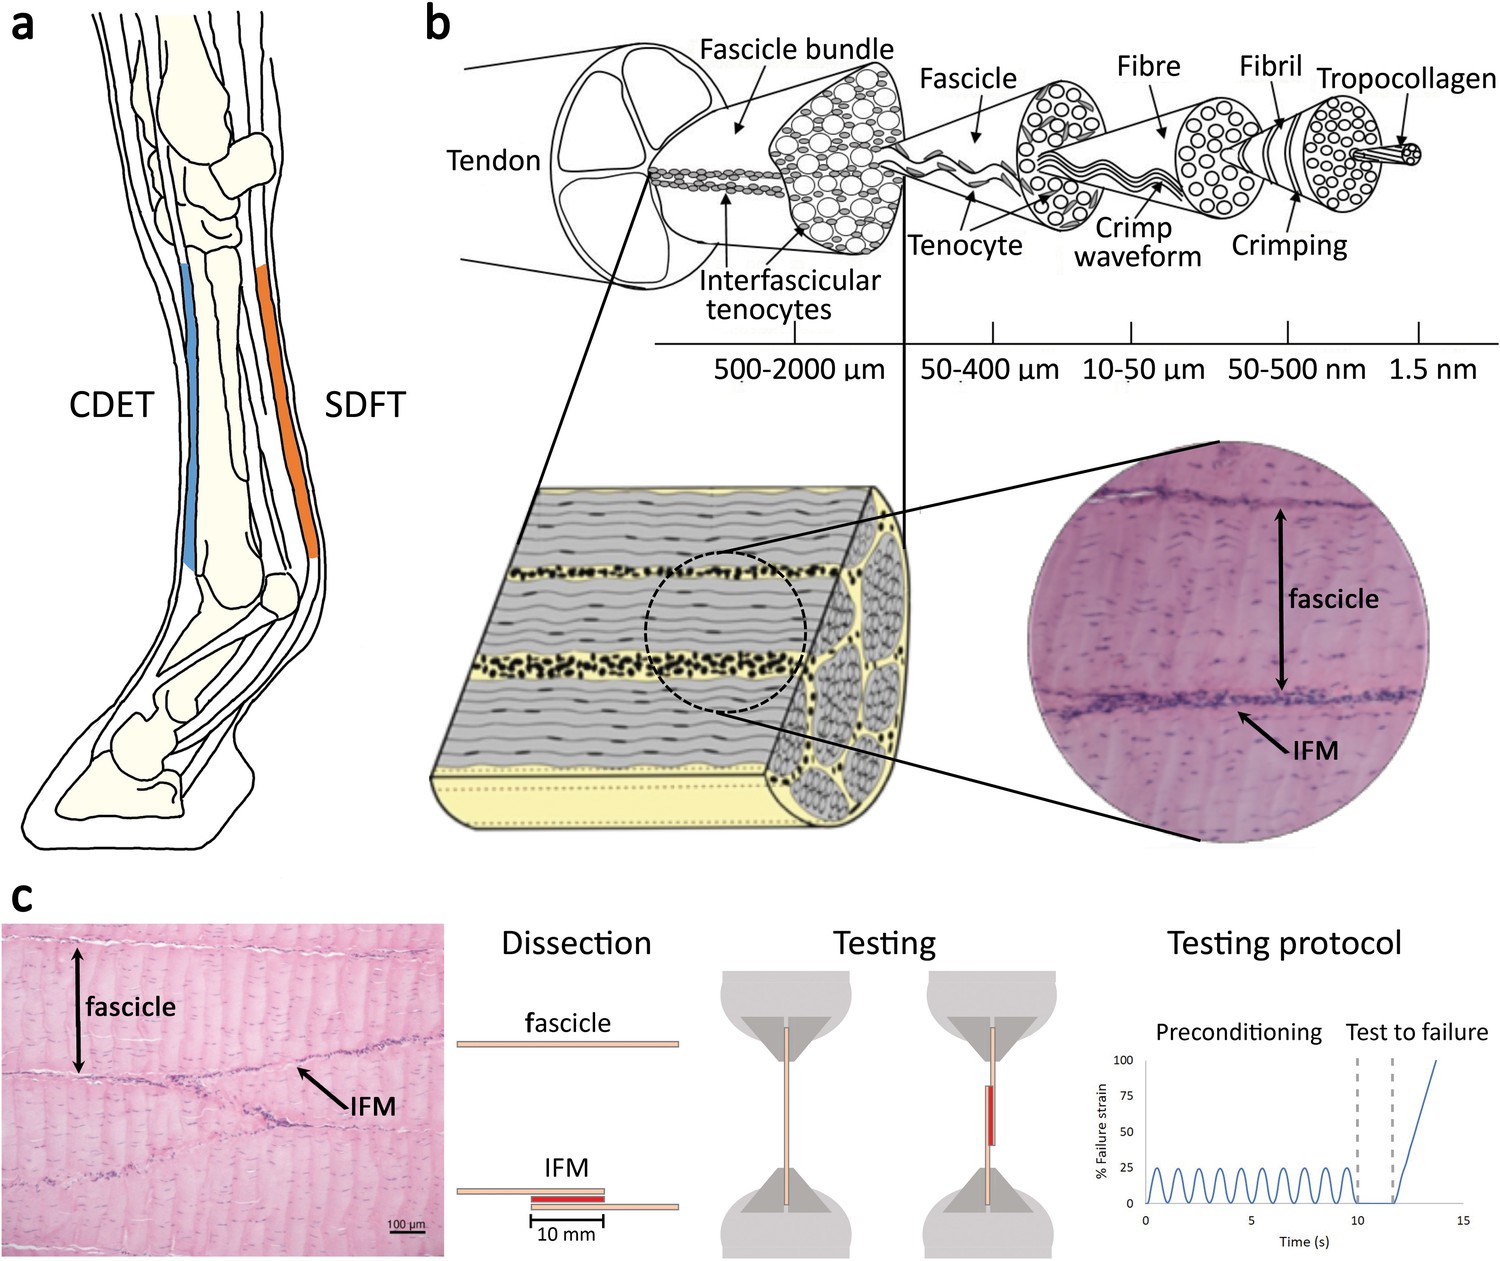
SDFT and CDET in the equine forelimb, tendon structure, and schematic showing procedure for biomechanical testing.
(a) Schematic of the equine forelimb with the CDET and SDFT highlighted. (b) Tendon structure (partially reproduced from Figure 1, Spiesz et al., 2015), Journal of Orthopaedic Research, published under the Creative Commons Attribution 4.0 International Public License (CC BY 4.0; https://creativecommons.org/licenses/by/4.0/). (c) H and E section of fascicle and IFM and schematic of fascicle and IFM dissection and biomechanical testing.
Figure 2
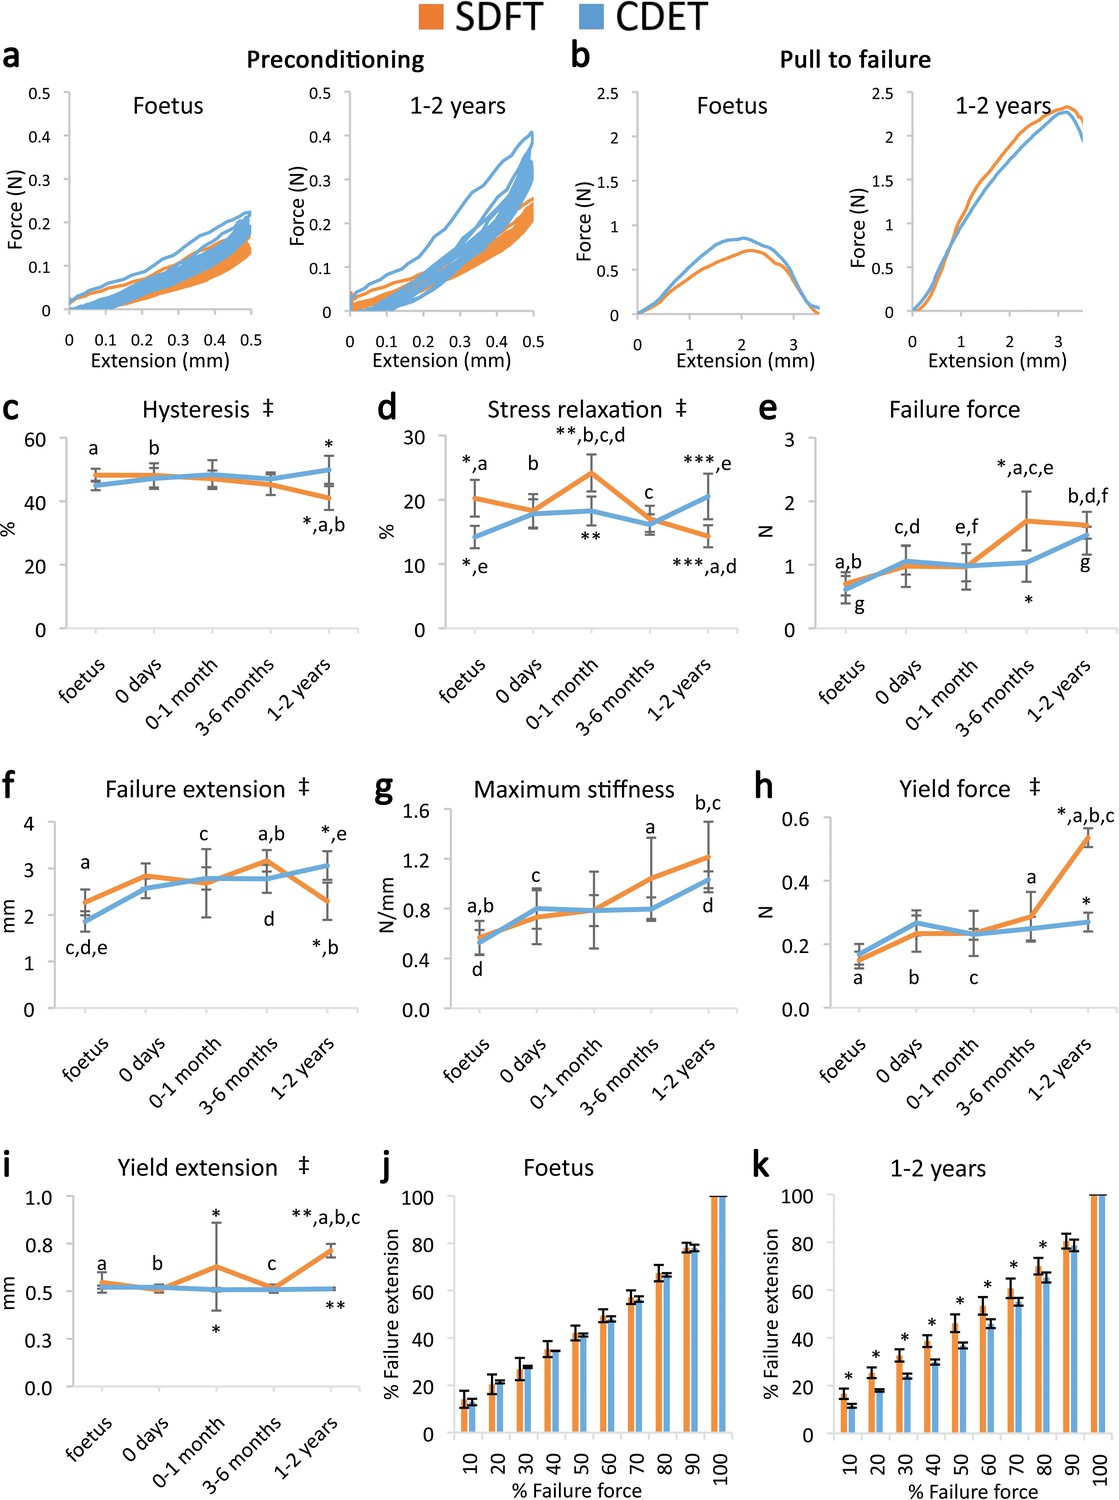
Mechanical testing of the IFM shows an equivalent increase in failure properties between the SDFT and CDET with development, but development of an extended low stiffness toe region and more elastic behaviour in the SDFT.
(a) Representative curves for 10 preconditioning cycles for the SDFT and CDET IFM in the foetus and 1–2 years age group. (b) Representative force-extension curves to failure for the SDFT and CDET IFM in the same age groups. (c–i) Mean SDFT and CDET IFM biomechanical properties are presented across development, with data grouped into age groups: foetus, 0 days (did not weight-bear), 0–1 months, 3–6 months, 1–2 years. (j–k) To visualise the extended low stiffness toe region in the SDFT IFM, the amount of IFM extension at increasing percentages of failure force is presented, comparing the SDFT and CDET in the foetus and 1–2 years age group. ‡ significant interaction between tendon type and development, * significant difference between tendons, a-g significant difference between age groups. Error bars depict standard deviation.
Figure 3 with 1 supplement
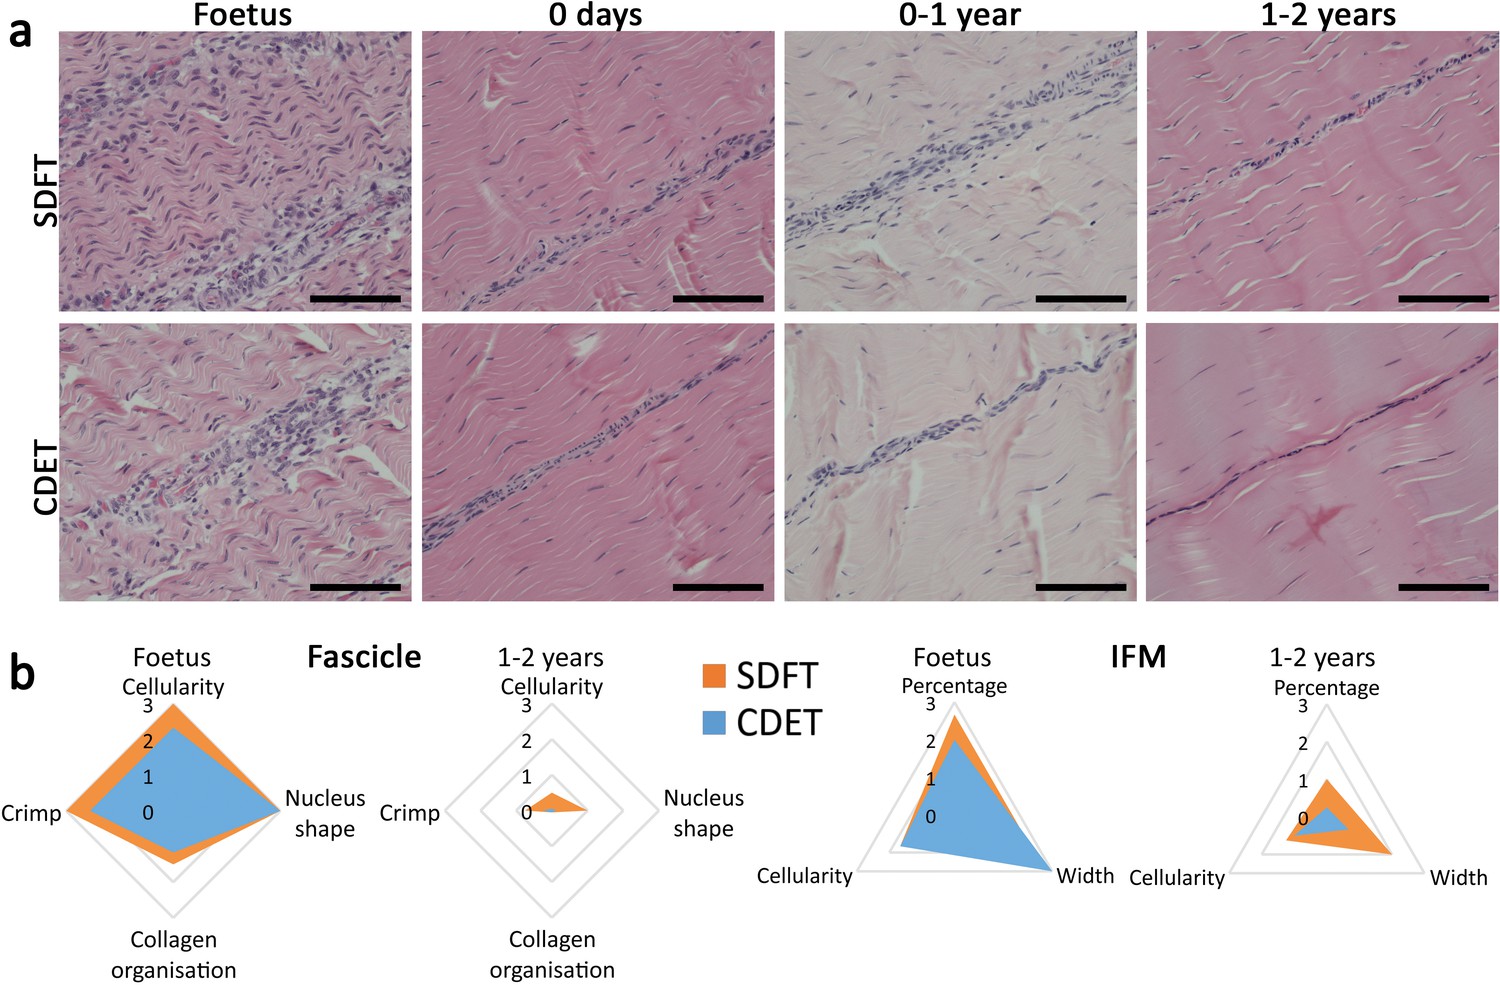
The SDFT and CDET are histologically similar at birth and differentiate with development especially in the IFM.
(a) Representative images of H and E sections of the SDFT and CDET demonstrate structural development: foetus, 0 days (did not weight-bear), 0–1 year, and 1–2 years, whilst (b) Radar plots enable the mean histology scores of the fascicle and IFM for the SDFT and CDET to be compared between the foetus and 1–2 years age group (all data shown in Figure 3—figure supplement 1 and scoring criteria in Supplementary file 1). A decrease in cell numbers, crimp, and IFM width is visible with progression of age, and the aspect ratio of cells in the fascicle increases. Scale bar 100 µm.
Figure 3—figure supplement 1
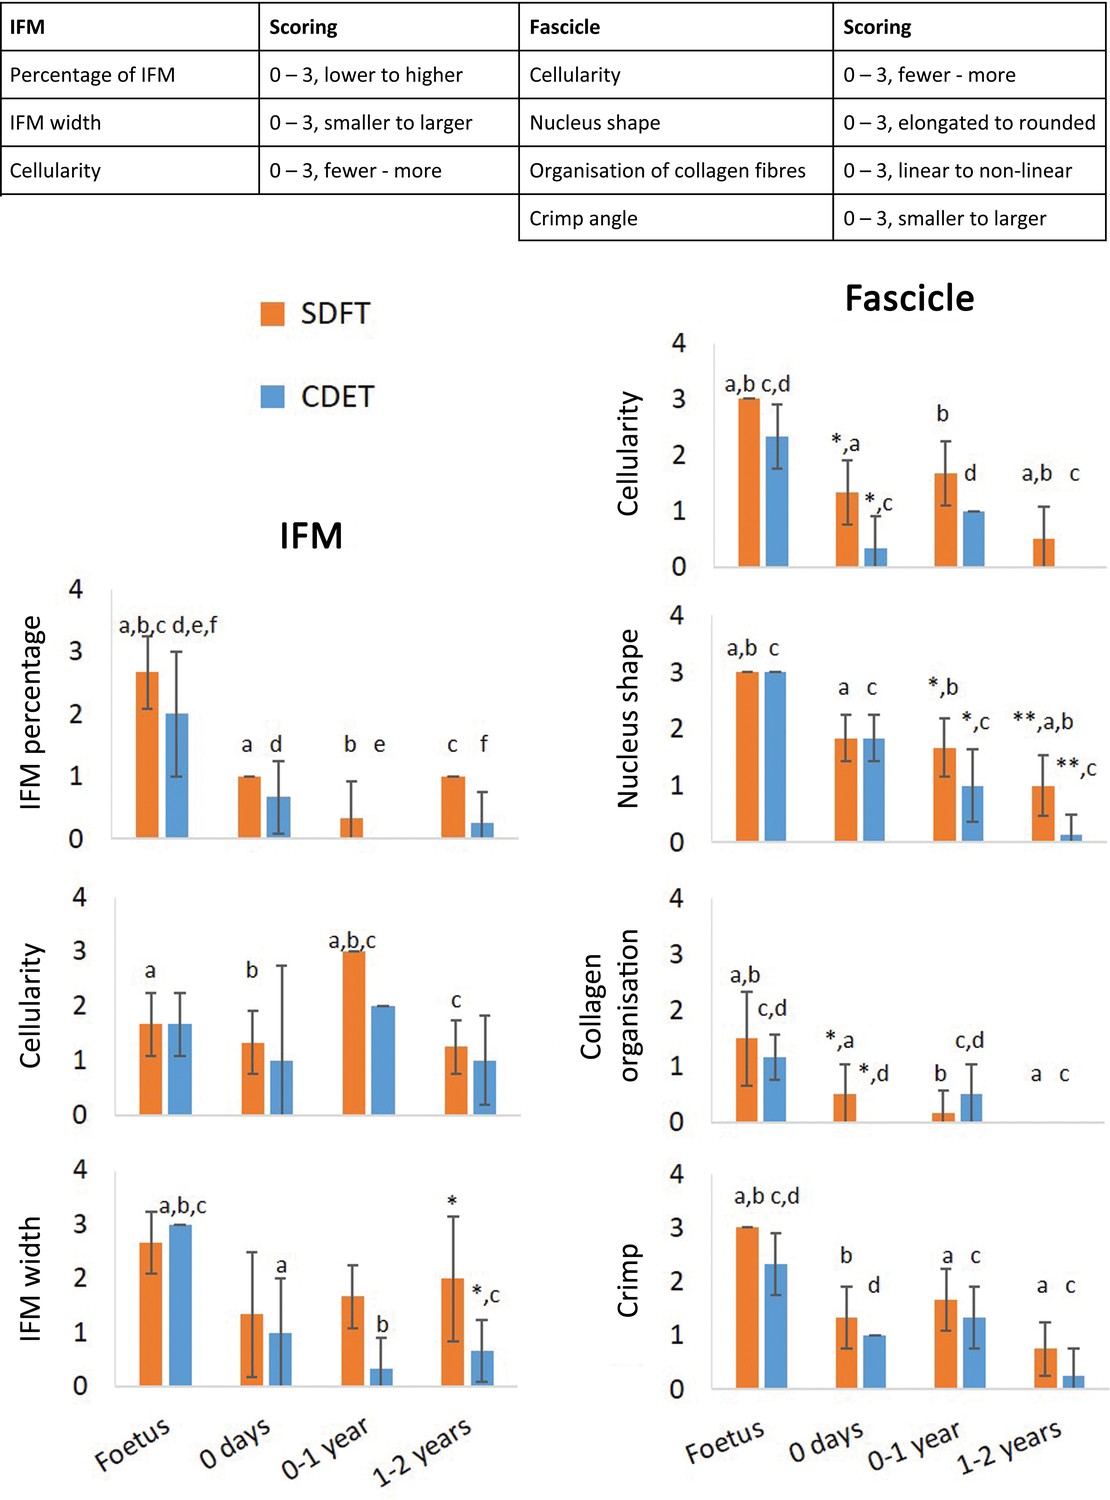
Scoring of histologic variables for the IFM and fascicle in the SDFT and CDET through postnatal development.
* Significant difference between tendons, a-f significant difference between age groups. Error bars depict standard deviation.
Figure 4 with 1 supplement
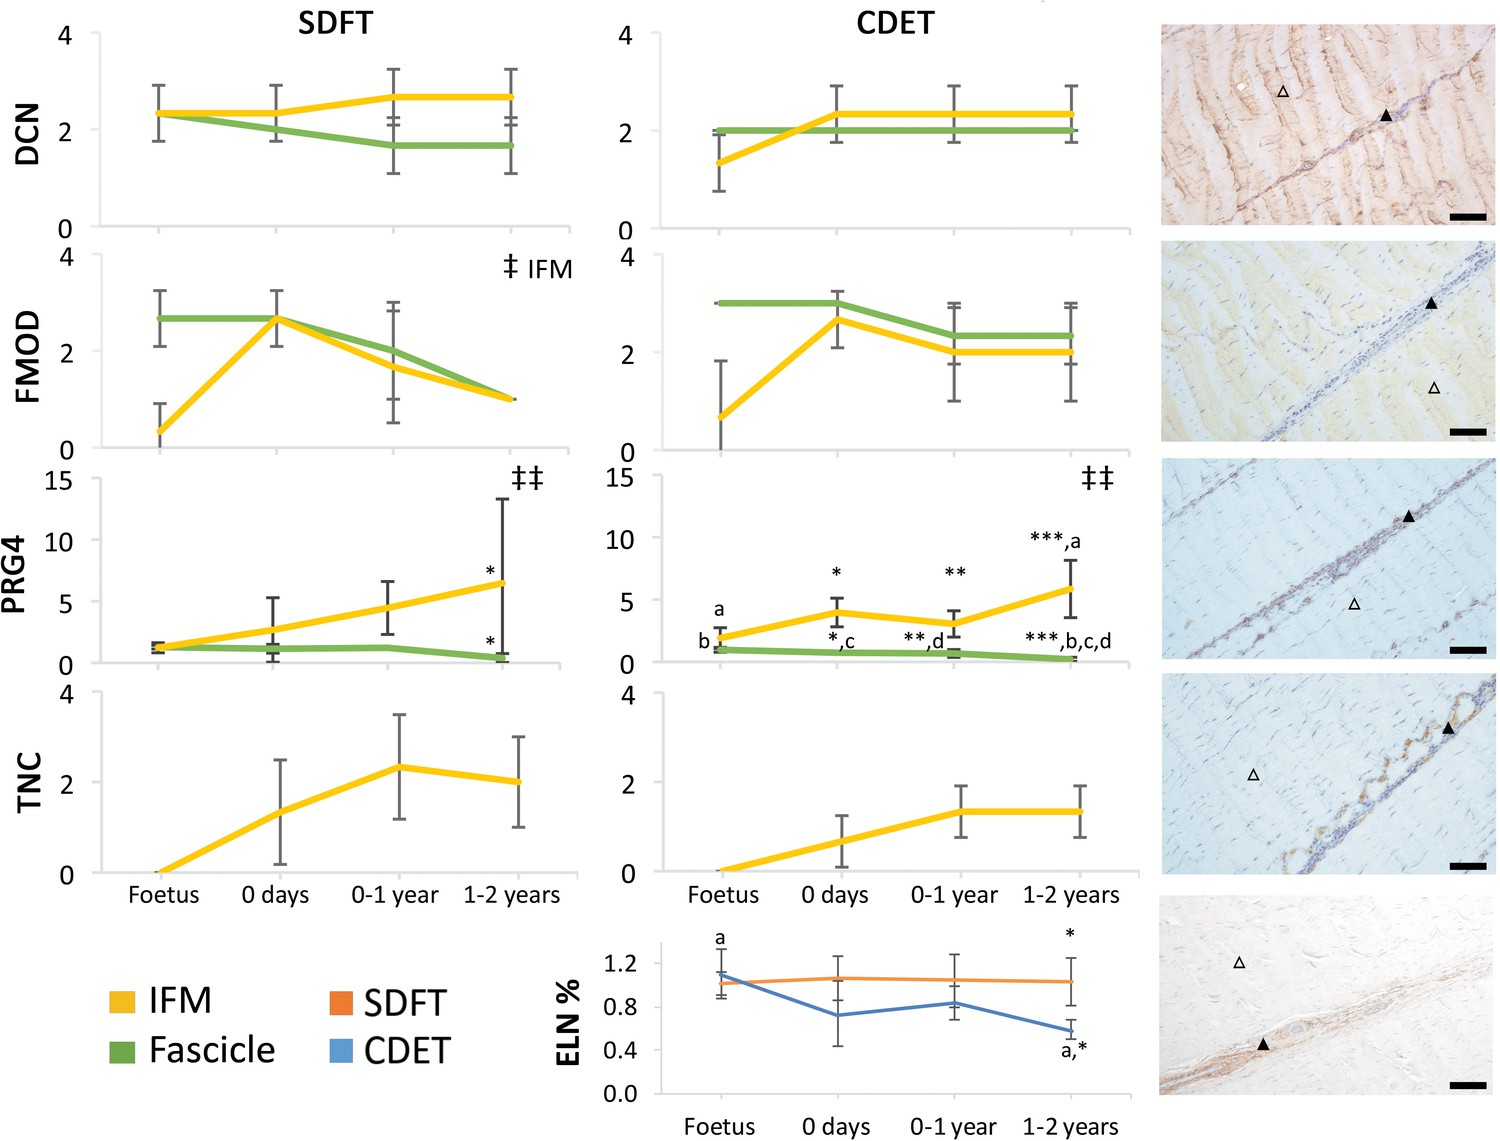
Immunohistochemical assays show divergence of PGR4 (lubricin) and elastin with maturation between functionally distinct tendons.
IFM and fascicle staining scores are shown for decorin (DCN), fibromodulin (FMOD), lubricin (PRG4), and tenascin-C (TNC) in the SDFT and CDET, alongside representative images of immunohistochemical staining in the postnatal SDFT. DCN and FMOD staining is found in both IFM (black triangle) and fascicle (white triangle). PRG4 staining in mainly located in the IFM (black triangle) and less staining can be found in the fascicle (white triangle). TNC staining is restricted to the IFM (black triangle) and absent from the fascicle (white triangle). A quantitative measure of elastin (ELN) is provided as percentage of wet weight, alongside a representative image of immunohistochemical staining in the postnatal SDFT. ELN staining is mainly located in the IFM (black triangle) and faint staining can be found in the fascicle (white triangle). Staining scores for elastin are provided in Figure 4—figure supplement 1. ‡ significant change in tendon phase with development, ‡‡ significant interaction between tendon phase and development, * significant difference between tendons, a-d significant difference between age groups. Scale bar 100 µm. Error bars depict standard deviation. Figure 4—figure supplement 1. Scoring of ELN staining for the IFM and fascicle in the SDFT and CDET through postnatal development.
Figure 4—figure supplement 1
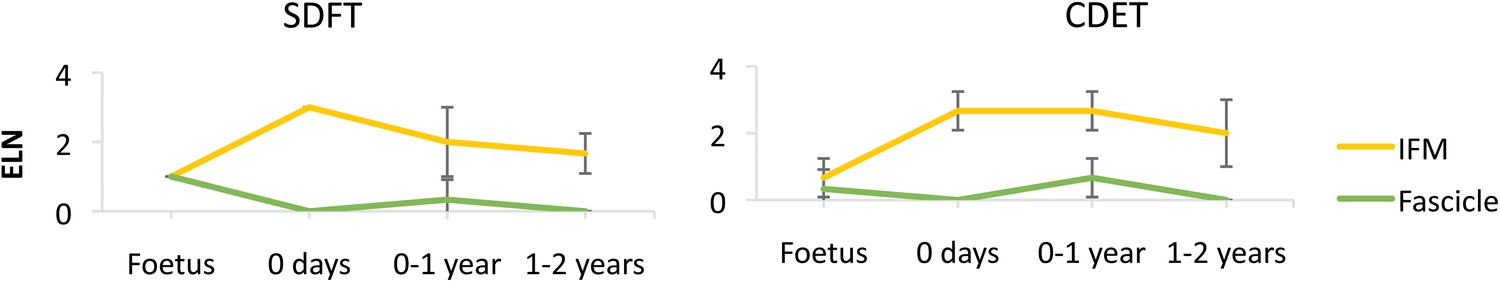
Scoring of ELN staining for the IFM and fascicle in the SDFT and CDET through postnatal development.
Error bars depict standard deviation.
Figure 5 with 2 supplements

The fascicle proteome remains the same during postnatal development and tendon loading whereas the IFM proteome starts changing following tendon loading in postnatal development.
(a) Heatmap of differentially abundant proteins in foetus, 0 days (did not weight-bear), 0–1 month, 3–6 months, and 1–2 years SDFT IFM and fascicles (p<0.05, fold change ≥2). Heatmap colour scale ranges from blue to white to red with blue representing lower abundance and red higher abundance. (b) Proteins with identified neopeptides and proteins showing differential total neopeptide abundance across age groups. Graph of proteins showing differential total neopeptide abundance in the SDFT fascicles across development (p<0.05, fold change ≥2, FDR 5%). No proteins showed differential total neopeptide abundance in the IFM. Figure 5—figure supplement 1. Classification of SDFT IFM and fascicle identified proteins and differentially abundant proteins according to their associated location. Figure 5—figure supplement 2. Relative mRNA expression of major ECM genes in whole tissue SDFT and CDET through postnatal development.
Figure 5—figure supplement 1

Classification of SDFT IFM and fascicle identified proteins and differentially abundant proteins (p<0.05, fold change ≥2) according to their associated location.
Figure 5—figure supplement 2
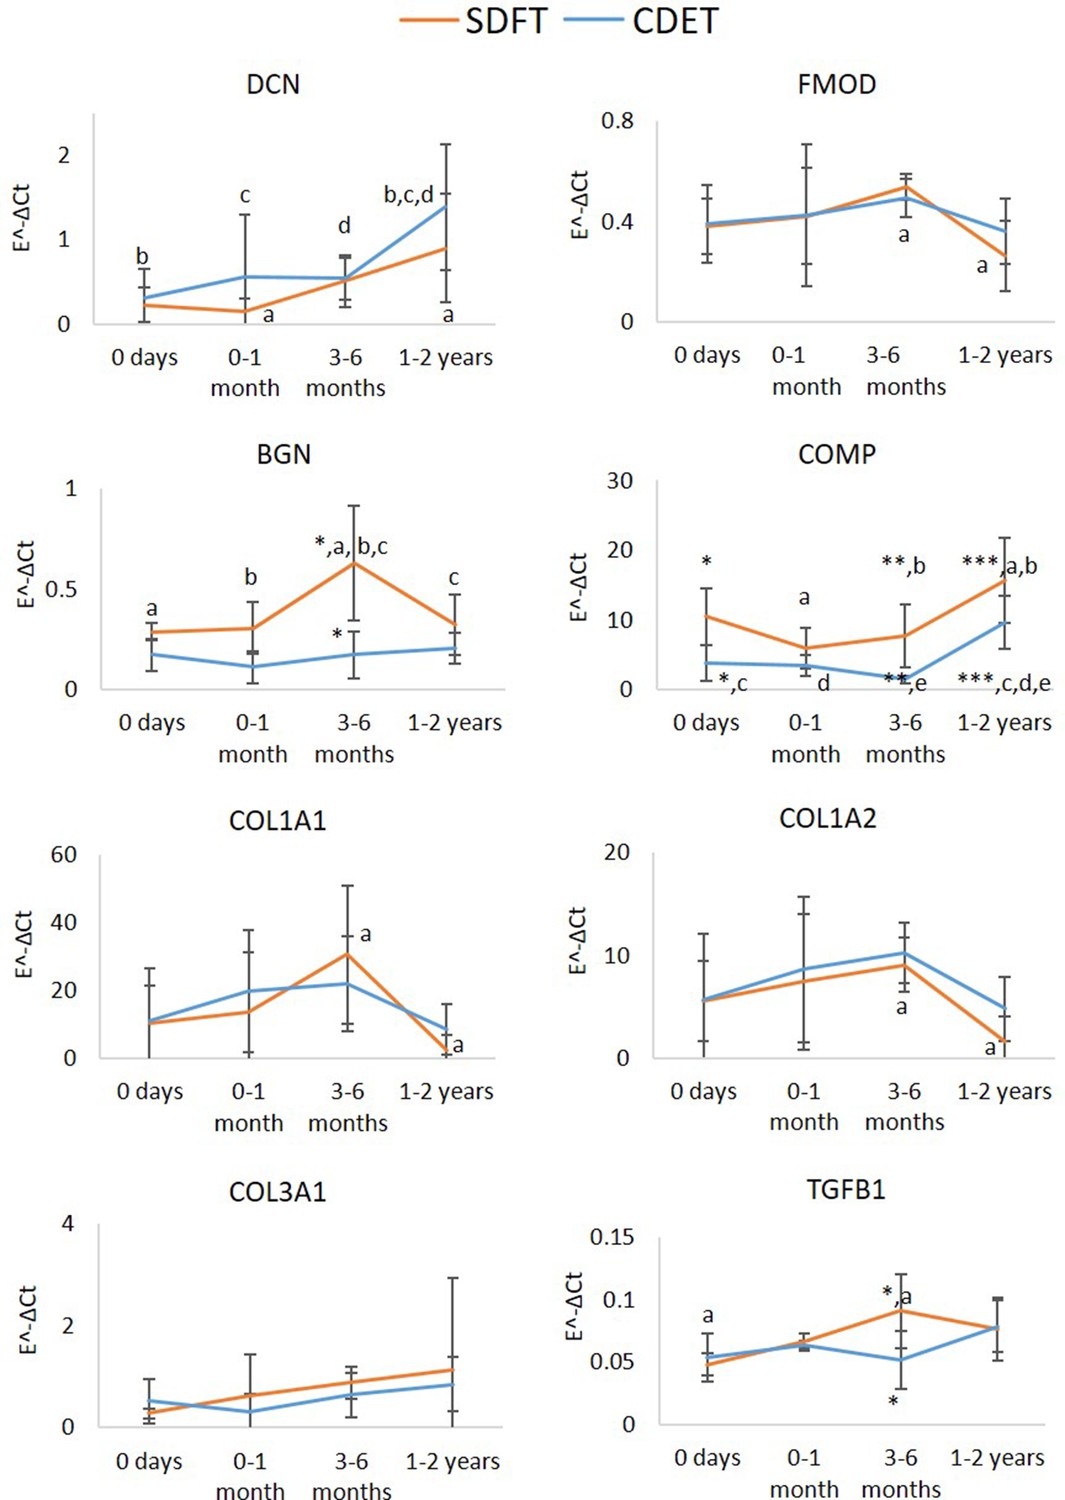
Relative mRNA expression of major ECM genes in whole tissue SDFT and CDET through postnatal development.
* Significant difference between tendons, a-e significant difference between age groups. Error bars depict standard deviation.
Figure 6
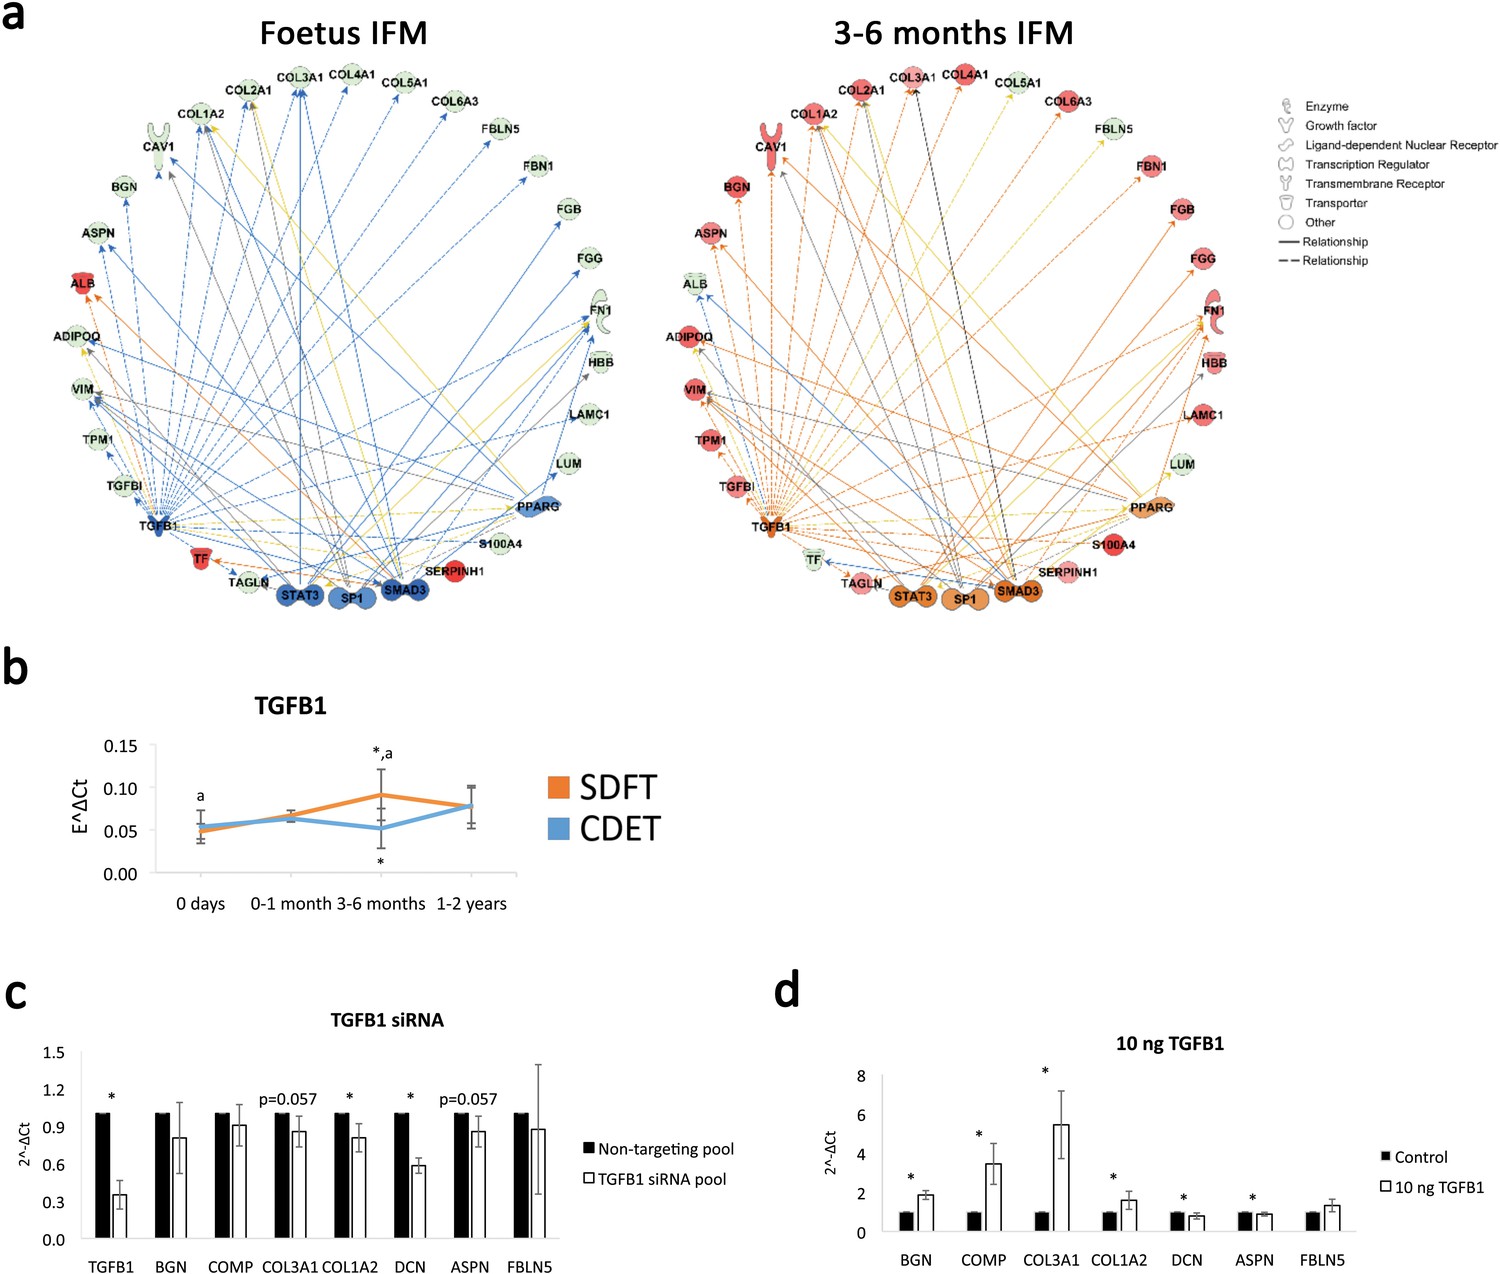
TGFB1 is predicted to be involved in compositional changes observed in the IFM.
(a) IPA networks for TGFB1 as an upstream regulator were generated for the foetus and 3–6 months SDFT IFM proteomic datasets. TGFB1 regulation in the IFM is predicted to be inhibited in the foetus and activated at 3–6 months in the SDFT. Red nodes, upregulated proteins, green nodes, downregulated proteins, intensity of colour is related to higher fold-change, orange nodes, predicted upregulated proteins in the dataset, blue nodes, predicted downregulated proteins. (b) Whole tendon relative mRNA expression for TGFB1 in the SDFT and CDET during postnatal development shows an increase in TGFB1 mRNA in the 3–6 months highly loaded SDFT only. * Significant difference between tendons, a significant difference between age groups. (c–d) Relative mRNA expression of major ECM genes predicted to be regulated by TGFB1 in the IPA network following TGB1 knockdown (c) and stimulation with 10 ng recombinant TGF-β1 (d) for 24 hr. BGN, DCN, COMP, COL1A2 and COL3A1 show regulation following TGFB1 knockdown or addition. * Significant difference between control and treatment. Error bars depict standard deviation.
Tables
Table 1
IFM differentially abundant matrisome and matrisome-associated proteins through development organised by highest mean condition (p<0.05, fold change ≥2).
Proteins are arranged into colour-coded divisions and categories. Bar graphs profile the relative abundance of each protein at each development stage, a foetus, b 0 days, c 0–1 month, d 3–6 months, e 1–2 years, with the development age reporting the highest mean protein level also specified.
| Protein | Division | Category | Highest mean cond. | a b c d e |
|---|---|---|---|---|
| SERPINH1 | Matrisome-associated | ECM Regulators | Foetus |  |
| COL14A1 | Core matrisome | Collagens | 0–1 month |  |
| ASPN | Core matrisome | Proteoglycans | 0–1 month |  |
| FMOD | Core matrisome | Proteoglycans | 0–1 month |  |
| KERA | Core matrisome | Proteoglycans | 0–1 month |  |
| FBLN5 | Core matrisome | ECM Glycoproteins | 0–1 month |  |
| FGB | Core matrisome | ECM Glycoproteins | 0–1 month |  |
| FGG | Core matrisome | ECM Glycoproteins | 0–1 month |  |
| COL1A2 | Core matrisome | Collagens | 3–6 months |  |
| COL2A1 | Core matrisome | Collagens | 3–6 months |  |
| COL4A1 | Core matrisome | Collagens | 3–6 months |  |
| COL4A2 | Core matrisome | Collagens | 3–6 months |  |
| COL6A3 | Core matrisome | Collagens | 3–6 months |  |
| BGN | Core matrisome | Proteoglycans | 3–6 months |  |
| HSPG2 | Core matrisome | Proteoglycans | 3–6 months |  |
| ADIPOQ | Core matrisome | ECM Glycoproteins | 3–6 months |  |
| FBN1 | Core matrisome | ECM Glycoproteins | 3–6 months |  |
| FN1 | Core matrisome | ECM Glycoproteins | 3–6 months |  |
| LAMB2 | Core matrisome | ECM Glycoproteins | 3–6 months |  |
| LAMC1 | Core matrisome | ECM Glycoproteins | 3–6 months |  |
| NID1 | Core matrisome | ECM Glycoproteins | 3–6 months |  |
| ANXA4 | Matrisome-associated | ECM-affiliated | 3–6 months |  |
| S100A4 | Matrisome-associated | Secreted Factors | 3–6 months |  |
| COL21A1 | Core matrisome | Collagens | 1–2 years |  |
| COL3A1 | Core matrisome | Collagens | 1–2 years |  |
| COL5A1 | Core matrisome | Collagens | 1–2 years |  |
| COL5A2 | Core matrisome | Collagens | 1–2 years |  |
| COL6A1 | Core matrisome | Collagens | 1–2 years |  |
| COL6A2 | Core matrisome | Collagens | 1–2 years |  |
| DCN | Core matrisome | Proteoglycans | 1–2 years |  |
| LUM | Core matrisome | Proteoglycans | 1–2 years |  |
| OGN | Core matrisome | Proteoglycans | 1–2 years |  |
| PRELP | Core matrisome | Proteoglycans | 1–2 years |  |
| COMP | Core matrisome | ECM Glycoproteins | 1–2 years |  |
| DPT | Core matrisome | ECM Glycoproteins | 1–2 years |  |
| TGFBI | Core matrisome | ECM Glycoproteins | 1–2 years |  |
-
Table 1—source data 1
IFM and fascicle matrisome proteins intensity.
- https://cdn.elifesciences.org/articles/58075/elife-58075-table1-data1-v2.xlsx
Table 2
Fascicle differentially abundant matrisome and matrisome-associated proteins through development organised by highest mean condition (p<0.05, fold change ≥2).
Proteins are arranged into colour-coded divisions and categories. Bar graphs on the right profile the relative abundance of each protein at each development stage, a foetus, b 0 days, c 0–1 month, d 3–6 months, e 1–2 years, with the development age reporting the highest mean protein level also specified.
| Protein | Division | Category | Highest mean cond. | A B C D e |
|---|---|---|---|---|
| COL11A1 | Core matrisome | Collagens | Foetus |  |
| DCN | Core matrisome | Proteoglycans | Foetus |  |
| FMOD | Core matrisome | Proteoglycans | Foetus |  |
| KERA | Core matrisome | Proteoglycans | Foetus |  |
| PCOLCE | Core matrisome | ECM Glycoproteins | Foetus |  |
| SERPINF1 | Matrisome-associated | ECM Regulators | Foetus |  |
| ANXA1 | Matrisome-associated | ECM-affiliated Proteins | Foetus |  |
| ANXA2 | Matrisome-associated | ECM-affiliated Proteins | Foetus |  |
| ANXA5 | Matrisome-associated | ECM-affiliated Proteins | Foetus |  |
| LGALS1 | Matrisome-associated | ECM-affiliated Proteins | Foetus |  |
| COL12A1 | Core matrisome | Collagens | 0 days |  |
| COL3A1 | Core matrisome | Collagens | 1–2 years |  |
| PRELP | Core matrisome | Proteoglycans | 1–2 years |  |
| COMP | Core matrisome | ECM Glycoproteins | 1–2 years |  |
| FN1 | Core matrisome | ECM Glycoproteins | 1–2 years |  |
Key resources table
| Reagent type (species) or resource | Designation | Source or reference | Identifiers | Additional information |
|---|---|---|---|---|
| Biological sample (Equus caballus) | Superficial digital flexor tendon and common digital extensor tendon | Equine practices and commercial abattoir | Foetus-2 years old | |
| Biological sample (Equus caballus) | Primary superficial digital flexor tendon tenocytes | Commercial abattoir | P3 from adult specimens | |
| Antibody | Anti-decorin (mouse IgG) | Other | (1:1500), Prof. Caterson, Cardiff University, UK | |
| Antibody | Anti-proteoglycan 4 (mouse IgG) | Other | (1:200), Prof. Caterson, Cardiff University, UK | |
| Antibody | Anti-fibromodulin (rabbit IgG) | Other | (1:400), Prof. Roughley, McGill University, Canada | |
| Antibody | Anti-tenascin C (mouse IgG) | Santa Cruz Biotechnology | RRID:AB_785991 | (1:250) |
| Antibody | Anti-elastin (mouse IgG) | Abcam | RRID:AB_2099589 | (1:250) |
| Antibody | Zytochem Plus HRP polymer anti-mouse | Zytomed systems | RRID:AB_2868565 | (75 µL) |
| Antibody | Zytochem Plus HRP polymer anti-rabbit | Zytomed systems | RRID:AB_2868566 | (75 µL) |
| Sequenced-based reagent | Equus caballus TGFB1 Accell SMARTpool | Dharmacon, Horizon Discovery | https://horizondiscovery.com/en/products/tools/Custom-SMARTpool | (1 µM) |
| Sequenced-based reagent | Equus caballus Accell Non-targeting siRNA | Dharmacon, Horizon Discovery | https://horizondiscovery.com/en/products/tools/Custom-SMARTpool | (1 µM) |
| Peptide, recombinant protein | Recombinant Human TGF-β1 | Peprotech | 100–21 | (10 ng/mL) |
| Commercial assay or kit | FASTIN Elastin Assay | Biocolor | https://www.biocolor.co.uk/product/fastin-elastin-assay/ | |
| Chemical compound, drug | RapiGest SF | Waters | https://www.waters.com/waters/en_GB/RapiGest-SF-Surfactant/ | (0.1% w/v) |
| Software, algorithm | HistoQuest Analysis Software | Tissuegnostics | RRID:SCR_014823 | |
| Software, algorithm | Adobe Photoshop CS3 | Adobe | RRID:SCR_014199 | |
| Software, algorithm | Peaks Studio v8.5 | Bioinformatics Solutions | www.bioinfor.com/peaks-studio | |
| Software, algorithm | Ingenuity Pathway Analysis | Qiagen | RRID:SCR_008653 | |
| Software, algorithm | Matrisome | PMID:2197732 | http://matrisomeproject.mit.edu | |
| Software, algorithm | Mascot | Matrix Science | RRID:SCR_014322 | |
| Software, algorithm | Neopeptide Analyser | PMID:28503667 | https://github.com/PGB-LIV/neo-pep-tool/releases/ | |
| Software, algorithm | SigmaPlot | Systat Software Inc | RRID:SCR_003210 | |
| Software, algorithm | GProX | PMID:21602510 | RRID:SCR_000273 | |
| Other | Chondroitinase ABC from Proteus vulgaris | Merck | C2509 | (0.2 U/mL) |
| Other | Hyaluronidase from bovine testes | Merck | H3506 | (4800 U/mL) |
Additional files
-
Supplementary file 1
Histologic variables used in the H and E scoring of the SDFT and CDET sections and the analysis method and reporting criteria adopted.
- https://cdn.elifesciences.org/articles/58075/elife-58075-supp1-v2.docx
-
Supplementary file 2
Gene primer sequences used in relative mRNA expression analysis.
- https://cdn.elifesciences.org/articles/58075/elife-58075-supp2-v2.docx
-
Supplementary file 3
Samples used for analysis along with statistical test used for analysis.
- https://cdn.elifesciences.org/articles/58075/elife-58075-supp3-v2.docx
-
Supplementary file 4
Collagens and proteoglycans identified in SDFT IFM and fascicle.
- https://cdn.elifesciences.org/articles/58075/elife-58075-supp4-v2.docx
-
Supplementary file 5
Correlation analysis of IFM protein abundance and mechanical properties across development.
- https://cdn.elifesciences.org/articles/58075/elife-58075-supp5-v2.docx
-
Supplementary file 6
Correlation analysis of TGFB1 whole tendon mRNA expression and IFM protein abundance across development.
- https://cdn.elifesciences.org/articles/58075/elife-58075-supp6-v2.docx
-
Transparent reporting form
- https://cdn.elifesciences.org/articles/58075/elife-58075-transrepform-v2.pdf
Download links
A two-part list of links to download the article, or parts of the article, in various formats.
Downloads (link to download the article as PDF)
Open citations (links to open the citations from this article in various online reference manager services)
Cite this article (links to download the citations from this article in formats compatible with various reference manager tools)
Postnatal mechanical loading drives adaptation of tissues primarily through modulation of the non-collagenous matrix
eLife 9:e58075.
https://doi.org/10.7554/eLife.58075


