Diffusion-MRI-based regional cortical microstructure at birth for predicting neurodevelopmental outcomes of 2-year-olds
- Radiology Research, Children’s Hospital of Philadelphia, United States
- Department of Radiology, Perelman School of Medicine, University of Pennsylvania, United States
- Department of Pediatrics, University of Texas Southwestern Medical Center, United States
Figures
Figure 1 with 5 supplements
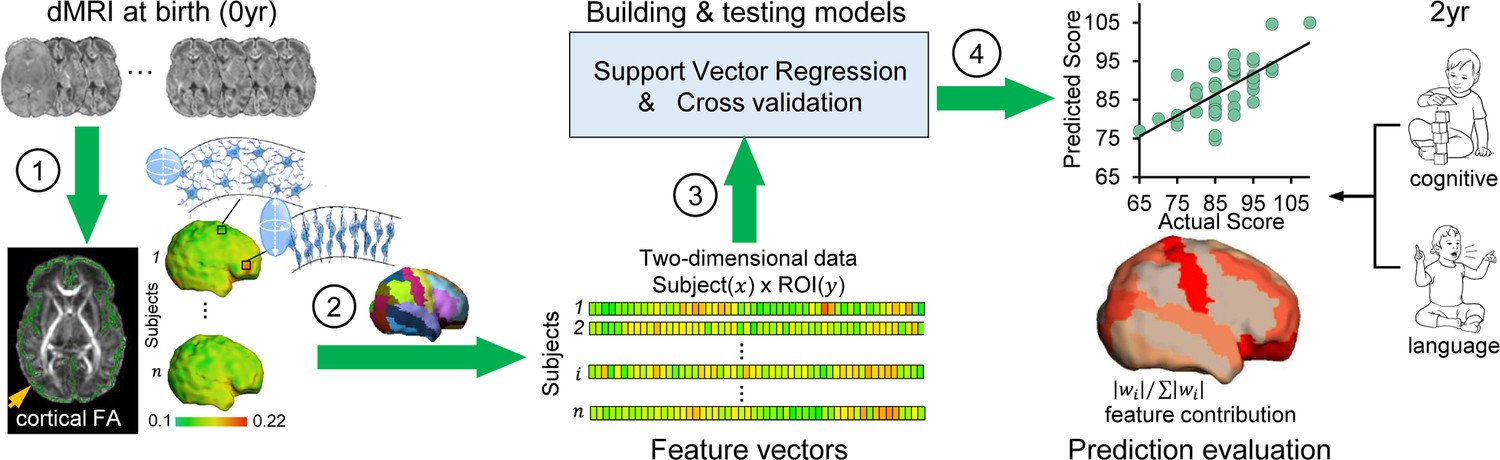
Workflow of predicting neurodevelopmental outcomes at 2 years based on cortical microstructural architecture at birth.
Cortical microstructure at birth (0 year) quantified with cortical fractional anisotropy (FA) measures from diffusion magnetic resonance imaging (dMRI) was used to predict cognitive and language abilities assessed with Bayley-III Scales at 2 years of age (2 year). The prediction workflow includes the following steps: (1) Cortical microstructure was measured at the ‘core’ of cortical mantle, shown as green skeleton overlaid on a FA map and projected on a neonate cortical surface, to alleviate the partial volume effects. Schematic depiction of dendritic arborization and synaptic formation underlying cortical FA decreases during cortical microstructural maturation is shown. (2) Feature vectors were obtained by measuring cortical skeleton FA at parcellated cortical gyri with the gyral labeling transformed from a neonate atlas. Each parcellated cortical gyrus is a region-of-interest (ROI). (3) Prediction models were established and tested with support vector regression (SVR) and cross-validation. Feature vectors from all subjects were concatenated to obtain the input data of prediction models. (4) Prediction model accuracy was evaluated by correlation between predicted and actual scores. Feature contributions from different gyri in the model were quantified by normalized feature contribution weights which were projected back on a cortical surface for visualization.
Figure 1—figure supplement 1

Cortical fractional anisotropy (FA) distribution across parcellated cortical gyri in the left hemisphere from 46 infants who also went through neurodevelopmental assessments with Bayley-III at their 2 years of age.
Color bar on the upper left corner encodes the cortical FA values. The dashed lines demonstrate the boundaries among the parcellated cortical gyri.
Figure 1—figure supplement 2
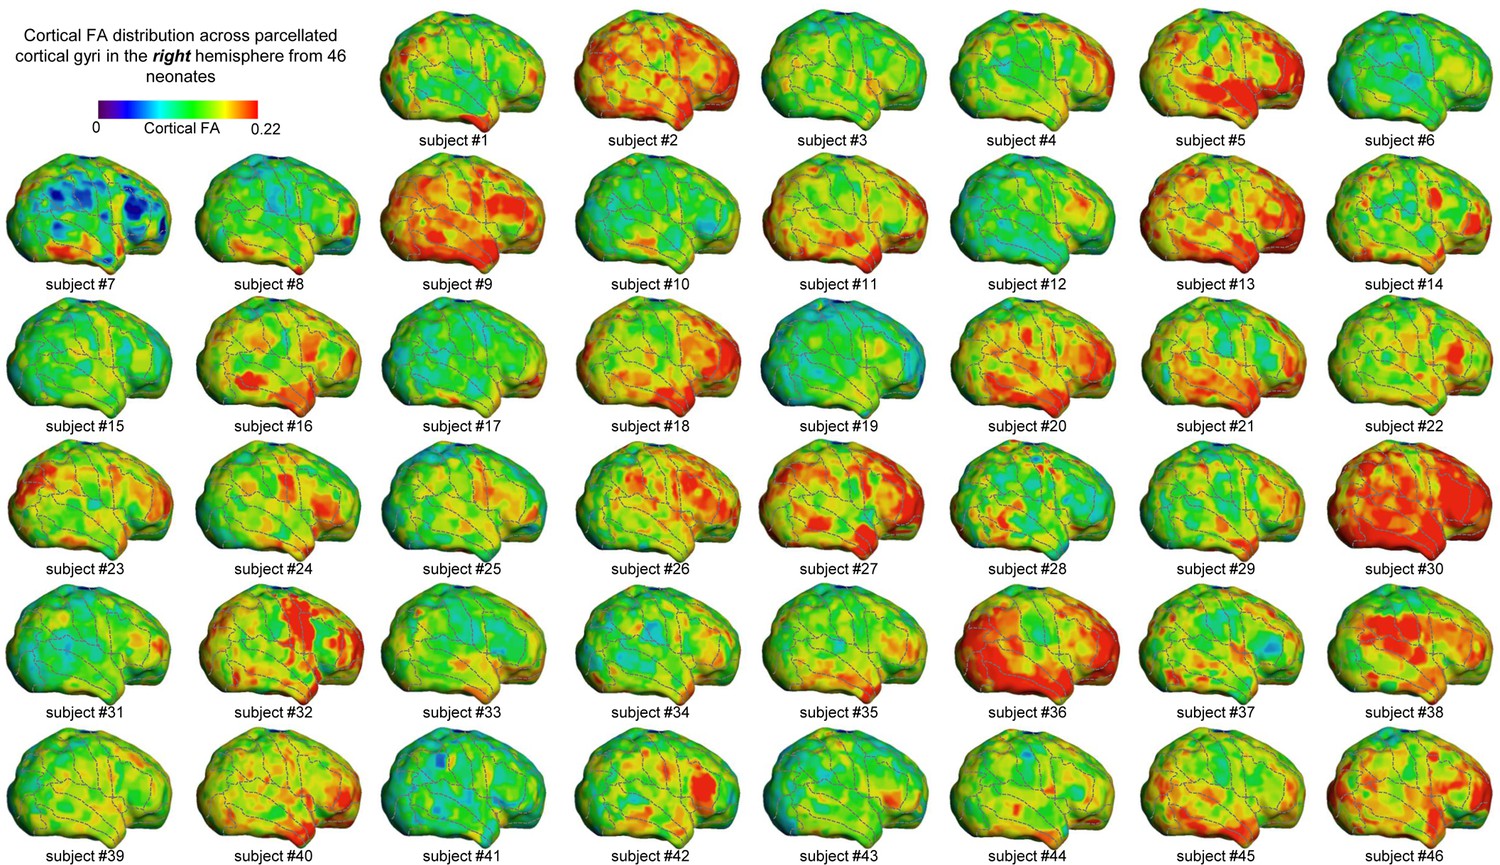
Cortical fractional anisotropy (FA) distribution across parcellated cortical gyri in the right hemisphere from 46 infants who also went through neurodevelopmental assessments with Bayley-III at their 2 years of age.
Color bar on the upper left corner encodes the cortical FA values. The dashed lines demonstrate the boundaries among the parcellated cortical gyri.
Figure 1—figure supplement 3
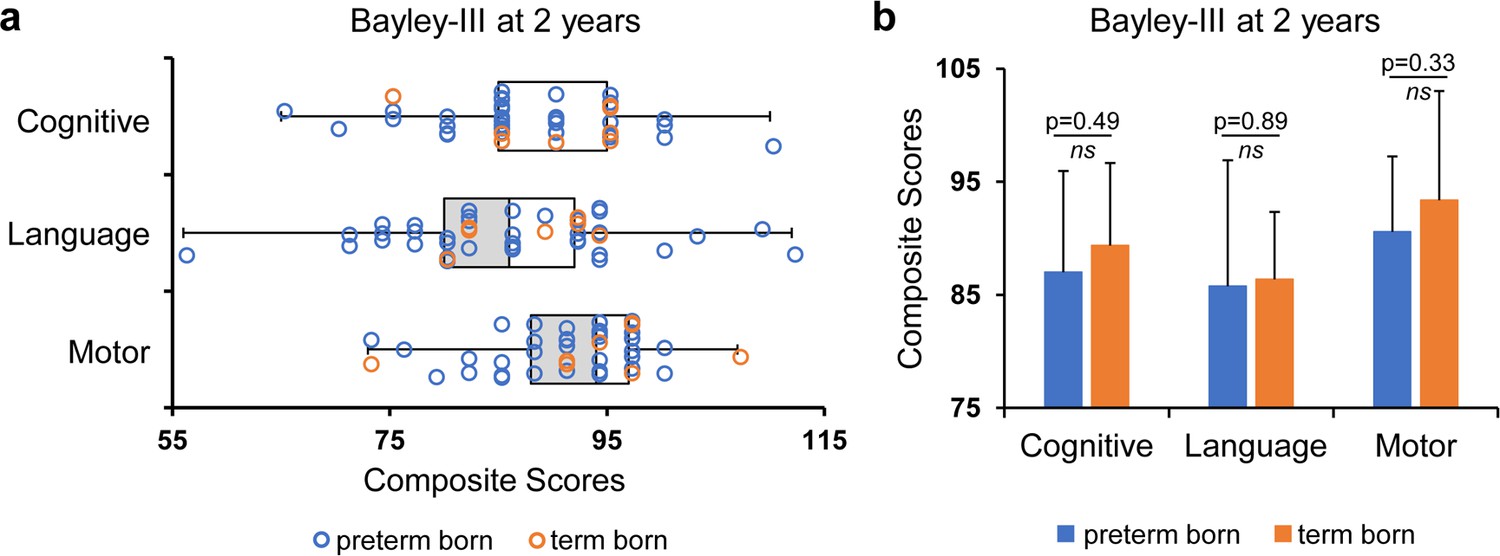
Bayley-III scores of the studied population.
(a) Distribution of the Bayley-III cognitive, language, and motor composite scores of the studied population. (b) No significant differences in any of Bayley-III composite scores between preterm and term born infants.
Figure 1—figure supplement 4
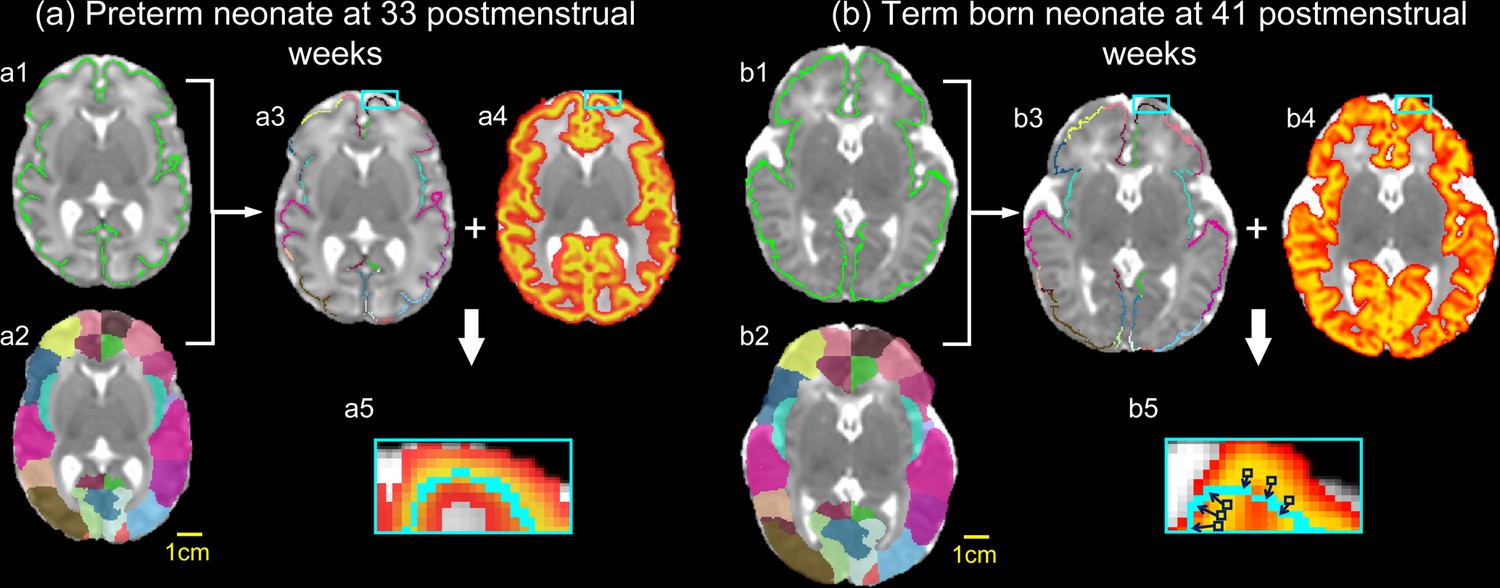
The workflow to parcellate the cortical skeleton and measure the fractional anisotropy (FA) values at the parcellated cortical skeleton from a representative preterm (33 postmenstrual weeks, PMW).
(a) and term (41 PMW) (b) born neonate. a1, b1: Green cortical skeleton overlaid on the mean diffusivity map of a 33 PMW (a1) and 41 PMW (b1) neonate brain; a2, b2: The gyral labels with different colors denoting different gyri labels transferred from a neonate atlas (Feng et al., 2019); a3, b3: The labeled cortical skeleton; a4, b4: The cortical tissue probability map; a5, b5: Enlarged map showing alignment of the cortical skeleton (cyan line) and center of cortical mantle. In the places where misalignments occur in b5, measurement of FA at the cortical skeleton (cyan line) was projected from closest voxels with maximum gray matter probability (dark black boxes). The same scale bars at the bottom demonstrate relatively bigger size of the term-born brain at 41 PMW. It is clear from panels (a) and (b) that despite brain size differences, partial volume effects for cortical FA measurements are similar for the preterm and term born brain.
Figure 1—figure supplement 5
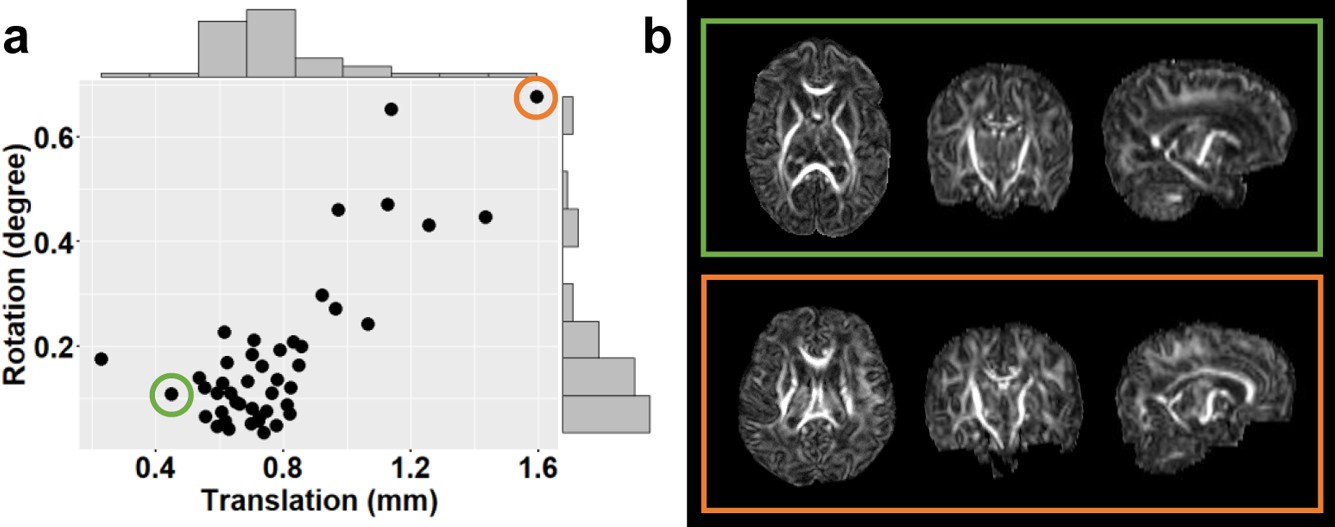
Overall small motion in diffuson magnetic resonance imaging scans of the studied population.
(a) Scatter plot and histogram of rotation and translation measurements of diffusion magnetic resonance imaging scans from the 46 neonates who had a neurodevelopmental assessment at 2 years of age. (b) Axial, coronal, Axial, coronal, and sagittal views of the fractional anisotropy (FA) maps from two representative neonates with relatively small (upper panel) and large (lower panel) motion among the cohort, corresponding to the two dots with green and orange circle in panel a, respectively. FA maps of both neonates demonstrate high signal-to-noise-ratio and good contrasts.
Figure 2 with 2 supplements
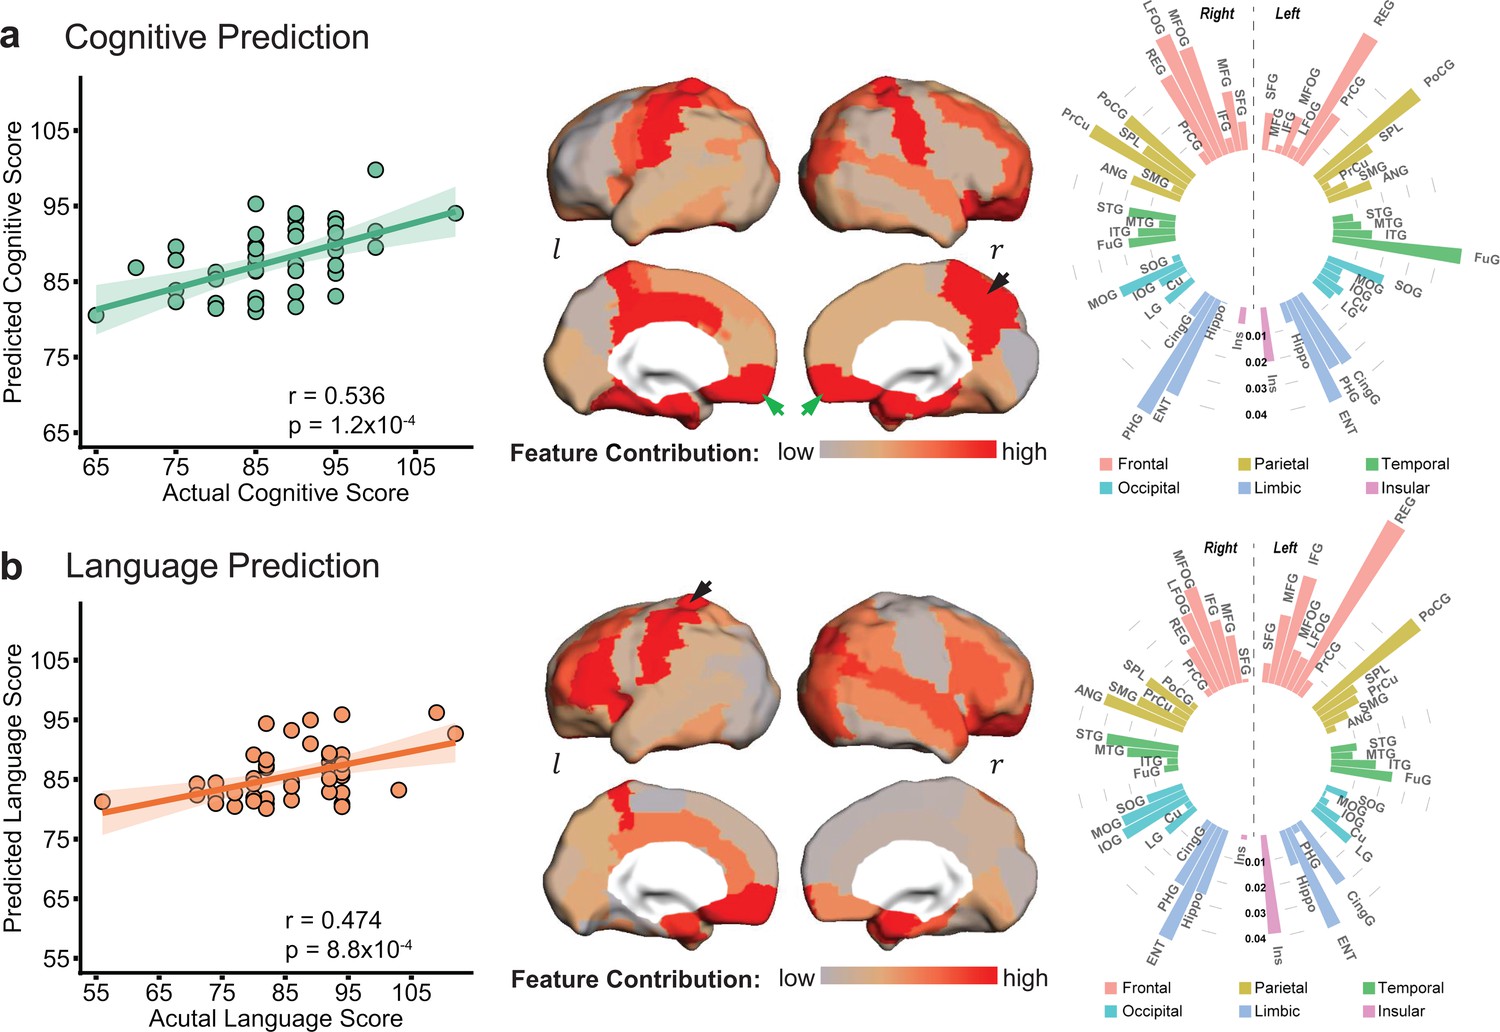
Cortical microstructural measures from neonate diffusion magnetic resonance imaging predict cognitive (a) and language (b) scores at 2 years of age with different feature contribution weights from various cortical gyri.
Left panels: The scatter plots show significant correlation between actual scores and cognitive (r = 0.536, p=1.2 × 10⁻⁴) or language (r = 0.474, p=8.8 × 10⁻⁴) scores predicted based on cortical fractional anisotropy measures. Each dot represents one subject and linear regression was used to assess predictive accuracy of the model. The width of the line denotes the 95% confidence interval around the linear model fit between predicted and observed scores. Center panels: Normalized feature contribution weights of all cortical gyri in the prediction models are projected on a cortical surface. Right panels: Normalized feature contribution weights from all cortical gyri are demonstrated in the circular bar. These gyri were grouped into frontal, parietal, temporal, occipital, limbic, and insular cortex. Abbreviations: : right hemisphere; : left hemisphere. See Supplementary file 3 for abbreviations of cortical regions and values of normalized feature contribution weights from all cortical gyri.
Figure 2—figure supplement 1
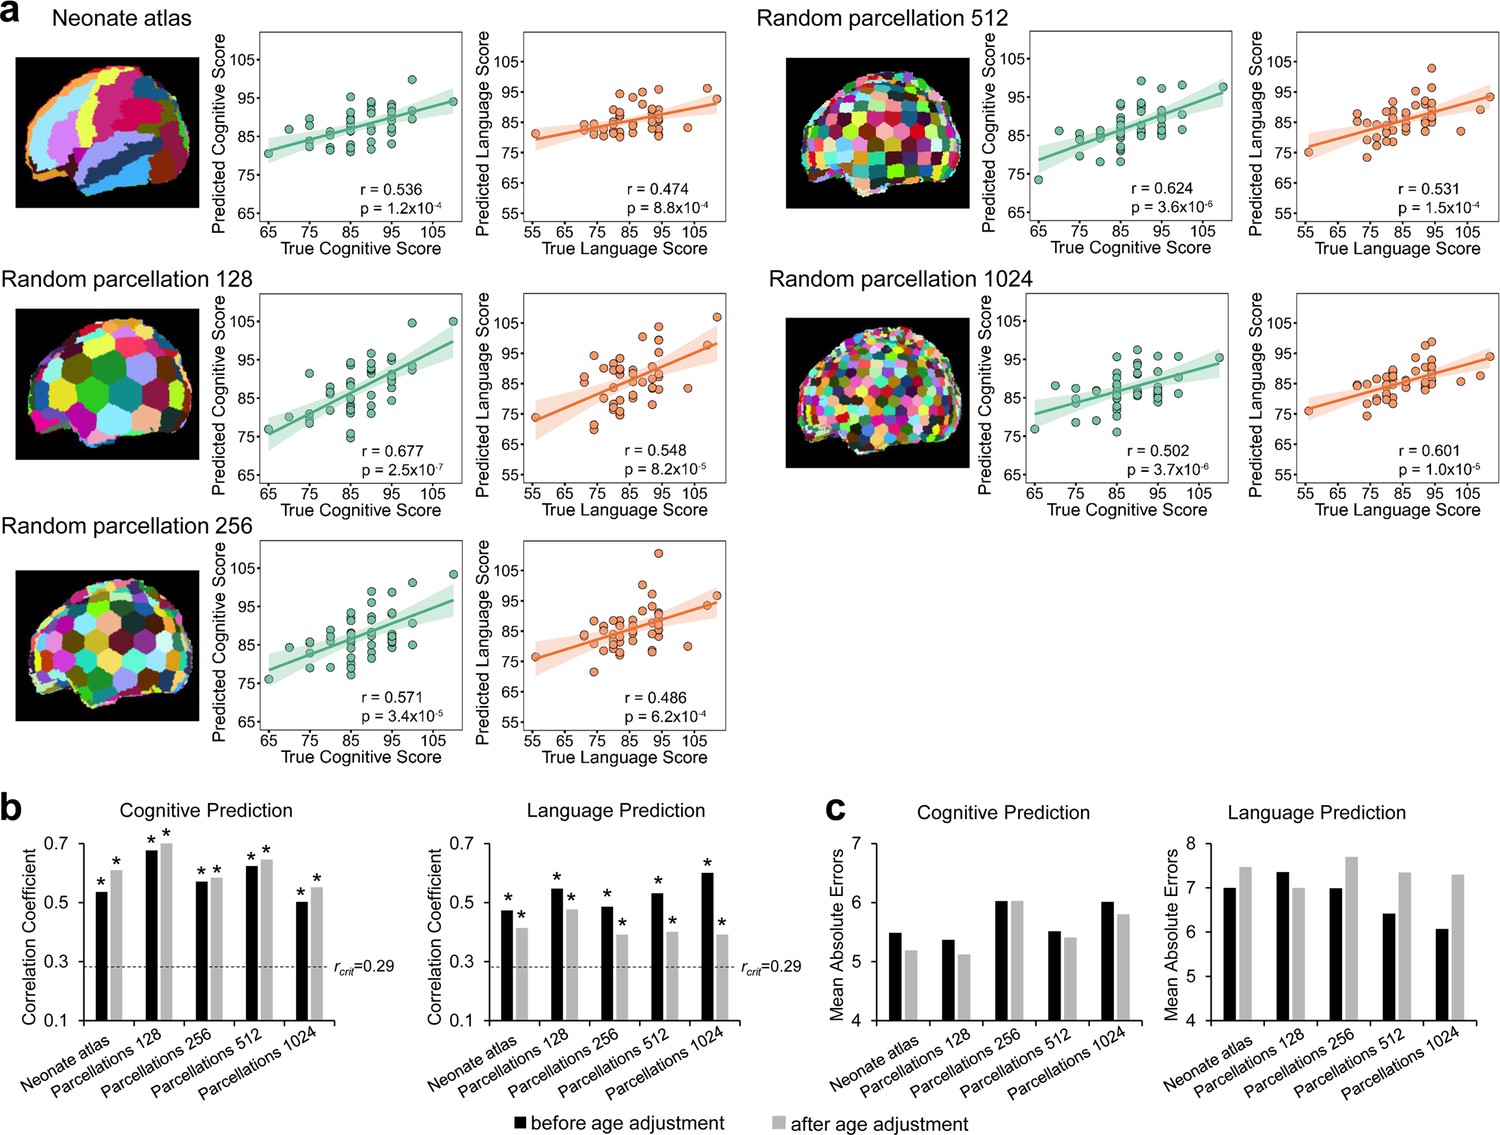
Evaluation of robustness of prediction models with different cortical region-of-interest (ROI) schemes and age adjustments.
(a) Various cortical ROI schemes, including 52 cortical regions from the neonate atlas labeling, 128, 256, 512, and 1024 randomly parcellated cortical regions with equal size, were tested by using cortical fractional anisotropy (FA) measured at these ROIs as features in prediction models. The scatter plots show the linear regressions between actual scores and the predicted cognitive or language scores based on the cortical FA measures obtained with various ROI schemes. (b) Significant correlations between the predicted and actual cognitive and language scores were found for all ROI schemes before age adjustment and all ROI schemes after age adjustments. Dashed lines indicate critical r value corresponding to p=0.05. * in the panel indicates significant (p<0.05) correlation. (c) Mean absolute error with all ROI schemes and age adjustment are shown.
Figure 2—figure supplement 2
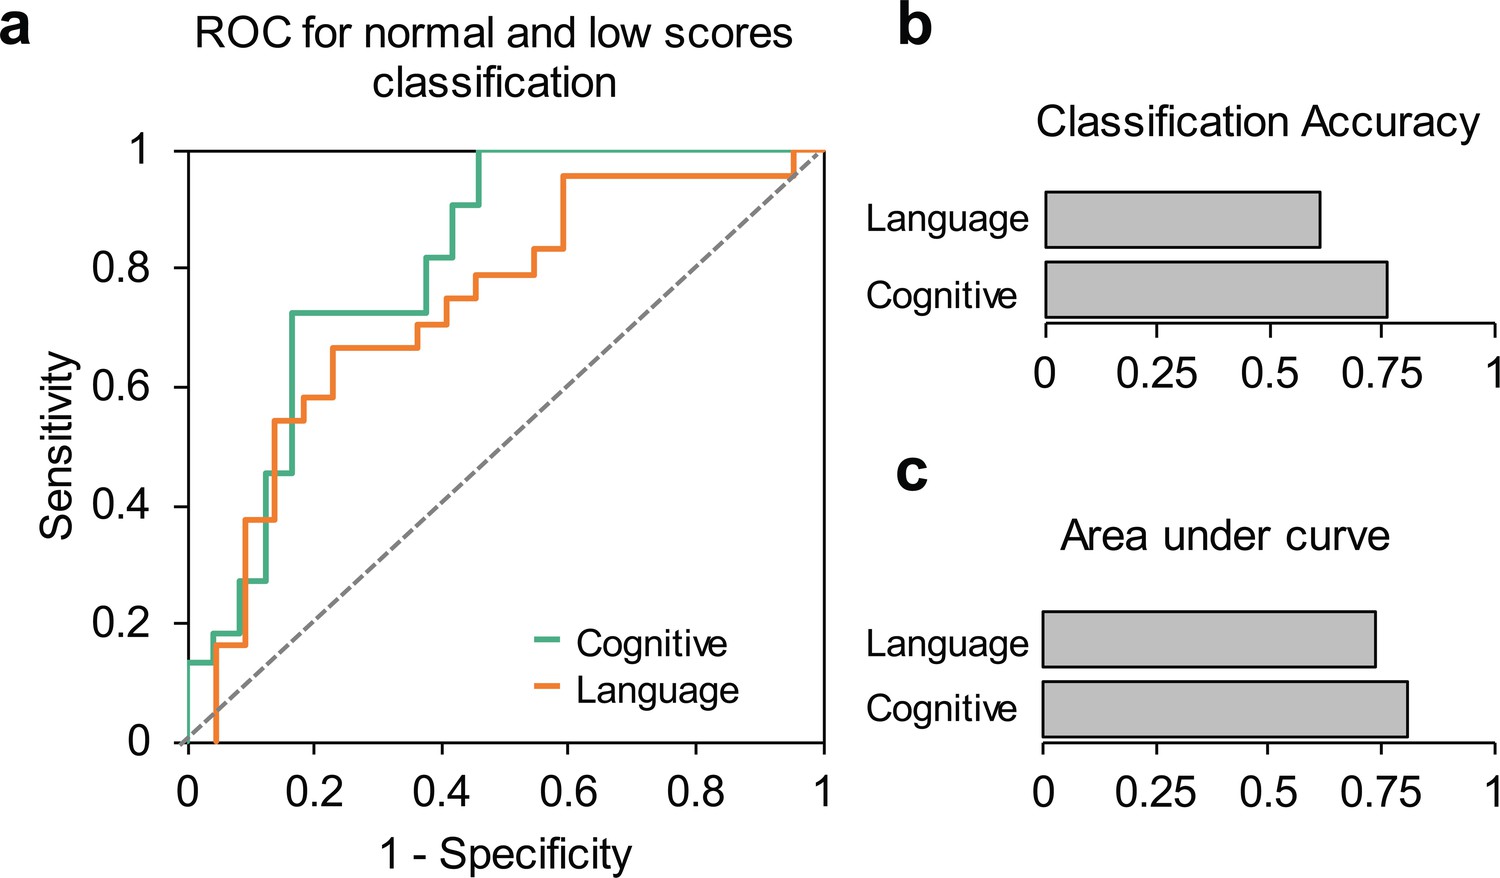
Evaluation of the prediction models.
(a) The receiver-operating-characteristic (ROC) plots show specificity and sensitivity with cortical microstructural measures used as features to classify normal (>85) versus low (≤85) cognitive or language scores. (b and c) show accuracy and area under ROC curve for language and cognitive classification model.
Figure 3 with 1 supplement
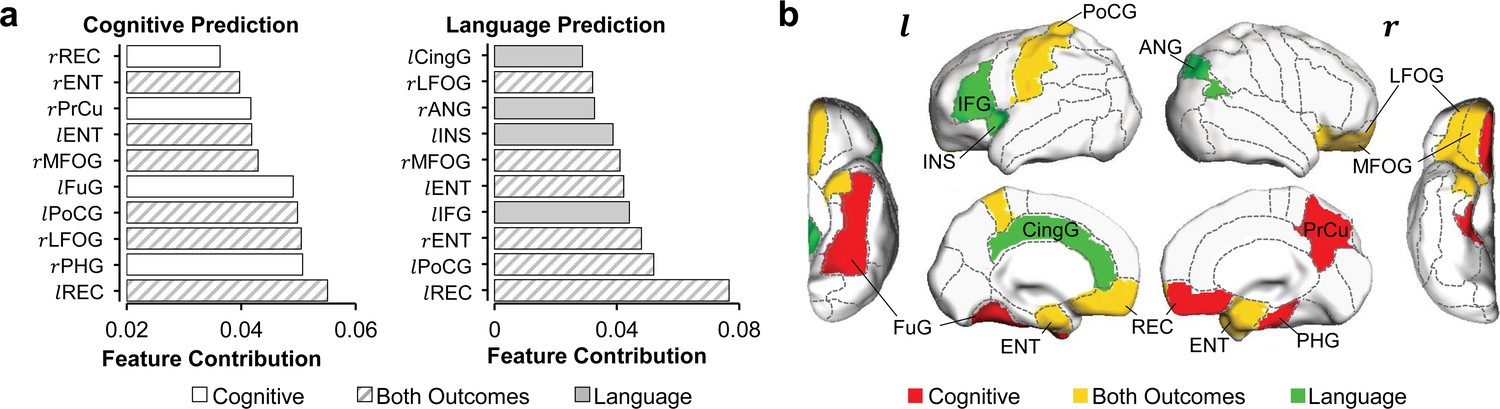
Distinguishable top 10 cortical regions where microstructural measures contributed most to the prediction of cognitive or language scores.
(a) List of top 10 cortical regions with highest feature contribution weights in predicting cognitive (left) or language (right) scores. (b) Maps of cortical regions listed in (a). Cortical regions contributing most to predicting both cognition and language are painted in yellow (rMFOG, rLFOG, lREC, lPoCG, rENT, and lENT); Cortical regions contributing most to predicting uniquely cognition and language are painted in red (rREC, rPrCu, lFuG, and rPHG) and in green (lIFG, lCingG, rANG, and lINS), respectively. Abbreviations: : right hemisphere; : left hemisphere; ANG: angular gyrus; CingG: cingular gyrus; ENT: entorhinal gyrus; FuG: fusiform gyrus; IFG: inferior frontal gyrus; INS: insular cortex; LFOG: lateral fronto-orbital gyrus; MFOG: middle fronto-orbital gyrus; PHG: parahippocampal gyrus; PoCG: postcentral gyrus; PrCu: precuneus gyrus; REC: rectus gyrus.
Figure 3—figure supplement 1
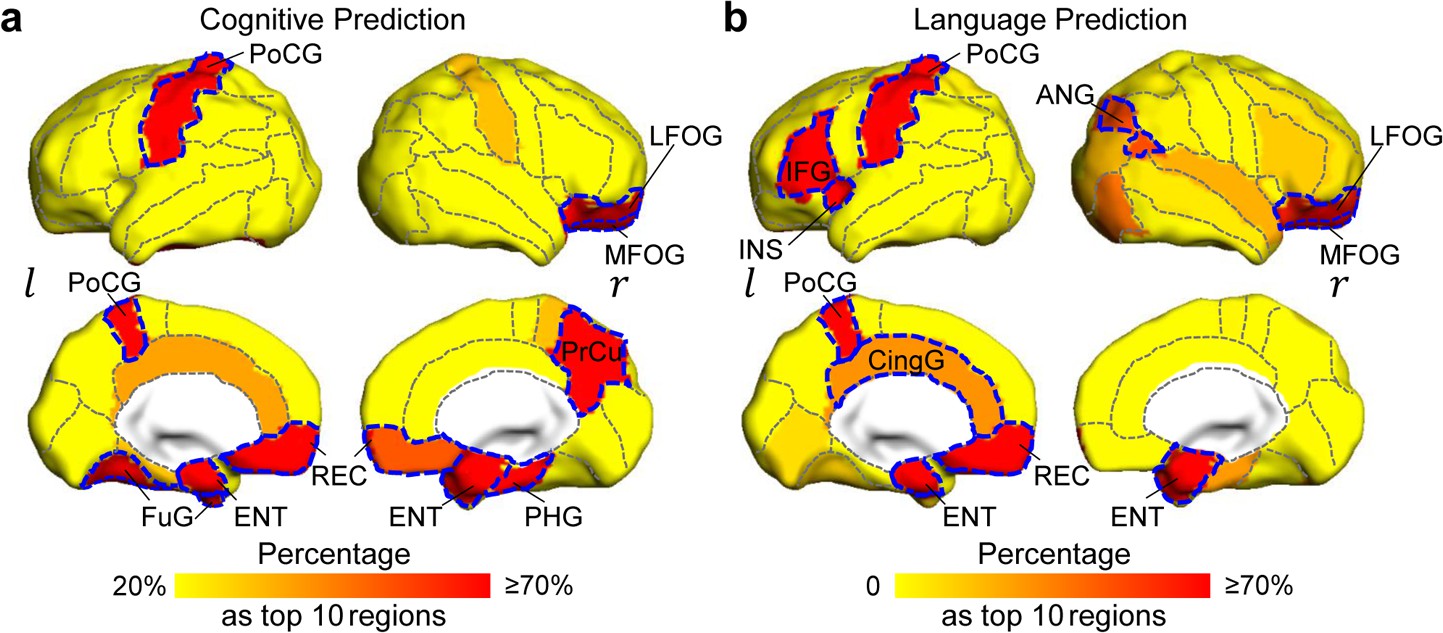
Percentage maps for evaluating reproducibility of top 10 cortical regions with highest feature contribution to predicting cognition (a) and language (b) outcomes from bootstrap analysis.
Regions with high percentage (highlighted by red and brown) are consistent with the top 10 cortical regions (from Figure 3, highlighted by dashed blue contour), demonstrating high regional reproducibility for contributing to predicting a specific (cognitive or language) outcome.
Figure 4 with 1 supplement
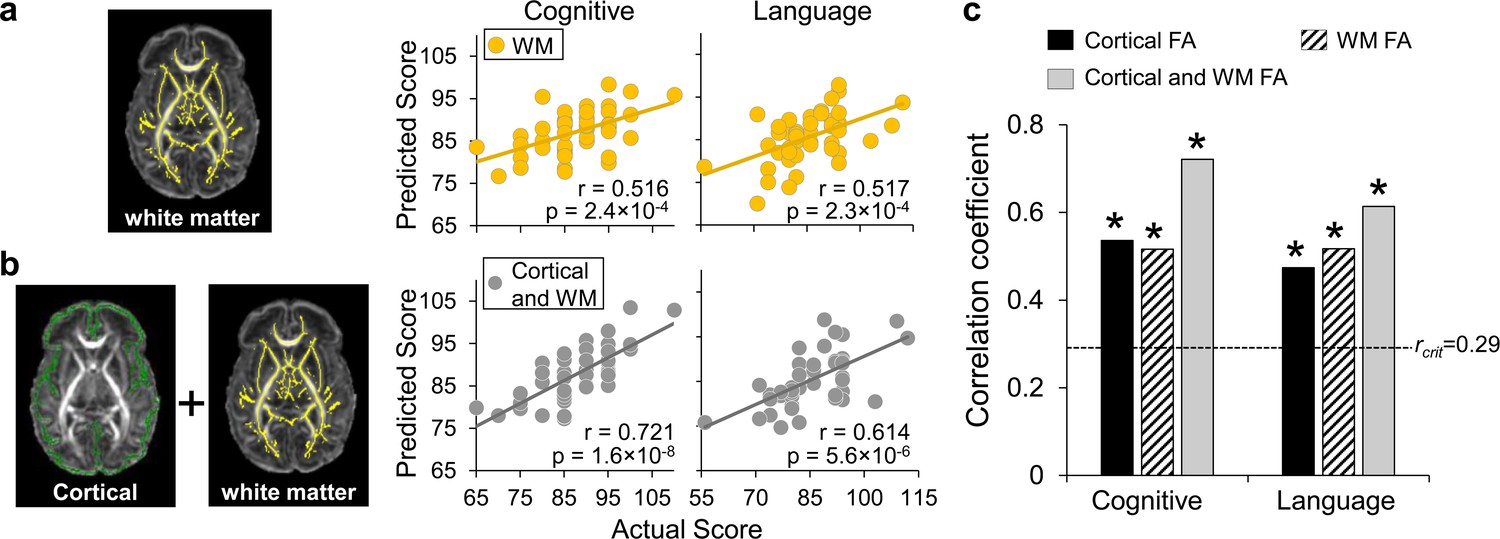
Prediction of neurodevelopmental outcomes using (a) white matter (WM) fractional anisotropy (FA) features only and (b) combined cortical and WM FA features, compared with prediction using cortical FA features.
(a) On the left panel, WM microstructure was measured at the core WM regions, shown as yellow skeleton overlaid on a FA map of a neonate brain, to alleviate the partial volume effects. Feature vectors were obtained by measuring WM skeleton FA at 40 tracts transformed from WM labeling of a neonate atlas. On the right panel, scatter plots show linear regressions between actual scores and the predicted cognitive or language scores based on WM FA measures with LOOCV. (b) On the left panel, feature vectors were obtained by combining cortical skeleton (green) FA at 52 parcellated cortical gyri and WM skeleton (yellow) FA at 40 tracts with the labeling transformed from a neonate atlas. On the right panel, scatter plots show linear regressions between actual scores and the predicted cognitive or language scores based on both cortical and WM FA measures with LOOCV. (c) Significant correlation between the predicted and actual cognitive or language outcomes was found based on cortical FA only, WM FA only, and combined cortical and WM FA feature vectors. Dashed line indicates critical r value corresponding to p=0.05. * in the panel indicates significant (p<0.05) correlation.
Figure 4—figure supplement 1
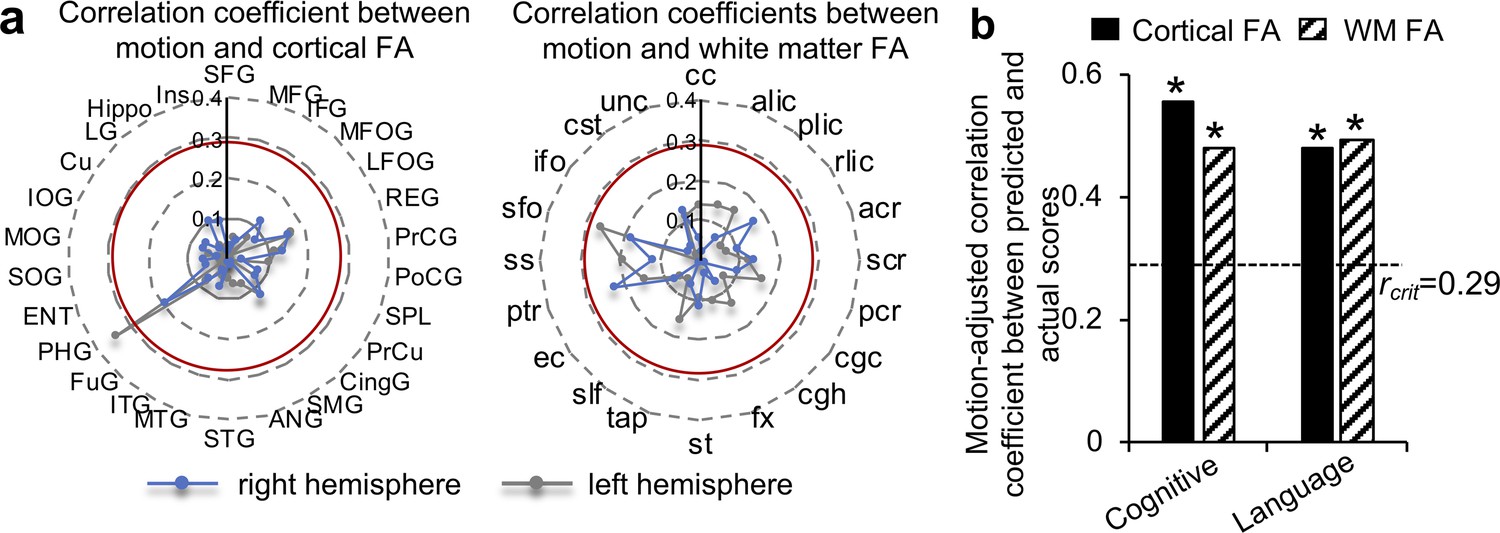
Comprehensive motion-related analyses collectively demonstrate that motion did not confound the significant prediction found in this study.
(a) No significant correlation between head motion estimates (quantified by mean framewise displacement) and fractional anisotropy (FA) values of any of 92 parcellated brain regions was found after false discovery rate (FDR) correction. 92 brain regions included 52 cortical and 40 white matter (WM) regions used in present study and were parcellated based on a neonate atlas (Feng et al., 2019). Radar charts show the correlation coefficients between motion estimates and regional FA values from cortical (left panel) and WM (right panel) regions from both hemispheres. Red circles in radar charts indicate critical r value corresponding to p=0.05 before FDR correction. Before FDR correction, significant correlation was only found for the left PHG (parahippocampal gyrus) (p=0.02, before correction). After correction of multiple tests, significant correlation for the left PHG no longer existed. Abbreviations of parcellated cerebral cortical regions (Feng et al., 2019) can be found in Supplementary file 3. Abbreviations of parcellated WM regions are as follows: cc: corpus callosum; alic: anterior limb of internal capsule; plic: posterior limb of internal capsule; rlic: retrolenticular part of internal capsule; acr: anterior corona radiata; scr: superior corona radiata; pcr: posterior corona radiata; cgc. cingulum cingulate gyrus part; cgh: cingulum hippocampal part; fx: fornix; st: stria terminalis; tap: tapetum; slf: superior longitudinal fasciculus; ec: external capsule; ptr: posterior thalamic radiata; ss: sagittal stratum; sfo: superior fronto-occipital fasciculus; ifo: inferior fronto-occipital fasciculus; cst: corticospinal tract; unc: uncinate fasciculus. (b) Correlations between the predicted and actual cognitive or language outcomes remained significant after adjustments of motion estimates in regional cortical and WM FA feature vectors used for prediction model. Dashed line indicates critical r value corresponding to p=0.05. * indicates significant (p<0.05) correlation.
Author response image 1
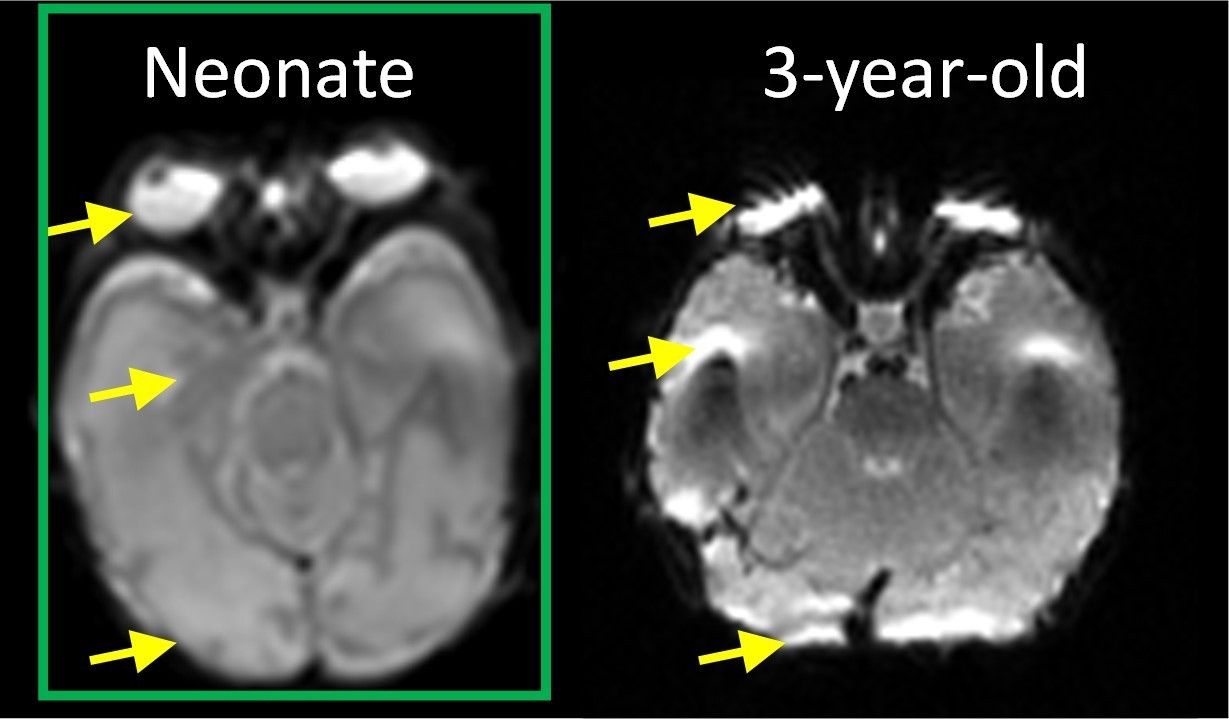
The axial b0 image of a representative neonate (left) and 3-year-old (right) brain scanned with same dMRI imaging protocol.
Tables
Author response table 1
Mean correlation coefficient and the corresponding p values between predicted and actual scores in the 3-fold cross validation.
* in the table indicates significant (p<0.05) correlation.
| Features in prediction | Cognitive | Language | ||
|---|---|---|---|---|
| r | p | r | p | |
| Cortical FA | 0.508 | 0.053 | 0.479 | 0.071 |
| White matter (WM) FA | 0.491 | 0.063 | 0.459 | 0.085 |
| Combined cortical and WM FA | 0.635 | 0.01 * | 0.592 | 0.02 * |
Additional files
-
Supplementary file 1
Demographics of participating subjects who went through MRI scans at birth and was assessed with Bayley tests at their 2 years of age.
aC for C-section and V for vaginal birth; bB for breast-feeding and F for formula; wks: postmenstrual weeks.
- https://cdn.elifesciences.org/articles/58116/elife-58116-supp1-v1.docx
-
Supplementary file 2
Mean and standard deviation of the composite scores from the 2 years.
Bayley-III neurodevelopmental assessments of the 46 infants as well as r and p-values of the correlation between one of the composite scores and a specific age (birth age, scan age, or Bayley-III assessment age) in both preterm and term born infant groups.
- https://cdn.elifesciences.org/articles/58116/elife-58116-supp2-v1.docx
-
Supplementary file 3
Normalized feature contribution weights of cortical fractional anisotropy measures from each gyrus in cognitive and language prediction models.
The top 10 highest weights in each model are marked in bold.
- https://cdn.elifesciences.org/articles/58116/elife-58116-supp3-v1.docx
-
Transparent reporting form
- https://cdn.elifesciences.org/articles/58116/elife-58116-transrepform-v1.docx
Download links
A two-part list of links to download the article, or parts of the article, in various formats.
Downloads (link to download the article as PDF)
Open citations (links to open the citations from this article in various online reference manager services)
Cite this article (links to download the citations from this article in formats compatible with various reference manager tools)
Diffusion-MRI-based regional cortical microstructure at birth for predicting neurodevelopmental outcomes of 2-year-olds
eLife 9:e58116.
https://doi.org/10.7554/eLife.58116


